PACC Offshore Services Holdings Ltd. - listed...
29
1 PACC Offshore Services Holdings Ltd. Results Presentation Q2 & 1H FY15 Results
Transcript of PACC Offshore Services Holdings Ltd. - listed...

1
PACC Offshore Services Holdings Ltd.
Results PresentationQ2 & 1H FY15 Results

2
Agenda
1. Financial Highlights
2. Capex plan & fleet program
3. Updates
4. Q & A

3
Key Highlights
Push into Offshore Accommodation segment beginning to reveal long-termpotential
POSH Xanadu - 750-pax semi-submersible accommodationvessel (“SSAV”)
– Achieved exceptional uptimeoperational performance in Brazilsince charter commencement
– Maiden full-quarter contribution inQ2 FY15

4
Key Highlights
Push into Offshore Accommodation segment beginning to reveal long-termpotential
238-pax light construction vessel(“LCV”)
– Maiden full-quarter contribution inQ2 FY15 for POSH Enduranceoperating in South East Asia
– POSH Endeavour commencedmaiden long-term charter aroundend-Q2 FY15 in the Middle East

5
Key Highlights
Sustained strong financial position
• Net Debt/Equity of 46%
• Robust financial management to weather market and industry volatility
• Ability to rapidly capitalise on organic and inorganic opportunities ahead

FINANCIAL HIGHLIGHTS

7
Group Financial Highlights
SUMMARY
US$‘000 Q2 FY15 Q2 FY14 Change 1H FY15 1H FY14 Change
Revenue 71,022 58,270 22% 128,607 111,198 16%
Gross profit 14,466 17,555 -18% 22,460 33,374 -33%
Other operatingincome
1,927 6,629 -71% 5,257 42,446 -88%
Share of JVresults
3,304 300 1001% 1,984 (2,896) NM
Net profit aftertax
6,110 11,870 -49% 6,131 48,547 -87%
EBITDA 22,267 23,664 -6% 37,624 73,212 -49%
N.M. denotes “Not Meaningful”

8
Group Financial Highlights – Q2 FY15
71.0
58.3
Q2 FY15 Q2 FY14
14.517.6
Q2 FY15 Q2 FY14
6.1
11.9
Q2 FY15 Q2 FY14
22.323.7
Q2 FY15 Q2 FY14
Gross Revenue (US$’M) Gross Profit (US$’M) NPAT (US$’M) EBITDA (US$’M)
YoY +$13M (+22%) YoY -$3.1M (-18%) YoY -$5.8M(-49%) YoY -$1.4M(-5.9%)
Higher revenue mainly due to new OA contribution from POSH Xanadu (SSAV) and POSH Endurance (LCV)offset by lower performance from the other divisions.
Lower NPAT mainly due to lower gain from sale of vessel and lower interest income from repayment of loanby JVs.

9
Group Financial Highlights – 1H FY15
128.6
111.2
1H FY15 1H FY14
22.5
33.4
1H FY15 1H FY14
6.1
48.5
1H FY15 1H FY14
37.6
73.2
1H FY15 1H FY14
YoY +$17M (+16%) YoY -$11M (-33%) YoY -$42M (-87%) YoY -$36M (-49%)
Higher revenue mainly due to new OA contribution.
Lower NPAT mainly due to absence of US$35M gain on sale of vessels in FY14.
Gross Revenue (US$’M) Gross Profit (US$’M) NPAT (US$’M) EBITDA (US$’M)

10
-2
30
5
28
-5
0
5
10
15
20
25
30
35
Q2 FY15 Q2 FY14 1H FY15 1H FY14
%
Gross Profit Margin
-0.7
9.9
3.2
17.4
-2.0
0.0
2.0
4.0
6.0
8.0
10.0
12.0
14.0
16.0
18.0
20.0
Q2 FY15 Q2 FY14 1H FY15 1H FY14
US$ mil
Gross Profit
31.5 33.2
64.3 62.1
0.0
10.0
20.0
30.0
40.0
50.0
60.0
70.0
Q2 FY15 Q2 FY14 1H FY15 1H FY14
US$ mil
Revenue
Financial Highlights - OSV
Stable revenue YoY supported by anenlarged OSV fleet.
The new contribution offset challengingcharter rates facing sector.
Lower gross profit mainly due to lowercharter and utilisation rates, opex andrepair costs.
YoY: -5% YoY: 4% YoY: -82%
11
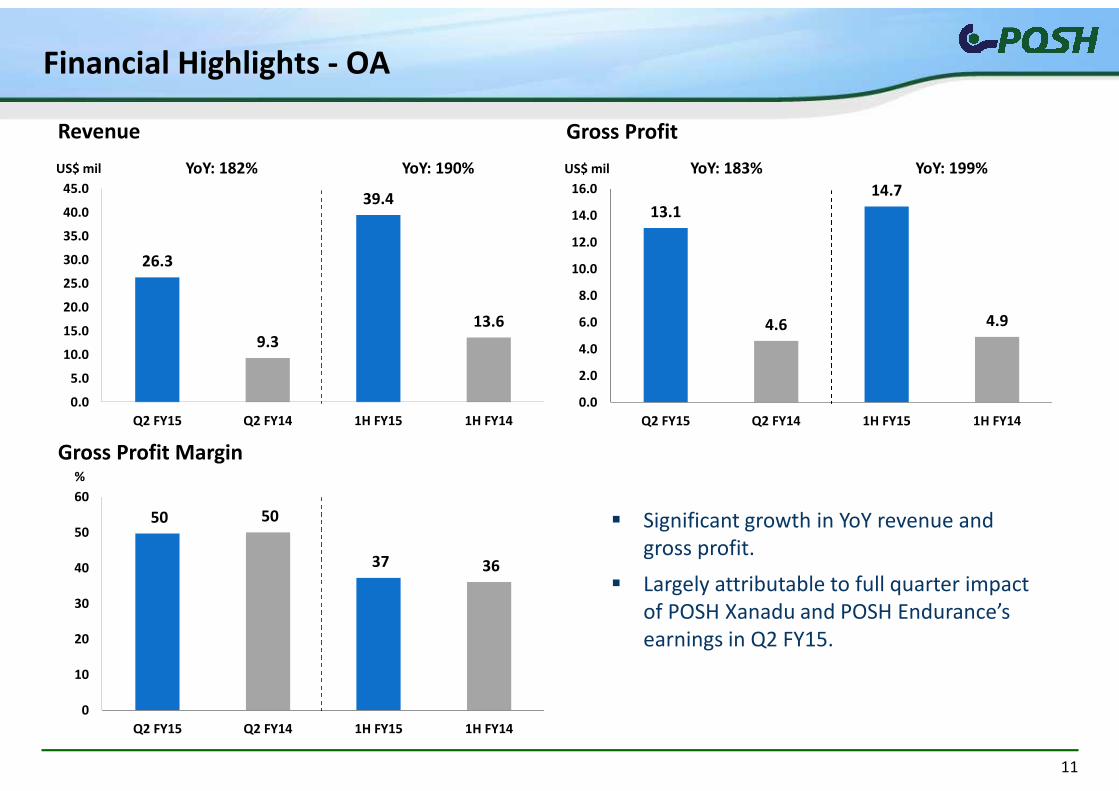
26.3
9.3
39.4
13.6
0.0
5.0
10.0
15.0
20.0
25.0
30.0
35.0
40.0
45.0
Q2 FY15 Q2 FY14 1H FY15 1H FY14
US$ mil
Revenue
50 50
37 36
0
10
20
30
40
50
60
Q2 FY15 Q2 FY14 1H FY15 1H FY14
%
Gross Profit Margin
13.1
4.6
14.7
4.9
0.0
2.0
4.0
6.0
8.0
10.0
12.0
14.0
16.0
Q2 FY15 Q2 FY14 1H FY15 1H FY14
US$ mil
Gross Profit
Financial Highlights - OA
YoY: 182% YoY: 190% YoY: 183% YoY: 199%
Significant growth in YoY revenue andgross profit.
Largely attributable to full quarter impactof POSH Xanadu and POSH Endurance’searnings in Q2 FY15.

12
1.72.7
3.2
9.3
0.0
2.0
4.0
6.0
8.0
10.0
Q2 FY15 Q2 FY14 1H FY15 1H FY14
US$ mil
Gross Profit
2125 23
38
0
5
10
15
20
25
30
35
40
Q2 FY15 Q2 FY14 1H FY15 1H FY14
%
Gross Profit Margin
Financial Highlights – T&I
Lower revenue primarily due tochallenging market conditions.
Segment faced lower charter rates despiteimproving utilisation YoY.
YoY Gross Profit decreased as a result oflower charter rate and absence of onetime gain on prepaid charters.
YoY: -65%
8.111.0
14.1
24.5
0.0
5.0
10.0
15.0
20.0
25.0
30.0
Q2 FY15 Q2 FY14 1H FY15 1H FY14
US$ mil
Revenue
YoY: -27% YoY: -42% YoY: -38%

13
0.40.3
1.4
1.8
-
0.2
0.4
0.6
0.8
1.0
1.2
1.4
1.6
1.8
2.0
Q2 FY15 Q2 FY14 1H FY15 1H FY14
US$ mil
Gross Profit
5.1 4.7
10.8 11.0
-
2.0
4.0
6.0
8.0
10.0
12.0
Q2 FY15 Q2 FY14 1H FY15 1H FY14
US$ mil
Revenue
8
6
13
17
-
2
4
6
8
10
12
14
16
18
Q2 FY15 Q2 FY14 1H FY15 1H FY14
%
Gross Profit Margin
Financial Highlights – HSER
Delivery and deployment of 4 harbor tugscontributed to increased revenue.
Lower Gross Profit due to absence ofsalvage jobs.
YoY: -25%YoY: 9% YoY: -2% YoY: 65%
14
Gross Profit
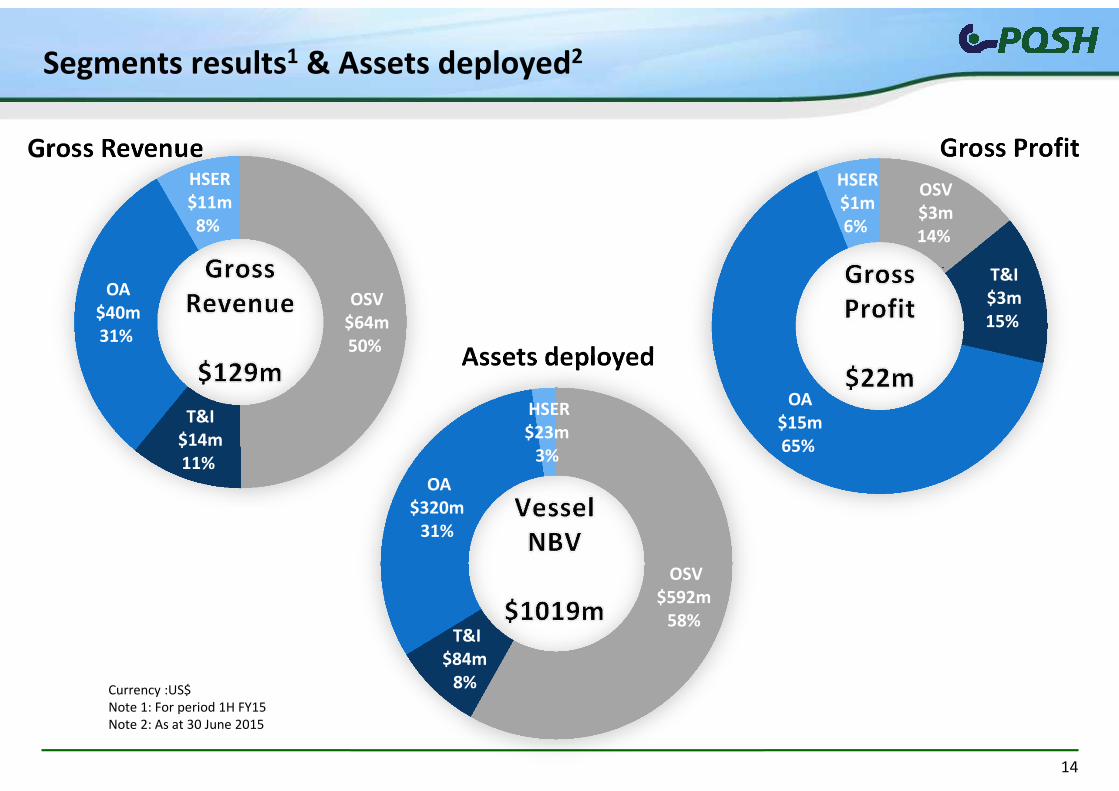
Assets deployed
Gross Revenue
OSV$64m50%
T&I$14m11%
OA$40m31%
HSER$11m8%
OSV$3m14%
T&I$3m15%
OA$15m65%
HSER$1m6%
OSV$592m
58%T&I
$84m8%
OA$320m
31%
HSER$23m
3%
Segments results1 & Assets deployed2
Currency :US$Note 1: For period 1H FY15Note 2: As at 30 June 2015

15
Capital Structure
US$‘000 30 June 2015 31 Dec 2014
Net Debt 551,951 548,332
Equity 1,199,802 1,213,764
Net Debt /Equity 46% 45%
The Company has available undrawn bank lines of approx. US$358 million
Strong financial position provides ability to capture opportunities

16
CAPEX Plan
Currently in Fleet
Wholly Owned JVs Under Construction/Order
Number of vessels 77 39 15
Net book value1 US$1,019m - -
CAPEX commitment - -US$257m
paid1
US$185moutstanding
Note 1: As of 30 June 2015Note 2: See Appendix for details
As at 30 June 2015, the Group has 15 vessels under construction/order with expecteddelivery by mid 2017.
The Group is constantly monitoring its capex plan and has deferred certain plannednewbuildings
The Group is taking delivery of 4 vessels2 in 2H FY15 with remaining paymentsapproximating US$53m

17
Fleet Program
Current Fleet New Vessels UnderConstruction/CommittedTypes of Vessels Wholly Owned Owned by JVs
AHTS 12 4 1
PSV 12 1 2
IMR - - 2
AHT 10 9 2
Towing Tugs 7 1 -
Barges 16 4 -
SSAV 1 - 1
Accommodation Vessels 5 1 2
Harbour Tugs 9 17 4
Crane Barge 2 2 1
Utility Workboats 3 - -
Total as at to-date 77 39 15
Young fleet of customised new builds to meet customers’needs Focus on high-capacity and high-specification offshore accommodation vessels Entry into Inspection, Maintenance and Repair (IMR) segment with construction of IMR vessels

BUSINESS UPDATES

19
Industry Outlook
Oil price has not stabilised
Volatility will continue to have unfavourable impact on charter rates and utilization
40
45
50
55
60
65
70
Jan-2015 Feb-2015 Mar-2015 Apr-2015 May-2015 Jun-2015 Jul-2015
Brent Spot Price (Dollars per Barrel)
?
Source: EIA.gov

20
Business Strategy
Accelerating market penetration and build share in key markets such as the Middle East
Begun executing plans to deploy human capital and resources to support growth
Maintain strategic presence in Mexico with limited operations, targeting selectedopportunities
Exploring more chartering opportunities in frontier markets

21
Business Prospects
POSH Enterprise, the 3rd LCV to join the Offshore Accommodation fleet, would commenceits maiden long-term charter in the Middle East in 2H FY15
The Group remains positive on the potential of the second SSAV, “POSH Arcadia”, which isscheduled for delivery by the end of the year
The sister SSAV, “POSH Xanadu”, has recorded 100% uptime operational performance inBrazil demonstrating high serviceability to prospective charterers
(POSH Arcadia is currently in the final phase of construction)(Newly built POSH Enterprise leaving the shipyard in July 2015)
QUESTIONS & ANSWERS

23
Appendix

24
Overview of Business Segments
Offshore SupplyVessels (OSV)
Transportation andInstallation (T&I)
Harbour Services andEmergency Response (HSER)
Description
AHTS and PSV: Mid todeepwater oilfield operationsin exploration, development,construction and productionphases
AHT: Ocean towage of FPSOsand large offshore structures;shallow-water pipelay andconstruction works
Barge: Transportation,floatovers and launching ofplatform jackets
Harbour Services: Supportharbour towage operators andprovide heavy lift services toshipyards
Emergency Response: Salvage,wreck removal, rescue and oil-spill response operationsglobally
Fleet
Operates 31 vessels (JV: 5)including:
• 8,000 – 16,000 BHP AHTS• 2,200 – 4,100 DWT PSVs
Youngest deepwater andmidwater AHTS/PSV fleetsglobally
Average vessel age of 3.8 years
Operates 45 vessels (JV: 14)including:
• 12,000 – 16,300 BHP AHTs• 4,000 – 8,000 BHP AHTs• Barges, including
submersible barges andlaunch barge
• Average vessel age of 7.8years
Operates 33 vessels (JV: 19)including:
• 3,200 – 5,000 BHP AzimuthStern Drive (ASD) harbourtugs
• Heavy lift crane barges withsafe working load capacitiesof 60 - 1,500 tonnes
• Average vessel age of 9.6years
TypicalContract Type
Mix of short and long-termcharters and spot contracts
Short-term charters or lump-sum project contracts
MPA license to provide porttowage services in Singapore
Retainer agreements foremergency response services
OffshoreAccommodation (OA)
Offshore accommodation,workshop and storagefacilities: Offshoreconstruction and maintenanceoperations
Operates 7 vessels (JV: 1) withtotal capacity of 2,112 persons
Capacity expected to increaseto 3,100 persons by end 2015
Average vessel age of 7.2 years
Long-term contracts

25
Diverse Fleet Operating Across O&G Value Chain
Anchor Handling Tug Supplyvessels (AHTS)Tow and position drilling rigs
Platform Supply Vessels (PSV)Transport materials andsupplies
Accommodation Vessels (AV)Provides accommodation, lifting,catering, workshop, storage andheli-deck facilities.
Emergency ResponseProvides equipment andpersonnel for salvage, rescueand oil spill responseoperations
Anchor Handling Tugs (AHT)Provides towage andconstruction support services
BargesTransport large marine structuresfor floatover operations andlaunch of platform jackets
Harbour TugsDeployed in harbourtowage
Crane BargesFor heavy lift services
Exploration &Appraisal
FieldDevelopment
Operation &Maintenance
Decommissioning
Downstream

26
Vessels to be delivered – 2015 onward
ExpectedDelivery Date
No. of Newbuilds Size
Q3 2016 Q3 2016
2 ASD Harbour Tugs 5,000 BHP 5,000 BHP
Q3 2015 1 DP2 AV 238-person
Q4 2015 1 DP3 SSAV 750-person
Q3 2015 1 DP2 AHTS 8,000 BHP
Tug
OA
AV
SSAV
OSV
AHTS
Q2 2016 Q2 2016
2 DP2 PSV 70 MPSV
POSH
HSER
Q4 2016 Q1 2017 2 DP2 IMR vessels 89 M
Q2 2016 1 LCV 88 M
As at 30 June 2015, we have a total of 15 newbuilds contracted for delivery

27
Vessels to be delivered – 2015 onward (cont’d)
ExpectedDelivery Date
No. of Newbuilds Size
Q1 2016 Q2 2016
2 AHT 6,600 BHPT & I
Floating CraneBarge Q4 2015 1 Floating Crane Barge 500T Sheerleg
AHT
ExpectedDelivery Date
No. of Newbuilds SizeJV
POSH
Tug Q2 2016 2 ASD Harbour Tugs 3,600 BHP

28
Disclaimer
The information contained in this presentation is for information purposes only, and does not constitute or form part of any offer or invitation to sell or the solicitation of an offer or invitation to purchase orsubscribe for, or any offer to underwrite or otherwise acquire any securities of PACC Offshore Services Holdings Ltd. (the “Company”) or any other securities, nor shall any part of this presentation or thefact of its distribution or communication form the basis of, or be relied on in connection with, any contract, commitment or investment decision in relation thereto in Singapore or any other jurisdiction. Noreliance may be placed for any purpose whatsoever on the information set forth in this presentation or on its completeness. This presentation has been prepared solely for information used by theCompany for presentation purposes and may not be reproduced or redistributed to any other person.
The information (“Confidential Information”) contained in this presentation does not contain all relevant information relating to the Company or its securities, particularly with respect to the risks andspecial considerations involved with an investment in the securities of the Company. No part of this document shall form the basis of or be relied upon in connection with any contract or commitmentwhatsoever. This presentation is strictly confidential and has been prepared by the Company to you solely for your reference. The Confidential Information is subject to change without notice, itsaccuracy is not guaranteed and it may not contain all material information concerning the Company. The information contained in this presentation has not been independently verified. Norepresentation, warranty or undertaking, express or implied, is made as to, and no reliance should be placed on, the fairness, accuracy, completeness or correctness of the information or the opinionscontained herein. Neither the Company nor any of their respective directors makes any representation or warranty (express or implied) regarding, and assumes any responsibility or liability for, theaccuracy or completeness of, or any errors or omissions in, any information or opinions contained herein. None of the Company or any of its members, directors, officers, employees, affiliates, advisorsor representatives nor any other person will be liable (in negligence or otherwise) for any loss howsoever arising from any use of this presentation or its contents or otherwise arising in connection withthe presentation.
This presentation may contain forward-looking statements which are statements that are not historical facts that may be identified by their use of words like “plans,” “expects,” “will,” “anticipates,”“believes,” “intends,” “depends,” “projects,” “estimates” or other words of similar meaning and that involve substantial risks and uncertainties. You should not unduly rely on such statements. Allstatements that address expectations or projections about the future, including, but not limited to, statements about the strategy for growth, product development, market position, expenditures, andfinancial results, are forward-looking statements. Forward-looking statements are based on certain assumptions and expectations of future events. The Company does not guarantee that theseassumptions and expectations are accurate or will be realised. Actual future performance, outcomes and results may differ materially from those expressed in forward-looking statements as a result of anumber of risks, uncertainties and assumptions.
Representative examples of these factors include (without limitation) general industry and economic conditions, interest rate trends, cost of capital and capital availability, competition from othercompanies, shifts in customer demands, customers and partners, changes in operating expenses including employee wages, benefits and training, governmental and public policy changes and thecontinued availability of financing in the amounts and the terms necessary to support future business. You are cautioned not to place undue reliance on these forward-looking statements, which arebased on current view of the Company's management on future events. The Company do not assume any responsibility to amend, modify or revise any forward-looking statements, on the basis of anysubsequent developments, information or events, or otherwise.
The information in this presentation has not been independently verified, approved or endorsed by any manager or adviser retained by the Company. No representation, warranty, express or implied, ismade as to, and no reliance, in whole or in part, should be placed on, the fairness, accuracy, completeness or correctness of the information and opinions in this presentation. It is not intended that thesematerials provide, and you may not rely on these materials as providing, a complete or comprehensive analysis of the Company. The information and opinions in these materials are provided as at thedate of this presentation, and are subject to change without notice. None of the Company or its affiliates, advisers or representatives, makes any representation as to, or assumes any responsibility withregard to, the accuracy or completeness of any information contained here or undertakes any responsibility for any reliance which is placed by any person on any statements or opinions appearingherein or which are made by the Company or any third party, or undertakes to update or revise any information subsequent to the date hereof, whether as a result of new information, future events orotherwise and none of them shall have any liability (in negligence or otherwise) for nor shall they accept responsibility for any loss or damage howsoever arising from any information or opinionspresented in these materials or use of this presentation or its contents or otherwise arising in connection with this presentation.
The distribution of this presentation in certain jurisdictions may be restricted by law and, accordingly, this presentation is being communicated only to persons who have requisite experience in mattersrelating to investments and are persons to whom it may be lawful to communicate it without contravention of any unfulfilled registration requirements or other legal restrictions in the jurisdiction in whichthey reside or conduct business or in which they receive this presentation.

Thank you