PACC Offshore Services Holdings Ltd. - listed...
25
PACC Offshore Services Holdings Ltd. Corporate Overview SGX-Goldman Marine Oil & Gas Corporate Day 3 March 2017
Transcript of PACC Offshore Services Holdings Ltd. - listed...

PACC Offshore Services Holdings Ltd.
Corporate OverviewSGX-Goldman Marine Oil & Gas Corporate Day
3 March 2017

2
Overview
1. About POSH
2. Our Competitive Strengths
3. Our Fleet
4. Q4 and FY 2016 Financial Highlights

3
ABOUT POSH

4
Company Overview
Operates a modern fleet of 119 vessels as at February 2017
Diversified operations across four distinct business divisions
Global operations across Asia, Africa, Middle East and Latin America
Strong client base including major oil companies and large international offshore contractors
Diversified operations with balanced fleet
profile
Highly experienced management team with a proven track record Varied and complementary corporate experience, with more than 600 years of
combined sea-going experience
Experienced management team
Healthy financial position Strong support from stakeholders including banks and clients Backed by the Kuok Group parentage
Strong balance sheet, backed by strong parentage and stakeholders
Listed on SGX with a diversified fleet or more than 110 vessels

5
Company Milestones
PACC Offshore Pte Ltd incorporated through M&A of several companies
Acquired SEMCO Pte. Ltd and Maritime Pte. Ltd
Launched offshore accommodation segment
Formation of PSV fleet
Enhanced offshore accommodation segment through new orders for 2 units of 750-persons DP3 SSAVs
Awarded T&I contract for Icthys FPSO and Central Processing Facility, currently the largest central processing facility in the world
Listed on the mainboard of SGX in April 2014
Launched 2 business segments: - oilfield services- deepwater services
Changed company name to PACC Offshore Services Holdings Ltd. (POSH)
1950s 2006 2007 2008 2010 2012 2013 2014 2015 2016
Started as a salvage and towage specialist
Our 1st SSAV POSH Xanadu passed Petrobras’ acceptance tests and commenced a 1+1 year charter
Formation of joint venture of POSH Saudi Co. Ltd with Hmood Al-KhalafGroup in Saudi Arabia
To date, long-term contracts secured for 12 vessels
6
Offshore SupplyVessels (OSV)
Transportation and Installation (T&I)
Offshore Accommodation (OA)
Harbour Services andEmergency Response (HSER)
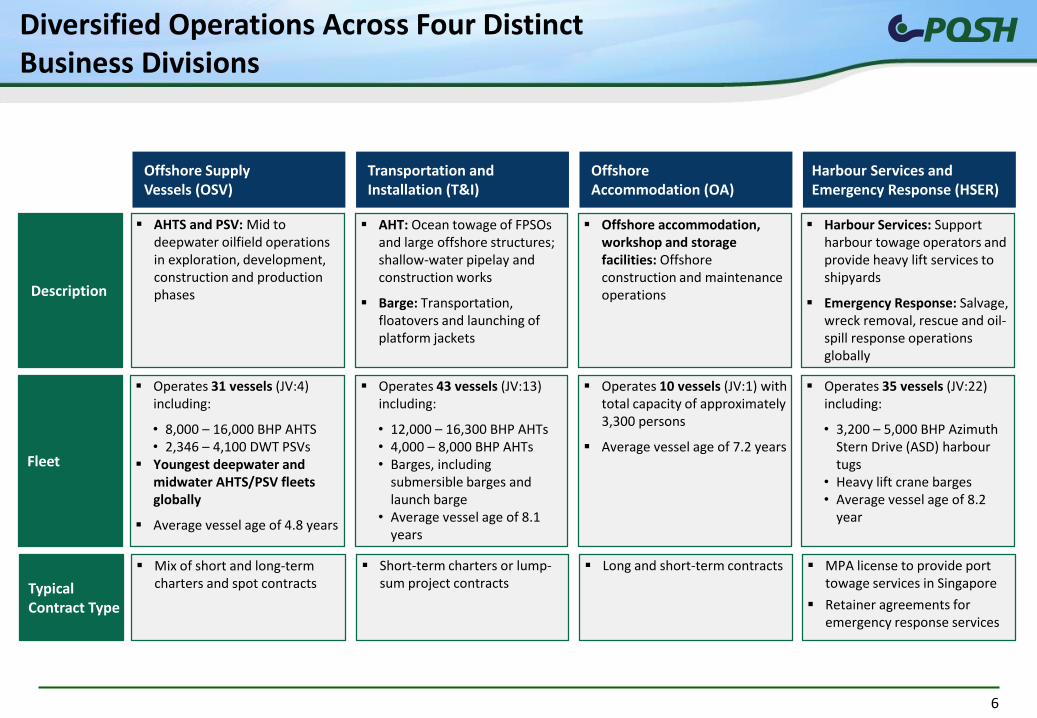
Description
AHTS and PSV: Mid to deepwater oilfield operations in exploration, development, construction and production phases
AHT: Ocean towage of FPSOs and large offshore structures; shallow-water pipelay and construction works
Barge: Transportation, floatovers and launching of platform jackets
Offshore accommodation, workshop and storage facilities: Offshore construction and maintenance operations
Harbour Services: Support harbour towage operators and provide heavy lift services to shipyards
Emergency Response: Salvage, wreck removal, rescue and oil-spill response operations globally
Fleet
Operates 31 vessels (JV:4)including:
• 8,000 – 16,000 BHP AHTS• 2,346 – 4,100 DWT PSVs
Youngest deepwater and midwater AHTS/PSV fleets globally
Average vessel age of 4.8 years
Operates 43 vessels (JV:13)including:
• 12,000 – 16,300 BHP AHTs• 4,000 – 8,000 BHP AHTs• Barges, including
submersible barges and launch barge
• Average vessel age of 8.1 years
Operates 10 vessels (JV:1) with total capacity of approximately 3,300 persons
Average vessel age of 7.2 years
Operates 35 vessels (JV:22) including:
• 3,200 – 5,000 BHP Azimuth Stern Drive (ASD) harbourtugs
• Heavy lift crane barges• Average vessel age of 8.2
year
Typical Contract Type
Mix of short and long-term charters and spot contracts
Short-term charters or lump-sum project contracts
Long and short-term contracts MPA license to provide port towage services in Singapore
Retainer agreements for emergency response services
Diversified Operations Across Four Distinct Business Divisions

7
The Offshore Services Vessels (OSV) segment supports mid todeepwater operations of rig and oilfield operators (during explorationand construction phases).
This segment operates:
• AHTS providing multi-role services during drilling such as towingand positioning drilling rigs, and transporting drilling materials andother equipment; and
• PSVs that transport drilling materials and supplies to drilling rigs,offshore production platform as well as pipes and other materialsfor construction of marine structures or pipelines.
The main geographic areas of current operation and deploymentinclude Asia Pacific, Africa and Latin America.
OSV Division

8
The Transportation & Installation (“T&I”) division supportsmarine contractors in construction and maintenance ofoilfield infrastructure and pipelines.
It operates nine 150 to 205 ton bollard pull AHTs and fifteen48 to 105 ton bollard pull AHTs specialising in cross-oceantowing, transporting large marine structures from thebuilder’s yard and installing them in the oilfields, three largesubmersible barges for float-over or launching operations oflarge marine structures and ballastable tank barges and tugsfor transportation of construction materials and subseapipes.
Our vessels operate globally.
T&I Division
* Total no. of vessels including those in pool & under JV
9
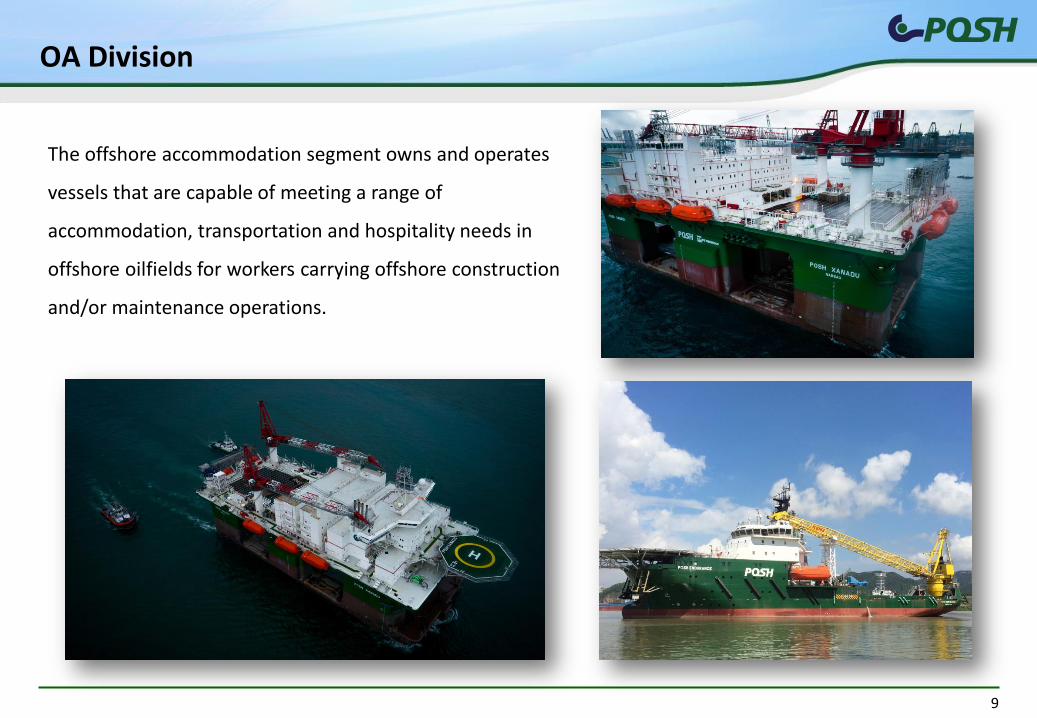
The offshore accommodation segment owns and operates
vessels that are capable of meeting a range of
accommodation, transportation and hospitality needs in
offshore oilfields for workers carrying offshore construction
and/or maintenance operations.
OA Division

10
• Operates a modern fleet of ASD Harbour Tugs ranging from 40 tons to 60 tons bollard pull and a fleet of heavy lift crane barges of up to 1,500 tons SWL
• Fleet operates mainly in Singapore waters, but also supports shipyards, ports and terminals in Asia Pacific regions
Harbour Services
Emergency Response
• Leading salvor since 1950s
• Emergency response to oil spill and hazardous materials incidents
• Training for oil spill & hazmat incident control
HSER Division
OUR COMPETITIVE STRENGTHS
12
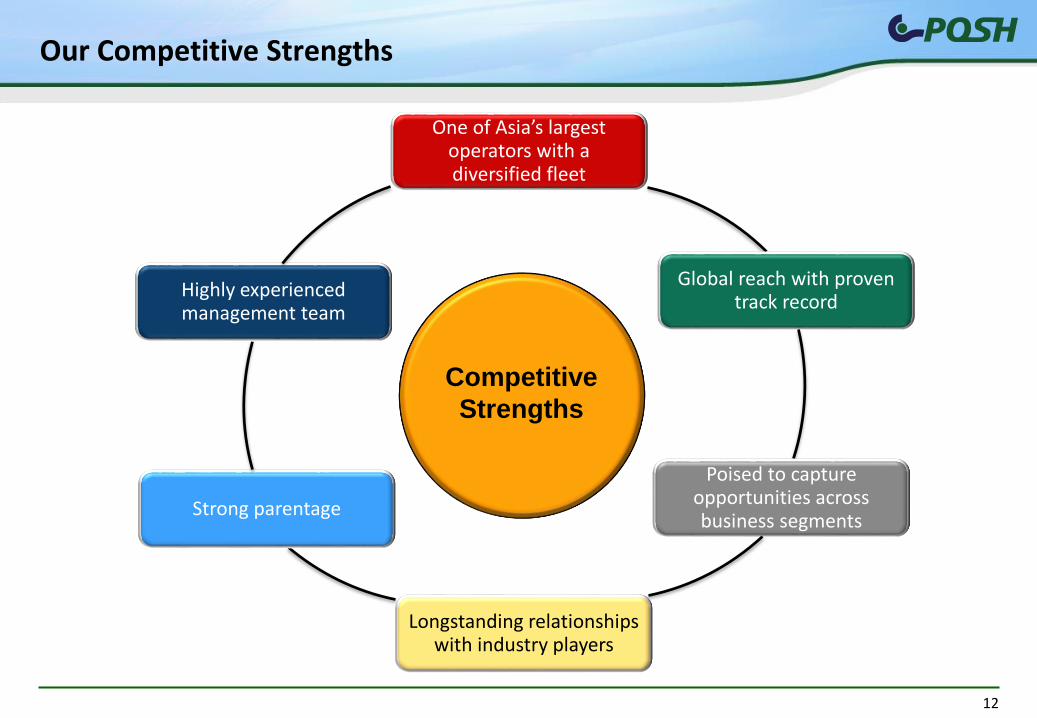
Our Competitive Strengths
One of Asia’s largest operators with a diversified fleet
Global reach with proven track record
Poised to capture opportunities across business segments
Longstanding relationships with industry players
Strong parentage
Highly experienced management team
Competitive
Strengths
13
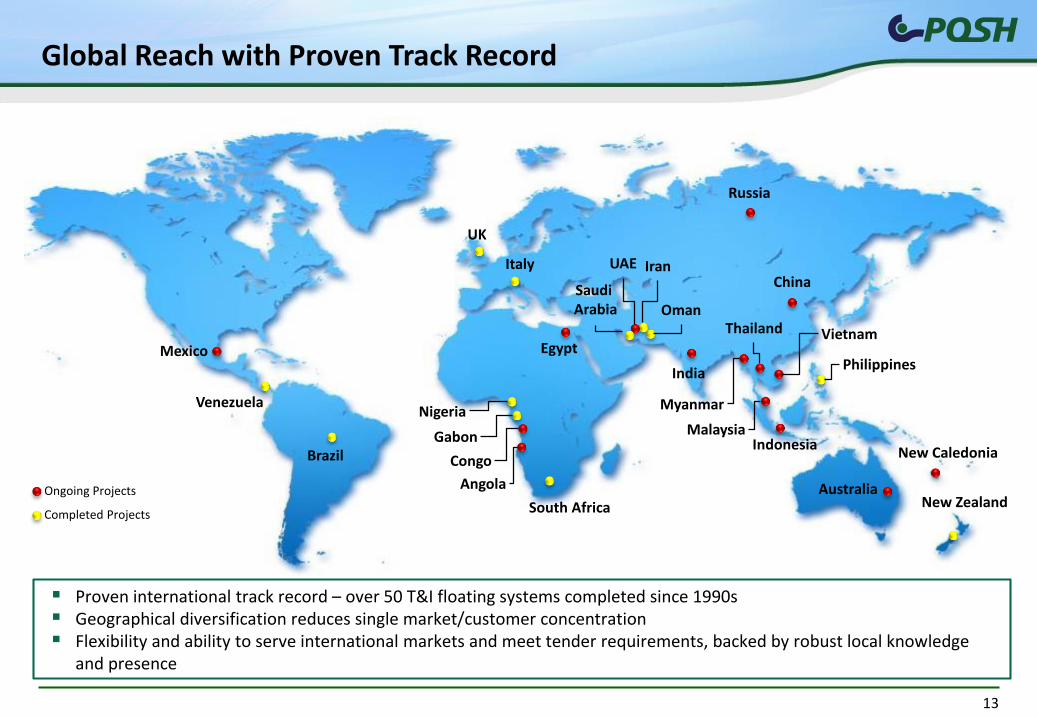
Proven international track record – over 50 T&I floating systems completed since 1990s Geographical diversification reduces single market/customer concentration Flexibility and ability to serve international markets and meet tender requirements, backed by robust local knowledge
and presence
Mexico
Malaysia
Thailand
Myanmar
Russia
Australia
CongoIndonesia
India
Vietnam
Gabon
Saudi Arabia
New Caledonia
Egypt
Angola
Brazil
Philippines
China
Venezuela
UK
Italy
South Africa
IranUAE
New Zealand
Oman
Nigeria
Completed Projects
Ongoing Projects
Global Reach with Proven Track Record

14
Global Oil & Gas Majors International Oil & Gas Contractors
Possess proven track record and an extensive network of customers including global oil and gas majors and international oil and gas contractors
Compete effectively due to strong reputation and long-standing relationships with customers
Longstanding Relationships with Industry Players

OUR FLEET

16
Vessels to be Delivered – Q1 FY17 Onward
ExpectedDelivery Date
No. of Newbuilds
Q3 FY17 Q4 FY17
6 Shallow draft AHTS
OAIMR &MPSV
OSV
AHTS
POSH
Q1 FY17 Q2 FY17 Q3 FY17
1 DP2 MPSV 2 DP2 IMR vessels
As at 31 December 2016, we have a total of 14 newbuilds contracted for delivery
Q1 FY17 1 ASD Harbour TugsTugHSER
Size
5,220 BHP
4,100 dwt 89 M
5,000 BHP
2,597 – 3,152 BHP
Contract
Firm 5 years plus 2 years extension
Firm 5 years plus 2 years extension
Q1 FY17 Q2 FY17
4 MUVMUV

17
Fleet Optimisation Program
Young fleet of customized new builds to meet customers’needs Focus on high-capacity and high-specification offshore accommodation vessels Entry into Inspection, Maintenance and Repair (IMR) segment with construction of IMR vessels
Wholly owned Owned by JVs
AHTS 13 4 6
PSV 14 - -
Maintenance Utility Vessels - - 4
AHT 12 9 -
Towing Tugs 4 - -
Barges 14 4 -
SSAV 2 - -
Accommodation Vessels 7 1 -
IMR/MPSV - - 3
Harbour Tugs¹ 10 19 1
Crane Barges - 3 -
Utility Workboats 3 - -
Total as at 31 Dec 2016 79 40 14
Current fleet
New vessels
under contruction/
committedType of vessels
1: One ASD Harbour Tug was subsequently delivered in Jan 2017.

18
• Our entire fleet is supported by our in-house ship management division –
POSH Fleet Services (PFS)
• Provides critical quality services including:
• Health, Safety & Environment
• Quality Assurance
• Technical Support
• Crew Management
• Ship Spares & Stores Procurement
POSH Fleet Services

Q4 AND FY2016 FINANCIAL HIGHLIGHTS
Move to behind

20
Key Highlights
• Q4 FY16 revenue at US$36.7 million; a decrease of 49% (FY15: US$71.8 million) amid lower fleet utilisation and deflated charter rates.
• Amid challenging macro conditions, the Group had kept cost in check and minimise Q4 FY16 gross loss to US$9.5 million. Full year gross profit for FY16 stands at US$5.0 million.
• Q4 FY16 net loss of US$345.4 million, arising from non-cash impairments of goodwill (US$111.2 million) and impairment of fixed assets (US$198.9 million).
• Resilient financial performance with positive full year EBITDA of US$23.9 million and net cash generated from operations of US$38.2 million.
• Continue new build programme for our Middle East contracts in FY17.

21
Q4 FY16 Q4 FY15 Change FY16 FY15 Change
Gross Revenue 36.7 71.8 -49% 183.1 280.8 -35%
Gross (Loss)/Profit (9.5) 17.2 NM 5.0 58.0 -91%
Share of JV Results (15.5) (12.4) 25% (13.8) (9.5) 45%
Net Loss after Tax¹ (345.4) (149.7) 131% (371.4) (131.0) 184%
(111.2) (127.0) -12% (111.2) (127.0) -12%
(198.9) (21.4) 828% (198.9) (21.4) 828%
(35.3) (1.3) NM (61.3) 17.4 NM
EBITDA (12.1) 18.7 NM 23.9 90.4 -74%
US$'M
SUMMARY
Net (Loss)/Profit¹
� excluding impairments
Impairment of fixed assets
Impairment of goodwill
1: Net (Loss)/Profit after tax attributable to shareholders
Group Financial Highlights(Announcement of Q4 and FY 2016 Financial Results)
22
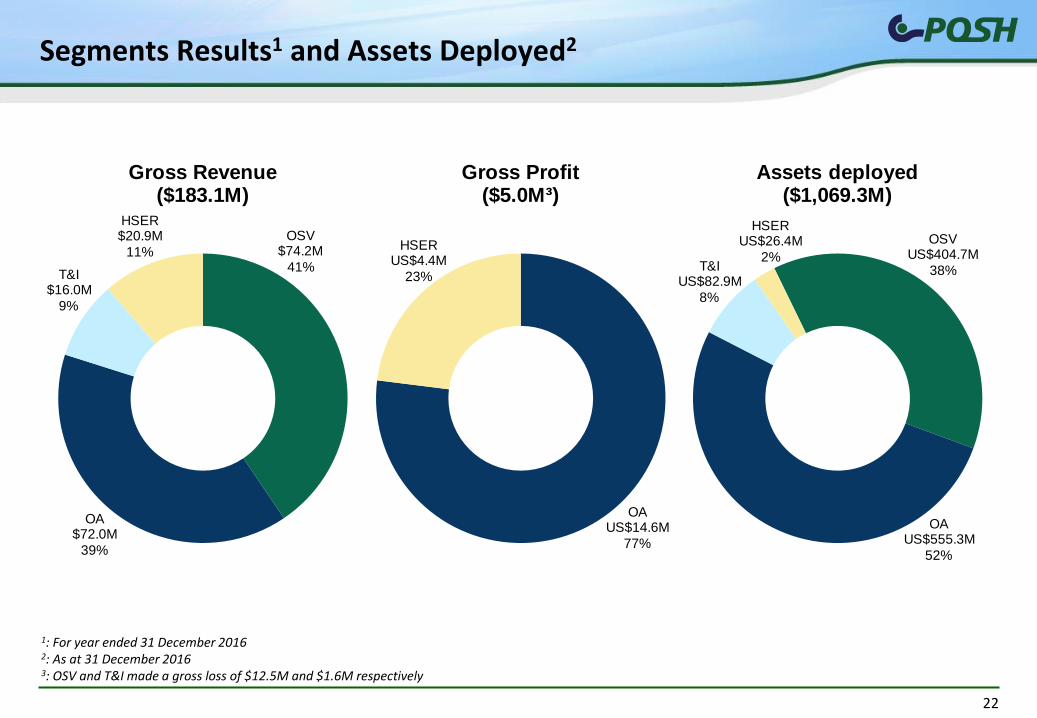
Segments Results1 and Assets Deployed2
1: For year ended 31 December 20162: As at 31 December 20163: OSV and T&I made a gross loss of $12.5M and $1.6M respectively
Gross Revenue($183.1M)
OSV$74.2M
41%
OA$72.0M
39%
T&I$16.0M
9%
HSER$20.9M
11%
Gross Profit($5.0M³)
OAUS$14.6M
77%
HSERUS$4.4M
23%
Assets deployed($1,069.3M)
OSVUS$404.7M
38%
OAUS$555.3M
52%
T&IUS$82.9M
8%
HSERUS$26.4M
2%
23
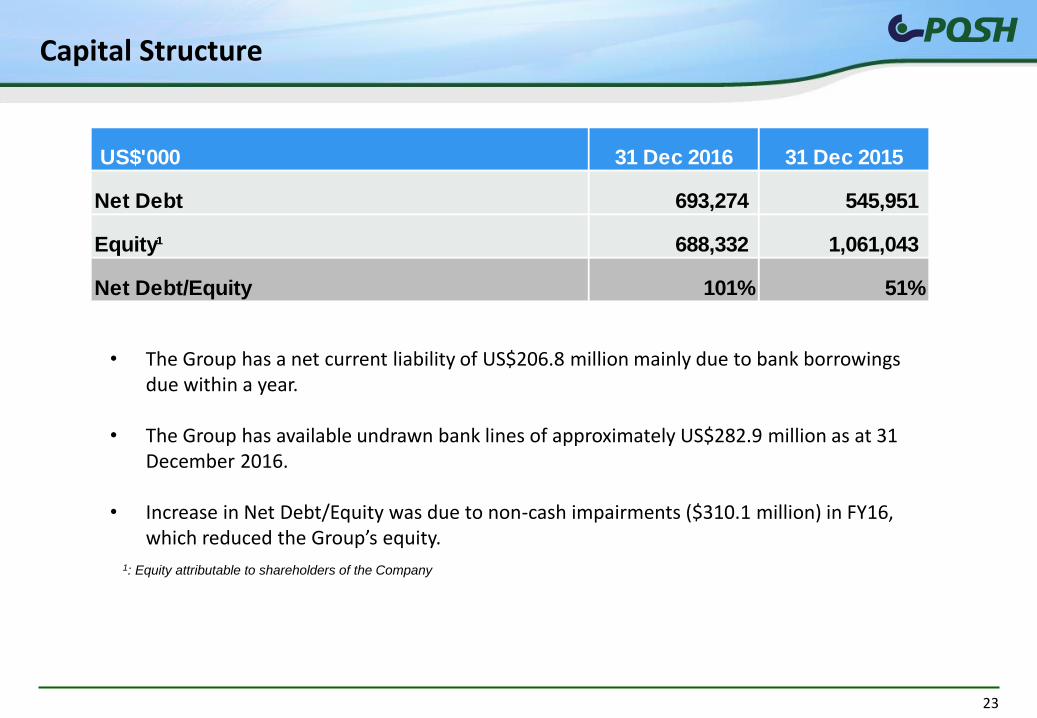
Capital Structure
1: Equity attributable to shareholders of the Company
US$'000 31 Dec 2016 31 Dec 2015
Net Debt 693,274 545,951
Equity¹ 688,332 1,061,043
Net Debt/Equity 101% 51%
• The Group has a net current liability of US$206.8 million mainly due to bank borrowings due within a year.
• The Group has available undrawn bank lines of approximately US$282.9 million as at 31 December 2016.
• Increase in Net Debt/Equity was due to non-cash impairments ($310.1 million) in FY16, which reduced the Group’s equity.

QUESTIONS & ANSWERS
Thank You

25
Disclaimer
The information contained in this presentation is for information purposes only, and does not constitute or form part of any offer or invitation to sell or the solicitation of an offer or invitation to purchase or
subscribe for, or any offer to underwrite or otherwise acquire any securities of PACC Offshore Services Holdings Ltd. (the “Company”) or any other securities, nor shall any part of this presentation or the
fact of its distribution or communication form the basis of, or be relied on in connection with, any contract, commitment or investment decision in relation thereto in Singapore or any other jurisdiction. No
reliance may be placed for any purpose whatsoever on the information set forth in this presentation or on its completeness. This presentation has been prepared solely for information used by the
Company for presentation purposes and may not be reproduced or redistributed to any other person.
The information (“Confidential Information”) contained in this presentation does not contain all relevant information relating to the Company or its securities, particularly with respect to the risks and
special considerations involved with an investment in the securities of the Company. No part of this document shall form the basis of or be relied upon in connection with any contract or commitment
whatsoever. This presentation is strictly confidential and has been prepared by the Company to you solely for your reference. The Confidential Information is subject to change without notice, its
accuracy is not guaranteed and it may not contain all material information concerning the Company. The information contained in this presentation has not been independently verified. No
representation, warranty or undertaking, express or implied, is made as to, and no reliance should be placed on, the fairness, accuracy, completeness or correctness of the information or the opinions
contained herein. Neither the Company nor any of their respective directors makes any representation or warranty (express or implied) regarding, and assumes any responsibility or liability for, the
accuracy or completeness of, or any errors or omissions in, any information or opinions contained herein. None of the Company or any of its members, directors, officers, employees, affiliates, advisors
or representatives nor any other person will be liable (in negligence or otherwise) for any loss howsoever arising from any use of this presentation or its contents or otherwise arising in connection with
the presentation.
This presentation may contain forward-looking statements which are statements that are not historical facts that may be identified by their use of words like “plans,” “expects,” “will,” “anticipates,”
“believes,” “intends,” “depends,” “projects,” “estimates” or other words of similar meaning and that involve substantial risks and uncertainties. You should not unduly rely on such statements. All
statements that address expectations or projections about the future, including, but not limited to, statements about the strategy for growth, product development, market position, expenditures, and
financial results, are forward-looking statements. Forward-looking statements are based on certain assumptions and expectations of future events. The Company does not guarantee that these
assumptions and expectations are accurate or will be realised. Actual future performance, outcomes and results may differ materially from those expressed in forward-looking statements as a result of a
number of risks, uncertainties and assumptions.
Representative examples of these factors include (without limitation) general industry and economic conditions, interest rate trends, cost of capital and capital availability, competition from other
companies, shifts in customer demands, customers and partners, changes in operating expenses including employee wages, benefits and training, governmental and public policy changes and the
continued availability of financing in the amounts and the terms necessary to support future business. You are cautioned not to place undue reliance on these forward-looking statements, which are
based on current view of the Company's management on future events. The Company do not assume any responsibility to amend, modify or revise any forward-looking statements, on the basis of any
subsequent developments, information or events, or otherwise.
The information in this presentation has not been independently verified, approved or endorsed by any manager or adviser retained by the Company. No representation, warranty, express or implied, is
made as to, and no reliance, in whole or in part, should be placed on, the fairness, accuracy, completeness or correctness of the information and opinions in this presentation. It is not intended that these
materials provide, and you may not rely on these materials as providing, a complete or comprehensive analysis of the Company. The information and opinions in these materials are provided as at the
date of this presentation, and are subject to change without notice. None of the Company or its affiliates, advisers or representatives, makes any representation as to, or assumes any responsibility with
regard to, the accuracy or completeness of any information contained here or undertakes any responsibility for any reliance which is placed by any person on any statements or opinions appearing
herein or which are made by the Company or any third party, or undertakes to update or revise any information subsequent to the date hereof, whether as a result of new information, future events or
otherwise and none of them shall have any liability (in negligence or otherwise) for nor shall they accept responsibility for any loss or damage howsoever arising from any information or opinions
presented in these materials or use of this presentation or its contents or otherwise arising in connection with this presentation.
The distribution of this presentation in certain jurisdictions may be restricted by law and, accordingly, this presentation is being communicated only to persons who have requisite experience in matters
relating to investments and are persons to whom it may be lawful to communicate it without contravention of any unfulfilled registration requirements or other legal restrictions in the jurisdiction in which
they reside or conduct business or in which they receive this presentation.