Oy Merinova Ab Study of methods for improving … Kaitfors HPP, Feasibility Study 28.1.2013 _____ Oy...
37
Oy Merinova Ab Study of methods for improving feasibility of a small-scale hydroelectric power plant using Kaitfors as an example
Transcript of Oy Merinova Ab Study of methods for improving … Kaitfors HPP, Feasibility Study 28.1.2013 _____ Oy...
Oy Merinova Ab Study of methods for improving feasibility of a small-scale hydroelectric power plant using Kaitfors as an example

Oy Vesirakentaja Oy Merinova Ab 2(37) VSU Kaitfors HPP, Feasibility Study 28.1.2013
_________________________________________________________________________________________________________________________________ Oy Vesirakentaja Puhelin Sähköposti Y-tunnus Bertel Jungin aukio 9 [email protected] 02600 ESPOO (09) 7552 1100 www.vesirakentaja.fi 0115808-8
28.1.2013

Oy Vesirakentaja Oy Merinova Ab 3(37) VSU Kaitfors HPP, Feasibility Study 28.1.2013
_________________________________________________________________________________________________________________________________ Oy Vesirakentaja Puhelin Sähköposti Y-tunnus Bertel Jungin aukio 9 [email protected] 02600 ESPOO (09) 7552 1100 www.vesirakentaja.fi 0115808-8
Oy Vesirakentaja Oy Merinova Ab 4(37) VSU Kaitfors HPP, Feasibility Study 28.1.2013
_________________________________________________________________________________________________________________________________ Oy Vesirakentaja Puhelin Sähköposti Y-tunnus Bertel Jungin aukio 9 [email protected] 02600 ESPOO (09) 7552 1100 www.vesirakentaja.fi 0115808-8
TABLE OF CONTENTS
1 GENERAL ........................................................................................................................5
1.1 SMALL SCALE HYDRO POWER IN FINLAND ...........................................................................5
1.2 KAITFORS HYDRO POWER PLANT ......................................................................................7
2 HYDROLOGY ...................................................................................................................8
2.1 GENERAL ...................................................................................................................8
2.2 REGULATION ...............................................................................................................9
2.3 DISCHARGE ............................................................................................................... 10
2.4 WATER LEVELS .......................................................................................................... 11
3 INCREASING HYDRAULIC HEAD .................................................................................... 13
3.1 RISING OF HEAD WATER LEVEL ....................................................................................... 13
3.2 LOWERING OF TAILWATER ............................................................................................ 13
3.3 DECREASING OF LOCAL HYDRAULIC LOSSES ........................................................................ 16
3.4 IMPROVEMENT OF REGULATION ..................................................................................... 17
4 EXISTING TURBINE ....................................................................................................... 18
4.1 DESCRIPTION OF THE EXISTING TURBINE ........................................................................... 18
4.2 CONDITION OF EXISTING TURBINE ................................................................................... 19
5 EXISTING GENERATOR .................................................................................................. 22
6 NEW TURBINE UNIT ..................................................................................................... 22
6.1 ALTERNATIVES ........................................................................................................... 22
6.2 NEW TURBINE-GENERATOR UNIT INSIDE THE EXISTING POWERHOUSE ...................................... 23
7 ECONOMY .................................................................................................................... 24
7.1 INCREASING HYDRAULIC HEAD ....................................................................................... 24
7.2 ENERGY PRODUCTION AND POWER OUTPUT OF TURBINE ALTERNATIVES ................................... 26
7.3 COST-BENEFIT ANALYSIS OF TURBINE ALTERNATIVES ............................................................ 27
8 LEGAL PREREQUISITES .................................................................................................. 29
8.1 PERMITS .................................................................................................................. 29
8.2 RISING OF HEAD WATER LEVEL ....................................................................................... 29
8.3 LOWERING OF TAILWATER LEVEL .................................................................................... 30
8.4 REHABILITATION OF EXISTING TURBINE ............................................................................ 30
8.5 NEW TURBINE-GENERATOR UNIT INSIDE EXISTING POWERHOUSE ............................................ 30
8.6 NEW TURBINE-GENERATOR UNIT IN A NEW POWERHOUSE BUILDING ....................................... 30
9 CONCLUSIONS .............................................................................................................. 31
9.1 GENERAL ................................................................................................................. 31
9.2 CONCLUSIONS AND RECOMMENDATIONS FOR KAITFORS ...................................................... 31

Oy Vesirakentaja Oy Merinova Ab 5(37) VSU Kaitfors HPP, Feasibility Study 28.1.2013
_________________________________________________________________________________________________________________________________ Oy Vesirakentaja Puhelin Sähköposti Y-tunnus Bertel Jungin aukio 9 [email protected] 02600 ESPOO (09) 7552 1100 www.vesirakentaja.fi 0115808-8
APPENDICES ......................................................................................................................... 33
1 General
1.1 Small scale hydro power in Finland
In May 2007, Finnish Energy Industries launched a project by the Ministry of Trade and Industry, aimed to investigate the amount of exploitable hydropower in Finland and evaluate the possibilities to increase hydropower generation within each water system in Finland. The study, Voimaa Vedestä 20071, was performed by Oy Vesirakentaja. The aim was to give information how much hy-dropower generation could be increased and what measures are required. The following information in this chapter is based on the study results and the data collected for the study.
The study confirmed the fact that most of the exploitable hydro power in Finland is already harnessed in the 221 existing plants.
Figure 1. Hydropower in Finland, power output.
However, technologically and economically significant hydropower generation, which is suitable for quick regulation of electricity generation, could be in-creased by 470 MW, about 1.3 TWh/a in energy. One quarter of this comes through planned machinery replacements in existing power plants and the rest has unfortunately strong environmental constrains.
1 Oy Vesirakentaja, 2007, Voimaa Vedestä 2007 – Selvitys vesivoiman lisäämismahdollisuuksista, ISBN 978-952-5615-19-7.
English summary ”Power from Water 2007” available at http://www.vesirakentaja.fi/html/Summary%20ENG.pdf
Oy Vesirakentaja Oy Merinova Ab 6(37) VSU Kaitfors HPP, Feasibility Study 28.1.2013
_________________________________________________________________________________________________________________________________ Oy Vesirakentaja Puhelin Sähköposti Y-tunnus Bertel Jungin aukio 9 [email protected] 02600 ESPOO (09) 7552 1100 www.vesirakentaja.fi 0115808-8
In addition, small-scale hydropower can be harnessed and/or rehabilitated to a total of 60 MW, 220 GWh/a in energy. This becomes real, if the government support policies will remain at least at the current level introducing in average 15 to 20 % investment support to development projects. The support is limited to projects with less than 10 MW power output.
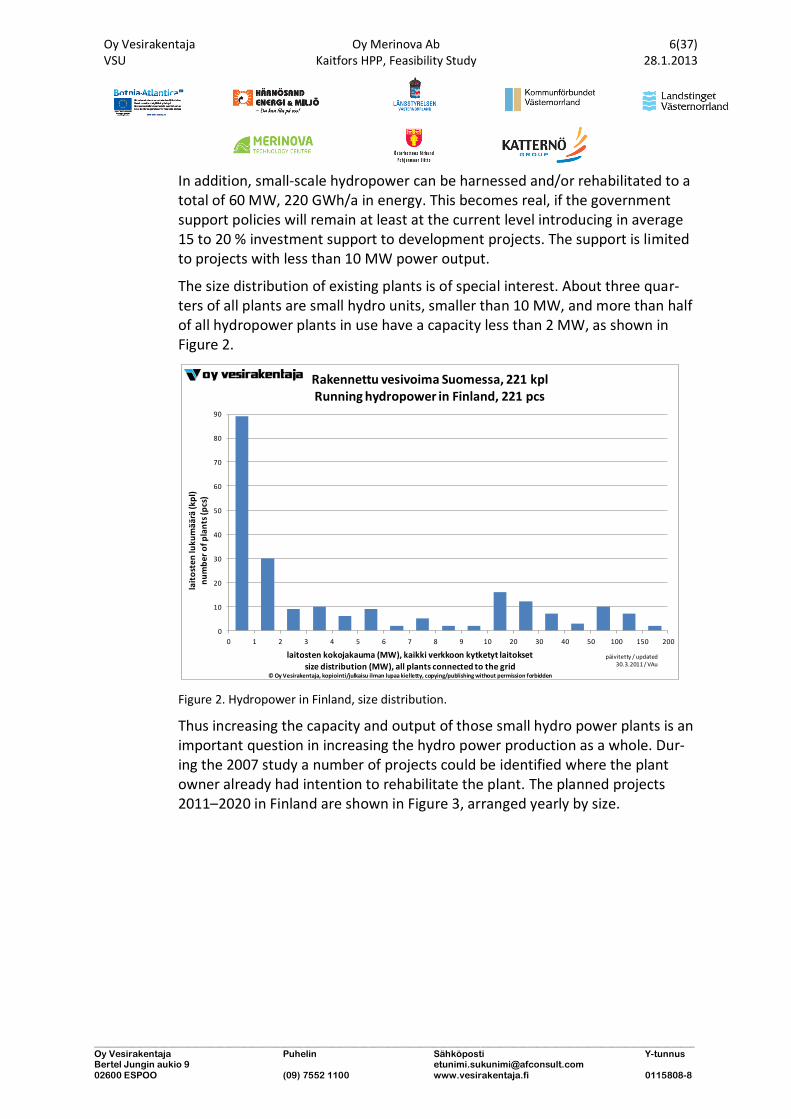
The size distribution of existing plants is of special interest. About three quar-ters of all plants are small hydro units, smaller than 10 MW, and more than half of all hydropower plants in use have a capacity less than 2 MW, as shown in Figure 2.
0
10
20
30
40
50
60
70
80
90
0 1 2 3 4 5 6 7 8 9 10 20 30 40 50 100 150 200
lait
ost
en
luk
um
ää
rä (
kp
l)n
um
be
r o
f p
lan
ts (
pcs
)
laitosten kokojakauma (MW), kaikki verkkoon kytketyt laitokset
size distribution (MW), all plants connected to the grid© Oy Vesirakentaja, kopiointi/julkaisu ilman lupaa kielletty, copying/publishing without permission forbidden
Rakennettu vesivoima Suomessa, 221 kplRunning hydropower in Finland, 221 pcs
päivitetty / updated30.3.2011 / VAu
Figure 2. Hydropower in Finland, size distribution.
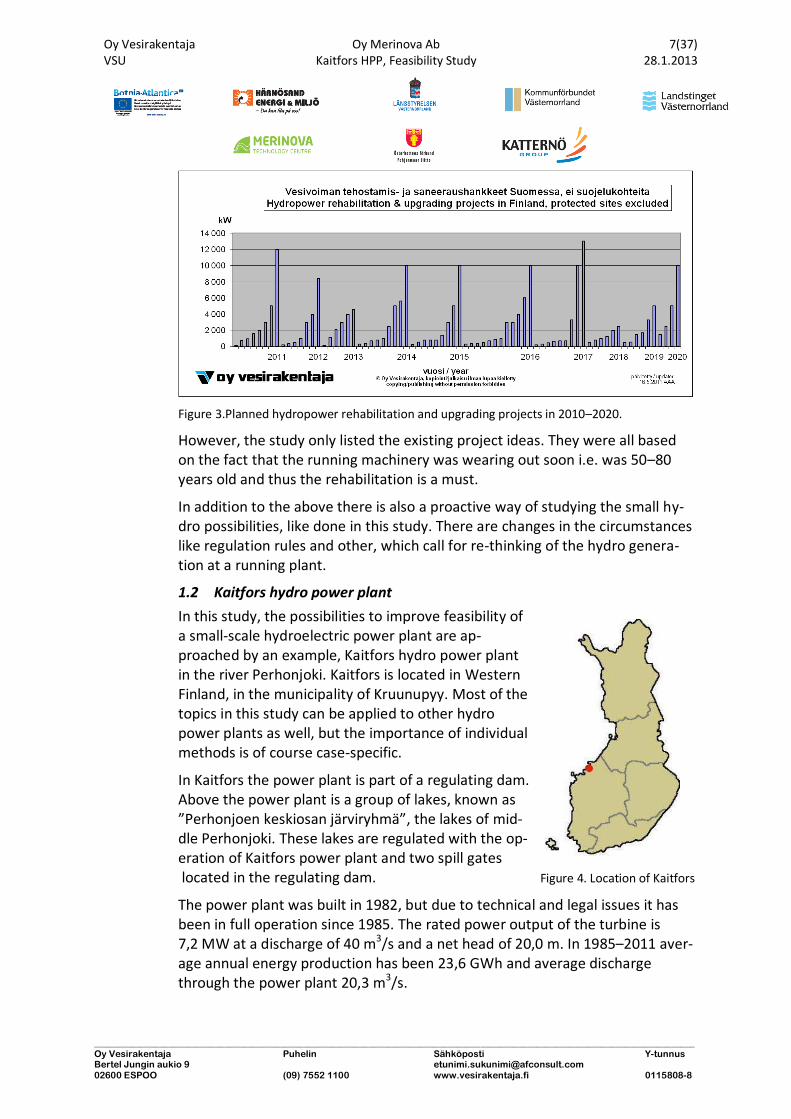
Thus increasing the capacity and output of those small hydro power plants is an important question in increasing the hydro power production as a whole. Dur-ing the 2007 study a number of projects could be identified where the plant owner already had intention to rehabilitate the plant. The planned projects 2011–2020 in Finland are shown in Figure 3, arranged yearly by size.
Oy Vesirakentaja Oy Merinova Ab 7(37) VSU Kaitfors HPP, Feasibility Study 28.1.2013
_________________________________________________________________________________________________________________________________ Oy Vesirakentaja Puhelin Sähköposti Y-tunnus Bertel Jungin aukio 9 [email protected] 02600 ESPOO (09) 7552 1100 www.vesirakentaja.fi 0115808-8
Figure 3.Planned hydropower rehabilitation and upgrading projects in 2010–2020.
However, the study only listed the existing project ideas. They were all based on the fact that the running machinery was wearing out soon i.e. was 50–80 years old and thus the rehabilitation is a must.
In addition to the above there is also a proactive way of studying the small hy-dro possibilities, like done in this study. There are changes in the circumstances like regulation rules and other, which call for re-thinking of the hydro genera-tion at a running plant.
1.2 Kaitfors hydro power plant
In this study, the possibilities to improve feasibility of a small-scale hydroelectric power plant are ap-proached by an example, Kaitfors hydro power plant in the river Perhonjoki. Kaitfors is located in Western Finland, in the municipality of Kruunupyy. Most of the topics in this study can be applied to other hydro power plants as well, but the importance of individual methods is of course case-specific.
In Kaitfors the power plant is part of a regulating dam. Above the power plant is a group of lakes, known as ”Perhonjoen keskiosan järviryhmä”, the lakes of mid-dle Perhonjoki. These lakes are regulated with the op-eration of Kaitfors power plant and two spill gates located in the regulating dam. Figure 4. Location of Kaitfors
The power plant was built in 1982, but due to technical and legal issues it has been in full operation since 1985. The rated power output of the turbine is 7,2 MW at a discharge of 40 m3/s and a net head of 20,0 m. In 1985–2011 aver-age annual energy production has been 23,6 GWh and average discharge through the power plant 20,3 m3/s.
Oy Vesirakentaja Oy Merinova Ab 8(37) VSU Kaitfors HPP, Feasibility Study 28.1.2013
_________________________________________________________________________________________________________________________________ Oy Vesirakentaja Puhelin Sähköposti Y-tunnus Bertel Jungin aukio 9 [email protected] 02600 ESPOO (09) 7552 1100 www.vesirakentaja.fi 0115808-8
A general map of Kaitfors is presented in Appendix 1. All height values are pre-sented in the Finnish national N43 - height system.
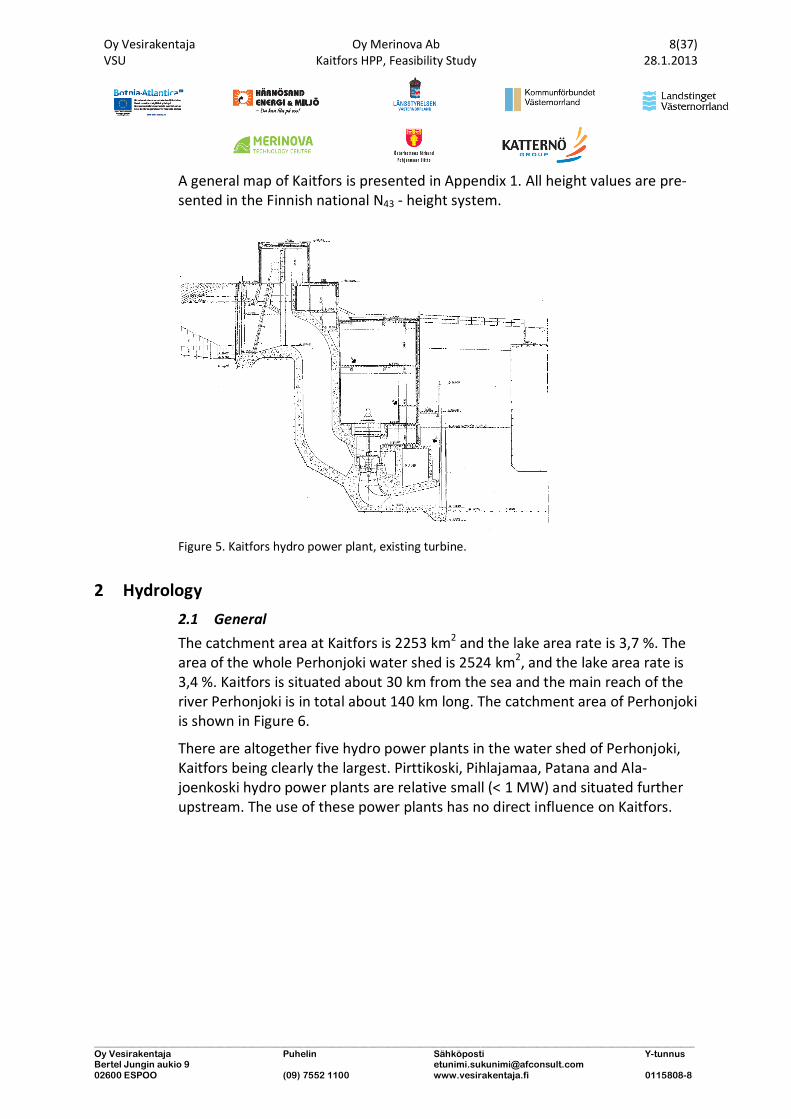
Figure 5. Kaitfors hydro power plant, existing turbine.
2 Hydrology
2.1 General
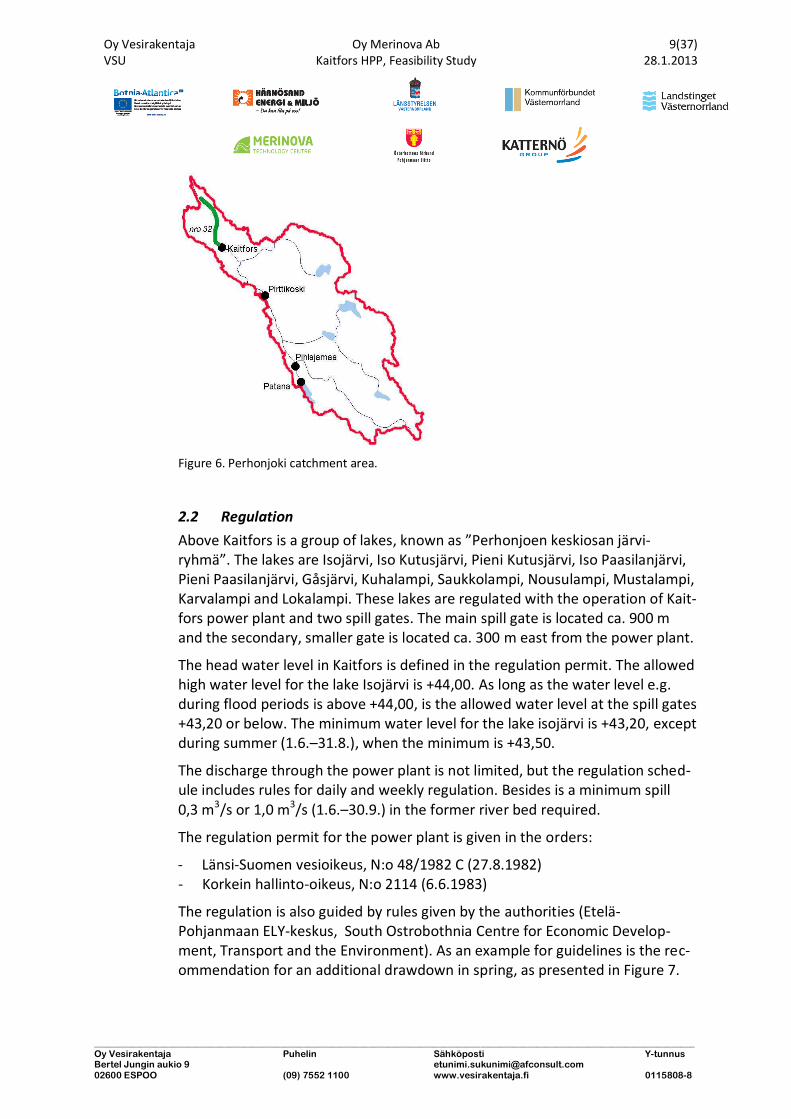
The catchment area at Kaitfors is 2253 km2 and the lake area rate is 3,7 %. The area of the whole Perhonjoki water shed is 2524 km2, and the lake area rate is 3,4 %. Kaitfors is situated about 30 km from the sea and the main reach of the river Perhonjoki is in total about 140 km long. The catchment area of Perhonjoki is shown in Figure 6.
There are altogether five hydro power plants in the water shed of Perhonjoki, Kaitfors being clearly the largest. Pirttikoski, Pihlajamaa, Patana and Ala-joenkoski hydro power plants are relative small (< 1 MW) and situated further upstream. The use of these power plants has no direct influence on Kaitfors.
Oy Vesirakentaja Oy Merinova Ab 9(37) VSU Kaitfors HPP, Feasibility Study 28.1.2013
_________________________________________________________________________________________________________________________________ Oy Vesirakentaja Puhelin Sähköposti Y-tunnus Bertel Jungin aukio 9 [email protected] 02600 ESPOO (09) 7552 1100 www.vesirakentaja.fi 0115808-8
Figure 6. Perhonjoki catchment area.
2.2 Regulation
Above Kaitfors is a group of lakes, known as ”Perhonjoen keskiosan järvi-ryhmä”. The lakes are Isojärvi, Iso Kutusjärvi, Pieni Kutusjärvi, Iso Paasilanjärvi, Pieni Paasilanjärvi, Gåsjärvi, Kuhalampi, Saukkolampi, Nousulampi, Mustalampi, Karvalampi and Lokalampi. These lakes are regulated with the operation of Kait-fors power plant and two spill gates. The main spill gate is located ca. 900 m and the secondary, smaller gate is located ca. 300 m east from the power plant.
The head water level in Kaitfors is defined in the regulation permit. The allowed high water level for the lake Isojärvi is +44,00. As long as the water level e.g. during flood periods is above +44,00, is the allowed water level at the spill gates +43,20 or below. The minimum water level for the lake isojärvi is +43,20, except during summer (1.6.–31.8.), when the minimum is +43,50.
The discharge through the power plant is not limited, but the regulation sched-ule includes rules for daily and weekly regulation. Besides is a minimum spill 0,3 m3/s or 1,0 m3/s (1.6.–30.9.) in the former river bed required.
The regulation permit for the power plant is given in the orders:
- Länsi-Suomen vesioikeus, N:o 48/1982 C (27.8.1982) - Korkein hallinto-oikeus, N:o 2114 (6.6.1983)
The regulation is also guided by rules given by the authorities (Etelä-Pohjanmaan ELY-keskus, South Ostrobothnia Centre for Economic Develop-ment, Transport and the Environment). As an example for guidelines is the rec-ommendation for an additional drawdown in spring, as presented in Figure 7.
Oy Vesirakentaja Oy Merinova Ab 10(37) VSU Kaitfors HPP, Feasibility Study 28.1.2013
_________________________________________________________________________________________________________________________________ Oy Vesirakentaja Puhelin Sähköposti Y-tunnus Bertel Jungin aukio 9 [email protected] 02600 ESPOO (09) 7552 1100 www.vesirakentaja.fi 0115808-8
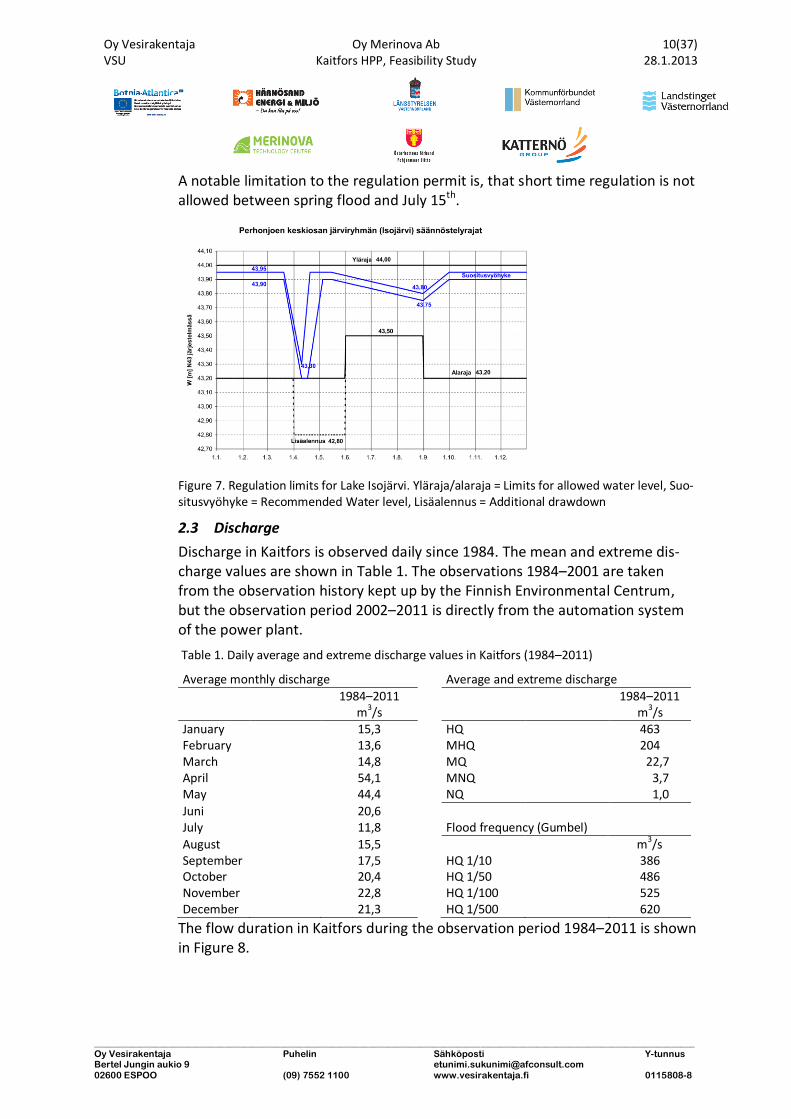
A notable limitation to the regulation permit is, that short time regulation is not allowed between spring flood and July 15th.
Figure 7. Regulation limits for Lake Isojärvi. Yläraja/alaraja = Limits for allowed water level, Suo-situsvyöhyke = Recommended Water level, Lisäalennus = Additional drawdown
2.3 Discharge
Discharge in Kaitfors is observed daily since 1984. The mean and extreme dis-charge values are shown in Table 1. The observations 1984–2001 are taken from the observation history kept up by the Finnish Environmental Centrum, but the observation period 2002–2011 is directly from the automation system of the power plant.
Table 1. Daily average and extreme discharge values in Kaitfors (1984–2011)
Average monthly discharge Average and extreme discharge
1984–2011
m3/s
1984–2011
m3/s
January 15,3 HQ 463 February 13,6 MHQ 204 March 14,8 MQ 22,7 April 54,1 MNQ 3,7 May 44,4 NQ 1,0
Juni 20,6 July 11,8 Flood frequency (Gumbel)
August 15,5 m3/s September 17,5 HQ 1/10 386 October 20,4 HQ 1/50 486 November 22,8 HQ 1/100 525 December 21,3 HQ 1/500 620
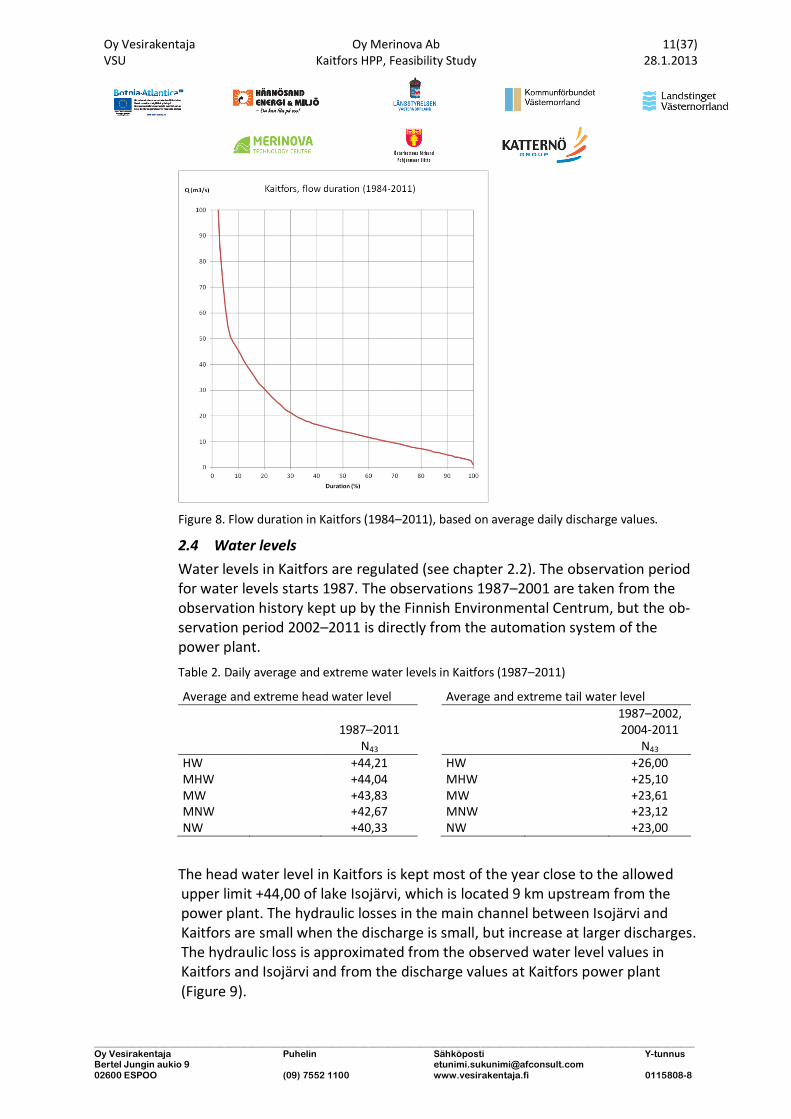
The flow duration in Kaitfors during the observation period 1984–2011 is shown in Figure 8.
Oy Vesirakentaja Oy Merinova Ab 11(37) VSU Kaitfors HPP, Feasibility Study 28.1.2013
_________________________________________________________________________________________________________________________________ Oy Vesirakentaja Puhelin Sähköposti Y-tunnus Bertel Jungin aukio 9 [email protected] 02600 ESPOO (09) 7552 1100 www.vesirakentaja.fi 0115808-8
Figure 8. Flow duration in Kaitfors (1984–2011), based on average daily discharge values.
2.4 Water levels
Water levels in Kaitfors are regulated (see chapter 2.2). The observation period for water levels starts 1987. The observations 1987–2001 are taken from the observation history kept up by the Finnish Environmental Centrum, but the ob-servation period 2002–2011 is directly from the automation system of the power plant.
Table 2. Daily average and extreme water levels in Kaitfors (1987–2011)
Average and extreme head water level Average and extreme tail water level
1987–2011 N43
1987–2002, 2004-2011
N43
HW +44,21 HW +26,00 MHW +44,04 MHW +25,10 MW +43,83 MW +23,61 MNW +42,67 MNW +23,12 NW +40,33 NW +23,00
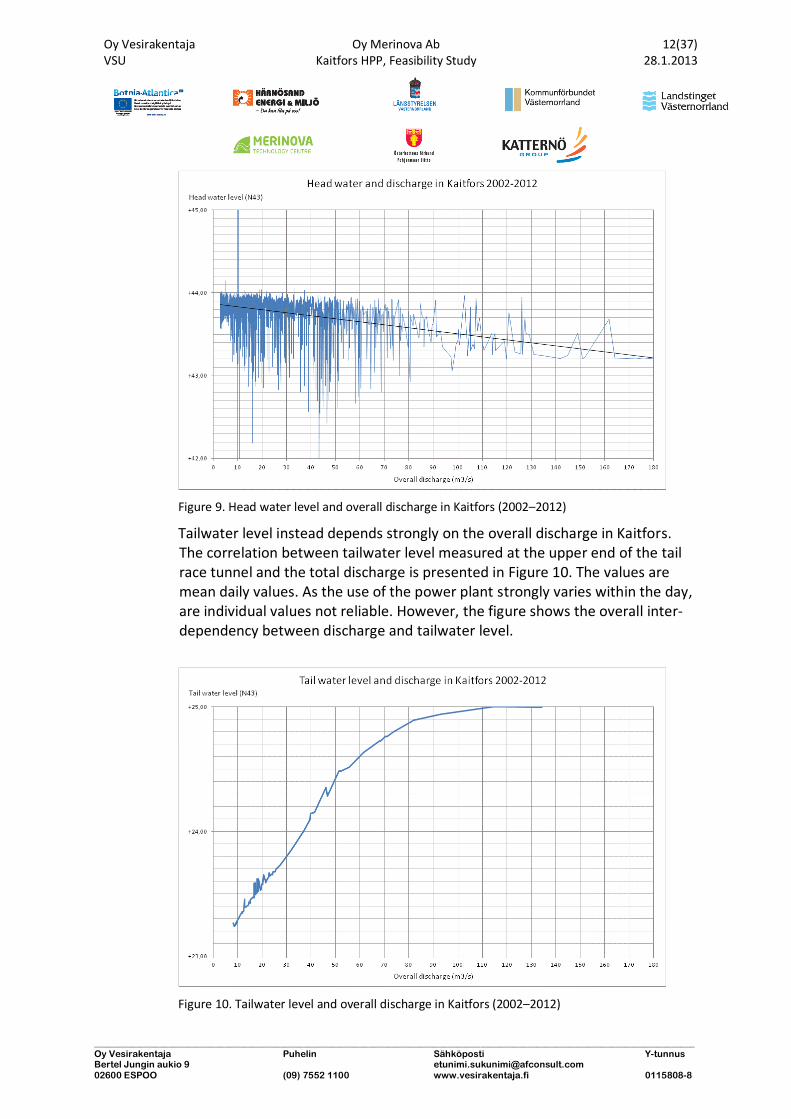
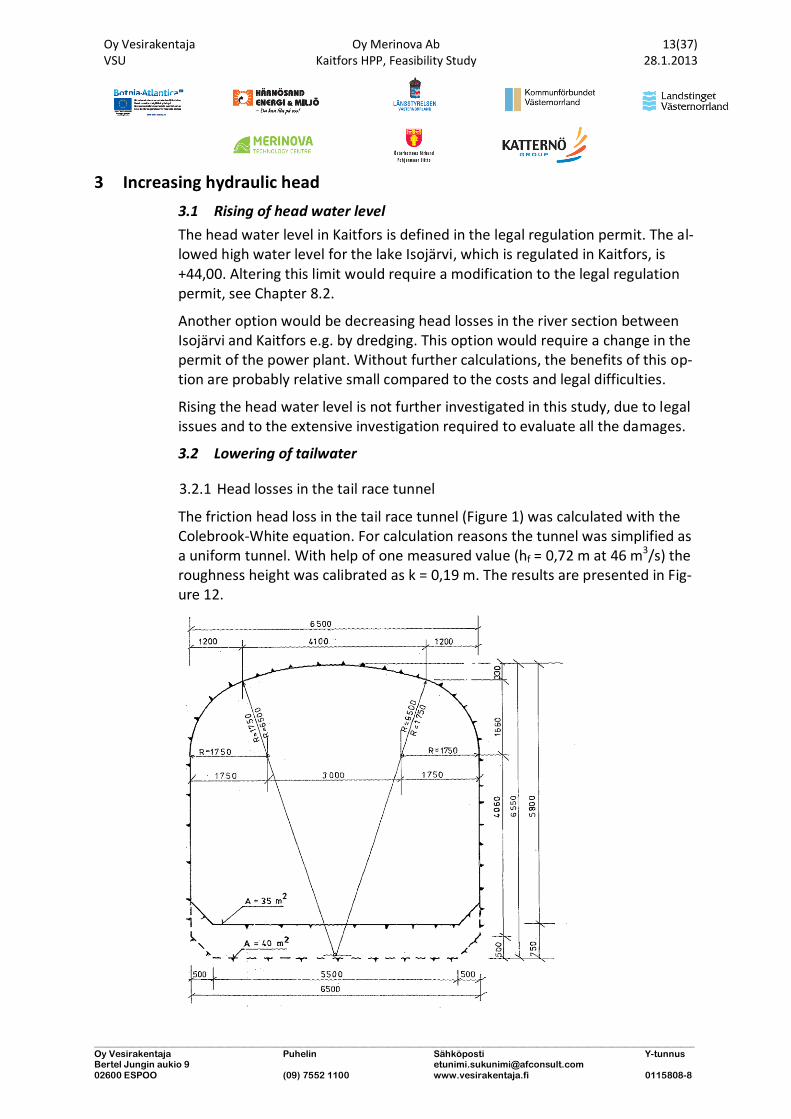
The head water level in Kaitfors is kept most of the year close to the allowed upper limit +44,00 of lake Isojärvi, which is located 9 km upstream from the power plant. The hydraulic losses in the main channel between Isojärvi and Kaitfors are small when the discharge is small, but increase at larger discharges. The hydraulic loss is approximated from the observed water level values in Kaitfors and Isojärvi and from the discharge values at Kaitfors power plant (Figure 9).
Oy Vesirakentaja Oy Merinova Ab 12(37) VSU Kaitfors HPP, Feasibility Study 28.1.2013
_________________________________________________________________________________________________________________________________ Oy Vesirakentaja Puhelin Sähköposti Y-tunnus Bertel Jungin aukio 9 [email protected] 02600 ESPOO (09) 7552 1100 www.vesirakentaja.fi 0115808-8
Figure 9. Head water level and overall discharge in Kaitfors (2002–2012)
Tailwater level instead depends strongly on the overall discharge in Kaitfors. The correlation between tailwater level measured at the upper end of the tail race tunnel and the total discharge is presented in Figure 10. The values are mean daily values. As the use of the power plant strongly varies within the day, are individual values not reliable. However, the figure shows the overall inter-dependency between discharge and tailwater level.
Figure 10. Tailwater level and overall discharge in Kaitfors (2002–2012)
Oy Vesirakentaja Oy Merinova Ab 13(37) VSU Kaitfors HPP, Feasibility Study 28.1.2013
_________________________________________________________________________________________________________________________________ Oy Vesirakentaja Puhelin Sähköposti Y-tunnus Bertel Jungin aukio 9 [email protected] 02600 ESPOO (09) 7552 1100 www.vesirakentaja.fi 0115808-8
3 Increasing hydraulic head
3.1 Rising of head water level
The head water level in Kaitfors is defined in the legal regulation permit. The al-lowed high water level for the lake Isojärvi, which is regulated in Kaitfors, is +44,00. Altering this limit would require a modification to the legal regulation permit, see Chapter 8.2.
Another option would be decreasing head losses in the river section between Isojärvi and Kaitfors e.g. by dredging. This option would require a change in the permit of the power plant. Without further calculations, the benefits of this op-tion are probably relative small compared to the costs and legal difficulties.
Rising the head water level is not further investigated in this study, due to legal issues and to the extensive investigation required to evaluate all the damages.
3.2 Lowering of tailwater
3.2.1 Head losses in the tail race tunnel
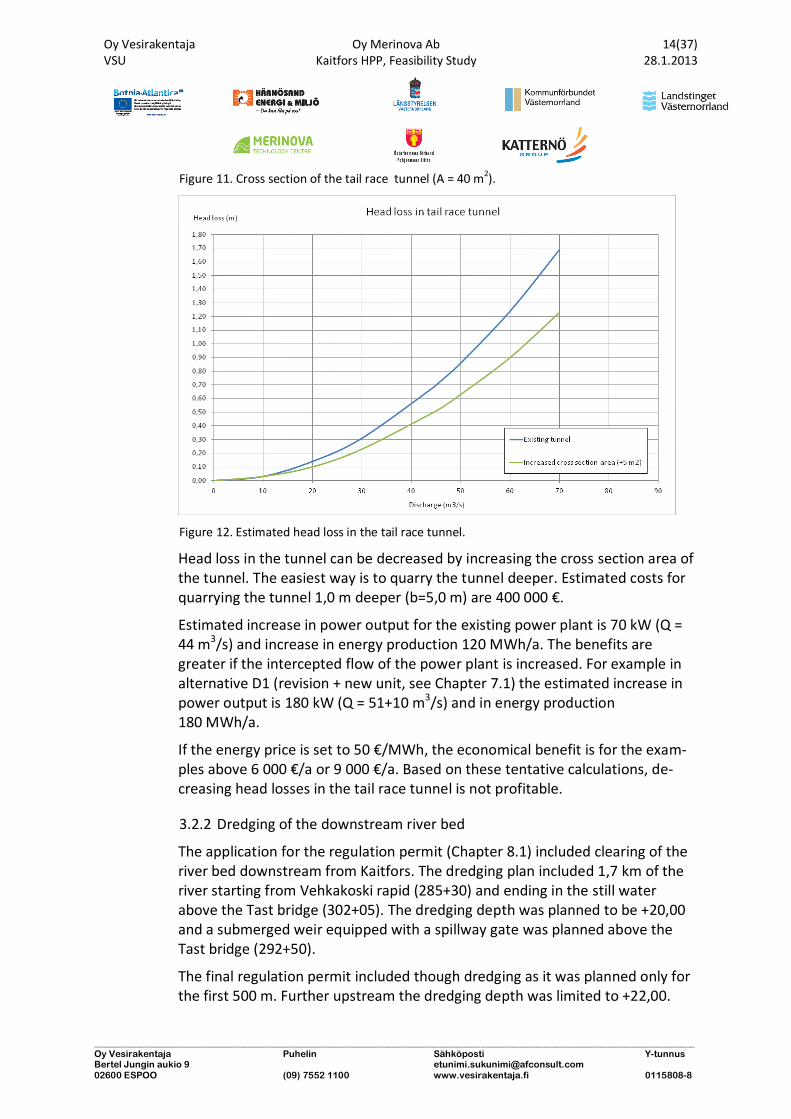
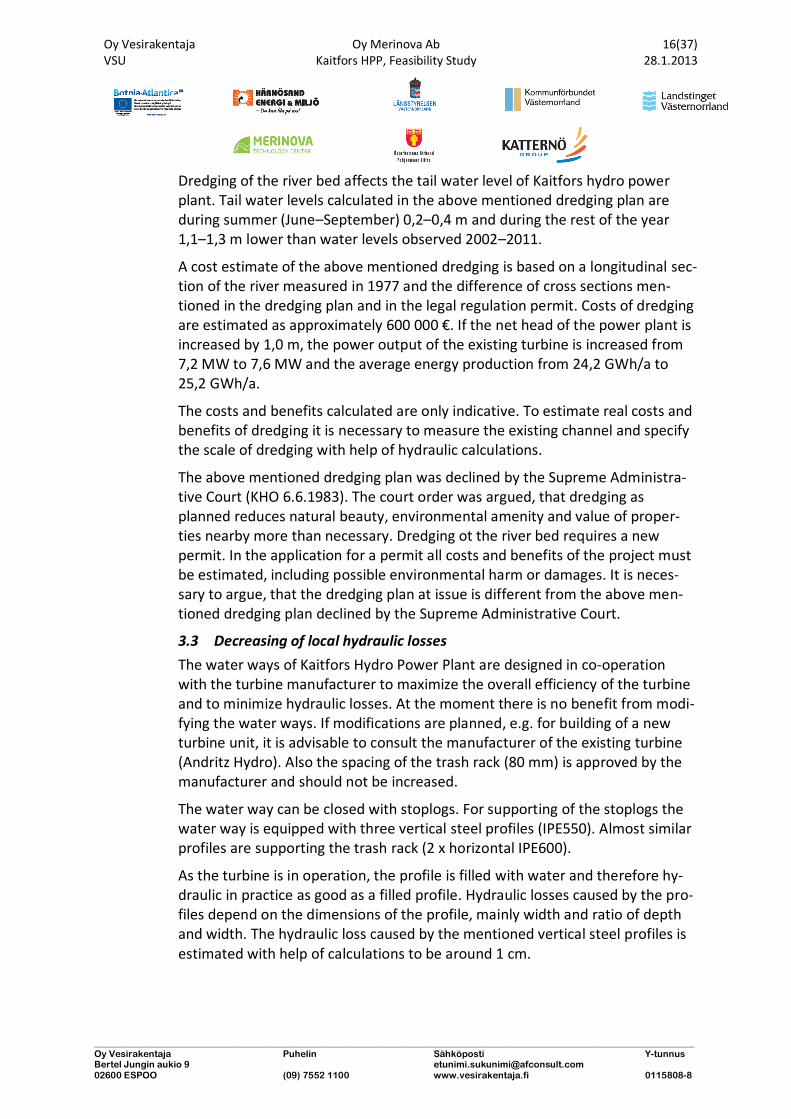
The friction head loss in the tail race tunnel (Figure 1) was calculated with the Colebrook-White equation. For calculation reasons the tunnel was simplified as a uniform tunnel. With help of one measured value (hf = 0,72 m at 46 m3/s) the roughness height was calibrated as k = 0,19 m. The results are presented in Fig-ure 12.
Oy Vesirakentaja Oy Merinova Ab 14(37) VSU Kaitfors HPP, Feasibility Study 28.1.2013
_________________________________________________________________________________________________________________________________ Oy Vesirakentaja Puhelin Sähköposti Y-tunnus Bertel Jungin aukio 9 [email protected] 02600 ESPOO (09) 7552 1100 www.vesirakentaja.fi 0115808-8
Figure 11. Cross section of the tail race tunnel (A = 40 m2).
Figure 12. Estimated head loss in the tail race tunnel.
Head loss in the tunnel can be decreased by increasing the cross section area of the tunnel. The easiest way is to quarry the tunnel deeper. Estimated costs for quarrying the tunnel 1,0 m deeper (b=5,0 m) are 400 000 €.
Estimated increase in power output for the existing power plant is 70 kW (Q = 44 m3/s) and increase in energy production 120 MWh/a. The benefits are greater if the intercepted flow of the power plant is increased. For example in alternative D1 (revision + new unit, see Chapter 7.1) the estimated increase in power output is 180 kW (Q = 51+10 m3/s) and in energy production 180 MWh/a.
If the energy price is set to 50 €/MWh, the economical benefit is for the exam-ples above 6 000 €/a or 9 000 €/a. Based on these tentative calculations, de-creasing head losses in the tail race tunnel is not profitable.
3.2.2 Dredging of the downstream river bed
The application for the regulation permit (Chapter 8.1) included clearing of the river bed downstream from Kaitfors. The dredging plan included 1,7 km of the river starting from Vehkakoski rapid (285+30) and ending in the still water above the Tast bridge (302+05). The dredging depth was planned to be +20,00 and a submerged weir equipped with a spillway gate was planned above the Tast bridge (292+50).
The final regulation permit included though dredging as it was planned only for the first 500 m. Further upstream the dredging depth was limited to +22,00.

Oy Vesirakentaja Oy Merinova Ab 15(37) VSU Kaitfors HPP, Feasibility Study 28.1.2013
_________________________________________________________________________________________________________________________________ Oy Vesirakentaja Puhelin Sähköposti Y-tunnus Bertel Jungin aukio 9 [email protected] 02600 ESPOO (09) 7552 1100 www.vesirakentaja.fi 0115808-8
The submerged weir is located 150 m downstream and no spillway gate is in-cluded.
Oy Vesirakentaja Oy Merinova Ab 16(37) VSU Kaitfors HPP, Feasibility Study 28.1.2013
_________________________________________________________________________________________________________________________________ Oy Vesirakentaja Puhelin Sähköposti Y-tunnus Bertel Jungin aukio 9 [email protected] 02600 ESPOO (09) 7552 1100 www.vesirakentaja.fi 0115808-8
Dredging of the river bed affects the tail water level of Kaitfors hydro power plant. Tail water levels calculated in the above mentioned dredging plan are during summer (June–September) 0,2–0,4 m and during the rest of the year 1,1–1,3 m lower than water levels observed 2002–2011.
A cost estimate of the above mentioned dredging is based on a longitudinal sec-tion of the river measured in 1977 and the difference of cross sections men-tioned in the dredging plan and in the legal regulation permit. Costs of dredging are estimated as approximately 600 000 €. If the net head of the power plant is increased by 1,0 m, the power output of the existing turbine is increased from 7,2 MW to 7,6 MW and the average energy production from 24,2 GWh/a to 25,2 GWh/a.
The costs and benefits calculated are only indicative. To estimate real costs and benefits of dredging it is necessary to measure the existing channel and specify the scale of dredging with help of hydraulic calculations.
The above mentioned dredging plan was declined by the Supreme Administra-tive Court (KHO 6.6.1983). The court order was argued, that dredging as planned reduces natural beauty, environmental amenity and value of proper-ties nearby more than necessary. Dredging ot the river bed requires a new permit. In the application for a permit all costs and benefits of the project must be estimated, including possible environmental harm or damages. It is neces-sary to argue, that the dredging plan at issue is different from the above men-tioned dredging plan declined by the Supreme Administrative Court.
3.3 Decreasing of local hydraulic losses
The water ways of Kaitfors Hydro Power Plant are designed in co-operation with the turbine manufacturer to maximize the overall efficiency of the turbine and to minimize hydraulic losses. At the moment there is no benefit from modi-fying the water ways. If modifications are planned, e.g. for building of a new turbine unit, it is advisable to consult the manufacturer of the existing turbine (Andritz Hydro). Also the spacing of the trash rack (80 mm) is approved by the manufacturer and should not be increased.
The water way can be closed with stoplogs. For supporting of the stoplogs the water way is equipped with three vertical steel profiles (IPE550). Almost similar profiles are supporting the trash rack (2 x horizontal IPE600).
As the turbine is in operation, the profile is filled with water and therefore hy-draulic in practice as good as a filled profile. Hydraulic losses caused by the pro-files depend on the dimensions of the profile, mainly width and ratio of depth and width. The hydraulic loss caused by the mentioned vertical steel profiles is estimated with help of calculations to be around 1 cm.
Oy Vesirakentaja Oy Merinova Ab 17(37) VSU Kaitfors HPP, Feasibility Study 28.1.2013
_________________________________________________________________________________________________________________________________ Oy Vesirakentaja Puhelin Sähköposti Y-tunnus Bertel Jungin aukio 9 [email protected] 02600 ESPOO (09) 7552 1100 www.vesirakentaja.fi 0115808-8
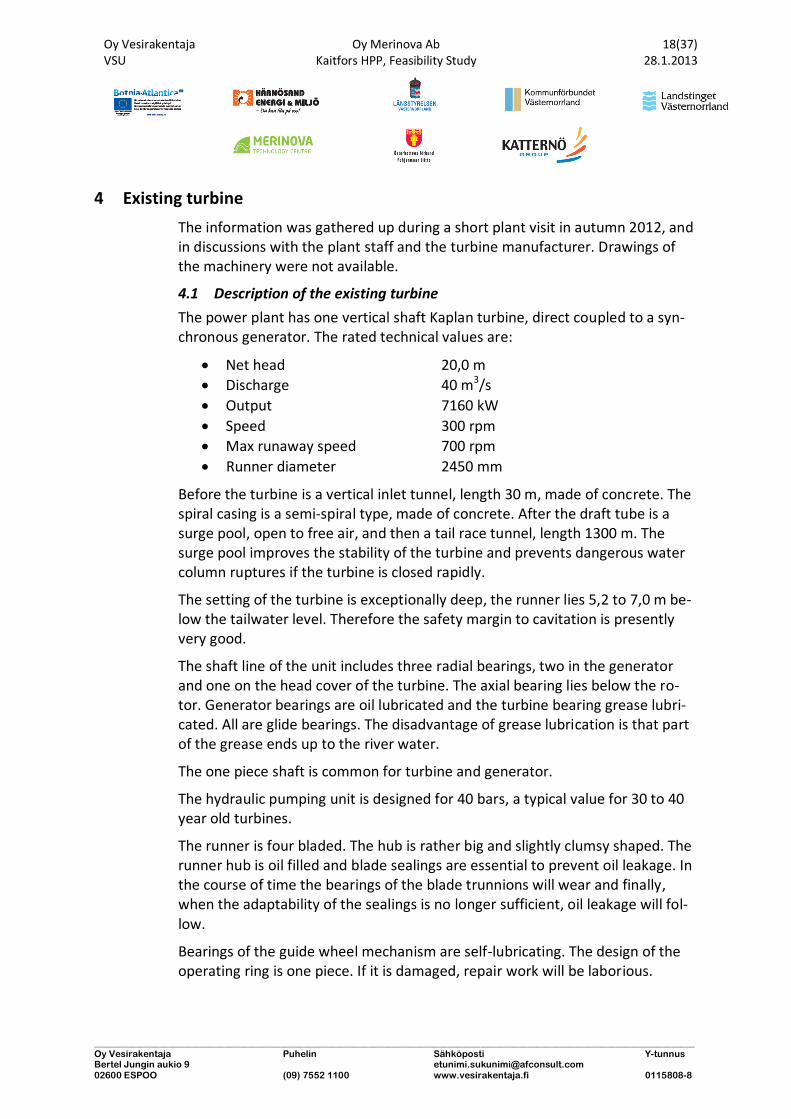
If the vertical profiles are removed, building of a coffer dam is much more com-plicated. Hydraulic losses caused by the mentioned steel profiles are so small, that redesign of the profiles is not profitable.
Figure 13. Vertical steel profiles (IPE550) at the intake of the power plant.
3.4 Improvement of regulation
Energy calculations in this study are based on mean daily values of discharge and water levels. If a new smaller turbine unit is installed, discharge can be held more constant. This is essential between the spring flood and July 15th, when the short time regulation is not allowed. Short time regulation is however still an important issue during the rest of the year, due to changes of energy price during the day. Improving of short time regulation requires regulation calcula-tions and estimation of energy pricing. This issue is not included in this study.
Oy Vesirakentaja Oy Merinova Ab 18(37) VSU Kaitfors HPP, Feasibility Study 28.1.2013
_________________________________________________________________________________________________________________________________ Oy Vesirakentaja Puhelin Sähköposti Y-tunnus Bertel Jungin aukio 9 [email protected] 02600 ESPOO (09) 7552 1100 www.vesirakentaja.fi 0115808-8
4 Existing turbine
The information was gathered up during a short plant visit in autumn 2012, and in discussions with the plant staff and the turbine manufacturer. Drawings of the machinery were not available.
4.1 Description of the existing turbine
The power plant has one vertical shaft Kaplan turbine, direct coupled to a syn-chronous generator. The rated technical values are:
Net head 20,0 m
Discharge 40 m3/s
Output 7160 kW
Speed 300 rpm
Max runaway speed 700 rpm
Runner diameter 2450 mm
Before the turbine is a vertical inlet tunnel, length 30 m, made of concrete. The spiral casing is a semi-spiral type, made of concrete. After the draft tube is a surge pool, open to free air, and then a tail race tunnel, length 1300 m. The surge pool improves the stability of the turbine and prevents dangerous water column ruptures if the turbine is closed rapidly.
The setting of the turbine is exceptionally deep, the runner lies 5,2 to 7,0 m be-low the tailwater level. Therefore the safety margin to cavitation is presently very good.
The shaft line of the unit includes three radial bearings, two in the generator and one on the head cover of the turbine. The axial bearing lies below the ro-tor. Generator bearings are oil lubricated and the turbine bearing grease lubri-cated. All are glide bearings. The disadvantage of grease lubrication is that part of the grease ends up to the river water.
The one piece shaft is common for turbine and generator.
The hydraulic pumping unit is designed for 40 bars, a typical value for 30 to 40 year old turbines.
The runner is four bladed. The hub is rather big and slightly clumsy shaped. The runner hub is oil filled and blade sealings are essential to prevent oil leakage. In the course of time the bearings of the blade trunnions will wear and finally, when the adaptability of the sealings is no longer sufficient, oil leakage will fol-low.
Bearings of the guide wheel mechanism are self-lubricating. The design of the operating ring is one piece. If it is damaged, repair work will be laborious.

Oy Vesirakentaja Oy Merinova Ab 19(37) VSU Kaitfors HPP, Feasibility Study 28.1.2013
_________________________________________________________________________________________________________________________________ Oy Vesirakentaja Puhelin Sähköposti Y-tunnus Bertel Jungin aukio 9 [email protected] 02600 ESPOO (09) 7552 1100 www.vesirakentaja.fi 0115808-8
4.2 Condition of existing turbine
4.2.1 General
The turbine has operated 30 years and no major renovation has been carried out so far. Based on experience, a thorough renovation will normally be neces-sary in 10 years.
The site visit and statements of the staff indicated that the turbine is in fairly good condition.
4.2.2 Guide wheel
The most worrying trouble is the stiffness of the guide wheel operation. The ex-cess friction can be caused by:
Bearings of the operating ring
Bearings of the guide vanes
Operation of the actuator cylinder
The very probable reason here are the bearings of the operation ring. The bear-ings are self-lubricating, but they lie in very dirty and wet conditions. The mat-ing surfaces for the bearings are of mild steel and very probably the surfaces are badly corroded and worn, which causes high friction.
The design of the operating ring seems rather flexible. Under the actuator force the distortion will compound the risk of jamming.
The joint bearing of the actuator cylinder was observed to be very dirty because of the leaking concrete sediments, but this is hardly the main reason for stiff-ness.
Considering the above mentioned, there is a risk of a total jamming of the op-eration ring and an unexpected interruption of power production. If the jam-ming occurs at runaway situation, the closing shall be accomplished by the in-take gate. It is recommended to ensure that the gate is capable to close in case of turbine runaway.
If further inspections show that the bearings of the operation ring are in poor condition, the best procedure would be a planned reparation, preferably in connection with a major renovation.
4.2.3 Runner
The operation of the runner has been reasonable. New sealings were assem-bled some years ago for the blades.
One issue to be considered is the cavitation on the hub. In spite of good cavita-tion margin, some older runners operating at heads around 20 m or higher, have suffered of hub cavitation. Hydrodynamically this area is very complicated.
Oy Vesirakentaja Oy Merinova Ab 20(37) VSU Kaitfors HPP, Feasibility Study 28.1.2013
_________________________________________________________________________________________________________________________________ Oy Vesirakentaja Puhelin Sähköposti Y-tunnus Bertel Jungin aukio 9 [email protected] 02600 ESPOO (09) 7552 1100 www.vesirakentaja.fi 0115808-8
Before modern flow analysis methods used nowadays, it was very difficult to design the hub correctly. The material of the hub in Kaitfors is ductile cast iron, which is difficult to repair by welding.
Due to better design hub cavitation can be avoided in modern runners even with increased flow capacity.
When a major turbine renovation is planned, it is usually worth to consider a new runner. Replacing of the runner in Kaitfors with a new one brings several benefits:
Because of the good cavitation safety margin, the maximum flow capac-ity can be increased and more energy produced in flood periods. With the present tailwater levels the maximum flow can be increased ap-proximately to 51…55 m3/s, depending on the supplier and blade type. If the maximum flow is 51 m3/s, the efficiency may be about 0,5 to 1,0 % higher than with a runner for 55 m3/s. Considering some specific runner type, if tailwater level will be lowered by one meter, the maximum dis-charge shall be decreased by about 2 m3/s. It is possible to keep the maximum discharge in spite of lower tailwater by using a runner with a larger blade area, but if the speed remains at 300 rpm, the efficiency will be lower.
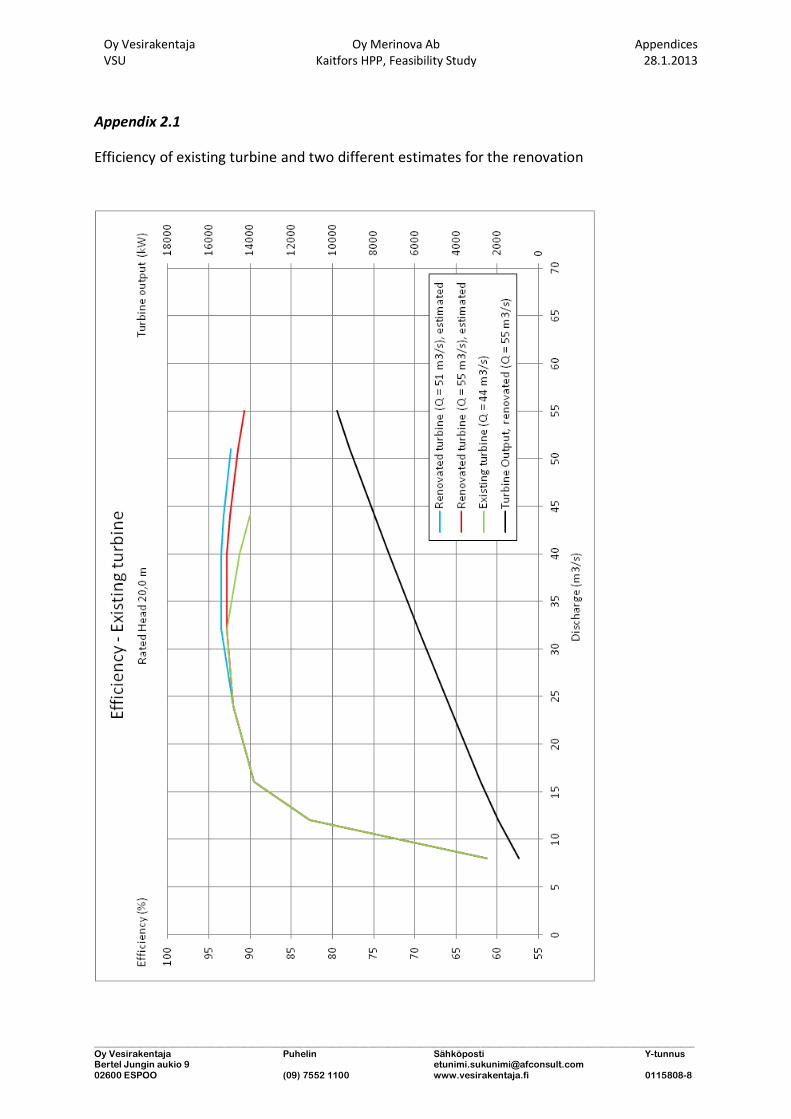
The efficiency of the turbine will increase compared to the original guar-antee values at flows higher than 20 m3/s. The increase at maximum flow will be several percent points. At discharges lower than 20 m3/s, the efficiency probably cannot be increased. The efficiency of the exist-ing turbine at the moment is probably decreased a little, because of wear and damages. Efficiency curves of the turbine are shown in Ap-pendix 2.1.
The design can be changed to a water-filled hub, which is environmen-tally safer.
The hub cavitation will be eliminated in spite of higher flow capacity.
4.2.4 Shaft
If the flow capacity is increased to 55 m3/s, the output of the turbine will in-crease. At Hnet = 20,0 m the output would be about 9800 kW. The question arises if the turbine shaft can last it.
The nominal diameter of the shaft is 450 mm and fortunately it seems to be fairly over dimensioned: the nominal stress level is only about 50 % of normal values. There are some sharp roundings near the lower flange but they can be machined smoother. In fact the safety of the lower part of the shaft can be even better at 9800 kW, compared to the safety now at 7160 kW (Q=40 m3/s, Hnet=20,0 m).
Oy Vesirakentaja Oy Merinova Ab 21(37) VSU Kaitfors HPP, Feasibility Study 28.1.2013
_________________________________________________________________________________________________________________________________ Oy Vesirakentaja Puhelin Sähköposti Y-tunnus Bertel Jungin aukio 9 [email protected] 02600 ESPOO (09) 7552 1100 www.vesirakentaja.fi 0115808-8
At the upper part of the shaft are large keyways for the rotor. For increased output the safety margin of the keyways has to be calculated beforehand.
Also the margin for the critical speed has to be calculated, because the maxi-mum runaway speed of the new runner may be higher.
Sometimes corrosion will weaken the immersed part of the shaft. This is proba-bly not the case in Kaitfors, because lubricating grease has protected the most critical area.
4.2.5 Guide bearing
The grease lubricated guide bearing has operated reliably. It has, however, some drawbacks:
Part of the grease ends up to the river water
Part of the grease gets on the head cover causing dirt and slipperiness
An environmentally better solution is a self-lubricating or a water lubricated bearing. The shaft shall be equipped with a stainless liner for the bearing and shaft seal.
4.2.6 Runner chamber and submerged steel parts
The runner chamber is of stainless steel and without doubt in good condition.
Other submerged mild steel surfaces, e.g. at draft tube, will need painting and possibly injection of loose concrete.
4.2.7 Index-test
An index-test was carried out in May–June 2012. The purpose of an index-test is to find the optimal combination of runner blade angle and guide vane angle at every load and net head. In the test the discharge is measured relatively. In re-ality the relativity is valid only at small operation range, e.g. in one propeller curve. Sometimes, however, the shape of the whole Kaplan curve is assessed on the basis of index-test results. The accuracy is poor if the observation points are far away each other.
The test results raise however doubt, that the efficiency at discharge 16 m3/s is about 2 % lower than the guaranteed value. The difference may however lie in the margin of error.
4.2.8 Hydraulic pressure unit
If a new runner with higher flow capacity will be purchased, it is recommend-able to replace the hydraulic oil system by a high pressure system. This will give advantages for the necessary actuator force in the runner hub and for the nec-essary longer stroke of the guide wheel actuator. Also the total amount of oil will be reduced considerably.
Oy Vesirakentaja Oy Merinova Ab 22(37) VSU Kaitfors HPP, Feasibility Study 28.1.2013
_________________________________________________________________________________________________________________________________ Oy Vesirakentaja Puhelin Sähköposti Y-tunnus Bertel Jungin aukio 9 [email protected] 02600 ESPOO (09) 7552 1100 www.vesirakentaja.fi 0115808-8
5 Existing Generator
The nominal output of the existing generator is 9 MW. It is assumed by the owner of the power plant (Perhonjoki Oy), that there is no need for a renova-tion of the generator. This issue is not further investigated in this study, but it must be taken into account when the revision of the existing turbine is planned more detailed.
6 New turbine unit
6.1 Alternatives
The intercepted flow of the existing turbine in Kaitfors is 8–44 m3/s. The effi-ciency of the turbine is low at small discharges, the optimal range being about 15–44 m3/s. Short time regulation is possible, but some limits are set in the permit of the power plant and by authorities. Short time regulation is not fur-ther investigated in this study. A small, adjustable turbine is therefore needed especially during summer time, when the inflow is small and short time regula-tion is not allowed (see Chapter 2.2).
The power house building in Kaitfors is part of the regulating dam and the power plant is connected back to the river with a 1,2 km long tail race tunnel. In practice the only feasible option is to build the new turbine unit near the exist-ing power house and to use the existing tail race tunnel.
Probably the most profitable option is to place the new turbine and its intake pipe completely inside the existing power house, this alternative is discussed more detailed in Chapter 6.2. Other possibilities are digging the intake pipe through the dam or placing the pipeline over the dam as an siphon intake sys-tem. Regardless of the type of the intake pipe, the new turbine can be placed inside the existing power house or in a new building at the downstream side of the existing building.
The main advantage from digging the intake pipe through the dam or building a siphon pipe over the dam is, that the existing and the new turbine would have separate water ways. During maintenance breaks the other turbine could be used for energy production without interruptions. However, maintenance works of the existing turbine that require emptying of the intake pipe of the power plant for a longer period are very rare. The intake pipe for the new tur-bine unit as discussed in Chapter 6.2 can be equipped with a valve to close the pipe during maintenance works.
A separate intake pipe has also several disadvantages. Digging through the earth dam must be planned carefully to assure dam safety, and the construc-tion works require a cofferdam in front of the earth dam. Modifications in the state-owned dam require permission from the owner. A long pipe around the
Oy Vesirakentaja Oy Merinova Ab 23(37) VSU Kaitfors HPP, Feasibility Study 28.1.2013
_________________________________________________________________________________________________________________________________ Oy Vesirakentaja Puhelin Sähköposti Y-tunnus Bertel Jungin aukio 9 [email protected] 02600 ESPOO (09) 7552 1100 www.vesirakentaja.fi 0115808-8
power house causes additional hydraulic losses and the construction costs are probably higher than for a shorter pipe inside the existing building.
If the need of separate water ways for the turbines is essential, a siphon intake system for the new turbine is probably a better alternative. Modifications in the earth dam and a coffer dam are not necessary. However, also this option is probably more expensive than a shorter pipe inside the existing building.
If a new additional turbine unit is seen as profitable, a more detailed study in-cluding offers from different turbine vendors is advisable.
6.2 New turbine-generator unit inside the existing powerhouse
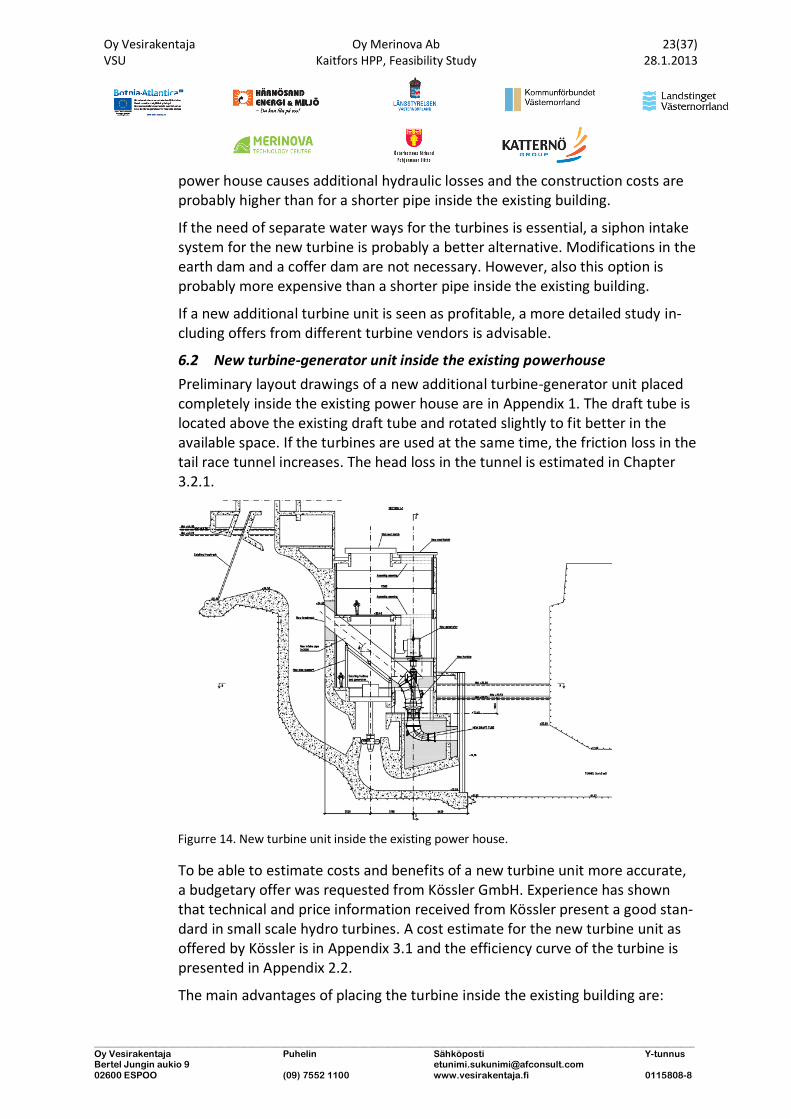
Preliminary layout drawings of a new additional turbine-generator unit placed completely inside the existing power house are in Appendix 1. The draft tube is located above the existing draft tube and rotated slightly to fit better in the available space. If the turbines are used at the same time, the friction loss in the tail race tunnel increases. The head loss in the tunnel is estimated in Chapter 3.2.1.
Figurre 14. New turbine unit inside the existing power house.
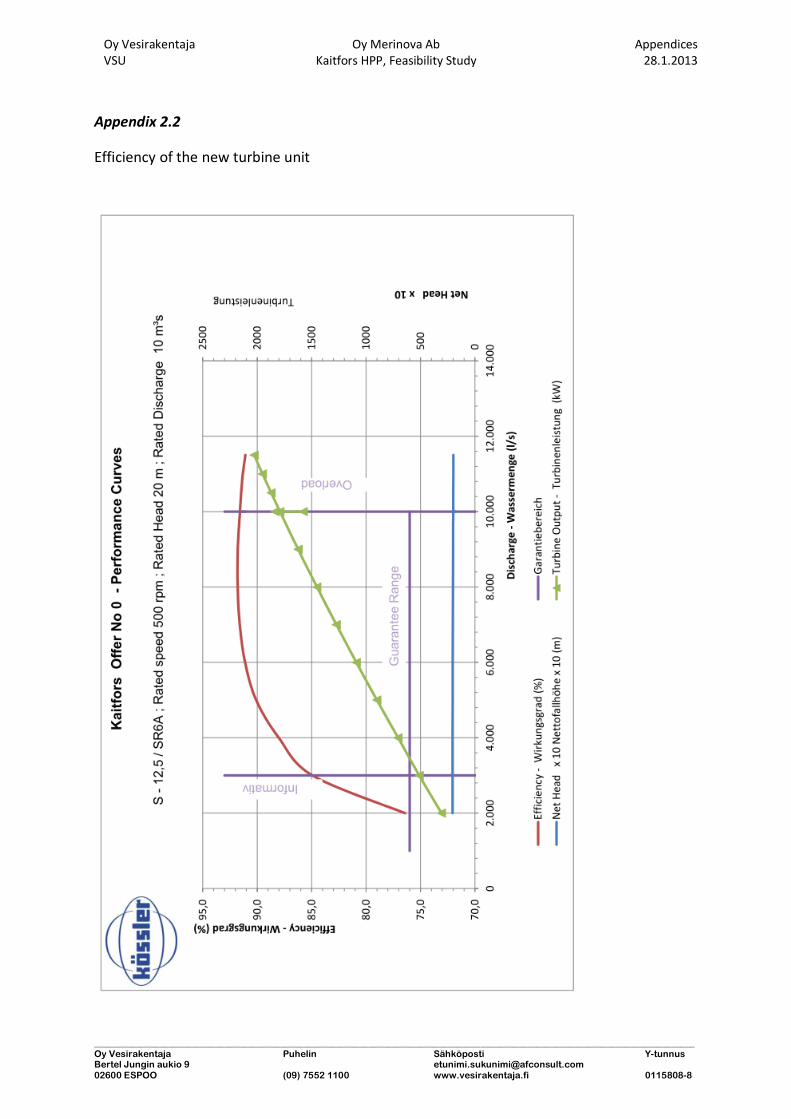
To be able to estimate costs and benefits of a new turbine unit more accurate, a budgetary offer was requested from Kössler GmbH. Experience has shown that technical and price information received from Kössler present a good stan-dard in small scale hydro turbines. A cost estimate for the new turbine unit as offered by Kössler is in Appendix 3.1 and the efficiency curve of the turbine is presented in Appendix 2.2.
The main advantages of placing the turbine inside the existing building are:
Oy Vesirakentaja Oy Merinova Ab 24(37) VSU Kaitfors HPP, Feasibility Study 28.1.2013
_________________________________________________________________________________________________________________________________ Oy Vesirakentaja Puhelin Sähköposti Y-tunnus Bertel Jungin aukio 9 [email protected] 02600 ESPOO (09) 7552 1100 www.vesirakentaja.fi 0115808-8
+ No need to appeal a modification to the legal permit of the power plant
+ Small civil works compared to a completely new power house building
+ Short intake pipe compared to a pipe around the power house, as dis-cussed in Chapter 6.1
On the other hand, the main difficulties are:
– Organisation of the construction works of the new draft tube aree diffi-cult and costly. Most of the work can be done as normal building inside the existing concrete walls of the building. Building a coffer dam in front of the draft tube is difficult and therefore pulling down the old wall and the lower part of the draft tube must be done as under water work with help of divers.
– The existing turbine has to be stopped for some periods, when the wa-ter ways of the new and old turbines are combined
– Cleaning of the new trash rack is difficult. The trash rack is set in direc-tion of the flow in the old intake, so that flow (v > 1,5 m/s) will for some part keep the new trash rack clean. To allow cleaning of the trash rack manually, a manhole can be build at the side or below the trash rack. To clean the trash rack, the intake gate must be closed and the water level in the intake lowered below the new trash rack.
– The ventilation and drainage system of the building must be partly re-designed and rebuild, as the new turbine is placed in the existing air shaft and leak water pump sump.
– The available space in the existing building sets limitations to the size of the new turbine. Hydraulic losses in the new intake pipe increase rapidly as flow velocity increases. The maximum pipe diameter to fit in the ex-
isting building is about 2000. In a pipe this large flow velocity and hy-draulic loss in the pipe remain at a reasonable level at a discharge of 10 m3/s. For the alternative from Kössler increasing the discharge to 11 m3/s would require to lower the runner by almost 2 m. This would in-crease the costs of the civil works significantly. The optimum size of the new turbine depends also of the short time regulation, which is not fur-ther investigated in this study.
7 Economy
7.1 Increasing hydraulic head
7.1.1 Dredging of the downstream river bed
Costs and benefits of dredging the downstream river bed must be planned more detailed to be able to estimate profitability.
Oy Vesirakentaja Oy Merinova Ab 25(37) VSU Kaitfors HPP, Feasibility Study 28.1.2013
_________________________________________________________________________________________________________________________________ Oy Vesirakentaja Puhelin Sähköposti Y-tunnus Bertel Jungin aukio 9 [email protected] 02600 ESPOO (09) 7552 1100 www.vesirakentaja.fi 0115808-8
Based on old field surveying data and dredging plans (Chapter 3.2.2) show however, that dredging is from economic point of view worth a more detailed analysis.
7.1.2 Increasing the cross section area of the tale race tunnel
Estimated costs for quarrying the tunnel 1,0 m deeper (b=5,0 m) are 400 000 €. Estimated increase in power output is however only 70–180 kW and in energy production 120–180 MWh/a, depending on the chosen alternative.
The tentative cost-benefit analysis shows, that increasing the cross section area of the tunnel is not profitable.
Oy Vesirakentaja Oy Merinova Ab 26(37) VSU Kaitfors HPP, Feasibility Study 28.1.2013
_________________________________________________________________________________________________________________________________ Oy Vesirakentaja Puhelin Sähköposti Y-tunnus Bertel Jungin aukio 9 [email protected] 02600 ESPOO (09) 7552 1100 www.vesirakentaja.fi 0115808-8
7.2 Energy production and power output of turbine alternatives
Mean monthly and annual energy production was calculated from average daily discharge values with the following initial data:
Average daily values of discharge (turbine, fish way, spill water), top wa-ter level measured above trash rack, tailwater level below the draft tube. Observation period 10 years (2002–2011).
Estimated interdependence between discharge and head water level, based on observations (see Figure 9 on page 12). Head water level of the power plant depends on the water level of Lake Isojärvi. Due to fric-tion losses in the river channel the difference of the water levels in-creases as discharge increases.
Estimated interdependence between discharge and tailwater level, based on observations (see Figure 10 on page 12).
Estimated hydraulic losses. Trash rack and tunnel for the existing tur-bine; trash rack, intake pipe and tunnel for the new turbine unit. The tail water levels observed above the tunnel include head loss in the tunnel for Q < 48 m3/s (maximum turbine flow during the observation period 2001–2011). In the alternatives, where maximum usable flow of the power plant is increased, additional friction loss in the tunnel is taken into account (Chapter 3.2.1)
Turbine efficiency. For the existing turbine guaranteed efficiency values given by the manufacturer are used. Increasing of efficiency and opera-tion range due to rehabilitation of the existing turbine is estimated with experience of Oy Vesirakentaja and the guarantee values of the existing turbine. Efficiency and operation range of the new turbine is based on the budgetary offer from Kössler GmbH.
Generator efficiency. Efficiency of the existing generator is estimated with experience of Oy Vesirakentaja and one known value (7,2 MW). Ef-ficiency of the generator for the new, smaller turbine is based on the budgetary offer from Kössler GmbH.
The average energy production was calculated for the following alternatives. To be able to compare the different alternatives, also energy production for the existing turbine was calculated instead of using actual energy production. The power output is given for the turbine/turbines only.
Oy Vesirakentaja Oy Merinova Ab 27(37) VSU Kaitfors HPP, Feasibility Study 28.1.2013
_________________________________________________________________________________________________________________________________ Oy Vesirakentaja Puhelin Sähköposti Y-tunnus Bertel Jungin aukio 9 [email protected] 02600 ESPOO (09) 7552 1100 www.vesirakentaja.fi 0115808-8
A) Existing hydro power plant
Intercepted flow 8–44 m3/s (manufacturers limitation 500 h/a for Q>40 m3/s is not taken into account)
P = 7,8 MW (44 m3/s, Hnet = 20,00 m)
B1) Revision of existing turbine Intercepted flow 8–51m3/s
P = 9,2 MW (51 m3/s, Hnet = 20,00 m)
B2) Revision of existing turbine Intercepted flow 8–55m3/s
P = 9,8 MW (55 m3/s, Hnet = 20,00 m)
C) New turbine unit and existing hydro power plant Combined intercepted flow 2–44 m3/s
P = 7,8 MW (44 m3/s, Hnet = 20,00 m) P = 1,8 MW (10 m3/s, Hnet = 20,00 m, new turbine)
D1) New turbine unit and revision of existing turbine Combined intercepted flow 2–51 m3/s
P = 9,2 MW (51 m3/s, Hnet = 20,00 m) P = 1,8 MW (10 m3/s, Hnet = 20,00 m, new turbine)
D2) New turbine unit and revision of existing turbine Combined intercepted flow 2–55 m3/s
P = 9,8 MW (55 m3/s, Hnet = 20,00 m) P = 1,8 MW (10 m3/s, Hnet = 20,00 m, new turbine)
7.3 Cost-benefit analysis of turbine alternatives
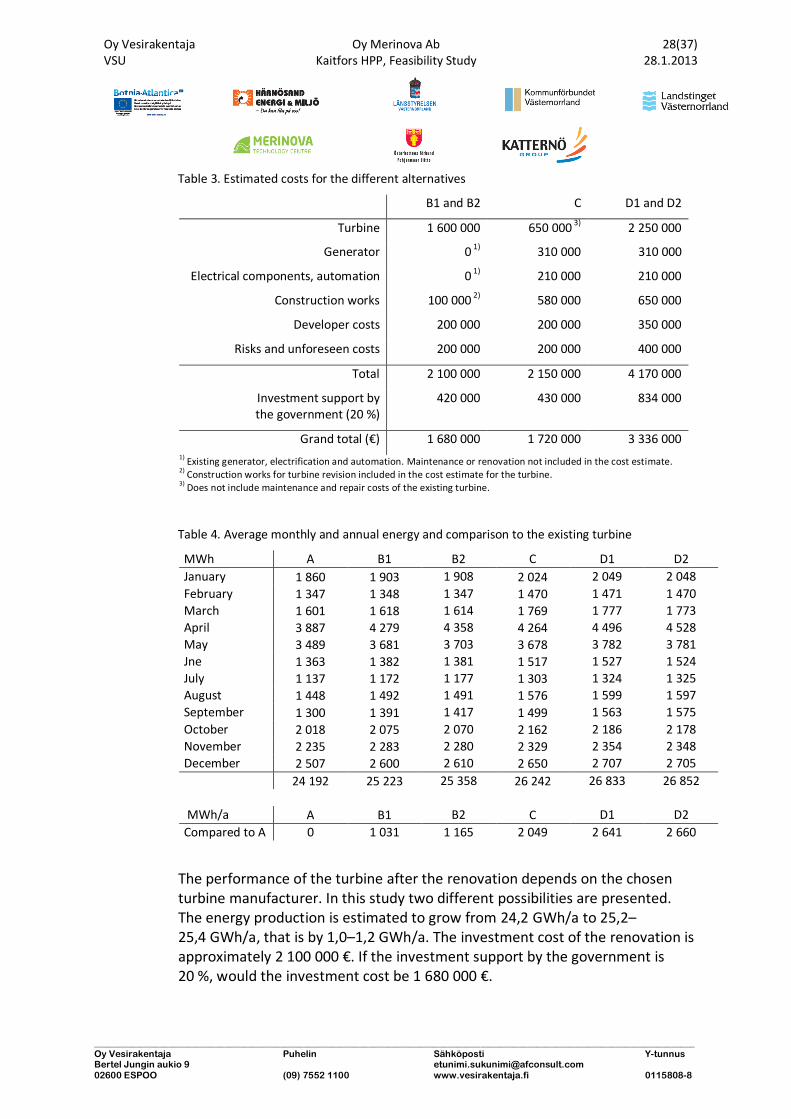
Estimated costs and energy production for the alternatives are shown in Table 3 and Table 4.
The Finnish government supports investments in renewable energy. The amount of support depends of the project, but also of other renewable energy projects applying support in the same year. The maximum support for conven-tional hydro power projects is 30 % of the total costs, typically 15–20 %.
If the new turbine unit is built as a separate project, losses in energy production for the existing turbine must be taken into account. The interruptions in energy productions are estimated to be about one month. If the construction works are scheduled outside flood times in spring, energy losses are in average 1100–2500 MWh/month.
Oy Vesirakentaja Oy Merinova Ab 28(37) VSU Kaitfors HPP, Feasibility Study 28.1.2013
_________________________________________________________________________________________________________________________________ Oy Vesirakentaja Puhelin Sähköposti Y-tunnus Bertel Jungin aukio 9 [email protected] 02600 ESPOO (09) 7552 1100 www.vesirakentaja.fi 0115808-8
Table 3. Estimated costs for the different alternatives
B1 and B2 C D1 and D2
Turbine 1 600 000 650 000 3) 2 250 000
Generator 0 1) 310 000 310 000
Electrical components, automation 0 1) 210 000 210 000
Construction works 100 000 2) 580 000 650 000
Developer costs 200 000 200 000 350 000
Risks and unforeseen costs 200 000 200 000 400 000
Total 2 100 000 2 150 000 4 170 000
Investment support by the government (20 %)
420 000 430 000 834 000
Grand total (€) 1 680 000 1 720 000 3 336 000 1)
Existing generator, electrification and automation. Maintenance or renovation not included in the cost estimate. 2)
Construction works for turbine revision included in the cost estimate for the turbine. 3)
Does not include maintenance and repair costs of the existing turbine.
Table 4. Average monthly and annual energy and comparison to the existing turbine
MWh A B1 B2 C D1 D2
January 1 860 1 903 1 908 2 024 2 049 2 048
February 1 347 1 348 1 347 1 470 1 471 1 470
March 1 601 1 618 1 614 1 769 1 777 1 773
April 3 887 4 279 4 358 4 264 4 496 4 528
May 3 489 3 681 3 703 3 678 3 782 3 781
Jne 1 363 1 382 1 381 1 517 1 527 1 524
July 1 137 1 172 1 177 1 303 1 324 1 325
August 1 448 1 492 1 491 1 576 1 599 1 597
September 1 300 1 391 1 417 1 499 1 563 1 575
October 2 018 2 075 2 070 2 162 2 186 2 178
November 2 235 2 283 2 280 2 329 2 354 2 348
December 2 507 2 600 2 610 2 650 2 707 2 705
24 192 25 223 25 358 26 242 26 833 26 852
MWh/a A B1 B2 C D1 D2
Compared to A 0 1 031 1 165 2 049 2 641 2 660
The performance of the turbine after the renovation depends on the chosen turbine manufacturer. In this study two different possibilities are presented. The energy production is estimated to grow from 24,2 GWh/a to 25,2–25,4 GWh/a, that is by 1,0–1,2 GWh/a. The investment cost of the renovation is approximately 2 100 000 €. If the investment support by the government is 20 %, would the investment cost be 1 680 000 €.
Oy Vesirakentaja Oy Merinova Ab 29(37) VSU Kaitfors HPP, Feasibility Study 28.1.2013
_________________________________________________________________________________________________________________________________ Oy Vesirakentaja Puhelin Sähköposti Y-tunnus Bertel Jungin aukio 9 [email protected] 02600 ESPOO (09) 7552 1100 www.vesirakentaja.fi 0115808-8
The additional power output and energy compared to the existing turbine is not the only benefit. Better reliability, decreased maintenance costs and extended life time expectation of the turbine after the revision must also be taken into account. On the other hand, if the turbine output is increased significantly, it may be necessary to upgrade the generator as well. Thus calculating a payback time based on the additional energy only is not reasonable.
A new turbine unit can be build additional to the renovation of the existing tur-bine. The additional energy production from the new turbine is then approxi-mately 1,5–1,6 GWh/a.
Another option is to build the new turbine without a thorough renovation of the existing turbine. The additional energy, approximately 2,0 GWh/a, would be achieved from the new turbine unit only.
Investment costs for the new turbine unit are with the investment support 1 720 000 €. Repair and maintenance costs to keep up the performance and working order of the existing turbine or energy losses due to interruptions in the use of the existing turbine during the construction works are not included.
If the energy price is 50 €/MWh and the investment support 20 %, is the inter-est-free payback time for the new turbine without upgrading the existing tur-bine 17 years.
8 Legal prerequisites
8.1 Permits
The building and operation of Kaitfors hydro power plant is regulated by two legal permits.
Permit for the hydro power plant:
Länsi-Suomen vesioikeuden päätös N:o 49/1982 C (27.8.1982)
Regulation permit:
Länsi-Suomen vesioikeus, N:o 48/1982 C (27.8.1982)
Korkein hallinto-oikeus, N:o 2114 (6.6.1983)
8.2 Rising of head water level
Rising of the head water level at Kaitfors requires a modification to the legal regulation permit.
A prerequisite for applying a change in the regulation permit is a comprehen-sive evaluation of damages for every lakeside property of the regulated lakes. The licensing authority (Länsi- ja Sisä-Suomen aluehallintovirasto) would then compare the costs and benefits of rising the high water level of Isojärvi.
Oy Vesirakentaja Oy Merinova Ab 30(37) VSU Kaitfors HPP, Feasibility Study 28.1.2013
_________________________________________________________________________________________________________________________________ Oy Vesirakentaja Puhelin Sähköposti Y-tunnus Bertel Jungin aukio 9 [email protected] 02600 ESPOO (09) 7552 1100 www.vesirakentaja.fi 0115808-8
8.3 Lowering of tailwater level
8.3.1 Tail race tunnel
Increasing the flow area of the tail race tunnel requires a modification to the le-gal permit of the power plant.
8.3.2 Dredging of the downstream river bed
Lowering the tail water level by dredging the river channel downstream from the tail race tunnel requires a new permit according to the Water Act (587/2011).
Perhonjoki is further downstream protected by the Act protecting rapids in Finnland (koskiensuojelulaki 35/1987). The protected part of the river is be-tween the railroad bridge and Murikinkoski. Thus improving feasibility in Kait-fors is not limited by this Act protecting rapids, as long as dredging is planned only above Murikinkoski.
8.4 Rehabilitation of existing turbine
The discharge through the power plant is not limited. As long as the require-ments for the minimum spill in the fish way and former river bed and the regu-lation schedule are taken into account, no new permits are needed.
8.5 New turbine-generator unit inside existing powerhouse
The amount of discharge through the power plant is not limited. As long as the requirements for the minimum spill in the former river bed and the regulation schedule are taken into account, no new permits according the Water Act are needed.
Building of the new turbine unit requires modifications in the existing power house building and it might be necessary to apply a building permit (Land Use and Building Act 132/1999) from the municipality of Kruunupyy. The facade or the use of the building is not changed, but e.g. modifications in the ventilation system require a building permit.
8.6 New turbine-generator unit in a new powerhouse building
Building the new turbine unit inside a new building requires a permit according the Water Act (587/2011) and a building permit according the Land Use and Building Act 132/1999).
Oy Vesirakentaja Oy Merinova Ab 31(37) VSU Kaitfors HPP, Feasibility Study 28.1.2013
_________________________________________________________________________________________________________________________________ Oy Vesirakentaja Puhelin Sähköposti Y-tunnus Bertel Jungin aukio 9 [email protected] 02600 ESPOO (09) 7552 1100 www.vesirakentaja.fi 0115808-8
9 Conclusions
9.1 General
About three quarters of all hydro power plants in Finland are smaller than 10 MW, and more than half of all hydro power plants have a capacity less than 2 MW. Thus improving feasibility of a small-scale hydroelectric power plant is also of general interest.
Improving feasibility is not a straightforward investment decision. This study presents the usual subjects to be investigated. The main focus is usually on the existing turbine, but also the possibilities to build an additional turbine, rise head water, lower tail water or methods to decrease hydraulic losses and thereby increase net head of a power plant should be investigated.
Especially in very small hydro power plants it is not profitable to investigate every possibility in detail, but the study should be done at least so far that the significance of different actions can be estimated.
9.2 Conclusions and recommendations for Kaitfors
9.2.1 Increasing of hydraulic head
Based on tentative calculations, dredging of the downstream river bed is from economic point of view worth a more detailed analysis. However, this alterna-tive contains legal difficulties to be solved; dredging of the channel is already once declined by the Supreme Administrative Court.
Based on tentative calculations, other options to increase hydraulic head are not profitable. The possibilities considered in this study were rising of head wa-ter level, decreasing of head losses in the tail race tunnel and decreasing of other local hydraulic losses in the waterways of the power plant.
9.2.2 Revision of existing turbine
Kaitfors hydro power plant is built 1983 and no major renovation has been car-ried out so far. The existing turbine is in fairly good condition, but based on ex-perience, a thorough renovation will be necessary in about 10 years. Depending on the schedule of the renovation, some minor repairs may be affordable al-ready earlier, e.g. solving the stiffness problem of the guide wheel.
The performance of the turbine after the renovation depends on the chosen al-ternative. In this study are two different possibilities presented, maximum dis-charge 51 or 55 m3/s. The energy production is estimated to increase from 24,2 GWh/a to 25,2–25,4 GWh/a, that is by 1,0–1,2 GWh/a. The total costs of the renovation are approximately 2,1 M€. If the investment support by the government would be on average level of 20 %, the total cost would be 1,7 M€.
Oy Vesirakentaja Oy Merinova Ab 32(37) VSU Kaitfors HPP, Feasibility Study 28.1.2013
_________________________________________________________________________________________________________________________________ Oy Vesirakentaja Puhelin Sähköposti Y-tunnus Bertel Jungin aukio 9 [email protected] 02600 ESPOO (09) 7552 1100 www.vesirakentaja.fi 0115808-8
The turbine revision to certain extend within reasonable time is simply a must. In addition to power output and energy production, also better reliability, de-creased maintenance costs and considerably extended life time of the turbine after the revision must be taken into account. On the other hand, if the turbine output is increased significantly, it may be necessary to upgrade the generator as well. Thus calculating a payback time based on the additional energy only is not reasonable.
9.2.3 New turbine unit
A new turbine unit can be build additional to the renovation of the existing tur-bine, as discussed above. In this option the additional energy production from the new turbine unit is approximately 1,5–1,6 GWh/a.
Another option is to build the new turbine unit and limit the renovation of the existing turbine to a minimum. The performance and working order of the exist-ing turbine would be kept up with smaller repair and maintenance works. The additional energy, approximately 2,0 GWh/a, would be achieved from the new turbine unit only.
The total costs for the new turbine unit are approximately 2,2 M€. If the in-vestment support by the government is 20 %, would the cost be 1,7 M€. Calcu-lating with an energy price of 50 €/MWh, additional energy production 2,0 GWh/a and the investment support 20 %, is the interest-free payback time for the new turbine unit 17 years. This may be acceptable for long term hydro power investments in general.
Depending partly on the rehabilitation of the existing turbine, a new smaller turbine unit may be feasible. However, for a more accurate cost estimate it would be necessary to have binding offers from turbine manufacturers and to make a more detailed plan of the corresponding civil works.
Espoo 28.1.2013
OY VESIRAKENTAJA
Oy Vesirakentaja Oy Merinova Ab Appendices VSU Kaitfors HPP, Feasibility Study 28.1.2013
_________________________________________________________________________________________________________________________________ Oy Vesirakentaja Puhelin Sähköposti Y-tunnus Bertel Jungin aukio 9 [email protected] 02600 ESPOO (09) 7552 1100 www.vesirakentaja.fi 0115808-8
Appendices
Appendix 1 Drawings
1.1 General map
1.2 New turbine unit
Appendix 2 Efficiencies of turbine and generator
2.1 Efficiency of existing turbine and two different estimates for the renovation
2.2 Efficiency of the new turbine unit
2.3 Combined efficiency of existing turbine and new turbine unit together, used for energy calculations. Both turbine and generator included.
Appendix 3 Cost estimates
3.1 Cost estimate for the new turbine unit
Oy Vesirakentaja Oy Merinova Ab Appendices VSU Kaitfors HPP, Feasibility Study 28.1.2013
_________________________________________________________________________________________________________________________________ Oy Vesirakentaja Puhelin Sähköposti Y-tunnus Bertel Jungin aukio 9 [email protected] 02600 ESPOO (09) 7552 1100 www.vesirakentaja.fi 0115808-8
Appendix 2.1
Efficiency of existing turbine and two different estimates for the renovation
Oy Vesirakentaja Oy Merinova Ab Appendices VSU Kaitfors HPP, Feasibility Study 28.1.2013
_________________________________________________________________________________________________________________________________ Oy Vesirakentaja Puhelin Sähköposti Y-tunnus Bertel Jungin aukio 9 [email protected] 02600 ESPOO (09) 7552 1100 www.vesirakentaja.fi 0115808-8
Appendix 2.2
Efficiency of the new turbine unit
Oy Vesirakentaja Oy Merinova Ab Appendices VSU Kaitfors HPP, Feasibility Study 28.1.2013
_________________________________________________________________________________________________________________________________ Oy Vesirakentaja Puhelin Sähköposti Y-tunnus Bertel Jungin aukio 9 [email protected] 02600 ESPOO (09) 7552 1100 www.vesirakentaja.fi 0115808-8
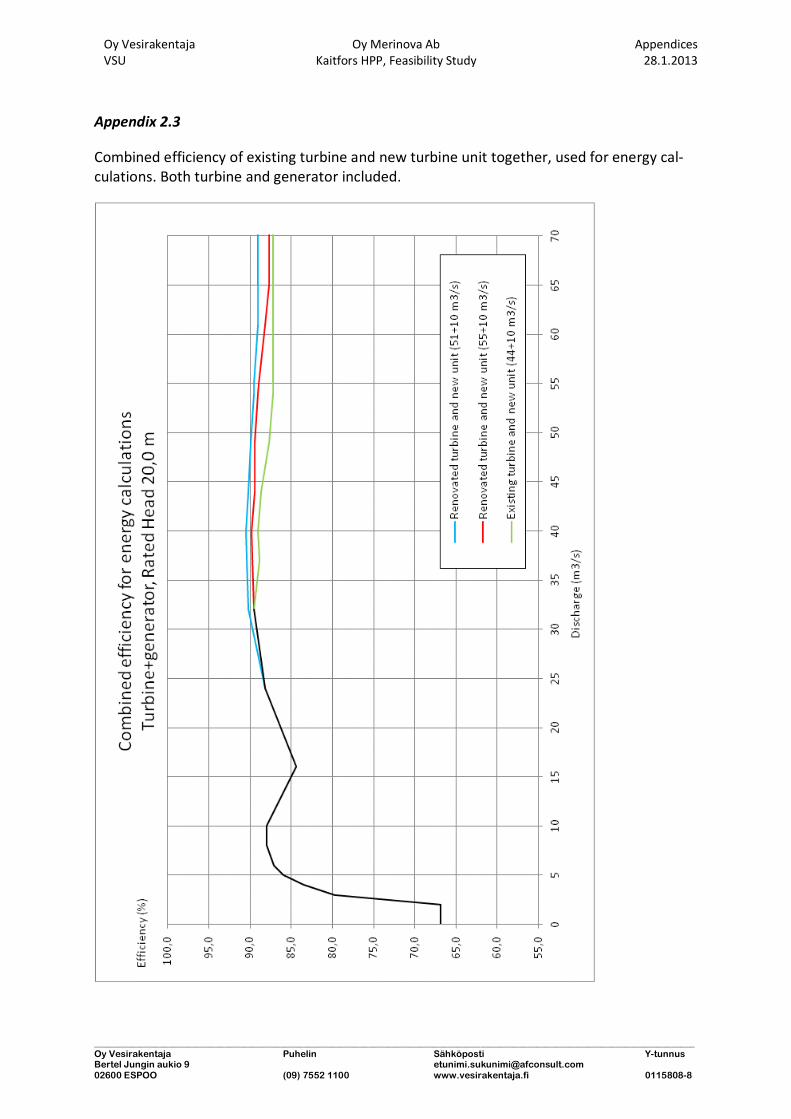
Appendix 2.3
Combined efficiency of existing turbine and new turbine unit together, used for energy cal-culations. Both turbine and generator included.
Oy Vesirakentaja Oy Merinova Ab Appendices VSU Kaitfors HPP, Feasibility Study 28.1.2013
_________________________________________________________________________________________________________________________________ Oy Vesirakentaja Puhelin Sähköposti Y-tunnus Bertel Jungin aukio 9 [email protected] 02600 ESPOO (09) 7552 1100 www.vesirakentaja.fi 0115808-8
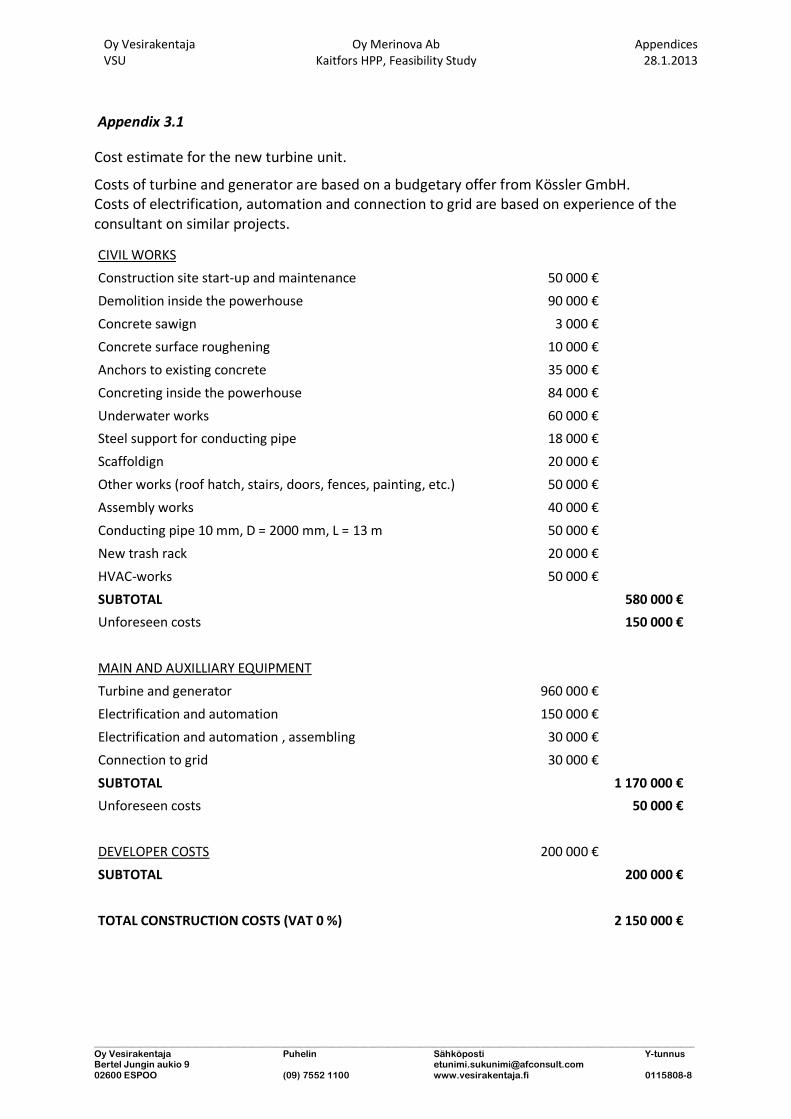
Appendix 3.1
Cost estimate for the new turbine unit.
Costs of turbine and generator are based on a budgetary offer from Kössler GmbH. Costs of electrification, automation and connection to grid are based on experience of the consultant on similar projects.
CIVIL WORKS Construction site start-up and maintenance 50 000 €
Demolition inside the powerhouse
90 000 € Concrete sawign
3 000 €
Concrete surface roughening
10 000 € Anchors to existing concrete
35 000 €
Concreting inside the powerhouse
84 000 € Underwater works
60 000 €
Steel support for conducting pipe
18 000 € Scaffoldign
20 000 €
Other works (roof hatch, stairs, doors, fences, painting, etc.) 50 000 € Assembly works
40 000 €
Conducting pipe 10 mm, D = 2000 mm, L = 13 m 50 000 € New trash rack
20 000 €
HVAC-works
50 000 € SUBTOTAL
580 000 €
Unforeseen costs 150 000 €
MAIN AND AUXILLIARY EQUIPMENT Turbine and generator
960 000 € Electrification and automation
150 000 €
Electrification and automation , assembling 30 000 € Connection to grid
30 000 €
SUBTOTAL
1 170 000 €
Unforeseen costs 50 000 €
DEVELOPER COSTS
200 000 € SUBTOTAL 200 000 €
TOTAL CONSTRUCTION COSTS (VAT 0 %)
2 150 000 €