Overview of CO2 emissions in the Arab Region: National ... · Overview of CO2 emissions in the Arab...
26
Overview of CO2 emissions in the Arab Region: National versus Sectoral Emissions Hammamet December, 2013 Economic Development and Globalisation Division
Transcript of Overview of CO2 emissions in the Arab Region: National ... · Overview of CO2 emissions in the Arab...
Overview of CO2 emissions in the Arab
Region: National versus Sectoral
Emissions
Hammamet
December, 2013
Economic Development and Globalisation Division
1. Introduction
2. World Regions and CO2 Emissions
3. Arab MDG Report: Goal 7
4. Performance of Arab Countries
– Total CO2 emissions
– CO2 emissions growth
– CO2 emissions from transport
– Sectoral CO2 emissions
5. Arab Survey on INLAND TRANSPORT CO2 EMISSIONS
6. Conclusions
Outline
Introduction
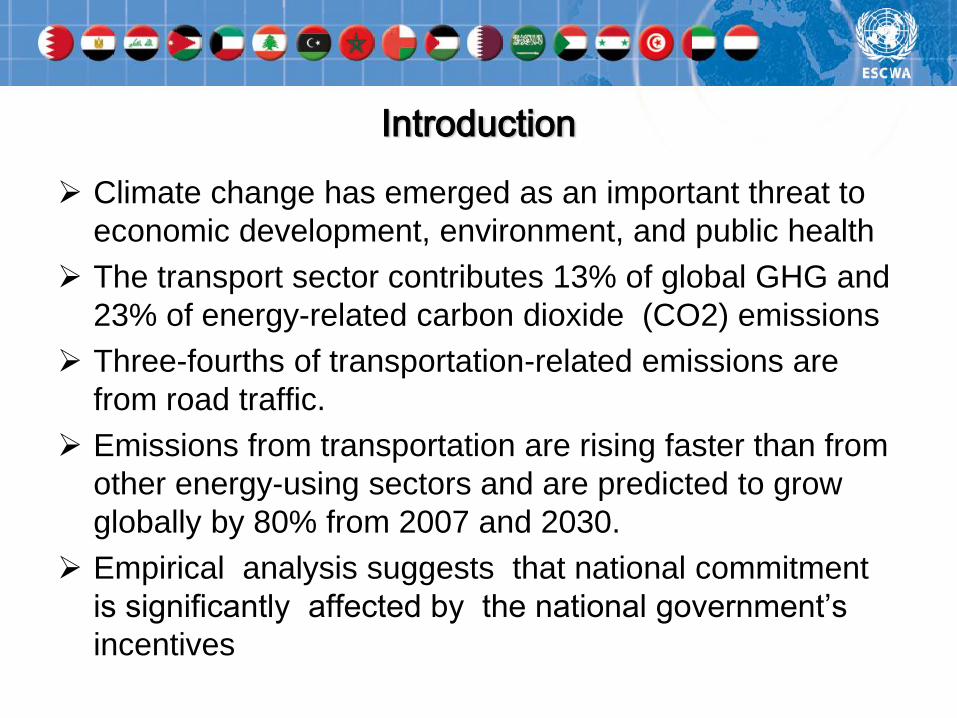
Climate change has emerged as an important threat to
economic development, environment, and public health
The transport sector contributes 13% of global GHG and
23% of energy-related carbon dioxide (CO2) emissions
Three-fourths of transportation-related emissions are
from road traffic.
Emissions from transportation are rising faster than from
other energy-using sectors and are predicted to grow
globally by 80% from 2007 and 2030.
Empirical analysis suggests that national commitment
is significantly affected by the national government’s
incentives
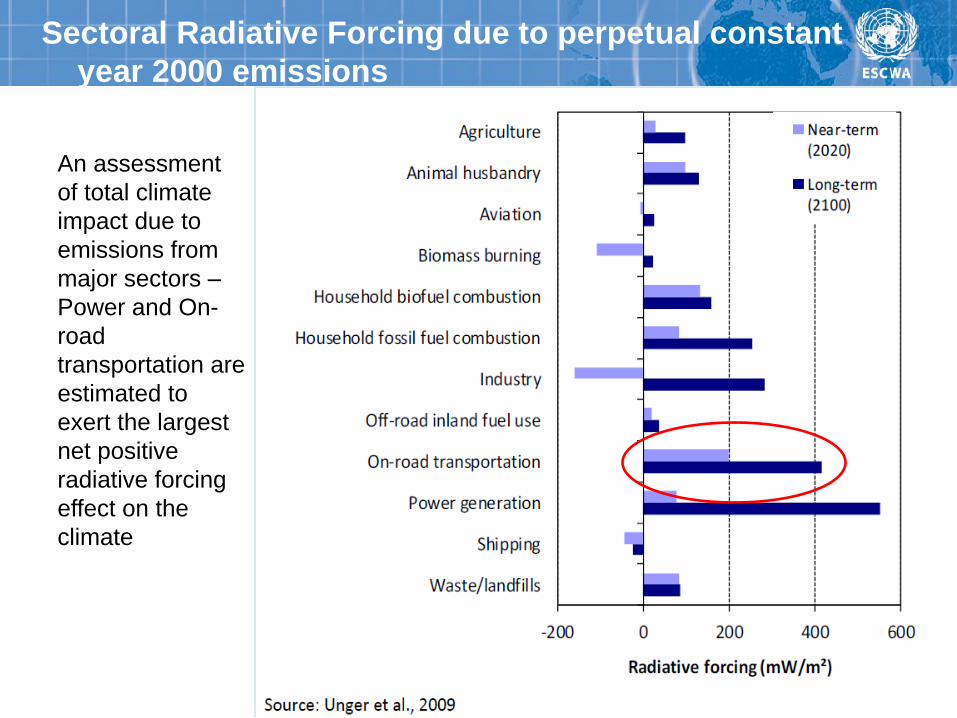
Sectoral Radiative Forcing due to perpetual constant
year 2000 emissions
An assessment
of total climate
impact due to
emissions from
major sectors –
Power and On-
road
transportation are
estimated to
exert the largest
net positive
radiative forcing
effect on the
climate
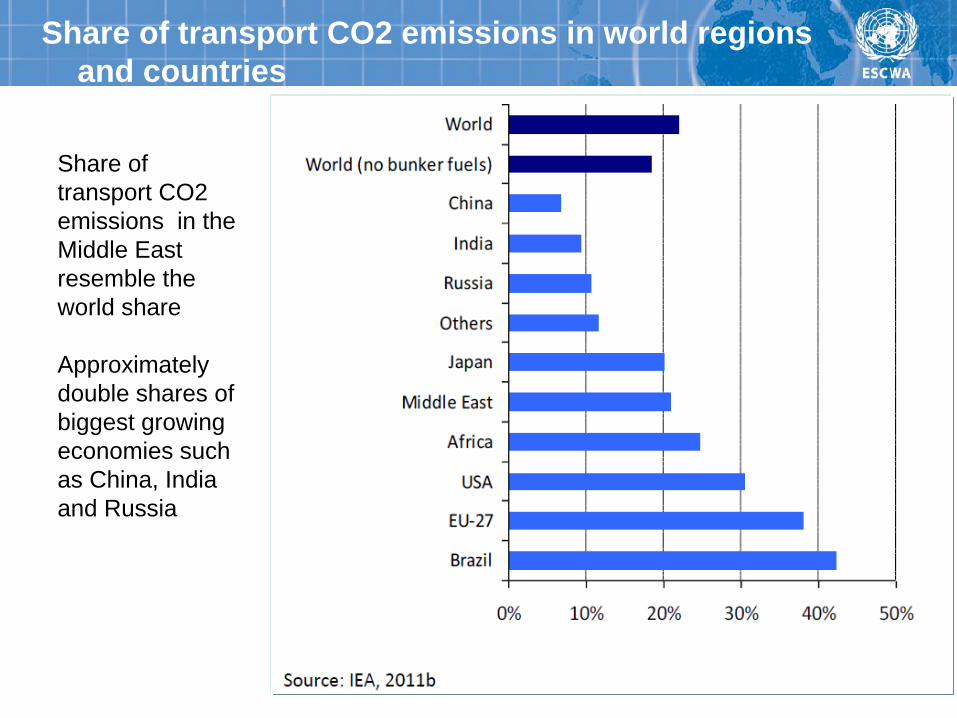
Share of transport CO2 emissions in world regions
and countries
Share of
transport CO2
emissions in the
Middle East
resemble the
world share
Approximately
double shares of
biggest growing
economies such
as China, India
and Russia
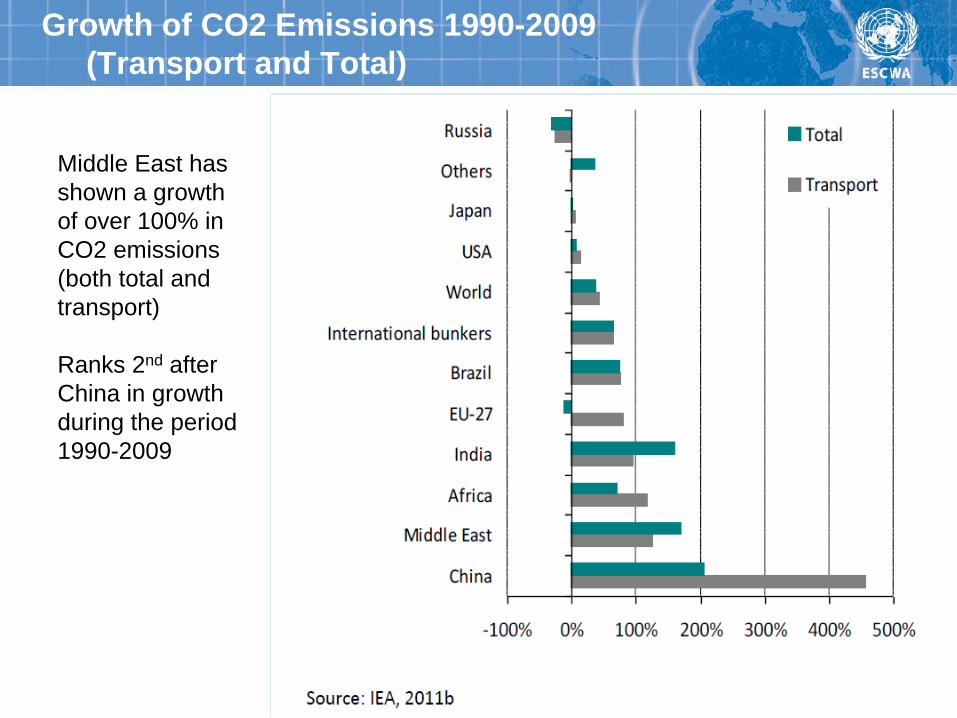
Growth of CO2 Emissions 1990-2009
(Transport and Total)
Middle East has
shown a growth
of over 100% in
CO2 emissions
(both total and
transport)
Ranks 2nd after
China in growth
during the period
1990-2009
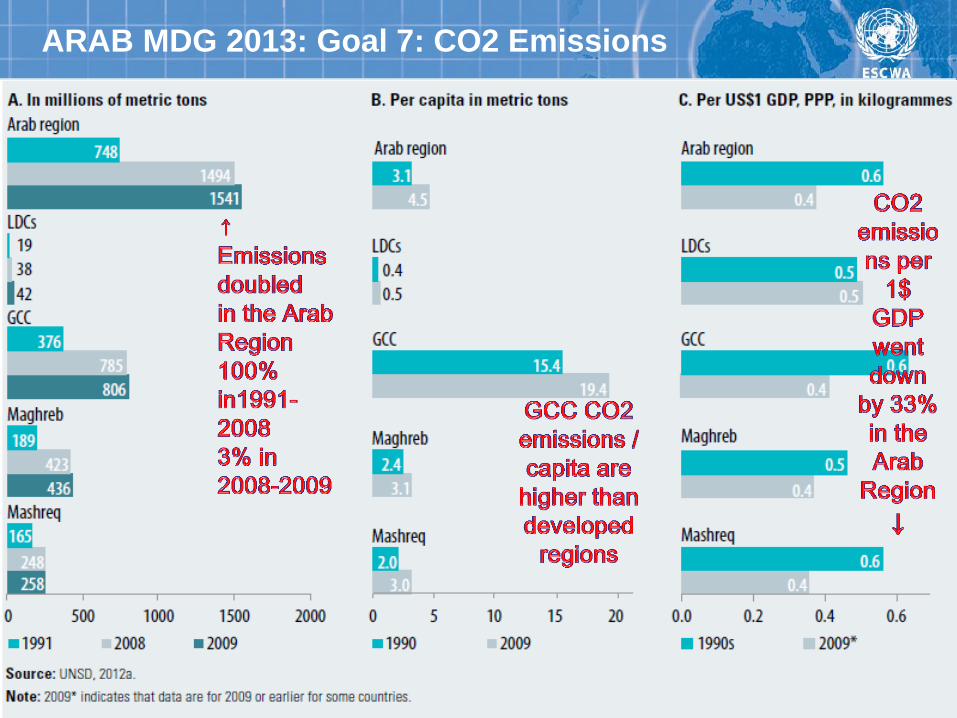
ARAB MDG 2013: Goal 7: CO2 Emissions
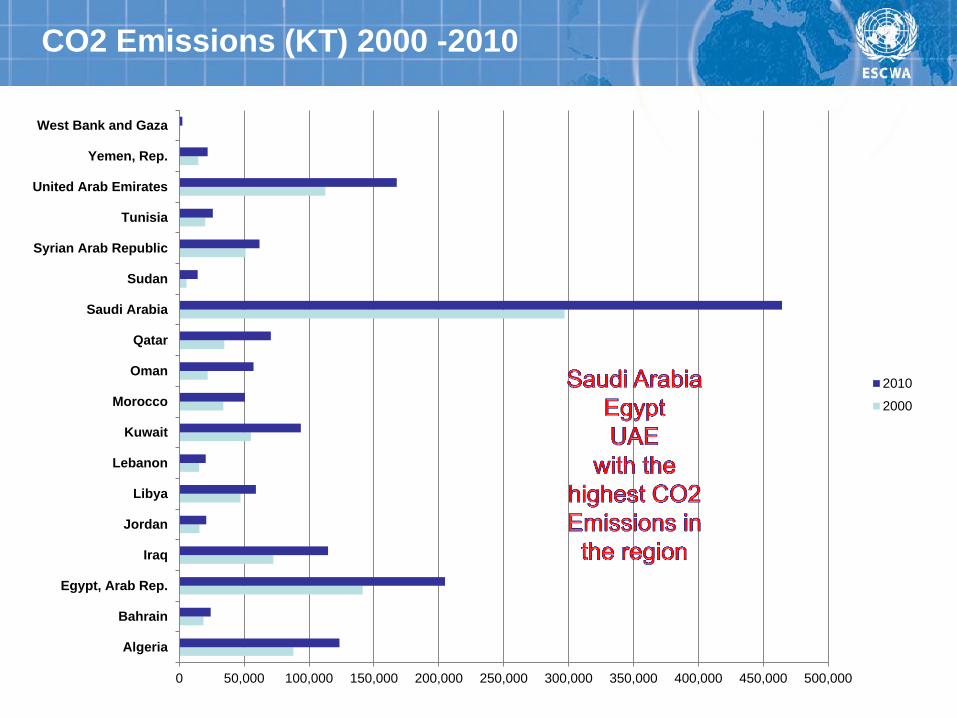
CO2 Emissions (KT) 2000 -2010
0 50,000 100,000 150,000 200,000 250,000 300,000 350,000 400,000 450,000 500,000
Algeria
Bahrain
Egypt, Arab Rep.
Iraq
Jordan
Libya
Lebanon
Kuwait
Morocco
Oman
Qatar
Saudi Arabia
Sudan
Syrian Arab Republic
Tunisia
United Arab Emirates
Yemen, Rep.
West Bank and Gaza
2010
2000
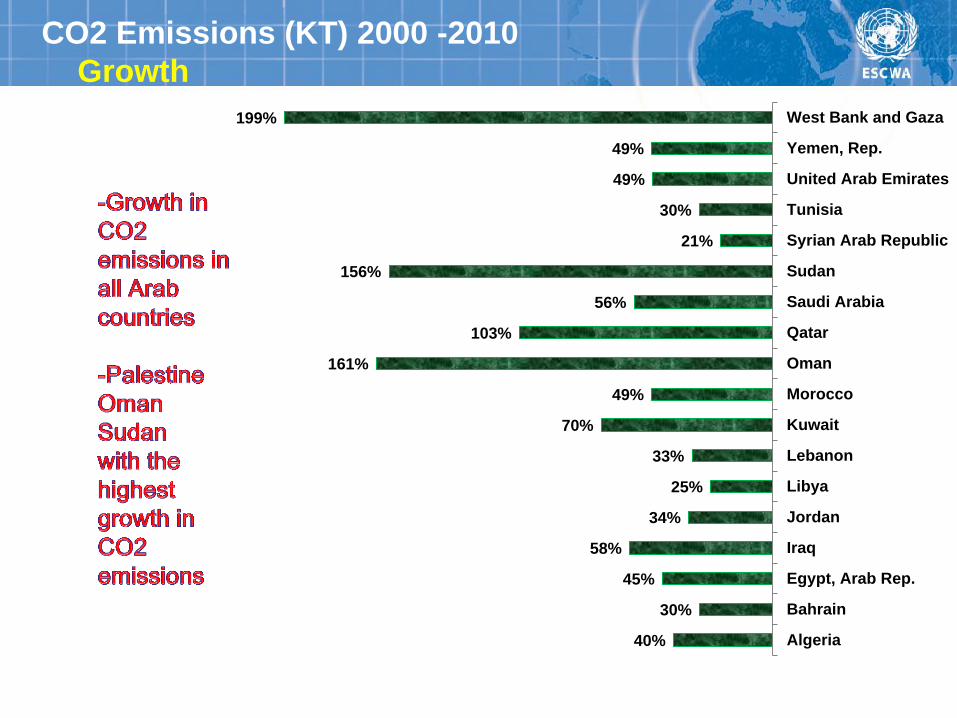
CO2 Emissions (KT) 2000 -2010
Growth
40%
30%
45%
58%
34%
25%
33%
70%
49%
161%
103%
56%
156%
21%
30%
49%
49%
199%
Algeria
Bahrain
Egypt, Arab Rep.
Iraq
Jordan
Libya
Lebanon
Kuwait
Morocco
Oman
Qatar
Saudi Arabia
Sudan
Syrian Arab Republic
Tunisia
United Arab Emirates
Yemen, Rep.
West Bank and Gaza
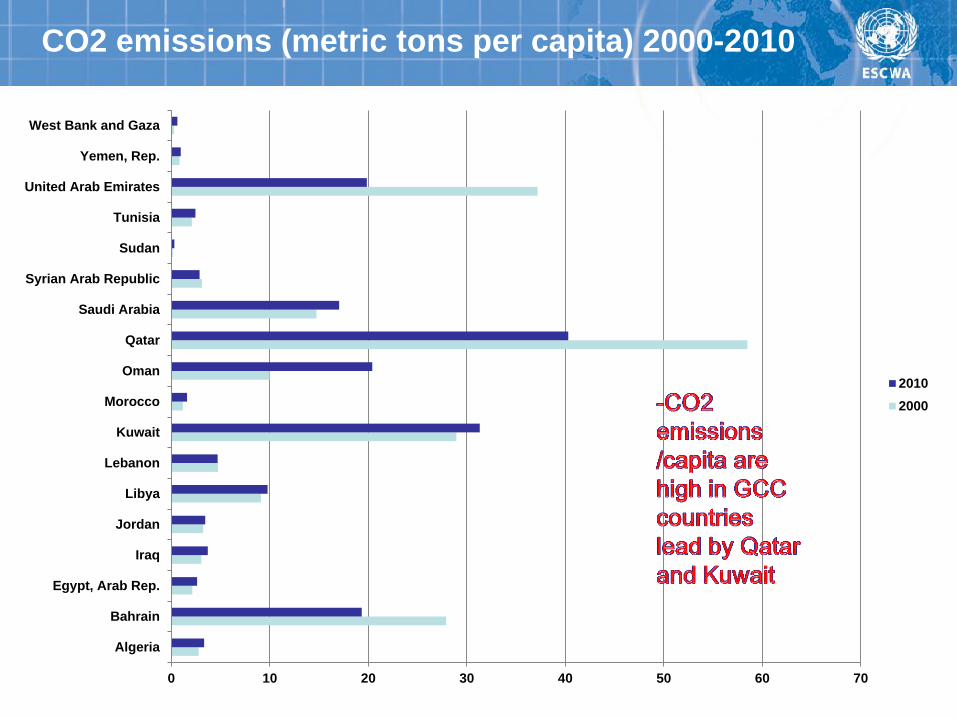
CO2 emissions (metric tons per capita) 2000-2010
0 10 20 30 40 50 60 70
Algeria
Bahrain
Egypt, Arab Rep.
Iraq
Jordan
Libya
Lebanon
Kuwait
Morocco
Oman
Qatar
Saudi Arabia
Syrian Arab Republic
Sudan
Tunisia
United Arab Emirates
Yemen, Rep.
West Bank and Gaza
2010
2000
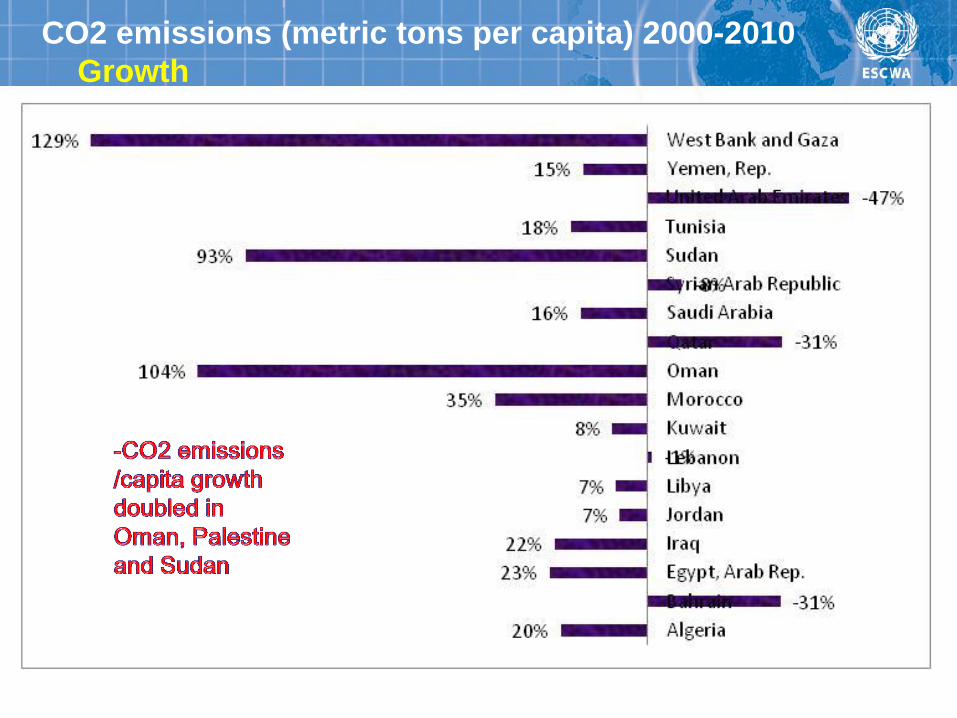
CO2 emissions (metric tons per capita) 2000-2010
Growth
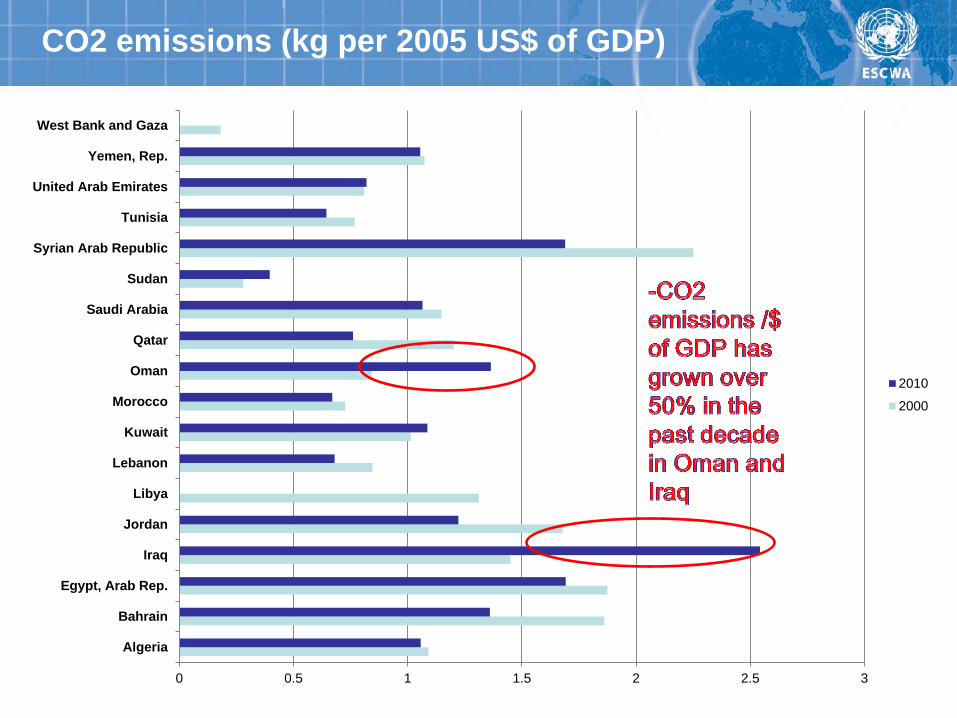
CO2 emissions (kg per 2005 US$ of GDP)
0 0.5 1 1.5 2 2.5 3
Algeria
Bahrain
Egypt, Arab Rep.
Iraq
Jordan
Libya
Lebanon
Kuwait
Morocco
Oman
Qatar
Saudi Arabia
Sudan
Syrian Arab Republic
Tunisia
United Arab Emirates
Yemen, Rep.
West Bank and Gaza
2010
2000
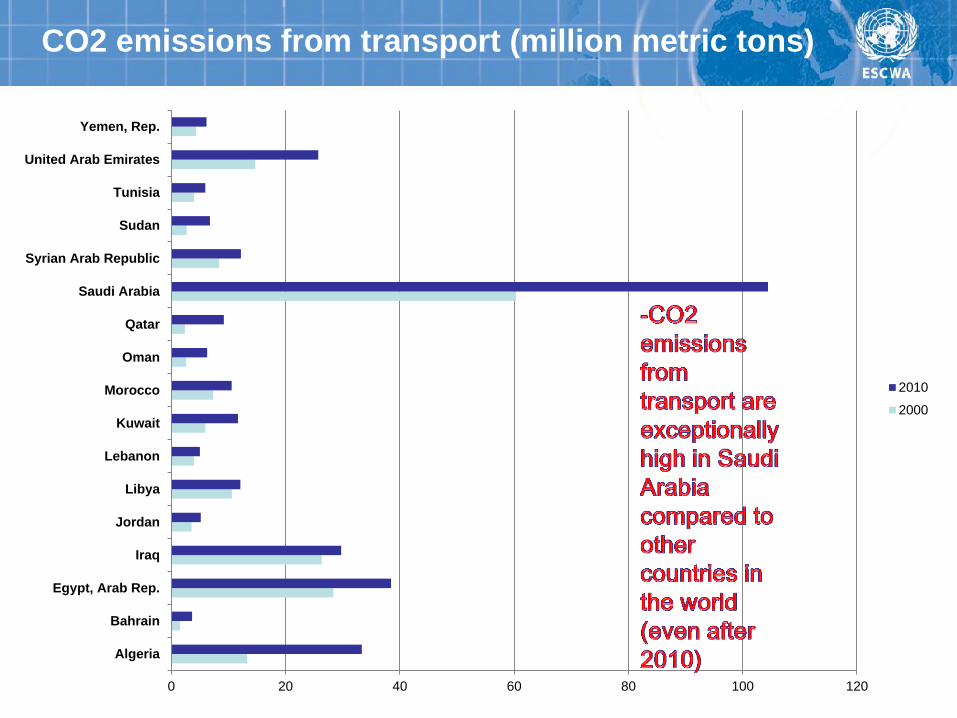
CO2 emissions from transport (million metric tons)
0 20 40 60 80 100 120
Algeria
Bahrain
Egypt, Arab Rep.
Iraq
Jordan
Libya
Lebanon
Kuwait
Morocco
Oman
Qatar
Saudi Arabia
Syrian Arab Republic
Sudan
Tunisia
United Arab Emirates
Yemen, Rep.
2010
2000
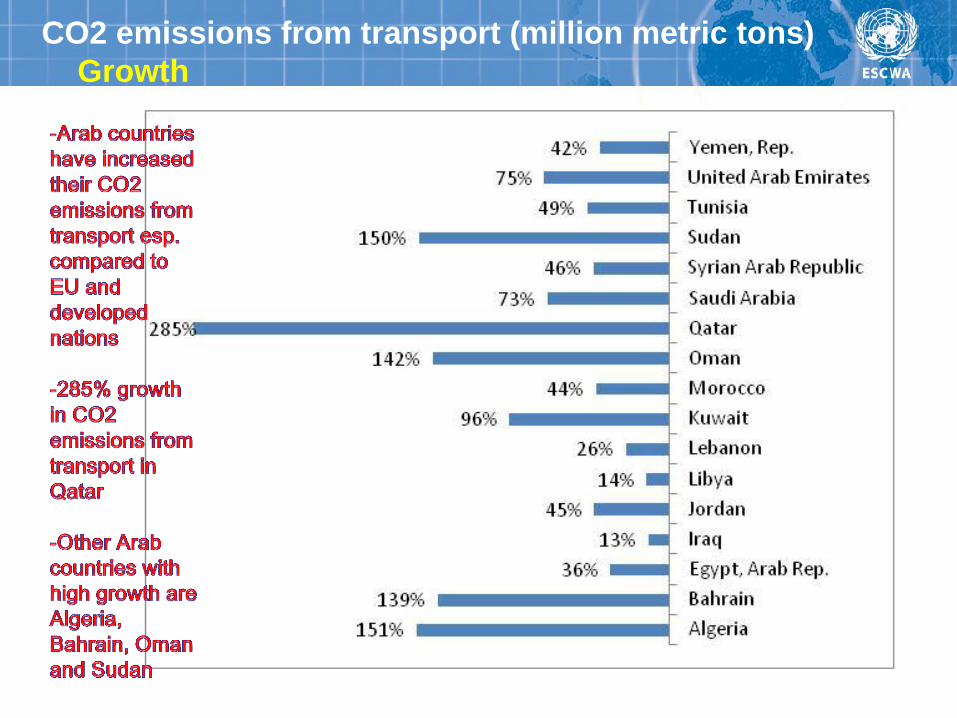
CO2 emissions from transport (million metric tons)
Growth
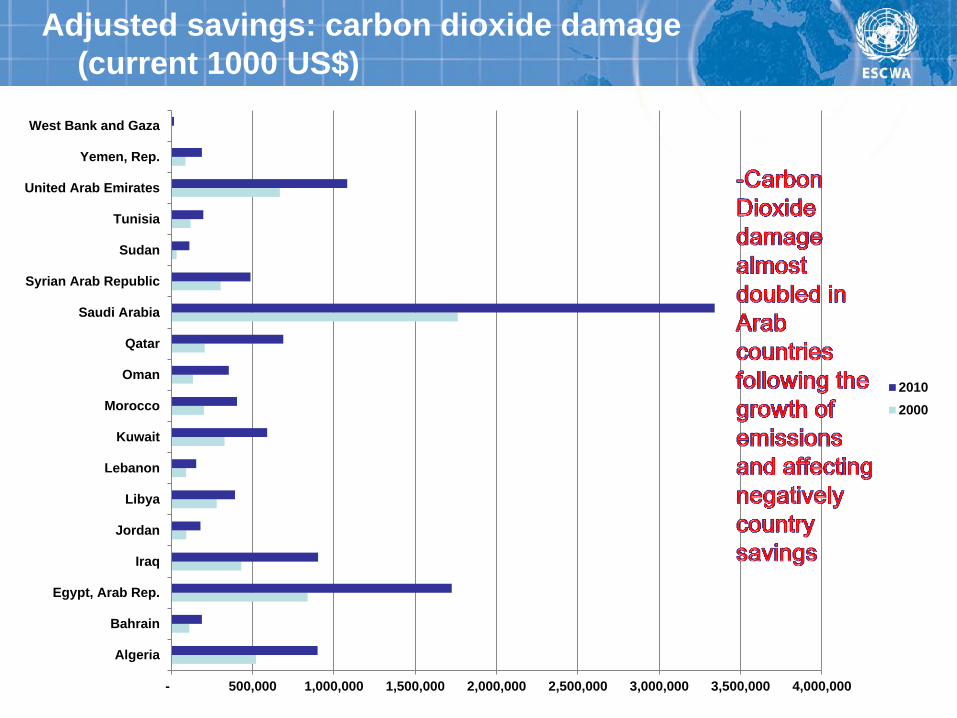
Adjusted savings: carbon dioxide damage
(current 1000 US$)
- 500,000 1,000,000 1,500,000 2,000,000 2,500,000 3,000,000 3,500,000 4,000,000
Algeria
Bahrain
Egypt, Arab Rep.
Iraq
Jordan
Libya
Lebanon
Kuwait
Morocco
Oman
Qatar
Saudi Arabia
Syrian Arab Republic
Sudan
Tunisia
United Arab Emirates
Yemen, Rep.
West Bank and Gaza
2010
2000
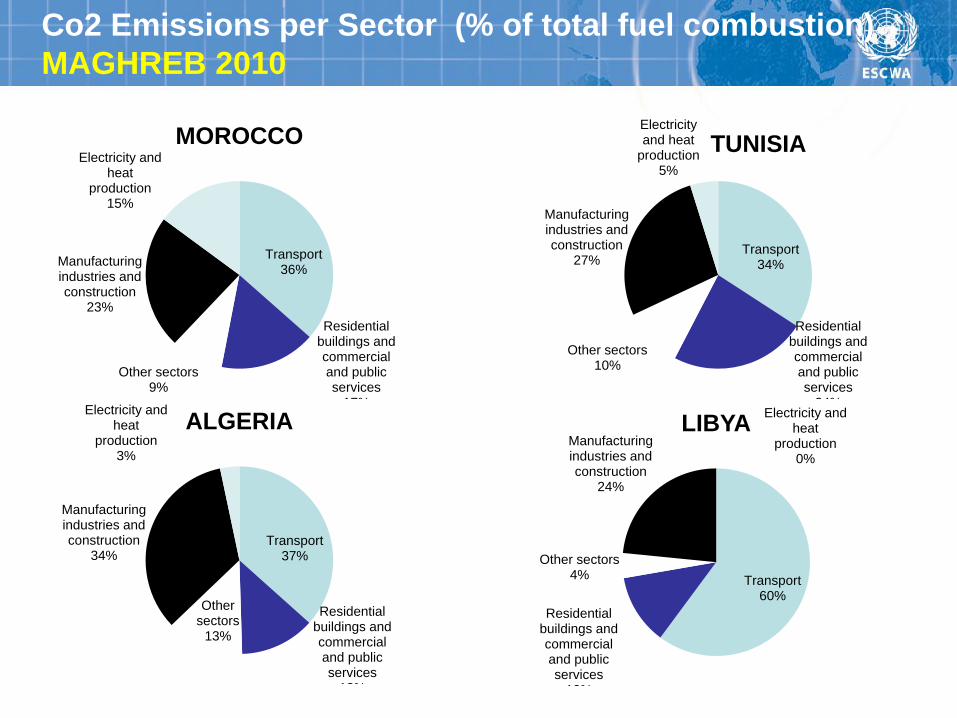
Co2 Emissions per Sector (% of total fuel combustion)
MAGHREB 2010
Transport 36%
Residential buildings and commercial and public services
17%
Other sectors 9%
Manufacturing industries and construction
23%
Electricity and heat
production 15%
MOROCCO
Transport 34%
Residential buildings and commercial and public services
24%
Other sectors 10%
Manufacturing industries and construction
27%
Electricity and heat
production 5%
TUNISIA
Transport 37%
Residential buildings and commercial and public services
13%
Other sectors
13%
Manufacturing industries and construction
34%
Electricity and heat
production 3%
ALGERIA
Transport 60%
Residential buildings and commercial and public services
12%
Other sectors 4%
Manufacturing industries and construction
24%
Electricity and heat
production 0%
LIBYA
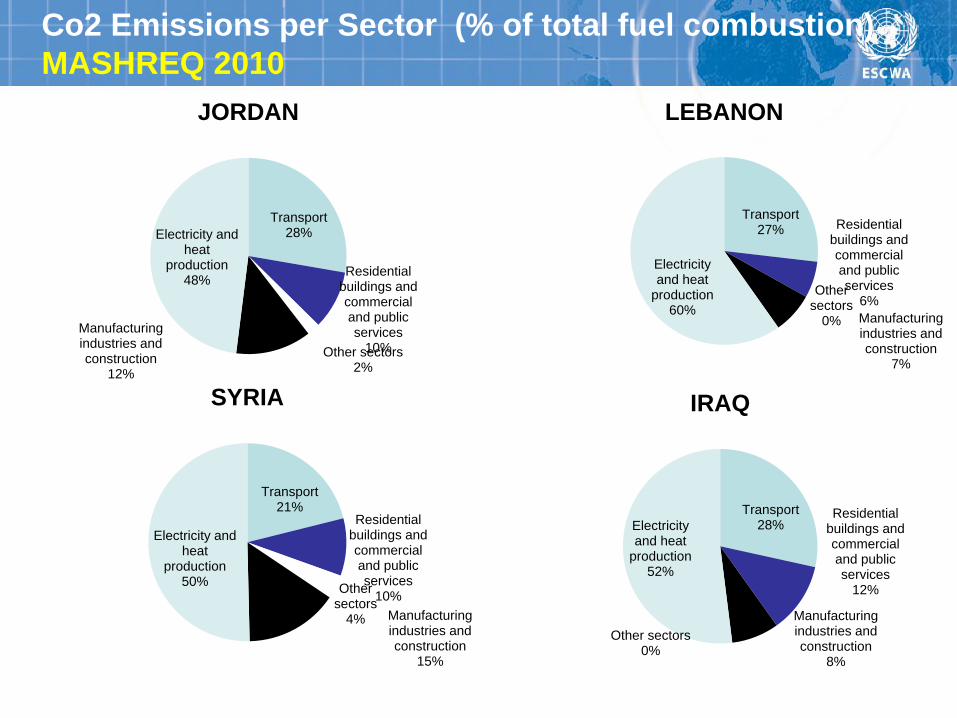
Co2 Emissions per Sector (% of total fuel combustion)
MASHREQ 2010
Transport 28%
Residential buildings and commercial and public services
12%
Other sectors 0%
Manufacturing industries and construction
8%
Electricity and heat
production 52%
IRAQ
Transport 28%
Residential buildings and commercial and public services
10% Other sectors 2%
Manufacturing industries and construction
12%
Electricity and heat
production 48%
JORDAN
Transport 27% Residential
buildings and commercial and public services
6% Other
sectors 0% Manufacturing
industries and construction
7%
Electricity and heat
production 60%
LEBANON
Transport 21%
Residential buildings and commercial and public services
10% Other
sectors 4% Manufacturing
industries and construction
15%
Electricity and heat
production 50%
SYRIA
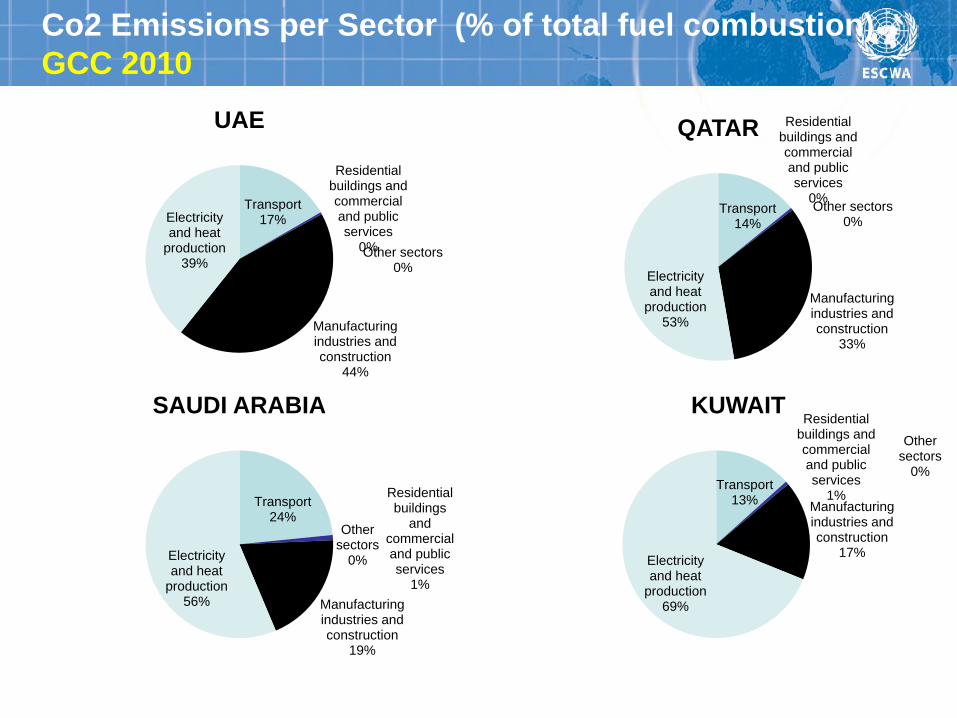
Co2 Emissions per Sector (% of total fuel combustion)
GCC 2010
Transport 13%
Residential buildings and commercial and public services
1%
Other sectors
0%
Manufacturing industries and construction
17% Electricity and heat
production 69%
KUWAIT
Transport 17%
Residential buildings and commercial and public services
0% Other sectors 0%
Manufacturing industries and construction
44%
Electricity and heat
production 39%
UAE
Transport 14%
Residential buildings and commercial and public services
0% Other sectors
0%
Manufacturing industries and construction
33%
Electricity and heat
production 53%
QATAR
Transport 24%
Residential buildings
and commercial and public services
1%
Other sectors
0%
Manufacturing industries and construction
19%
Electricity and heat
production 56%
SAUDI ARABIA
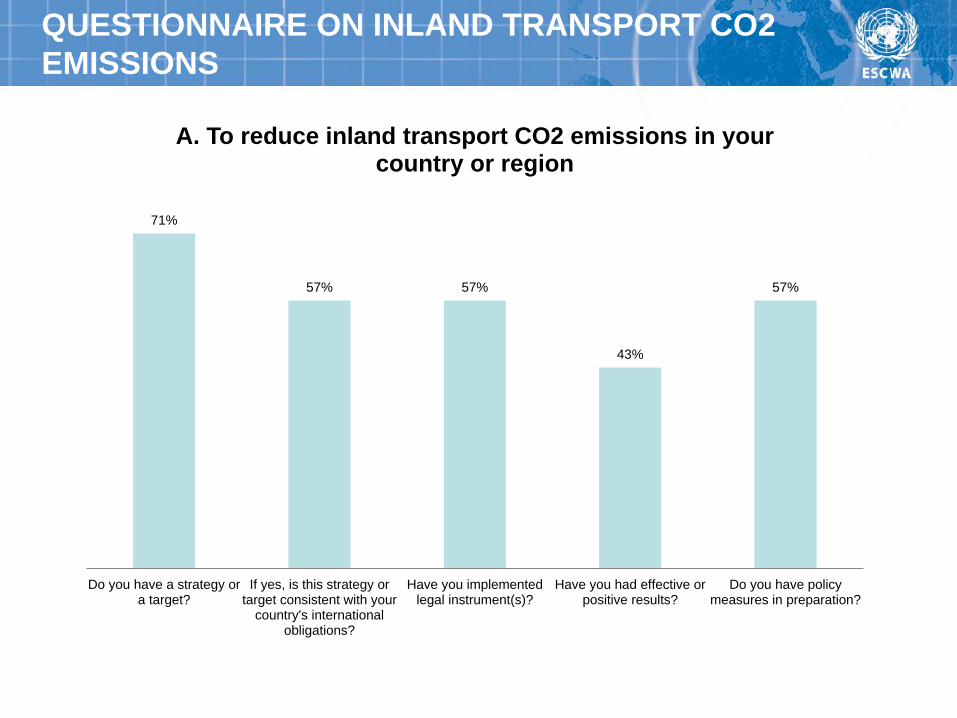
QUESTIONNAIRE ON INLAND TRANSPORT CO2
EMISSIONS
71%
57% 57%
43%
57%
Do you have a strategy ora target?
If yes, is this strategy ortarget consistent with your
country's internationalobligations?
Have you implementedlegal instrument(s)?
Have you had effective orpositive results?
Do you have policymeasures in preparation?
A. To reduce inland transport CO2 emissions in your country or region
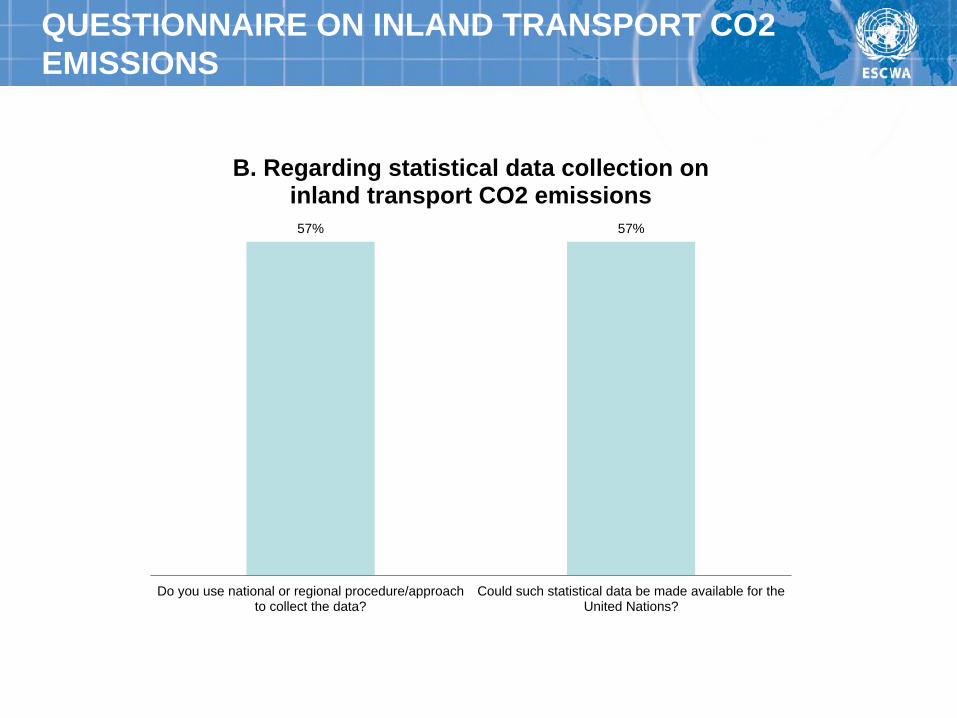
QUESTIONNAIRE ON INLAND TRANSPORT CO2
EMISSIONS
57% 57%
Do you use national or regional procedure/approachto collect the data?
Could such statistical data be made available for theUnited Nations?
B. Regarding statistical data collection on inland transport CO2 emissions
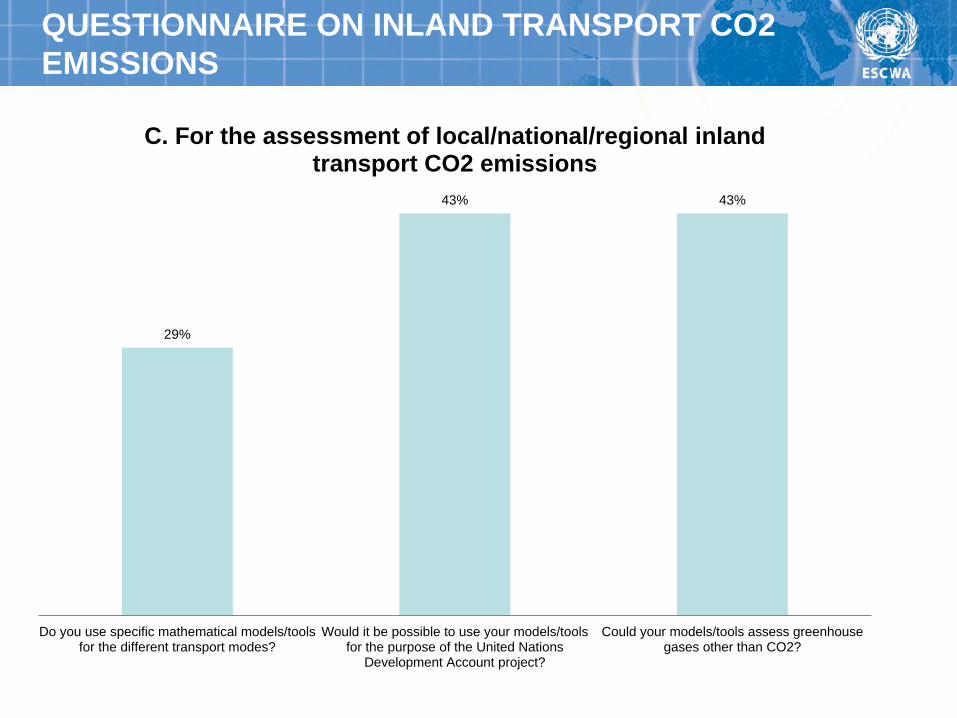
QUESTIONNAIRE ON INLAND TRANSPORT CO2
EMISSIONS
29%
43% 43%
Do you use specific mathematical models/toolsfor the different transport modes?
Would it be possible to use your models/toolsfor the purpose of the United Nations
Development Account project?
Could your models/tools assess greenhousegases other than CO2?
C. For the assessment of local/national/regional inland transport CO2 emissions
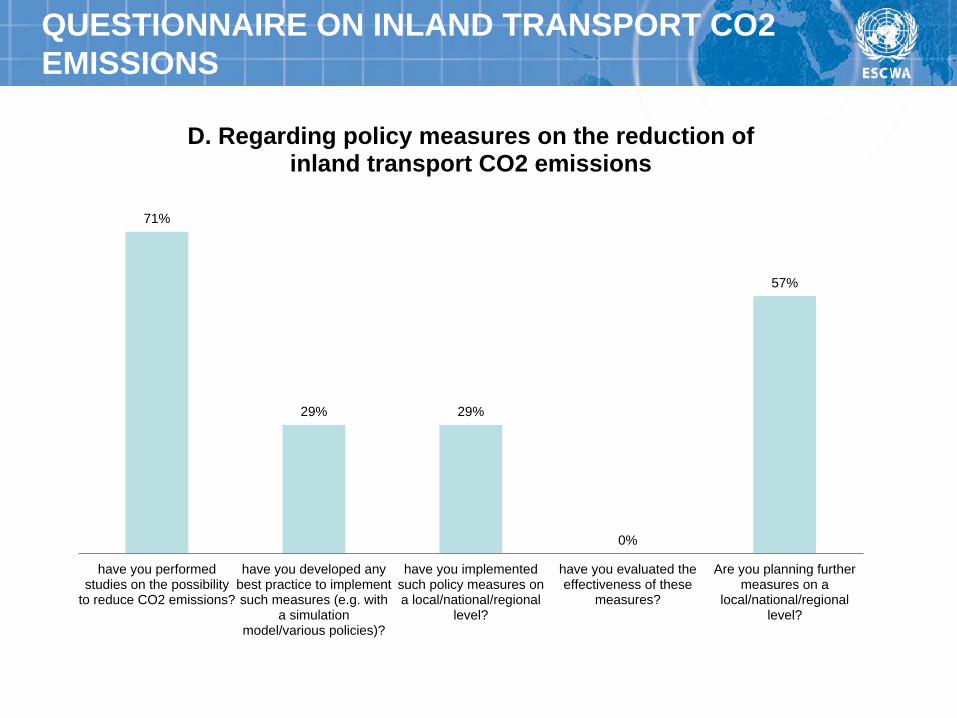
71%
29% 29%
0%
57%
have you performedstudies on the possibility
to reduce CO2 emissions?
have you developed anybest practice to implementsuch measures (e.g. with
a simulationmodel/various policies)?
have you implementedsuch policy measures ona local/national/regional
level?
have you evaluated theeffectiveness of these
measures?
Are you planning furthermeasures on a
local/national/regionallevel?
D. Regarding policy measures on the reduction of inland transport CO2 emissions
QUESTIONNAIRE ON INLAND TRANSPORT CO2
EMISSIONS

Conclusions
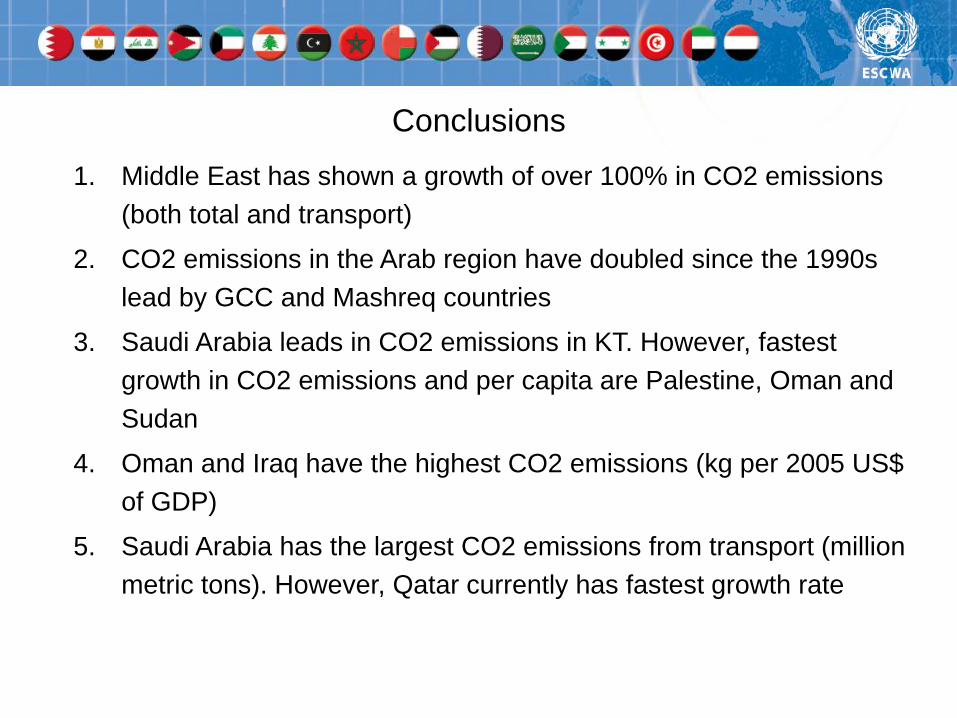
Conclusions
1. Middle East has shown a growth of over 100% in CO2 emissions
(both total and transport)
2. CO2 emissions in the Arab region have doubled since the 1990s
lead by GCC and Mashreq countries
3. Saudi Arabia leads in CO2 emissions in KT. However, fastest
growth in CO2 emissions and per capita are Palestine, Oman and
Sudan
4. Oman and Iraq have the highest CO2 emissions (kg per 2005 US$
of GDP)
5. Saudi Arabia has the largest CO2 emissions from transport (million
metric tons). However, Qatar currently has fastest growth rate
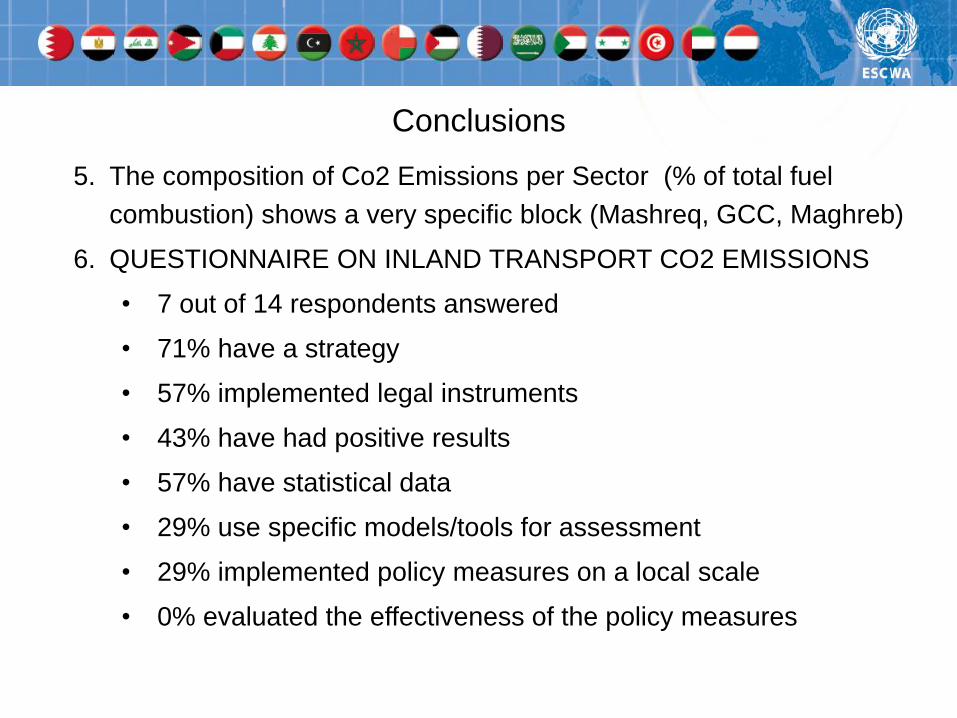
Conclusions
5. The composition of Co2 Emissions per Sector (% of total fuel
combustion) shows a very specific block (Mashreq, GCC, Maghreb)
6. QUESTIONNAIRE ON INLAND TRANSPORT CO2 EMISSIONS
• 7 out of 14 respondents answered
• 71% have a strategy
• 57% implemented legal instruments
• 43% have had positive results
• 57% have statistical data
• 29% use specific models/tools for assessment
• 29% implemented policy measures on a local scale
• 0% evaluated the effectiveness of the policy measures

Thank you!
“Be the change you want to see in
the world.” – Mahatma Gandhi