OUTLOOKS - preferences.farmjournal.com
26
OUTLOOKS RKET 2017 Farm Journal MEDIA
Transcript of OUTLOOKS - preferences.farmjournal.com

OUTLOOKSRKET
2017
FarmJournalMEDIA
CROPS:
Corn ............................................... 3
Soybeans ...................................... 6
Wheat ............................................ 9
Cotton, Rice ................................. 11
Hay ................................................. 13
Sorghum ........................................ 15
TABLE OF CONTENTS
LIVESTOCK:
Cattle ...................................................16
Dairy .....................................................19
Hogs ....................................................22
MACHINERY: ....................................25
Next PagePrevious Page Table of Contents3 Can ‘King Corn’ Keep its Crown?
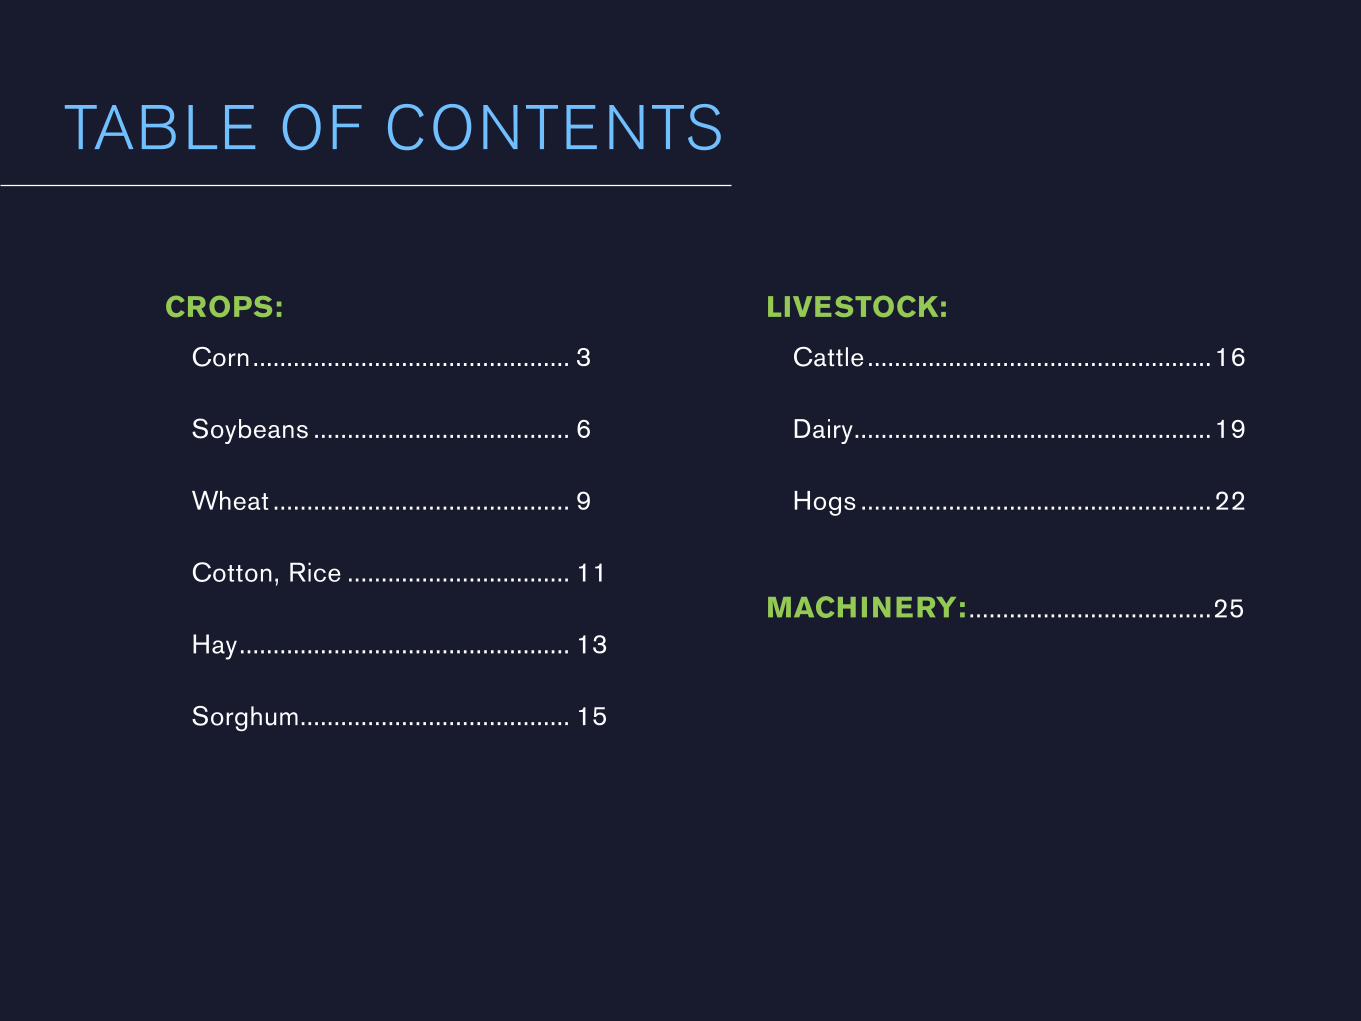
CAN ‘KING CORN’ KEEP ITS CROWN?By Sonja Begemann
The king of the crop world might lose ground in 2017. Weak prices combined with more appealing profits on alternative crops means corn acres could be down next year.
“In August, we put out projections that indicate we expect to see a drop in corn acreage and a jump in soybean acres in 2017,” says Pat Westhoff, director of the Food and Agricultural Policy Research Insti-tute (FAPRI) at the University of Missouri. “If you look at prices today it says plant beans, don’t plant corn.”
Westhoff warns, however, that input prices might reduce the advantage of soybeans. “Corn looks better when fertilizer prices are lower,” he says. “It also gets more complicated when you look at futures, corn prices look better in December 2017 than they do today.”
This isn’t the first year farmers have taken a harder look at swapping out corn acres for soybeans, either.
“Farmdoc showed this is the fourth year in a row where soybean profits beat corn profits in Illinois,” says Matt Bennett, corn and soybean farmer and owner of Bennett Consulting. “But now input prices have affected corn profitability and rotation is so important. I’m encouraging producers when planning for next year not to just make the assumption that the best thing to do is plant more soybeans.”
Bennett says it’s critical to pencil out the math with consideration for corn’s significantly lower input costs, including fertilizer, and compare overall profit-ability to soybeans before making a decision.
▲
Don’t make marketing plans based on any single current market projections—think about what you’ll do in many sit-
uations and consider downside risk. — Pat Westhoff, FAPRI director

Next PagePrevious Page Table of Contents4 Can ‘King Corn’ Keep its Crown?
Although lower inputs might improve opportunity for profitability on corn, FAPRI research still predicts a drop in corn acres and a jump in soybean acres. In August, the group released predictions that corn will drop from 94.1 million acres in 2016 to 90.6 million acres next year. Soybeans should jump from 83.7 million acres to 85.7 million acres, meantime.
Prices could improve in 2017. “If you look at the numbers we put out in August, we’re in the high $3.00 range, but we don’t get to $4.00 in the next couple years,” Westhoff says. “But, as always, we’ll have surprises.”
Corn likely won’t climb as high as $5 without a mas-sive drought, but Westhoff still expects price recov-ery with more normal weather conditions.
“This would lower average yields and that would help work through the massive stocks we’ve built up here and worldwide,” he says.
The U.S. has its own massive supply, but it’s not the only country in this situation. Westhoff says China is immensely important to watch.
“They have changed policies to allowed corn prices to drop in the country,” he says. “That’s positive for demand in the long run, but in the near term it means they’re going to be working to draw down their large government stocks. So it’s unlikely they’ll be a major importer in the short run.”
In South America, Westhoff says farmers should pay attention to weather and policy and how it’ll affect worldwide supply.
Leave emotion at the door when marketing in 2017. “The most important thing a producer needs to take from 2016 to 2017 is not so much the mistakes we make in mar-keting, but why are we making decisions this way,” Bennett says. “Our priority needs to be locking in profitability on our farm when it’s there and manag-ing risk when it falls to levels we don’t expect.”
It’s important to go into the year with a plan, know breakeven levels for corn and soybeans and avoid putting all eggs in one price basket, he says.
Click here to check
the markets now!
▲

Next PagePrevious Page Table of Contents5 Can ‘King Corn’ Keep its Crown?
“Start [selling] in small increments before you know production and get more aggressive once produc-tion is known,” Bennett adds.
As always, there is risk in marketing, so you might book your crop on the highest price, but there’s a chance you might miss out on opportunity as well. Domestic and foreign weather and stocks can impact prices quickly.
“Don’t make marketing plans based on any single current market projections—think about what you’ll do in many situations and consider downside risk,” Westhoff says.
By most estimates, commodity prices will continue to drag their feet throughout 2017. Yet depending on whom you ask, there’s also opportunity in the form of strong demand from end users such as ethanol plants, cattle feedlots, poultry producers and global buyers. To stabilize balance sheets in the new year, revisit your marketing strategy with the advice of experts you trust while keeping in mind the recommendations shared by 10 com-modity analysts.
Use this interactive outlook tool to see which commodity experts agree with your predictions for 2017 and which share an alternative perspective.
Click here to find out
ARE YOU A BULL OR A BEAR?
Next PagePrevious Page Table of Contents6 Demand for Soybeans to Grow in 2017
DEMAND FOR SOYBEANS TO GROW IN 2017By Debra Beachy
The U.S. soybean market in 2017 will continue to feel the effects of China’s insatiable appetite, according to analysts and ag economists. But it could face headwinds from a stronger U.S. dollar and a larger South American crop.
“China’s robust buying pace continues to be on target for the growth rate we’ve seen developing in
recent years, suggesting final demand just above 102 MMT, up about 1.5 MMT from USDA’s current estimate,” says Arlan Suderman, chief commodities economist at Intl FCStone.
About half of U.S. soybean exports go to China, which is roughly one-third of the U.S. soy-bean crop, according to estimates by ag economists.
USDA’s current 2016/17 export forecast for soy-beans is 55.8 MT (2.05 billion bushels), an increase of 5.9% from 2015/16.
The increase in demand for soybeans in China and elsewhere is driven partly by the expansion of hog and poultry operations that use soymeal for feed, according to analysts.
“Expansion in the poultry and pork industries should be good for soybean demand – both domestically and globally,” Suderman says. Poultry is the largest consumer of soymeal protein, and per-capita poultry consumption is increasing globally, he adds.Click the video to watch Markets Now with
Bob Utterback and Chip Nellinger
▲
Next PagePrevious Page Table of Contents7 Demand for Soybeans to Grow in 2017
Other important factors underpinning greater demand for U.S. soybeans is the continued growth of China’s economy and the increasing amount of soybean meal fed to pigs as China’s hog industry modernizes, according to Chad Hart, ag economist at Iowa State University.
Soybean demand is increasing in the U.S. as well, notes Suderman.
“NOPA (National Oilseed Processors Association) crush for soybeans posted its third-largest month on record in October in a year when export demand is largely expected to be steady with the previous year,” he says.
With increasing demand, global soybean production is set to go up 22.9 MMT to a record 336.1 MMT for 2016/17, according to USDA.
Among critical factors for 2017, other than demand, are U.S.-China trade relations and the strong U.S. dollar, analysts say.
“All things considered, I will be closely monitoring developments in our incoming President’s adminis-tration and whether or not naming China as a cur-rency manipulator as outlined in his first 100-day plan will impact China’s attitude when it comes to trade,” says Angie Setzer, vice president of grain, Citizens Elevator, in Charlotte, Mich.
Meanwhile, a strong U.S. dollar, has hit nearly 14-year highs, weakening the Real of Brazil – the U.S. top competitor – along with Argentina’s peso. That has made their exports cheaper.
As of Nov. 16, the dollar index climbed to its highest levels since April 2003.
All things considered, I will be closely monitoring developments in our
incoming President’s administration.— Angie Setzer, vice president of grain,
Citizens Elevator, in Charlotte, Mich.
▲

Next PagePrevious Page Table of Contents8 Demand for Soybeans to Grow in 2017
“The greatest challenge for the ag commodities overall is the strength of the dollar,” Suderman says. “That’s not a significant problem for (U.S.) soybeans right now, because there are few alternatives.”
But that will change early in 2017 because in early February, with an early harvest for Brazil’s crop, and a weaker real, demand will shift to South America and stay there until September if yields are normal, he says.
There are also uncertain-ties about China’s demand for 2017, according to USDA.
“The size of China’s 2016 domestic soybean harvest, as well as the timing and rate at
which the government auctions off its reserve stocks, will influence the country’s 2016/17 import demand,” explains Mark Ash, of
USDA’s Economic Research Service.
Incentives to further expand 2017 soybean pro-duction in China will likely be affected by the rate at which the government auctions off reserve corn stocks, Ash notes.
With the largest soybean crop in U.S. history har-
vested, and record soy-bean plantings expected in
the U.S. and South America, soy-bean futures are already posting lower
for the 2017 crop, according to Hart.
And more soybean acreage could drive prices down, Ash cautions.
“Any indications that U.S. farmers will increase 2017 soybean acreage more than expected will also apply downward pressure on prices,” he says.
Click hereto check
your local cash bids and
basis level

Next PagePrevious Page Table of Contents9 Global Glut Pushes Down Wheat Prices
GLOBAL GLUT PUSHES DOWN WHEAT PRICESBy Debra Beachy
Analysts expect an even greater global wheat glut in 2017 to drive down prices and whittle away at acreage.
Pushing down prices are three consecutive years of world wheat production and carryout. USDA esti-mates a third record global wheat harvest of 751.26 MMT in 2016-17, which will send carryover to a record 252.14 MMT.
“The perceived oversupply of wheat continues to weigh on the market. Record high global supplies coupled with the ideas of a record crop coming out of Australia will keep a lid on prices in the short-term,” predicts Angie Setzer, vice president of grain at Citizens Elevator in Charlotte, Mich.
Producers, struggling with relentlessly low wheat prices, are looking at switching acres to soybeans and other more profitable crops.
“A lot of farmers are moving away from wheat and going to soybeans, corn and lots of milo,” custom harvester Greg Thurman, of Kiowa, Kan., told Farm
Net News, in Grand Forks, N.D. “We’re getting big into canola again. We tripled canola acres compared to what we have been doing,” addsThurman, who is also vice president of U.S. Custom Harvesters.
Although there is optimism about the winter wheat crop conditions, many farmers in western Kansas are switching acres from wheat to other crops, according to Thurman.
Analysts project that producers under pressure from low prices will plant less wheat for the second year in a row.
Click the video to watch AgDay Agribusiness with Tyne Morgan and Jim Bower
▲

Next PagePrevious Page Table of Contents10 Global Glut Pushes Down Wheat Prices
“The expectation is that we will see a significant reduction in winter wheat acres, and likely a reduc-tion in spring wheat as well a current price relation-ships,” says Arlan Suderman, chief commodities economist, INTL FCStone in Kansas City, Mo.
Overall wheat acres could decrease by 7% to 10%, although in some areas they may actually increase, Suderman notes, including Oklahoma and surround-
ing Southern Plains states. Those expectations would be in line with USDA projections for wheat plantings of 50.2 million acres and har-vesting of 43.9 million acres in 2016-17, down from 55 million planted acres and 47.3 har-vested acres estimated for 2015-16
One potential bright spot for the wheat market is an increase in exports. USDA is projecting exports of 975 million bushels for 2016-17. That would be 200 million more bushels than the 775 million bushels in exports estimated for 2015-16, or a 26% increase.
However, a large chunk of relatively low test weight and/or protein crop could result in significantly lower prices, especially with HRW wheat, cautions Kim Anderson, an Extension agricultural economist at
Oklahoma State University. It doesn’t cost much to store wheat and wait for higher prices, notes Ander-son, but prices are projected to head lower.
USDA estimates a third year of back-to-back fall-ing prices, with the average wheat farm price for 2016-17 at $3.60 to $3.80 per bushel. That would be lower than the estimated 2015-16 farm price of $4.89, and roughly 60% less than the 2014-15 price of $5.99.
There is always China to consider, analysts note. That’s because China holds an estimated 44% of the world’s wheat. And that means “actual global supplies remain somewhat of a wild card,” according to Setzer.
“Any type of reduction in projected Chinese supplies coupled with any type of North American production scare could send wheat soaring higher,” she says.
However, with a decrease in fall acres and early conditions in many areas questionable, wheat pro-duction could drop significantly as the market moves ahead and perhaps attracts buyers attention, she says.
Click here to check
the markets now!

Next PagePrevious Page Table of Contents11 Cotton, Rice Stuck in Static Markets
COTTON, RICE STUCK IN STATIC MARKETSBy Chris Bennett
Despite a tepid forecast, cotton growers won’t “spit the bit” in 2017, particularly with no safe haven crop in sight, but rice producers may be in for a significant acreage dip.
CottonThe echo of a 17% jump to 10 million acres in 2016 is fading fast for the U.S. cotton industry. With prices perpetually caught in the doldrums, shifts between 65 to 75 cents make for a sub-profitable cash price -- the third year of inadequate or subsistence level pricing for growers. John Robinson, Texas A&M Uni-versity Extension cotton economist, doesn’t see much cause for change, and expects expect Dec. 17 futures to trade between 63 and 75 cents.
“We have a cluster of financial stress, carryover debt, banking concerns, and production problems in some areas, and a lot of growers, at least in Texas, can’t really switch to grain,” he says.
Signals from the futures market indicate scant change in demand. In 2016, China whittled down its 50-million bale reserve by shaving off 11 to 12 million bales, yet didn’t crater the market. However, Rob-inson expects China’s influence to remain in 2017, depending on how much of the reserve they unwind: “We’ve been in a weak demand situation for several years and may not get pulled out soon. All said, I expect prices will stay in the current range.”
Click the video to watch a cotton update with Tyne Morgan and Gary Adam, NCC President and CEO.
▲

Next PagePrevious Page Table of Contents12 Cotton, Rice Stuck in Static Markets
Flat cotton prices and relatively weak grain prices may mean growers will hold the line on cotton acre-age in 2017.
“Sometimes you can ease price pain by packing on pounds and good grades, but most growers are already stretching their crop to the fullest,” he says. “Financial stress is a fair description for cotton in 2017.”
RiceRice prices tottering in a see-saw motion don’t bode well for 2017. Two of the biggest sales of the 2016 marketing year registered in November, but didn’t provide fuel for a rice market fire: Prices haven’t responded and trends can’t find traction. As jumps to $10.30 cwt become falls to 9.70 cwt, rice prices are trapped in a cough-and-sputter cycle.
Jarrod Hardke, rice Extension agronomist with the University of Arkansas System Division of Agriculture, expects Mid-South rice acres to fall by 15% to 20% in 2017. He forecasts Arkansas at roughly 1.2 million acres; Missouri at 200,000 to 220,000; Mississippi
at 180,000; and Louisiana at 420,000; for an approx-imate total of 2 million Mid-South rice acres.
Hardke is hoping for sudden market interest, but doesn’t know where it might surface. “We already know our domestic demand, but we’re looking for something to pop up on the international market,” he says.
From a grower perspective, Hardke believes 2017 will be another year to weather the storm. Tremen-dous acreage in the Mid-South is uniquely suited to grow rice, and when rotated to other crops, doesn’t hit high yields.
“The market for rice growers in 2017 isn’t great,” Hardke adds. “I’d say everybody is disappointed and I don’t see many positive outlooks. Most people are just hoping to tread water.”
“We already know our domestic demand, but we’re looking for something to pop up
on the international market.”

Next PagePrevious Page Table of Contents13 Hay Prices Rely on Basic Economics
HAY PRICES RELY ON BASIC ECONOMICSBy Anna-Lisa Laca
If you’re a dairy farmer, the only thing keeping your business afloat might be the forgiving price of feed. Grains and alfalfa have been lower than average over the past several months. Barring a weather catastro-phe next spring, analysts expect 2017 hay prices to remain in the same range they’ve been this year. Immense supply and below average demand will continue to put price pressure on hay, excluding pre-mium alfalfa.
The June 2016 acreage report from USDA indicated 56.1 million acres of hay would be harvested in 2016. That jump in hay acreage, combined with near perfect growing conditions in most of the U.S., led to full hay barns.
“We have an incredible amount of hay,” says Dan Undersander with the University of Wisconsin forage team. “We had an above-average carryover, and we had tremendous yields. The supply is good.”
HAY PRICES BY STATE
SO
UR
CE
: US
DA
California
Colorado
Idaho
Illinois
Iowa
Kansas
Minnesota
Missouri
Nebraska
New Mexico
Oklahoma
Oregon
Pennsylvania
South Dakota
Texas
PREMIUM+ $/TONFAIR $/TON
0 50 100 150 200 250 300
▲

Next PagePrevious Page Table of Contents14 Hay Prices Rely on Basic Economics
According to Western hay market expert Seth Hoyt of the Hoyt Report, there’s sufficient carryover in the West as well, with Idaho leading the pack. Evi-dence of this carryover appeared in the latest USDA hay price report, which quoted Idaho having one of the lowest prices in the seven Western states for “supreme” quality hay.
The huge gap in price between “supreme” quality hay and low quality hay, a trend that really picked up
steam last year, will likely continue, according to Undersander.
“Quality hay has a good premium and that is likely to stay,” he says. “There will be opportu-nity to bring some hay in from the West, but of
course the farther you go, the higher the trans-portation costs become.”
The drought the Eastern U.S. experienced this sum-mer will help chew through the supply, Undersander says. In addition, he says a long, cold winter could help reduce stocks.
Fortunately for livestock producers, corn prices have been down, too. However, Undersander warns low
corn prices this winter won’t likely make hay prices go much lower.
“Usually when corn prices are down we put up more corn silage and that makes hay prices go down,” he explains. “This year people didn’t put up as much corn silage because bunks were full of haylage.”
Undersander says the corn silage put up in the Mid-west wasn’t as high quality as it should be, so farmers will feed more hay to make up for it.
Hay exports to China have increased compared to last year but fell sharply in September, Hoyt reports. According to the U.S. Department of Commerce, hay exports to China were down 27% from August, but are still 51% higher than September a year prior.
Could prices bounce back? “A hard winter will increase use, as will the number of cows we feed through the winter,” Undersander says. “If we have an average to good growing season next year, prices will stay about where they are now.”
Barring a significant weather event next spring, demand won’t be able to outpace supply, and prices will remain relatively stagnant.
Click here for Weather News and Analysis
Next PagePrevious Page Table of Contents15 Has Sorghum Lost Its Momentum?
HAS SORGHUM LOST ITS MOMENTUM?By Ben Potter
It appears the pendulum has swung back the other way for sorghum. This crop enjoyed a large uptick in acres in 2016 – from 7.1 million acres to 8.5 million acres. But the latest estimates from USDA indicate sorghum is poised to lose all that ground back, and then some.
The projected 2016/17 acres will drop to 6.8 mil-lion acres, according to USDA. Some market fun-damentals go far in explaining the reduction in acres, including higher stocks and lower prices. The 2016/17 estimated price range is $2.80 to $3.40 per bu., down from $3.31 a year ago and $4.03 two years ago.
Some other factors could prove obstacles, accord-ing to John Holman, associate professor of crop-ping systems at the Western Kansas Agricultural Research Center.
“With the challenges we have had recently with sug-arcane aphid and weeds in sorghum, and with China backing away from buying sorghum, we might see a slight shift to more dryland corn acres,” he says.
Other obstacles are apparent, adds Paul Hay, Univer-sity of Nebraska Extension educator. In the southeast part of the state where he works and lives, Hay has seen sorghum acres slink from 174,000 acres in 1980 all the way down to 3,000. He ticks off the reasons why this has happened.
“The profitability of corn is better,” he says. “Corn has become more drought tolerant. The upward yield potential is better with corn. There are better weed control options. The corn price is usually more favor-able. Corn dries and stores easier. And the crop insurance flip from corn to milo (or reverse) in crop insurance is problematic.”
Hay is optimistic to share that some badly needed post grass options are coming online soon.
Other small grains, meantime, could see small gains in acres for 2017. According to USDA, barley acres could grow from 3 million to 3.6 million acres. Oats acres could also increase, from 2.8 million to 3.1 million acres.
Other small grains, meantime, could see small gains in acres for 2017.

Next PagePrevious Page Table of Contents16 Cattle Forecast Bleak, But Some Opportunity
CATTLE FORECAST BLEAK, BUT SOME OPPORTUNITYBy Greg Henderson
In two short years cattle markets have flipped from record highs to depressing lows. The supply-starved market that brought record prices in the fall of 2014 are but a distant memory. Ranchers shipped semi loads of calves to market this fall that were valued at $70,000 less than the same trailer loads in 2014.
“How did this happen,” and “What does it mean going forward?” Those questions are foremost on rancher’s minds this year.
“Profits plus grass equals expansion,” says John Nalivka, president of Sterling Marketing, Inc., Vale, Ore. “We saw rapid herd rebuilding for two years as both cow and heifer slaughter were down sharply. Beef cow slaughter was down 14% in 2014 fol-lowed by a 4% drop in 2015. And while sharply reducing herd culling in order to take advantage of higher prices, cattlemen also bred more heifers. Heifer slaughter fell 8% in 2014 and then was down another 12% in 2015.”
Nalivka calculates average profit per cow in 2014 was $518. That was the economic incentive to expand herds and Mother Nature cooperated with adequate moisture for grass and forage production across most of cattle country.
The current supply-demand equation traces back to the Jan. 1, 2014, inventory report which counted
▲
FED CATTLE PRICES
200
150
100
50
0
Q1 Q2 Q3 Q4
2015 2017(Projected)2016
SO
UR
CE
: STER
LING
MAR
KE
TING
, INC
▲
Next PagePrevious Page Table of Contents17 Cattle Forecast Bleak, But Some Opportunity
87.7 million head, with 29 million beef cows. The tally was the lowest number of beef cows since 1951, a result of the prolonged drought across much of the Central Plains. The small number of cows con-tributed to a shrinking supply of feeder cattle and the subsequent record prices posted in the fall of 2014.
The expansion of 2015 and 2016 led to increased beef production – 5.8% more in 2016, and another
4.4% increase is projected next year by USDA’s National Agricultural Statistics Service. But beef is just part of the puzzle.
“Per capita supplies of total red meat and poultry will be 7% higher this year, and
increase another 8% next year,” Nalivka says.
And there’s more on the way. The Livestock Mar-keting Information Center, Denver, CO, projects increasing supplies for both beef and pork during every quarter in 2016, 2017 and 2018. Enough, USDA projects, to provide 218 pounds of red meat and poultry on a per capita basis by 2018, an increase of 16 pounds per person from 2014.
The growing glut of red meat is reflected in cattle prices and profit margins. Sterling Market-ing produces a weekly Profit Tracker for both beef and pork finishing programs. Red ink has flowed in closeouts for both cattle and hog producers this fall, with last week’s data showing losses of $116 per head for cattle and $35 per head for hogs.
For ranchers, the declines in feeder cattle and calf prices have been devastating. Oklahoma City auc-tion prices for 750-800 lbs. feeder steers were 35% lower in October than the same period in 2015. Calves weighing 450-500 lbs. at the same auction were 38% lower in October 2016.
The October 2015 prices were 25% below the 2014 peak of $299 per cwt. Still, ranchers saw aver-age per cow profits of $433 last year, Nalivka says. “This year I’m projecting a 65% decline in per cow profits to about $154.”
And that may be the best return ranchers see for a while. Given the Sterling Marketing price forecast, Nalivka projects ranchers will lose an average of $24 per cow next year.
Click here to check
the markets now!
▲

Next PagePrevious Page Table of Contents18 Cattle Forecast Bleak, But Some Opportunity
“I project we will see another 14% to 16% decline in the price for feeder cattle and calves next year,” he says. “I am projecting a third quarter price of $118 per cwt for Oklahoma City yearling feeders, and $136 per cwt for calves.”
Additionally, Sterling Marketing forecasts show fed cattle prices in the third and fourth quarter of 2017 at $95 and $96, respectively, with an annual aver-age of $100. If accurate, that would represent a $48 decline in the annual average for fed cattle from 2015.
While those forecasts seem bleak, there are opportunities. Derrell Peel, Oklahoma State Univer-sity extension economist says, “Retained ownership
may be attractive for cow-calf producers depending on calf weaning weights and management flexibil-ity.” And he says the price roll-back on calves this fall may offer opportunities for stocker operations. “Not only does the current market suggest stocker opportunities in general but also that the best buying opportunities are for animals somewhat heavier than typically purchased for winter grazing.”
Nalivka agrees that backgrounding your calves may prove profitable. “If you already have the for-age, backgrounding can be an appealing option,” he says. “As long as your marginal cost of an added pound does not exceed the marginal revenue from that additional pound of beef, the economics are on your side. The key – you must know your costs of forage (if produced) and your cost of gain for back-grounding whether in a dry lot or on grass.”
Those opportunities may also carryover to fin-ishing programs. “Current retained ownership in the feedlot continues to look positive based on the feeder cattle market and expected breakevens based on the cattle cost and feed cost – both are down sharply,” Nalivka says. “However, there is plenty of pessimism concerning the 2017 steer prices.”
Not only does the current market suggest stocker opportunities in general but also that the best buying opportunities are for animals somewhat heavier than typically
purchased for winter grazing. — Derrell Peel, Oklahoma State University extension economist

Next PagePrevious Page Table of Contents19 5 Dairy Wildcards to Watch
5 DAIRY WILDCARDS TO WATCHBy Jim Dickrell
Even though U.S. milk production surged 2.5% in October, shrinking production in other regions of the world and increasing global demand mean milk prices likely will improve significantly in 2017, say University of Wisconsin dairy economists Bob Crop and Mark Stephenson.
“If you look at the U.S., these kinds of numbers would be leading to softness not firmness,” says
Stephenson. Twenty of the 23 major dairy states reported increased production in October. Even Califor-nia, which had declining production for the previous 22 months, saw a 1.8% surge in output in October.
“But milk production is down in all major exporting countries,” says Cropp. And seven of the last eight Global Dairy Trade auctions saw world prices increase, indicating an improvement in demand, he adds.
The United States Department of Agriculture is project-ing about $1/cwt increase in the All-Milk Price in 2017. Cropp and Stephenson are even more optimistic, saying they’re projecting a $2 bump in prices over this year.
“The average Class III for the year could be near $16.50, a good improvement over the expected $14.75 this year,” says Cropp. A 16.50 Class III would suggest an All-Milk Price average of $18 or more. Click here for the full analysis by Cropp and Stephenson.
Despite this optimism, there are five wild cards dairy farmers need to watch as they enter 2017 and con-template risk management options for the year, says Mary Keough Ledman, editor of the Daily Dairy Report.
Click the video to watch dairy update with Clinton Griffith and Bryan Doherty, Stewart-Peterson. ▲

Next PagePrevious Page Table of Contents20 5 Dairy Wildcards to Watch
#1 The global dairy sector.
“The perfect storm for high milk prices occurs when output in the European Union, New Zealand and the United States is lower than historical growth rates,” Ledman says. In 2016, the European Union is down almost 3% and has a milk diversion program in place for at least the first quarter of 2017. New Zealand was also down 5.5% in October year over year. That’s significant because October is New Zealand’s flush when pastures are the most lush and cows are milking at their peak. Of the big three players in global markets, only the United States is seeing increased milk production, up 2.5%. That’s the highest increase year over year since 2014.
#2 The changing landscape of U.S. milk production.
The strongest milk production growth is coming from the Dakotas east. Lack of processing capacity in Mich-igan, Ohio and Indiana means that basis in these states and areas that are absorbing their surplus is weak-ened until more processing capacity is built. U.S. cow numbers are also at their highest level since 2008.
▲
DAIRY WILDCARDS
#3 Ample stocks of butter and cheese.
“Cheese, butter and non-fat dry milk stocks are declining, but remain ample,” says Ledman. “Recent monthly drawdowns of butter stocks bode well for prices.” Because U.S. cheese prices were higher than those in Europe and New Zealand, the U.S. imported a lot of cheese in 2016 and put a share of its own production into inventory. “For much of 2016, cheese markets were bur-dened by high stock levels. They are not nearly as large going into 2017,” she says.
▲

Next PagePrevious Page Table of Contents21 5 Dairy Wildcards to Watch
#4 Price convergence.
As noted above, high prices for U.S. cheese and butter made U.S. exports of these prod-ucts come to a screeching halt in 2016. In fact, U.S. cheese exports in the first half of the year were close to a 10-year low. “In August, there was a convergence of cheese prices between the U.S. and the rest of the world, which stopped cheese from being imported here,” she says. “Going into 2017, U.S. cheese prices are much closer to EU and Oceania prices.” A strong U.S. dol-lar against the Euro also did not help U.S. exports. The one bright spot for the U.S. is non-fat dry milk powder prices. Mexico has been a huge market for powder in 2016. “We do not want any walls separating us from Mexico. Mexico is as important an export destination for U.S. dairy products as China is to New Zealand,” Ledman says.
#5 Weather.
No outlook is complete without talking about the weather, Ledman says. Drought seems to be spreading in the West and Southeast. California, while it has had some rain, remains a trouble spot. In the Southeast, drought seems to be growing in dairy areas that rely on pastures and grazing for much of their forage. The Mid-west seems to be the only region to be in good shape when it comes to adequate soil moisture. But again, December is way too early to make any predictions on how weather patterns will play out in the 2017 growing season.
DAIRY WILDCARDS
Click here for Weather News and Analysis

Next PagePrevious Page Table of Contents22 Top 6 Hog Market Movers
TOP 6 HOG MARKET MOVERSBy JoAnn Alumbaugh
Pork producers have definitely seen better times than the present, but there are some bright spots on the horizon. Thankfully, prices haven’t declined as far as many analysts expected, but producers have a long way to go before they’re consistently making money.
1. Grain Prices Will Remain Low. Whether you buy your inputs or raise them, the cost of production for pigs will remain low in 2017. With global consumption projected only marginally higher, global ending stocks will rise. Increasingly, the pros-pects for major price changes in both markets are linked to South American production outcomes and the ability to export corn and soybeans into foreign markets.
With bean meal around $325/ton, producers can book bean meal and hedge, “or go to a crusher and book it just as far out as you can,” Steve Meyer, Vice Presi-dent of Pork Analysis, EMI Analytics says. “If we have record crops here and in South America next year, it might go down to $270, but locking it in now is proba-bly a good idea,” he says.
2. Low Market Prices. It’s a good thing grain prices are low, because with the expansion the industry saw after 2014, and steady productivity improvement following Porcine Epidemic Diarrhea virus, the U.S. has a lot more pigs than it does slaughter capacity. Don’t expect the trend to change in 2017.
Unfortunately, prices have declined significantly more than cutout value, which reflects wholesale prices. There is a positive component to this scenario, how-ever. If you’ve been to the supermarket lately, you’ve noticed low retail prices on pork, which is a primary driver of demand.
3. Exports Vitally Important. The repeal of mandatory country-of-origin labeling (mCOOL), low U.S. pork prices, and relisting of plants for export to China are encouraging indicators for U.S. producers, despite a strong dollar. China is the world’s largest producer of pork, but it is expected to import even more product in 2017.
▲

Next PagePrevious Page Table of Contents23 Top 6 Hog Market Movers
Ports will need to remain open and relationships with major trade partners must be solvent as well for trade to remain the important component it is. The U.S. is one of the top three producers and exporters of pig meat in the world (the EU and China being the other two pro-ducers and the EU and Canada being the other large exporters) and, therefore, its influence on the global market is significant.
4. Retail and Food Service Influence. Major food service and retail companies will require hogs to be raised under certain management condi-tions in 2017. For example, some suppliers say they’ll purchase products from suppliers who no longer use
individual sow housing. Dallas Hockman, Vice-Presi-dent of Industry Relations for the National Pork Pro-ducers Council (NPPC), says these requirements have created a lot of discussion, and NPPC has had multiple conversations with McDonalds on origin and traceability.
Another important change is the desire by consumers to know their food’s origin from farm to plate. That’s easier to accomplish with other species, explains Hockman.
“It’s one thing to talk about muscle meats, but when you get into trim from all different parts of the pig, these companies are buying based on spec codes. We’re making progress in moving in that direction and we’ll see what happens going forward,” Hockman says.
While these requirements are difficult to meet in com-modity pork products, some processors will dedicate lines to identity-preserved products. It also creates opportunities for producers who wish to develop niche markets.
“Over the last decade hog carcass prices averaged above 90% of pork cutout value,” Ron Plain, Professor Emeritus at the University of Missouri, says. “This fall, it was below 70% of pork cutout and falling. Whenever hog slaughter approaches slaughter capacity, packing plants become a bot-tleneck in the flow of pork, causing hog prices to drop much faster than wholesale pork prices. Hog prices as a percentage of pork cutout are expected to remain unusually low until the new hog slaughter plants open later in 2017,” he says.
PORK PRICES
▲

Next PagePrevious Page Table of Contents24 Top 6 Hog Market Movers
5. Consumer Influence. We live in the age of activism, Hockman says, and it’s driven by three primary factors: foodie influencers, social media and retailers desire to differentiate them-selves.
Foodie influencers like Dr. Oz, the Food Babe and other self-proclaimed experts have found a home on social media. Consumers tend to “share” philosophies that agree with their own, whether factual or other-wise, and it’s proven that “fake news” has more last-ing power than real news. Until consumers are willing to do their homework by checking facts, this trend is likely to continue.
The world of social media is changing how people feel about food, and there is turbulence in the food-service arena. Geographic expansion is no longer the only fac-tor that ensures marketplace profitability, so retailers and food-service companies are looking for ways to differentiate themselves.
6. Regulatory Restrictions. The Veterinary Feed Directives go into effect on Jan. 1, 2017 and while industry groups have worked diligently to prepare producers, the impact of the VFD remains to be seen. The dialogue surrounding disease resistance isn’t going away anytime soon, but it is our hope that the human medical profession will take more responsi-bility for the issue, since it’s proven that the misuse of antibiotics is the major source of resistance.
While the industry has done an excellent job of self-reg-ulating in terms of best management practices sur-rounding antibiotic use and humane handling practices, more government oversight may be inevitable, perhaps not in the next four years but certainly long-term.
The recently announced proposed changes to the Grain Inspection Packers and Stockyards Administra-tion (GIPSA) are a good example of how government agencies are likely to continue their overreach. That means producer organizations – and producers them-selves – will need to remain diligent in protecting their interests.

Next PagePrevious Page Table of Contents25 Look for These Machinery Opportunities
LOOK FOR THESE MACHINERY OPPORTUNITIES By Greg Peterson
Even in the most challenging economic times, there are opportunities for those in a position to take advantage of them. Be on the lookout for these:
1. The time to be a buyer is when others don’t feel like buying. It’s the theory of opposites at work. There will be a tremendous opportunity in 2017 to upgrade to late-model, used equipment at great deals; a second planter or combine, maybe a sprayer. Many dealers are offering great bargains because new equipment sales have been slow for a while now. When the market turns around, there could be a surge of farm-ers looking to buy. You could get a great deal if you can afford to beat the rush.
2. It pays to take care of your equipment. That has never been more true than now. Have a friend or relative pull out a cellphone and video you planting and harvesting. Save those videos on your phone or computer. They will be important down the road, when it’s time to sell or trade. Personalizing
what you are selling makes it worth more and video is the best way to show what the tractor or planter meant for you.
3. The number of machinery auctions will likely increase during the first half of the year. Watch for sale prices to slightly soften by mid-March to early summer. This is the pattern we’ve tracked from 1990 to 2006, and I think we could return to this pattern in 2017.
Click the video to listen Greg Peterson talk planter prices and the trends to watch in 2017.
▲
Next PagePrevious Page Table of Contents26 Look for These Machinery Opportunities
4. Pre-Tier 4 used tractors will likely be more sought-after in 2017. Auction companies and dealers are using this lan-guage in their tractor ads: “For sale with engines before the latest emissions standards were imple-mented.” When a pre-Tier 4 tractor is up for auction, buyers take more interest.
5. Consider out-of-season purchases for better deals on used equipment. In the fall of 2016, we saw stronger prices on used harvest, grain-handling and tillage equipment and more search traffic to these categories at www.MachineryPete.com. It doesn’t take an economic downturn to know buying out of season can save you a few dollars.
Search for your next piece of farm equipment with more than 105,000 lisitings, at MachineryPete.com.
FARM MACHINERY GOES MOBILE!
With farm machinery prices constantly changing, staying informed has never been more important.
Mobile alerts make it easy to get the information you need, when you need it. Get the latest attention-grabbing piece of equipment direct from Machinery Pete, who monitors the used equipment market across the country.
Click here to sign up for FREE!