Climate information, outlooks, and understanding where ...
17
REVIEW Open Access Climate information, outlooks, and understanding–where does the IRI stand? Anthony G Barnston 1* and Michael K Tippett 1,2 Abstract The International Research Institute for Climate and Society (IRI) began providing user-oriented climate information, including outlooks, in the late 1990s. Its climate products are intended to meet the needs of decision makers in various sectors of society such as agriculture, water management, health, disaster management, energy, education and others. They try to link the current state of the science in climate diagnostics and prediction to the dynamically evolving practical needs of users worldwide. Because most users are not climate scientists, the manner in which the information is provided is of paramount importance in order for it to be understandable and actionable. Non-technical language that preserves essential content is required, as well as graphics that are intuitive and largely self-explanatory. The climate information products themselves must be in demand by users, rather than ones that the producers believe would be best. These requirements are consistent with IRI’s mission of improving human welfare, particularly in developing countries where decision makers may not initially know what climate information they need, and how best to use it. This lack of initial understanding requires back-and-forth communication between the producers and users to initiate and sustain uptake and beneficial use of the information. Backed by its climate prediction research, the IRI’s climate information products span time-scales of days to decades. Experience on the statistics of daily weather behavior within seasons has been gleaned, as has the benefits of statistical and dynamical spatial downscaling of predictions. By providing views in a progressive sequence of temporal scales, IRI’s products help demonstrate that preparation for interannual climate variability may be the best preparation for decadal variability and trends related to climate change. Keywords: Climate; Climate information; Climate forecasts; Climate prediction; Climate research; Climate knowledge; Climate and society; Climate communication; Climate forecast products; Climate risk management Background The International Research Institute for Climate and Society (IRI) began providing current and historical climate infor- mation, including seasonal climate outlooks, in the late 1990s. During the 1980s and earlier 1990s, measureable improvements in understanding of the climate system had taken place in part because of increased availability of, and ability to interpret observations of the climate system. IRI’ s “map room”, available online since 1999 (The IRI’ s climate map room), contains observational information about the state of the global oceanic and atmospheric climate both currently and in recent history. Seasonal and monthly time scales are emphasized, and user-friendly graphical formats and useful descriptions were a priority in designing the displays. Perhaps the most important aspect of an increased understanding of the climate system is the ability to make useful seasonal (e.g., an average or total over 3 months) climate forecasts. Such forecasts are primarily based on the influence of patterns of the ocean sea surface temperature (SST) on the large scale atmos- pheric circulation–particularly the SST in the tropical oceans. The most important oceanic influence on the atmosphere is the El Niño/Southern Oscillation, or ENSO. In 1997, IRI began issuing climate outlooks for the globe, including forecasts for temperature and pre- cipitation for the upcoming two consecutive 3-month periods (Mason et al. 1999). Forecasts were initially issued quarterly, but in 2001 began being issued each month and for all four overlapping 3-month periods between the first and second seasons. All of the IRI’ s * Correspondence: [email protected] 1 International Research Institute for Climate and Society, Columbia University, Palisades, NY, USA Full list of author information is available at the end of the article © 2014 Barnston and Tippett; licensee Springer. This is an Open Access article distributed under the terms of the Creative Commons Attribution License (http://creativecommons.org/licenses/by/2.0), which permits unrestricted use, distribution, and reproduction in any medium, provided the original work is properly credited. Barnston and Tippett Earth Perspectives 2014, 1:20 http://www.earth-perspectives.com/content/1/1/20
Transcript of Climate information, outlooks, and understanding where ...

Barnston and Tippett Earth Perspectives 2014, 1:20http://www.earth-perspectives.com/content/1/1/20
REVIEW Open Access
Climate information, outlooks, andunderstanding–where does the IRI stand?Anthony G Barnston1* and Michael K Tippett1,2
Abstract
The International Research Institute for Climate and Society (IRI) began providing user-oriented climate information,including outlooks, in the late 1990s. Its climate products are intended to meet the needs of decision makers invarious sectors of society such as agriculture, water management, health, disaster management, energy, educationand others. They try to link the current state of the science in climate diagnostics and prediction to the dynamicallyevolving practical needs of users worldwide. Because most users are not climate scientists, the manner in which theinformation is provided is of paramount importance in order for it to be understandable and actionable. Non-technicallanguage that preserves essential content is required, as well as graphics that are intuitive and largely self-explanatory.The climate information products themselves must be in demand by users, rather than ones that the producers believewould be best. These requirements are consistent with IRI’s mission of improving human welfare, particularly indeveloping countries where decision makers may not initially know what climate information they need, and how bestto use it. This lack of initial understanding requires back-and-forth communication between the producers and users toinitiate and sustain uptake and beneficial use of the information. Backed by its climate prediction research, the IRI’sclimate information products span time-scales of days to decades. Experience on the statistics of daily weather behaviorwithin seasons has been gleaned, as has the benefits of statistical and dynamical spatial downscaling of predictions. Byproviding views in a progressive sequence of temporal scales, IRI’s products help demonstrate that preparation forinterannual climate variability may be the best preparation for decadal variability and trends related to climate change.
Keywords: Climate; Climate information; Climate forecasts; Climate prediction; Climate research; Climate knowledge;Climate and society; Climate communication; Climate forecast products; Climate risk management
BackgroundThe International Research Institute for Climate and Society(IRI) began providing current and historical climate infor-mation, including seasonal climate outlooks, in the late1990s. During the 1980s and earlier 1990s, measureableimprovements in understanding of the climate system hadtaken place in part because of increased availability of, andability to interpret observations of the climate system. IRI’s“map room”, available online since 1999 (The IRI’s climatemap room), contains observational information about thestate of the global oceanic and atmospheric climate bothcurrently and in recent history. Seasonal and monthly timescales are emphasized, and user-friendly graphical formats
* Correspondence: [email protected] Research Institute for Climate and Society, Columbia University,Palisades, NY, USAFull list of author information is available at the end of the article
© 2014 Barnston and Tippett; licensee SpringerCommons Attribution License (http://creativecoreproduction in any medium, provided the orig
and useful descriptions were a priority in designing thedisplays.Perhaps the most important aspect of an increased
understanding of the climate system is the ability tomake useful seasonal (e.g., an average or total over3 months) climate forecasts. Such forecasts are primarilybased on the influence of patterns of the ocean seasurface temperature (SST) on the large scale atmos-pheric circulation–particularly the SST in the tropicaloceans. The most important oceanic influence on theatmosphere is the El Niño/Southern Oscillation, orENSO. In 1997, IRI began issuing climate outlooks forthe globe, including forecasts for temperature and pre-cipitation for the upcoming two consecutive 3-monthperiods (Mason et al. 1999). Forecasts were initiallyissued quarterly, but in 2001 began being issued eachmonth and for all four overlapping 3-month periodsbetween the first and second seasons. All of the IRI’s
. This is an Open Access article distributed under the terms of the Creativemmons.org/licenses/by/2.0), which permits unrestricted use, distribution, andinal work is properly credited.

Barnston and Tippett Earth Perspectives 2014, 1:20 Page 2 of 17http://www.earth-perspectives.com/content/1/1/20
forecasts, past and present, are available online (TheIRI’s seasonal climate forecasts). In 2012, IRI developeda more flexible forecast format that enabled users toextract more detailed climate forecast information thanearlier. It also introduced a product providing a descriptivepartitioning of climate variability into three complementarytime-scales, based on a full century of observations.Beginning in early 2002, probabilistic forecasts of the
state of the ENSO itself began being issued. These fore-casts were deemed important because ENSO has knowneffects on climate in specific regions during specific sea-sons of the year. Although these effects are incorporatedinto the climate forecasts, some users desire knowledge ofthe ENSO outlook itself. These ENSO forecasts are avail-able online (The IRI’s forecasts of ENSO).This paper describes several of the main climate prod-
ucts provided to date by IRI, with illustrative examplesand explanations of their utility. Some focal points ofthe research associated with the content of the productsare identified, and two products in current developmentare then highlighted. Finally, some ideas are provided fora path toward better fulfillment of the mission in theyears to come regarding new research and the resultingprovision of improved climate information for the bene-fit of societies, especially in developing countries whereclimate predictability and human need are both greatest(Goddard et al. 2014).
ReviewClimate information products, and the research behind thema. Climate observation maproomMany climate-sensitive users need to know what theclimate is doing right now, or what its state has been inthe recent or more distant past. The IRI’s global climatea
maproom is an extension of its Data Library (The IRI’sseasonal forecast verification site; Blumenthal et al. 2014),which is a data repository containing over 300 datasetsfrom a variety of earth science disciplines and climate-related topics. The maproom automatically displays thelatest updates of many climate fields, while also allowingviewing of past seasons or months of the same variable.Weekly, monthly and seasonal averages of various climatevariables are available, such as 2-meter atmospherictemperature, precipitation, sea level pressure, lower andupper atmospheric circulation, and SST. For example,Figure 1 (top) shows the departure from normal (i.e.,anomaly) of seasonal total precipitation during March2011, suggesting significant flooding in parts of Indonesiaand Southeast Asia in association with the La Niña of2010–11. Both rain gauges and satellite data contribute tothe data used for this anomaly map, using the so-calledCAMS-OPI rainfall data from the Climate PredictionCenter (CPC) of the National Oceanic and AtmosphericAdministration (NOAA) (The CAMS-OPI gauge-plus-
satellite rainfall data from the Climate Prediction Centerof NOAA). A version of the same map that uses only raingauges is shown in Figure 1 (bottom), which is generallyconsistent but leaves large areas devoid of data around theglobe, suggesting the value of satellite-derived rainfallmeasurements in the tropics where errors in satellite-estimated rainfalls are smallest. Some derived variables arealso available, such as the standardized precipitation index(SPI) for various time averages. Some variables areexpressed in terms of percentile as well as the anomalyitself. Specialized map room capabilities include zoomingin on any user-selected rectangular region, an animationof the seasonal march of the seasonal fraction of annualprecipitation, and a point-and-click option to see climato-logical plots of the seasonal march of temperature andprecipitation and freeze days at the selected location. Forsome variables, the change from one month to the next isdisplayed, as seen in Figure 2 for the SST in May and June1997, and the change from May to June, indicating therapid development of the 1997–98 El Niño episode whosestrong climate anomalies caused enormous societal im-pacts worldwide.
b. Seasonal climate forecastsClimate forecasts for the coming season or seasons fartherinto the future, if of sufficient quality, are useful to a myriadof sectors of society. The IRI’s seasonal climate forecasts forthe globe have been made using mainly a two-tieredprocess in which first a predictionb is made for the SST inthe global oceans, and then the SST prediction is used as adriver of a forecast for the atmospheric climate–precipita-tion and temperature (Mason et al. 1999). A mix of dynam-ical and statistical models has been used to develop theSST predictions, varying by tropical ocean basinc. For thefirst forecast season, in addition to these evolving SST pre-dictions, the observed SST anomalies from the mostrecently completed calendar month have been used asanother, more conservative, persisted anomalous SSTprediction scenario. The strategy of establishing the SSTprediction first, and then the climate forecast afterwards,comes out of more than a decade of research on how theclimate is influenced by SST (Bengtsson et al. 1993). Fol-lowing the initial monumental revelations in the 1980sabout ENSO’s climate effects, additional studies at IRI dem-onstrated the roles of more regional SST, such as that ofthe western Indian Ocean on some portions of Africa(Goddard & Graham 1999), and of particular variations ofEl Niño-related SST (Goddard et al. 2006). The degradingeffects of imperfect SST predictions on model-generatedclimate predictions have also been studied at IRI (Goddard& Mason 2002; Li et al. 2008).The format of the issued climate forecasts is probabilistic,
in which the probabilities for the precipitation or tempera-ture to be above normal, near normal, and below normal,

Figure 1 Example of IRI global rainfall observation maps. Departure from normal of precipitation is shown during March 2011 using (top) acombination of gauge and satellite rainfall data, and (bottom) only gauge rainfall measurements. During this month, severe flooding took placein parts of Indonesia and Southeast Asia.
Barnston and Tippett Earth Perspectives 2014, 1:20 Page 3 of 17http://www.earth-perspectives.com/content/1/1/20
are issued for each location for each forecasted season. Thethree categories are defined such that each has beenobserved in one-third of the cases for the given season overa recent 30-year period. This set of three probabilities isintended to provide a general idea of the shift in theexpected odds of the temperature or precipitation from thehistorical climatological distribution. The probabilities arebased mainly on a set of ensembles of predictions fromseveral dynamical atmospheric general circulation models(AGCM)d. Each AGCM produces its own ensemble of pre-dictions, with each member run having slightly differentinitial weather conditionse, but being influenced by thesame SST prediction so that the differing resulting pre-dictions span a distribution that represents the relativeprobabilities of the range of outcomes. Each AGCMprediction is adjusted for its own systematic biases, basedon a collection of hindcasts, which are “predictions” forthe given season for many past years for which the ob-served outcomes already exist. Biases that are adjusted
include ones of average prediction value, direction andamount of deviation from the average value, and even thespatial positions of the main features of the prediction.The advanced regression method, called canonical correl-ation analysis (CCA), is the main vehicle used to adjust formodel biases. The predictions of all of the ensemble mem-bers from the several models are then brought together toform a pool of over 100 members (a multi-model ensem-ble), and a prediction probability distribution is then fairlywell sampled, and therefore reasonably representative.Many studies have demonstrated that multi-model ensem-bles often yield higher predictive skill and utility than theset of ensemble members from any of the single constituentmodels (Kharin & Zwiers 2002; Barnston et al. 2003; Palmeret al. 2004; Hagedorn et al. 2005; Tippett & Barnston 2008).At IRI, research has been conducted to determine the bestmethods to combine the predictions of several models intoa single net probability prediction, as for example how toweight the predictions of the constituent models based on
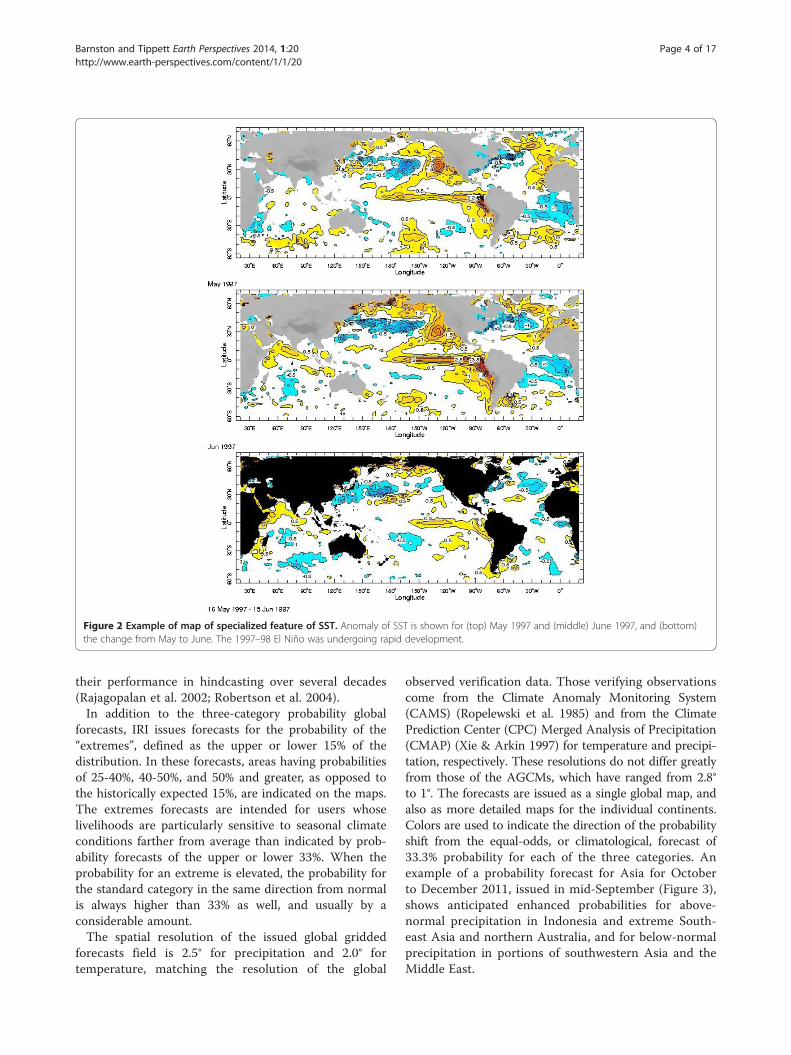
Figure 2 Example of map of specialized feature of SST. Anomaly of SST is shown for (top) May 1997 and (middle) June 1997, and (bottom)the change from May to June. The 1997–98 El Niño was undergoing rapid development.
Barnston and Tippett Earth Perspectives 2014, 1:20 Page 4 of 17http://www.earth-perspectives.com/content/1/1/20
their performance in hindcasting over several decades(Rajagopalan et al. 2002; Robertson et al. 2004).In addition to the three-category probability global
forecasts, IRI issues forecasts for the probability of the“extremes”, defined as the upper or lower 15% of thedistribution. In these forecasts, areas having probabilitiesof 25-40%, 40-50%, and 50% and greater, as opposed tothe historically expected 15%, are indicated on the maps.The extremes forecasts are intended for users whoselivelihoods are particularly sensitive to seasonal climateconditions farther from average than indicated by prob-ability forecasts of the upper or lower 33%. When theprobability for an extreme is elevated, the probability forthe standard category in the same direction from normalis always higher than 33% as well, and usually by aconsiderable amount.The spatial resolution of the issued global gridded
forecasts field is 2.5° for precipitation and 2.0° fortemperature, matching the resolution of the global
observed verification data. Those verifying observationscome from the Climate Anomaly Monitoring System(CAMS) (Ropelewski et al. 1985) and from the ClimatePrediction Center (CPC) Merged Analysis of Precipitation(CMAP) (Xie & Arkin 1997) for temperature and precipi-tation, respectively. These resolutions do not differ greatlyfrom those of the AGCMs, which have ranged from 2.8°to 1°. The forecasts are issued as a single global map, andalso as more detailed maps for the individual continents.Colors are used to indicate the direction of the probabilityshift from the equal-odds, or climatological, forecast of33.3% probability for each of the three categories. Anexample of a probability forecast for Asia for Octoberto December 2011, issued in mid-September (Figure 3),shows anticipated enhanced probabilities for above-normal precipitation in Indonesia and extreme South-east Asia and northern Australia, and for below-normalprecipitation in portions of southwestern Asia and theMiddle East.

Figure 3 Forecast for precipitation for Asia for October-December 2011, issued in mid-September. Color shading indicates the probabilityof the most likely category. The histograms show the probabilities of all three categories in selected regions (see the key). White areas over landindicate no shift in the odds from climatological (33.3%, 33.3%, 33.3%) probabilities. Pink areas indicate where climatologically very lowprecipitation amounts are expected during the season, and no forecast is given. Enhanced probabilities for above normal precipitation wereforecast in the Maritime Continent, and for below normal precipitation in central southwest Asia.
Barnston and Tippett Earth Perspectives 2014, 1:20 Page 5 of 17http://www.earth-perspectives.com/content/1/1/20
To date, two studies have assessed the skill of IRI’s stand-ard seasonal forecasts, one for the first four years (Goddardet al. 2003) and one for the first 11 years (Barnston et al.2010). The skill of the extremes forecasts over 12 years hasalso been examined (Barnston & Mason 2011). All threeevaluations suggest significant predictive skill, and thuspotential utility, of the forecasts for specific regions, eachregion having its own seasons of measured usable skill.These “forecasts of opportunity” are known and are builtinto the forecast probabilities such that in places/seasonsknown to have little or no skill, the climatology forecast(33.3% probability for each of the categories) is issued,shown as white areas on the forecast maps. In some re-gions and seasons, a useful forecast is possible primarilywhen ENSO is not it a neutral state—i.e., when an El Niñoor La Niña is expected. During ENSO-neutral times theclimatology forecast may be issued at the same locationand season, or in some cases an enhanced probability forthe near-normal category may be issued. It is worth notingthat forecasts favoring the near normal category historicallyhave not been as skillful as forecasts favoring below orabove normal (Van den Dool & Toth 1991), likely due tothe fact that the strongest probability forecasts occur in the
form of opposing directions of deviation from climato-logical probabilities (of 33.3%) between the below andabove normal categories, while the near normal categoryusually has a relatively weaker deviation. Temperature hasbeen somewhat more skillfully predicted than precipita-tion, both because its anomaly areas tend to be more co-herent (less “noisy”) and more closely related to associatedlarge-scale atmospheric circulation patterns, and also be-cause it has been more predictably influenced by trends—e.g. a slow warming related to climate change. This lastfactor makes possible additional skill because the threecategories are defined on the basis of a past 30-yearperiod, so that trends show up as predictable biases in onedirection with respect to a climatology based on these pastobservationsf.The IRI keeps a running evaluation of its probabilistic
climate forecasts, including probabilistic accuracy, skill,and a number of other fundamental attributes, using a var-iety of verification measures. This set of forecast evalua-tions is available online (The IRI’s seasonal forecastverification site), accompanied by detailed definitions andexplained meanings of each verification measure. Therange of verification measures, and their descriptions, has

Barnston and Tippett Earth Perspectives 2014, 1:20 Page 6 of 17http://www.earth-perspectives.com/content/1/1/20
come partly as a result of extensive research at IRI on thenature, and advantages and disadvantages of each measure(Mason 2004; Mason 2008). The probabilistic verificationmeasure known as relative operating characteristics, orROC (Mason 1982), which deals with “hits” versus “falsealarms” for one of the forecast categories, underwent par-ticularly intensive research at IRI (Mason & Graham 1999),where an extension of ROC applicable to all forecast cat-egories together rather than one at a time was developed(Mason & Weigel 2009; Weigel & Mason 2011).As an example of one verification measure, the geograph-
ical distribution of the likelihood score, defined as the geo-metric average of the forecast probability assigned to thecorrect (later observed) category, is shown in Figure 4 fortemperature forecasts issued in mid-December for theJanuary-March season. Higher probabilities for the correctcategory are seen in the tropics, as is generally the case forall of the verification measures for both temperature andprecipitation. An important diagnostic for probability fore-casts, known as reliability (Murphy 1973; Wilks et al. 2006),evaluates the correspondence between the full range ofissued forecast probabilities and their associated relativefrequency of observed occurrence, and shows forecast char-acteristics such as probabilistic bias, forecast over-(under-)confidence, and forecast sharpness. A probability forecast issaid to be reliable when, for example, if all of the caseswhen the probability of above normal precipitation is fore-cast to be 50% are collected, the observations are found tobe in the above normal category 50% of the time.Such a reliability analysis is shown in Figure 5 for pre-
cipitation forecasts, averaged over the globe for all seasonsand made 0.5 months ahead of the beginning of the firstmonth. Since the orange and green lines (representing
Figure 4 Verification of IRI’s forecasts for January-March temperatureshown, which is the geometric average of the probabilities issued for the lpositive skill, and scores of 0.4 or more suggest useful levels of skill for man
reliability for the below-normal and above-normal categor-ies, respectively) are close to the dotted diagonal line,favorable reliability is concluded. Forecast sharpness,describing the extent to which the forecasts deviate fromclimatological forecasts of 33.3%, is shown in the histogrambelow the main plot. The sharpness is seen to be small,indicating a relative dearth of probability forecasts withstrong shifts from climatological odds. While this lack ofsharpness may not give users the degree of confidencenecessary to make some important decisions, the fact thatthe reliability lines are close to the diagonal line indicatesthat such weak probability shifts are appropriate and maybe all that is possible, given the inherent uncertainty inprecipitation forecasts in the physical ocean–atmospheresystem and our current state-of-the-science in climatemodeling. A good reliability record implies that when astrong shift in the probabilities does occur, it carries cred-ibility. Because predictability is greater in the Tropics thanover the globe as a whole, reliability for the Tropics aloneshows greater forecast sharpness than that seen inFigure 5.One reasonably might ask if the quality of IRI’s forecasts
is among the best available. IRI is one of a moderatelylarge number of sources of today’s state-of-the-art globalseasonal climate forecasts. Most of the other centers,funded by and principally serving an individual country orregion using their own single global coupled ocean–atmosphere model, include those in Australia, Brazil,Canada, China, European Center, France, Japan, Korea,Russia, UK, and United States, among a few others.Objective global model climate predictions from all ofthese sources are collected into a grand multi-modelensemble prediction, disseminated quarterly by the World
from 1998 to 2013. Here the likelihood verification measure isater-determined correct category. Scores greater than 0.333 indicatey applications.

Figure 5 Reliability analysis for 0.5-month lead forecasts ofglobal precipitation. Forecast data for all seasons are used during1997–2013. The green curve pertains to forecast probabilities forabove-normal precipitation, the orange curve forecast probabilitiesfor below-normal precipitation, and the gray curve for near-normalprecipitation. For above and below normal, least squares regressionlines are shown, weighted by the sample sizes represented by eachpoint. Points representing probability intervals that are forecast in arelatively greater proportion of the time are shown using largersymbols. The diagonal y = x line represents perfect reliability. Thecolored marks on the axes show the overall means of the forecastprobabilities (x-axis) or observed relative frequencies (y-axis). Thelower panel shows the frequency with which each interval ofprobability was forecast, where interval widths are 0.05 (e.g., 0.175–0.225is labeled as 0.20), except that the climatological (0.333) probability isalso explicitly shown.
Barnston and Tippett Earth Perspectives 2014, 1:20 Page 7 of 17http://www.earth-perspectives.com/content/1/1/20
Meteorological Organization (WMO) in a document calledthe Global Seasonal Climate Update (GSCU). The IRI’sforecasts are not included in the GSCU for political rea-sons: Although IRI is located in the US, its forecasts arenot the official US product; the predictions from the modelrun at NOAA/CPC represent the official US contribution.While the IRI’s forecasts are not an official product of anyone country, they nonetheless are well known to manyaround the globe. The comparative quality of the forecastsfrom all of the above-mentioned countries (and from IRI)has never been systematically examined. However, individ-ual model seasonal hindcast skill maps provided in theGCSU document reveal that while the different modelsmay have slightly differing overall average skills, the modelsvary most widely regarding which regions, and duringwhich seasons, they provide most useful predictive skill.
Many of the models tend to have highest skill in thoseregions and seasons of the expected influences of ENSO,as they are capable of reproducing the observed large-scaleresponses to anomalous tropical Pacific SST. This isequally true of IRI’s forecasts. However, there is indirectevidence from a number of independent studies that thepredictions from the model at the European Center forMedium Range Forecasts (ECMWF), a multi-national cen-ter with very high performance computing facilities, mayhave the highest average predictive skill of any mentionedabove, by a slight but noticeable margin. Still, the predic-tions from the models of most of the other countries, andthe forecasts from IRI, are regarded as state-of-the-art inthat they deliver reasonably competitive skill when aver-aged over all regions and seasons.Together with the provision of climate information
since the late 1990s, IRI has actively conducted researchfocusing on specific aspects of climate predictability,toward enabling improvements to the seasonal forecasts.A set of experiments was run using a state-of-the-scienceatmospheric model—the European Center/Hamburg (ECHAM4.5) model from Max Planck Institute in Hamburg,Germany—in which the climate was hindcasted overseveral past decades using both observed and predictedSST to influence the hindcasts during those decades. Onepurpose of the experiments was to determine the benefitsto the probability forecasts resulting from the number ofensemble members used. (Recall that today’s climate pre-dictions come from prediction models run many times,where each run, producing one prediction ensemble mem-ber, is influenced by the same underlying SST predictionbut given slightly differing initial atmospheric weatherconditions—the positions and strengths of the weather fea-turesb.) One outcome of these experiments, also confirmedat other major global climate producing centers, is that thenumber of ensemble members run affects the precision ofthe final predicted probability distribution, such that highquality predictions require large ensemble sizes. Anotherbenefit of the experiment was improved definitions of therelationships between SST anomalies and their consequentclimate anomalies. Better knowledge of SST-climate rela-tionships increases understanding of predicted climateanomaly patterns and also makes possible attribution ofsome of the observed climate anomalies (Barnston et al.2005). The same set of experiments also permitted evalua-tions of the effects of different SST prediction methods onthe skill of the resulting climate predictions (Li et al. 2008),and the importance of the spatial resolution (the smallnessof the model grid squares) on prediction quality.IRI conducted research toward developing a climate
prediction model that predicts SST and the climate simul-taneously—a single-tier design as opposed to the predom-inantly two-tier design used in IRI’s issued climateforecasts (DeWitt 2005). The effort culminated in a well

Barnston and Tippett Earth Perspectives 2014, 1:20 Page 8 of 17http://www.earth-perspectives.com/content/1/1/20
performing model for both climate and SST (e.g., ENSO)predictions (Tippett et al. 2012; Barnston et al. 2012), andone that was later recruited to participate in a NationalMulti-model Ensemble Experiment along with severalother North American single-tier climate models (Kirtmanet al. 2014).Climate prediction, unlike many problems in astron-
omy or solid body physics, does not involve one correctprediction, but instead a wide envelope of possible out-comes. Although there is just one eventual observation,it is unable to be predicted accurately in advance due tothe inherently chaotic, nonlinear nature of the ocean–atmosphere system. This probabilistic aspect creates chal-lenges to many forecast users, as many of the resultingforecasts involve only a slight to moderate tilt of theodds away from the historical, or climatological, prob-ability distribution that exists by default without anycurrent forecast information. Making the best use ofprobabilistic forecasts has been a focus of IRI’s research.One aspect of this issue is the presentation of the fore-cast information, given a choice of formats with whichto represent probability forecasts over a spatial domain.One option is to provide three maps for each forecast,each showing the spatial distribution of the probabilityfor one of the three categories (below-, near-, andabove-normal). Another option, and the one that IRIadopted, is to present a single map with color shadingindicating which category is most likely, as well as theprobability of that dominant category (Figure 3). Prob-ability histograms are inserted at some locations to helpcommunicate the three probability levels. Experimentsrelated to choices in forecast map presentation haveindicated that for any map format, understanding is noteasy for some users, and there is a learning curve requir-ing careful study of the map legend and the providedexplanation (Ishikawa et al. 2011). It remains a challengeto present probabilistic information in a simple, user-oriented format, given that some users lack the time orpatience to learn to assimilate information that initiallyseems overly complex or confusing. Thus, as one com-ponent of partnering with users and their representativeorganizations, capacity development workshops aredesigned to methodically educate and train both weatherservice personnel and end users who benefit from know-ing how best to use climate information (Mantilla et al.2014). A free and easily downloadable climate predictiontool developed at IRI, called the Climate PredictabilityTool (CPT), allows users to apply sophisticated multi-variate linear regression methods (e.g., CCA or principalcomponents regression) to get downscaled (localized)prediction probabilities and maps (Korecha & Barnston2007; Recalde-Coronel et al. 2014) without having tocomprehensively learn the mathematics or create theirown software. In the particularly fruitful case of the
South African Weather Service, a sustained collaborativerelationship with IRI has included not only the use anduptake of CPT, but sharing of statistical and dynamicalforecast methodologies and even specific AGCMs, andadoption of best practices in the scientific and operationalaspects of climate prediction (Landman 2014). Such bene-ficial linkage to meteorological centers in other countriesis being built on a more global scale through IRI’s contri-butions to the WMO’s recent programmatic effort in theform of the Global Framework for Climate Services(GFCS) (Hewitt et al. 2012), whereby prediction tools suchas CPT are being provided along with the appropriatetraining. CPT has now been added as a prediction tool ina sizable list of developing countries.A more substantive aspect of the probabilistic nature
of climate forecast comes with the use of forecast infor-mation in decision making in sectors of society such asagriculture, water management, health, energy and disas-ters (e.g., floods, hurricanes, droughts, extreme cold orheat). Making decisions under conditions of forecastuncertainty involves decision theory and aspects of highermathematics for which many users lack tools for directuse. IRI personnel have had success in partnering withusers and their representatives in developing countries inAfrica, Asia and Latin America to help make optimumuse of probabilistic climate forecasts for risk managementand decision making (Goddard et al. 2010; Lyon et al.2014). Some examples of these beneficial applications arehighlighted in subsection c below.Recently, as an extension of the 3-category probability
forecast format, IRI developed a more flexible forecastformat that enables users to extract information for thoseparts of the forecast distribution of greatest interest tothem, such as the probability of extremely dry conditions(e.g., the driest 10%), in the wettest 40% of the distribution,or any others. Additionally, the forecast probability distri-bution for a specific location is given in terms of thetemperature or precipitation in its own physical units asopposed to the probabilities of the three categories withouta direct indication of the boundaries between those cat-egories, which requires consulting a separate web page. Anexample of the flexible format version of a temperatureforecast is shown in Figure 6, where the map shows theprobability of exceeding the climatological 50th percentile,or median, and the two insets show the forecast probabilitydistribution (one as an actual probability density functionand the other as a cumulative density function) in °C for alocation in northern Brazil where a locally strong shifttoward above-normal temperature is forecast. The mapcan be controlled to show the probability of exceeding(or not exceeding) a large set of user-selected percentiles.Providing flexibility in the forecast format allows users toglean from the forecast what matters most to them, whichvaries widely depending on the application.

Figure 6 Example of a flexible format forecast for temperature. Here the forecast was for the February-April season, issued in mid-January2013. In top panel, the contours indicate the climatological (expected) temperature for the season, and the color shading shows the probabilityof exceeding that temperature. The bottom panels show the forecast probability distribution (green) along with the climatological distribution(black) for the grid square located at 5°S, 57°W in northern Brazil where a strong shift of the odds toward above-normal temperature was forecast.The lower left panel shows the cumulative forecast probability distribution, and the lower right panel shows the probability density function itself.
Barnston and Tippett Earth Perspectives 2014, 1:20 Page 9 of 17http://www.earth-perspectives.com/content/1/1/20
For a known set of regions and season, the single mostimportant determinant of the seasonal climate outlooksis the expected ENSO state during the targeted season.Therefore, many users are interested in an outlook forENSO itself. Since the early 2000s the IRI has providedinformation, including recent observations and forecasts,of the ENSO state. This information has been encapsu-lated into a graphical product called the ENSO QuickLook, which itself contains forecast summaries and adisplay of current predictions of dynamical and statis-tical models whose skills have been evaluated (Tippettet al. 2012; Barnston et al. 2012). Figure 7 illustrates anENSO Quick Look issued near the end of 2012, follow-ing a period when a possible weak El Niño failed tomaterialize and neutral conditions were then expected.A technical narrative about the ENSO condition andoutlook is also issued each month.Beginning in late 2011, the Climate prediction Center (CPC)
of the National Oceanic and Atmospheric Administration
(NOAA) and IRI began sharing jointly some of themonthly production tasks pertaining to ENSO diagnosticand forecast products, including the ENSO DiagnosticDiscussion and a long-lead ENSO probability outlookbased on human judgment (Figure 7, lower left panel) andon a set of objective model predictions summarized on theIRI/CPC ENSO prediction plume (lower right panel). Ac-cordingly, the plume diagram and the ENSO DiagnosticDiscussion now bear the names of both institutions.
c. Specialized or tailored forecastsMany decision makers need outlooks for aspects of climatedifferent from seasonal total precipitation and averagetemperature for a large grid square such as one of thoseused in IRI’s global climate forecasts. Perhaps the mostcommon request is for forecasts for shorter periods em-bedded within the 3-month season, such as the individualmonths or even week-to-week variations. Another com-mon need is for forecasts for a particular location, whose

Figure 7 Example of an ENSO Quick Look issued at end of December 2012. The top left and top right panels show forecast probabilities ofEl Niño, neutral and La Niña conditions through the first half of 2013 made by humans and objectively by models, respectively. The bottom leftpanel shows a multidecadal ENSO history, and bottom right shows the IRI/CPC ENSO prediction plume, containing model predictions for theNiño3.4 SST region as indicated directly from a set of models.
Barnston and Tippett Earth Perspectives 2014, 1:20 Page 10 of 17http://www.earth-perspectives.com/content/1/1/20

Barnston and Tippett Earth Perspectives 2014, 1:20 Page 11 of 17http://www.earth-perspectives.com/content/1/1/20
climate may differ from that of the embedding grid squaredue to local geographical features such as mountains orbodies of water. Finally, some users want to forecast a non-climate variable directly, such as crop yield, without neces-sarily first predicting rainfall and then using the rainfallforecast as a predictor of the crop yield. IRI has carried outresearch on each of the above problems, which are gener-ally considered forms of downscaling.Spatial downscaling can refer simply to calibrating the
climate forecast in a grid square to an exact locationwithin the square by considering the climatic differencebetween the location and the average over the square. Alinear calibration might be all that is necessary to obtainthe local forecast. A more complex version of spatialdownscaling is required when the climatic differencebetween the location and the average over the gridsquare is caused by significant local features such as theterrain or land surface conditions. In this case, a simplecalibration may not suffice, because the direction of theclimate anomaly in the grid square may not carry overto the exact location of interest. An example would bewhen a grid square is located mainly over the windwardpart of an mountain range, but we are interested in fore-casting for a town on the inland, or leeward, side of themountain range—a location whose rainfall anomalytendency may be in the opposite sense to that of theaverage over the grid square. Resolving the often oppos-ing anomalies may be done either statistically, as testedin South Africa (Landman et al. 2009), or through use ofa regional dynamical model, as was done for semi-aridnortheast Brazil in an IRI project in the early 2000s (Sunet al. 2005), or likewise in recent work focusing boththere and in Chile, in the context of water managementissues (Robertson et al. 2014).Forecasting for portions of a season, often known as
temporal downscaling, is challenging because the accur-acy of daily weather forecasts extends only to about 10to 14 days in advance. Meanwhile, the benefit of sea-sonal climate forecasts relies on averaging over a largeamount of time in order that the weak but consistent in-fluence of SST patterns may stand out above the “noise”of the unpredictable daily weather fluctuations. However,it is possible to identify correlations between seasonalclimate and the climate during subseasonal periods, andeven the character of the day-to-day weather. A com-mon example of the latter that is of interest to the agri-cultural community is the occurrence of “dry spells”within a season, where a dry spell is defined as a se-quence of at least a certain number of days (e.g., 4 or 5)without any meaningful rainfall (e.g., 1 mm or more).Although the number of dry spells during a season isexpected to be inversely related to the seasonal rainfalltotal, the relationship is not always straightforward,because the degree and typical time scale of subseasonal
rainfall variation becomes important. In addition to dryspell occurrences, the number of non-dry days over thecourse of a season may be of greater interest than theseasonal rainfall total (Robertson et al. 2009).Rainfall or temperature forecasts may be desired in
order to prepare for something of societal significancesuch as the threat of a malaria epidemic in Botswana(Thomson et al. 2006), meningitis in western Africa(García-Pando et al. 2014), corn yield in Kenya (Hansenet al. 2009) or some countries in South America, orwater resources in the Philippines (Brown & Carriquiry2007; Lyon & Camargo 2009). Stakeholders may considerthe climate forecast to determine the consequent probabil-ities of outcomes within their application, and make theirdecision accordingly. IRI has striven to increase awarenesson the parts of potential beneficiaries that climate informa-tion is useful to their welfare and success, and to make therelevant climate information easily accessible, understand-able and usable to them (Hansen et al. 2014; Dinku et al.2014). A particularly good example of this building ofawareness and demand has been in IRI’s partnership withthe International Red Cross/Red Crescent organizations(Coughlan De Perez and Mason 2014).Interestingly, some IRI research has demonstrated that
using SST anomaly patterns to predict rainfall, and thenpredicting an applied variable (such as crop yield or diseaseepidemic) from the rainfall, sometimes does not predictthe applied variable as well as predicting the applied vari-able directly from SST without considering rainfall as anintermediary. Such bypassing of rainfall led to better pre-dictions of wheat yields in Australia (Hansen et al. 2004)despite that rainfall is likely the most important mediatingvariable. A similar finding emerged in the prediction ofwildfire activity in Indonesia (Ceccato et al. 2014), andmaize yield in Colombia in a recent set of experiments.Bypassing rainfall in the prediction chain may be beneficialbecause the rainfall is a “noisier” field than yield, orbecause the rainfall is expressed as a seasonal total ratherthan at the subseasonal temporal scale of greater import-ance to the crop yields or fire activity. Another possibleexplanation is that the final result depends on climate vari-ables additional to precipitation (e.g., temperature and/orhumidity), whose most likely values are implicit in the SSTpatterns. Bypassing intermediate variables in a multi-stepprediction process simplifies the prediction task, and is ap-pealing when the ultimate goal is the final benefit to societyrather than predicting the climate variables per se.
d. Toward decadal and longer forecastsForecasts of seasonal or subseasonal temperature andprecipitation, while important to many users, representonly part of the range of time scales that are in demand.With increasing awareness and concern about climatechange, many policy makers are interested in outlooks

Barnston and Tippett Earth Perspectives 2014, 1:20 Page 12 of 17http://www.earth-perspectives.com/content/1/1/20
going out to 5 or 10 years and longer (Meehl et al. 2009;Goddard et al. 2012). The long-term projections from alarge set of climate models have been analyzed, consoli-dated and published by the Intergovernmental Panel onClimate Change (IPCC) (Solomon et al. 2007), given sev-eral specific future greenhouse gas scenarios. These projec-tions, accompanied by their estimated uncertainties, areavailable in print and on the web. However, many userscannot adequately understand the projections, and particu-larly the implications of their uncertainties, without takingtime to study them extensively—time they may not have.The IRI has involved itself in several research projects
relating to climate prediction on decadal and longer time
Figure 8 Example from the time scales maproom for temperature. Thof the proportion of the total temperature variance through the 20th centufor the January-March season.
scales. While these embryonic study areas carry the chal-lenge of a relative lack of data with which to verify theprediction models, the observational record has showndecadal variability over the last century and also a clearwarming trend, especially when averaged over the globe,between the 1970s and the 2010s. Best practices inestablishing probabilistic predictions on the decadal timescale and even for end-of-century climate, and methodsto verify such predictions, have been at the center ofIRI’s research on these longer time scales.The IRI does not attempt to translate or simplify the
IPCC projections for public consumption, in part becauseit has another message about climate change projections
e top, middle and bottom panels show the geographical distributionry coming from interannual, decadal, and trend variability, respectively,

Barnston and Tippett Earth Perspectives 2014, 1:20 Page 13 of 17http://www.earth-perspectives.com/content/1/1/20
that it wishes to emphasize. That message pertains to apreferred way to view climate change projections in rela-tion to year-to-year climate variations—namely, that theseshorter-term variations (climate variability) in most casesare expected to continue to overwhelm the slower, longer-term changes into the coming several decades. Therelatively greater magnitude of interannual variability ascompared with climate change has prevailed over thepast century and even the past several decades in whichwarming has been observed, and is expected to continueinto the future even if the rate of climate change becomesgreater than it has been in the last several decades.To demonstrate the relative magnitudes of the variability
on interannual, decadal, and trend-like time scales, the IRIhas developed a page on the web called the time scalesmap room (The IRI’s time scales map room). The totalobserved variability is partitioned into the three generalfrequency bands based on the data during the 20th century,using digital filtering methods, and the relative contribu-tions from each time scale are shown (Greene et al. 2011).The analyses are useful because the time scale(s) of pri-mary concern varies by application, and further by context.For example, the risk of crop loss due to insufficientseasonal rainfall is generally elevated during years havingbelow average rainfall due to climate controls varying on ayear-to-year basis, such as ENSO or the tropical SST inany ocean basin. However, decades that themselves aredrier than normal may also have noticeable additional
Figure 9 Example of time scale partitioning for a specific location andseason is partitioned for a grid point in central Colombia among (top left)The three time scales account for 63%, 17% and 20% of the variability of thshown in Figure 8 triggers the display of these three plots. The total (raw)
impact. An understanding of how variations on differenttime scales combine to produce the observed climate his-tories can help plan strategies for adaptation or risk mitiga-tion. For example, Figure 8 shows the global distribution ofthe proportion of contribution of interannual, decadal andtrend variability to the total variability for temperature forthe January-March season. Focusing on a particular loca-tion, such as central Colombia, Figure 9 shows the filteredtime series of the temperature over the 20th century foreach of the three time scales and indicates the approximatepercentages of variance contained in each. In the case ofcentral Colombia there is substantial trend variabilitytoward the end of the century and some decadal variabilitybetween about 1950 and 1985, in addition to the moredominant interannual variability. Figure 8 shows that al-though some locations have larger decadal and trend com-ponents of variability than seen in this location, in manylocations interannual variability dominates more stronglythan seen here. Additionally, the interannual scale gener-ally dominates to a greater extent for precipitation than fortemperature, because trends are weaker for precipitation inmost cases (not shown).A logical conclusion suggested by the relative dominance
of the interannual time scale is that while decadal andtrend variability may be important, particularly cumula-tively in the case of consistent upward trends (e.g. withcontinued warming after 20+ years into the future), beingprepared for the year-to-year ups and downs of tem
season. Here the temperature time series for the January-Marchinterannual, (top right) decadal and (bottom) trend-related variance.e total time series, respectively. Clicking on this location in the maptime series is shown in the panel showing the trend.

Barnston and Tippett Earth Perspectives 2014, 1:20 Page 14 of 17http://www.earth-perspectives.com/content/1/1/20
perature or precipitation remains the dominant concernfor many applications. One impact of decadal variabilityand/or trends is that extremes in one direction from theaverage become more likely than extremes in the oppositedirection. Being prepared for extremes in either directionis always prudent with or without decadal variability andtrends related to climate change, and is all the more im-portant with the two later components with the probabilityfor extremes in one direction becoming greater. Seasonalclimate predictions ideally incorporate all three time scalestogether. The fact that most of the IRI’s seasonal forecastsshow much larger areas having enhanced probabilities forabove normal than below normal temperature indicatesthat upward trends are indeed represented, given that theboundaries between the near-normal category and each ofthe two other categories are based on a recent but com-pleted (and thus, too cold to accurately represent today)30-year period. Because interannual variability is thepredominant time scale, and because it is essentially unpre-dictable beyond about one year in advance, climate fore-casts for more than a year into the future would consist ofpredictable decadal variability and trends. The resultingforecasts, besides having variable expected skill (Meehlet al. 2009), might often be too weak to be of interest tomost users, and therefore they are not usually produced.The predictions of the IPCC target much longer averagingperiods, such as for the 30 years at the end of the 21st
century, and become more meaningful when accompaniedby their substantial uncertainty estimates. Even in the caseof very long period averaging, the unpredictable interan-nual variability would inevitably cause temperatures for agiven season at the end of the century to vary considerablyamong adjacent years, and such interannual variability isas important for very long-term planning (e.g., urbandevelopment) as the warmer average climate.
Conclusion: Our achievements, and the way forwardThe IRI’s climate information products and services aredesigned to help decision makers in many societal sec-tors and also forecasters in hydrometeorological agenciesin developing countries. Although interest in, and uptakeof, the information has occurred and has resulted insome verifiable societal benefits, some aspects of IRI’sgoals have not yet been adequately met. One problem isthat some users who are interested and willing to investtime into using climate information are unable to do sobecause of existing rules or constraints regarding how toconduct their activities, such as a rigidly defined set ofprocedures authorized by their federal government thatcannot be easily changed. Another problem is that somepotential users who would be permitted to use climateinformation are not willing to spend the needed timelearning about how climate forecasts can help thembetter achieve their goals. Moreover, among users who
are willing and able to use climate information and fore-casts, a recurrent problem is that they may not sufficientlyunderstand the probabilistic nature of climate forecasts,and implications for their proper use in making decisions.There are two directions in which this lack of understand-ing may manifest itself: On the one hand, they mayminimize the meaning of the probabilistic informationand regard the most likely forecast category to be theforecast in an unqualified sense; and secondly, they mayunderstand the probabilistic information but interpret ittoo pessimistically, so as to believe it is virtually worthless,when over a long period of time it would more clearly beeconomically advantageous if used consistently properly.This second misunderstanding may develop when theobservations do not occur in the category having thegreatest forecast probability in the initial one or two tri-als of using the forecasts. Both of these misconceptionshave proven able to be ameliorated through repeatedcommunication, preferably face-to-face and in instances ofimminent application (e.g., during times of local forecastissuance, with stakeholders present and needing to makedecisions such as what crop varieties to plant and when toplan them).Users frequently express interest in forecasts having more
temporal or spatial detail than is scientifically possible, suchas spatially detailed week-to-week scenarios within thecoming season. Again, communication can help rectifysuch an unrealistic expectation.Although IRI has worked hard to make the observational
and forecast information understandable, many browsers ofthe web pages express confusion and need help in learningthe correct meaning of the information. Sometimes theyare not willing or able to read metadata relating to theproduct, while in other cases they do attempt to read therelevant material but still find the graphical charts or mapsunintelligible. The users most able to absorb and use theclimate information appropriately have been from thedeveloped world, and often in private businesses such asenergy or agricultural businesses or even weather derivativeenterprises. However, a recent survey of subscribers to ourforecasts indicated that while many of them are from Eur-ope and the United States, a moderate percentage of themare from Central or South America and in the agriculturalsector, using the map room and/or the ENSO and climateforecasts for short-term planning purposes. This findingclearly represents a concrete success. Likewise, the uptakeand sustained use of CPT (see the subsection on seasonalclimate forecasts above) by meteorological offices for mak-ing objective climate predictions in a moderately large setof developing countries in Africa, the Caribbean, LatinAmerica and a few others (Mantilla et al. 2014) is consid-ered a measurable success. Although success is relative, andit is difficult to assess some aspects of IRI’s success levelsusing objective criteria, it is clear that IRI’s efforts to link

Barnston and Tippett Earth Perspectives 2014, 1:20 Page 15 of 17http://www.earth-perspectives.com/content/1/1/20
climate science with society have been improving humanwelfare in an increasing number of developing countries.An increasingly common issue among users is their
interest in forecasts on longer, decadal to climate changetime scales. This brings out a need to more carefullyexplain the interplay of different time scales in anticipatingnear- and longer-term climate conditions to be expected.New and continuing research on this subject is needed,and IRI fully expects to rise to the occasion. The timescales map room product is just a beginning for whatcould and should become a more seamless suite of prod-ucts for climate on sub-seasonal to century time scales.An example of such an innovative product would be a sea-sonal forecast that explicitly breaks down the interannual,decadal and trend components in separate maps to revealthe contributions from each time scale. While the interan-nual component would usually be expected to dominate,there might be some seasons and locations in which oneof the other components plays a significant role. Anotherpotential product would be an explicit forecast for theaverage climate over the coming 10 years, based onincreasing knowledge of the drivers of decadal climatevariability. Regardless of what shape its future climateinformation products take, IRI intends to be a beacon ofenlightenment to help quell the insatiable needs, questionsand confusion of societies that potentially could make useof climate information to their economic advantage andfor their general welfare.
EndnotesaMaprooms other than that of global climate are also
available. Those applying climate in a specialized,context include those of food security, fire, and theInternational Federation of Red Cross and Red CrescentSocieties. Also, besides the global scale climate, regionalscale and ENSO-specific maprooms may be selectedb. Inthis paper, the term “prediction” is used when producedentirely by an objective method, or set of methods, suchas by one or more prediction models, and not altered byhuman forecasters. Alternatively, “forecast” is used whensome form of human judgment also enters into the finalproduct. “Prediction” is also used when referring to theoverall discipline or field of predicting the climatec. Inall three tropical ocean basins, the Coupled ForecastSystem SST prediction from the NCEP, and the con-structed analogue SST prediction also from NCEP, areused. In the tropical Pacific Ocean, the Lamont-DohertyEarth Observatory intermediate coupled model (version5) is also used. In the tropical Indian Ocean, a CCA pre-diction is also used, using the predicted tropical PacificSST prediction and the recently observed Indian OceanSST as predictorsd. The set of AGCMs used by IRI hasevolved since 1997. The six AGCMs used at the time ofthis writing include: (1) ECHAM4.5 (from Max Planck
Institute, Hamburg, Germany, run at IRI, 24 ensemblemembers); (2) CCM3.6 (from NCAR, Boulder ColoradoUS, run at IRI, 24 members); (3) CFSv2 (from NCEP,College Park, Maryland, US, run at NCEP, 24 members,1-tiered output used; (4) COAPS (from Florida StateUniversity, Tallahassee, Florida, US, run at FSU, 12 mem-bers); (5) GFDL (from Princeton, New Jersey, US, run atGFDL, 30 members) and (6) COLA2.2.6 (from Fairfax,Virginia, US, run at COLA, 36 members)f. The weatherconditions are not predictable beyond about 10–14 days,but serve as a randomizing agent for the seasonal climatepredictions; hence, using initial weather conditions asactually observed is unnecessarye. Not all climatologistsagree that this trend-based source of skill is “fair”. Amongthose who do not, most think that skill should be basedmore exclusively on the ability to distinguish year-to-yearvariations within a given decade.
AbbreviationsAGCM: Atmospheric general circulation model; CAMS: Climate AnomalyMonitoring System; CAMS_OPI: CAMS Outgoing longwave radiationPrecipitation Index; CCA: Canonical correlation analysis; CCM3.6: Communityclimate model version 3.6 model; CFSv2: Climate forecast system version 2model; CMAP CPC: Merged analysis of precipitation; COAPS: Center forocean–atmosphere prediction studies model; COLA2.2.6: Center forocean-land-atmosphere studies version 2.2.6 model; CPC: Climate predictioncenter (in College Park, Maryland, US); ECMWF: European center formedium-range weather forecasts (in Reading, UK); ECHAM4.5: EuropeanCenter/Hamburg version 4.5 model; FSU: Florida State University(in Tallahassee, Florida, US); GFCS: Global Framework for Climate Services;GFDL: Geophysical Fluid Dynamics Laboratory model (in Princeton, NewJersey, US); GSCU: Global Seasonal Climate Update; IPCC: IntergovernmentalPanel on Climate Change; IRI: International research institute for climate andsociety (in Palisades, New York, US); NCAR: National center for atmosphericresearch (in Boulder, Colorado, US); NCEP: National centers for environmentalprediction; NOAA: National oceanic and atmospheric administration;SPI: Standardized precipitation index; SST: Sea surface temperature;WMO: World Meteorological Organization (in Geneva, Switzerland).
Competing interestsThere are no competing interests on the parts of either of the authors.
Authors’ contributionsAGB designed and composed the manuscript and its graphics. MKT proofedthe manuscript and provided helpful suggestions. Both authors read andapproved the final manuscript.
Authors’ informationAB oversees the production and scheduled issuance of a range of IRI climateforecast products. He participates in implementation of improved methodsand tools to enhance the quality and content of the forecasts. He seeks toengage the user community on forecast interpretation and use, includingthe national and international media. He provides training and capacitybuilding on aspects of climate forecasting for visiting scientists, students, andforecasters at national meteorological centers abroad. He designed andteaches the statistics portion of a core quantitative course in the curriculumof the Climate and Society Masters Program at Columbia University—acourse relating climate to decision making in the climate-sensitive componentsof society. He has published studies involving verification of climate predictionmethods used over the last 30 years.MT leads the Global Prediction Development effort at the IRI and works onproblems related to predictability and the application of statistical methodsin climate science. He develops improved methods and tools to enhancethe quality of the IRI’s seasonal climate forecasts.

Barnston and Tippett Earth Perspectives 2014, 1:20 Page 16 of 17http://www.earth-perspectives.com/content/1/1/20
AcknowledgementResponsible editor: Hong Liao
Author details1International Research Institute for Climate and Society, Columbia University,Palisades, NY, USA. 2Center of Excellence for Climate Change Research,Department of Meteorology, King Abdulaziz University, Jeddah, Saudi Arabia.
Received: 1 October 2013 Accepted: 19 February 2014Published: 17 June 2014
ReferencesThe IRI’s climate map room. [http://iridl.ldeo.columbia.edu/maproom/Global/
index.html]The IRI’s seasonal climate forecasts. [http://iri.columbia.edu/our-expertise/climate/
forecasts/seasonal-climate-forecasts/]The IRI’s forecasts of ENSO. [http://iri.columbia.edu/our-expertise/climate/
forecasts/enso/]The IRI Data Library. [http://iri.columbia.edu/resources/data-library/]The CAMS-OPI gauge-plus-satellite rainfall data from the Climate Prediction
Center of NOAA. [http://iridl.ldeo.columbia.edu/SOURCES/.NOAA/.NCEP/.CPC/.CAMS_OPI/.v0208/]
The IRI’s seasonal forecast verification site. [http://iri.columbia.edu/our-expertise/climate/forecasts/verification/]
The IRI’s time scales map room. [http://iridl.ldeo.columbia.edu/maproom/Global/Time_Scales/index.html]
Barnston AG, Mason SJ (2011) Evaluation of IRI's seasonal climate forecasts forthe extreme 15% tails. Wea Forecasting 26:545–554
Barnston AG, Mason SJ, Goddard L, DeWitt DG, Zebiak SE (2003) Multimodelensembling in seasonal climate forecasting at IRI. Bull Am Meteorol Soc84:1783–1796
Barnston AG, Kumar A, Goddard L, Hoerling MP (2005) Improving seasonalprediction practices through attribution of climate variability. Bull AmMeteorol Soc 86:59–72
Barnston AG, Shuhua L, Mason SJ, DeWitt DG, Goddard L, Gong X (2010)Verification of the first 11 years of IRI’s seasonal climate forecasts. J ApplMeteorol Climatol 49:493–520
Barnston AG, Tippett MK, L’Heureux ML, Li S, DeWitt DG, DeWitt DG (2012) Skillof real-time seasonal ENSO model predictions during 2002–11. Is our capabil-ity increasing? Bull Am Meteorol Soc 93:631–651
Bengtsson L, Schlese U, Roeckner E, Latif M, Barnett T, Graham N (1993) A two-tiered approach to long-range climate forecasting. Science 261:1026–1029
Blementhal MB, Bell M, del Corral J, Cousin R, Khomyakov I (2014) IRI Data Library:Enhancing accessibility of climate knowledge. Earth Perspect 1:19
Brown C, Carriquiry M (2007) Managing hydroclimatological risk to water supplywith option contracts and reservoir index insurance. Water Resour Res 43,W11423, doi:10.1029/2007WR006093
Ceccato P, Fernandez K, Ruis D, Allis E (2014) Climate and environmentalmonitoring for decision making. Earth Perspect 1:16
Coughlan De Perez E, Mason SJ (2014) Climate information for humanitarianagencies: Some basic principles. Earth Perspect 1:11
DeWitt DG (2005) Retrospective forecasts of interannual sea surface temperatureanomalies from 1982 to present using a directly coupled atmosphere–oceangeneral circulation model. Mon Weather Rev 133:2972–2995
Dinku T, Block P, Sharoff J, Hailemariam K, Osgood D, Del Corral J, Cousin R,Thomson MC (2014) Bridging critical gaps in climate services andapplications in Africa. Earth Perspect 1:15
García-Pando CP, Thomson MC, Stanton MC, Diggle PJ, Hopson T, Panya R,Miller RL (2014) Meningitis and climate–From science to practice 1:14
Goddard L, Graham NE (1999) The importance of the Indian Ocean for simulatingprecipitation anomalies over the eastern and southern Africa. J Geophys Res104:19099–19116
Goddard L, Mason SJ (2002) Sensitivity of seasonal climate forecasts to persistedSST anomalies. Climate Dynam 19:619–632
Goddard L, Barnston AG, Mason SJ (2003) Evaluation of the IRI’s “Net Assessment”seasonal Climate Forecasts: 1997–2001. Bull Am Meteorol Soc 84:1761–1781
Goddard L, Kumar A, Barnston AG, Hoerling MP (2006) Diagnosis of anomalouswinter temperatures over the eastern United States during the 2002/03 ElNiño. J Clim 19:5624–5636
Goddard L, Aichellouche Y, Baethgen W, Dettinger M, Graham R, Hayman P, KadiM, Martinez R, Meinke H (2010) Providing seasonal-to-interannual climate
information for risk managmement and decision-making. Procedia EnvironSci 1:81–101
Goddard L, Hurrell JW, Kirtman BP, Murphy J, Stockdale T, Vera C (2012) Two timescales for the price of one (almost). Bull Am Meteorol Soc 93:621–629,doi:10.1175/BAMS-D-11-002201
Goddard L, Baethgen W, Bhojwani H, Robertson AW (2014) The InternationalResearch Institute for Climate and Society: Why, what and how. EarthPerspect 1:10
Greene AM, Goddard L, Cousin R (2011) Web tool deconstructed variability intwentieth century climate. EOS, Transactions Amer Geophys Union92(45):397–398
Hagedorn R, Doblas-Reyes FJ, Palmer TN (2005) The rationale behind the successof multi-model ensembles in seasonal forecasting - I Basic concept. TellusSeries A Dynamic Meteorology Oceanography 57:219–233,doi:10.1111/j1600-0870200500103x
Hansen JW, Potgieter A, Tippett MK (2004) Using a general circulation model toforecast regional wheat yields in Northeast Australia. Agric Forest Meteor127:77–92
Hansen JW, Mishra A, Rao KPC, Indeje M, Ngugi RK (2009) Potential value ofGCM-based seasonal rainfall forecasts for maize management in semi-aridKenya. Agric Syst 101:80–90
Hansen JW, Zebiak SE, Coffey K (2014) Shaping global agendas on climate riskmanagement and climate services; an IRI perspective. Earth Perspect 1:13
Hewitt C, Mason S, Walland D (2012) The global framework for climate services.Nat Clim Chg 2:831–832
Ishikawa T, Barnston AG, Kastens KA, Louchouarn P (2011) Understanding,evaluation and use of climate forecast data by environmental policystudents. In: Feid AD, Stokes A (eds) Special Paper 474, Qualitative Inquiry inGeosciences Education Research, Geolog. Soc. Amer., pp 153–170
Kharin VV, Zwiers FW (2002) Climate predictions with multimodel ensembles. JClim 15:793–799, doi:10.1175/1520-0442(2002)015<0793:CPWME>20CO;2
Kirtman BP, Min D, Infanti JM, Kinter JL, Paolino DA, Zhang Q, Van Den Dool H,Saha S, Mendez MP, Becker E, Peng P, Tripp P, Huang J, DeWitt DG, TippettMK, Barnston AG, Li S, Rosati A, Schubert SD, Lim Y-K, Li ZE, Tribbia J, PegionK, Merryfield W, Denis B, Wood E (2014) The North American Multi-ModelEnsemble (NMME): Phase-1 Seasonal to Interannual Prediction, Phase-2Toward Developing Intra-Seasonal Prediction. Bull Amer Meteor Soc 95, inpress (April 2014)
Korecha D, Barnston AG (2007) Predictability of June–September Rainfall inEthiopia. Mon Weather Rev 135:628–650
Landman A (2014) How the International Research Institute for Climate andSociety has contributed towards seasonal climate forecast modeling andoperations in South Africa. Earth Perspect 1:22
Landman WA, Kgatuke M, Mbedzi M, Beraki A, Bartman A, du Piesanie A (2009)Performance comparison of some dynamical and empirical downscalingmethods for South Africa from a seasonal climate modeling perspective. Int JClimatol 29:1535–1549
Li S, Goddard L, DeWitt DG (2008) Predictive skill of AGCM seasonal climateforecasts subject to different SST prediction methodologies. J Clim21:2169–2186
Lyon B, Camargo SJ (2009) The seasonally-varying influence of ENSO on rainfalland tropical cyclone activity in the Philippines. Clim Dynam 32:125–141
Lyon B, Giannini A, Gonzales P, Robertson AW (2014) The role of targeted climateresearch at the IRI. Earth Perspect 1:18
Mantilla G, Thomson C, Sharoff J, Barnston AG, Curtis A (2014) Capacitydevelopment through the sharing of climate information with diverse usercommunities. Earth Perspect 1:21
Mason I (1982) A model for assessment of weather forecasts. Aust Meteor Mag30:291–303
Mason SJ (2004) On using “climatology” as a reference strategy in the Brier andranked probability skill scores. Mon Weather Rev 137:1891–1895
Mason SJ (2008) Understanding forecast verification statistics. Meteor Applic 15:31–40Mason SJ, Graham NE (1999) Conditional probabilities, relative operating
characteristics, and relative operating levels. Weather Forecast 14:713–725Mason SJ, Weigel AP (2009) A generic forecast verification framework for
administrative purposes. Mon Weather Rev 137:331–349Mason SJ, Goddard L, Graham NE, Yulaeva E, Sun L, Arkin PA (1999) The IRI
seasonal climate prediction system and the 1997/98 El Niño event. Bull AmMeteorol Soc 80:1853–1873
Meehl GA, Goddard L, Murphy J, Stouffer RJ, Boer G, Danabasoglu G, Dixon K,Giorgetta MA, Greene AM, Hawkins E, Hegerl G, Karoly D, Keenlyside N,

Barnston and Tippett Earth Perspectives 2014, 1:20 Page 17 of 17http://www.earth-perspectives.com/content/1/1/20
Kimoto M, Kirtman B, Navarra A, Pulwarty R, Smith D, Stammer D, Stockdale T(2009) Decadal prediction – Can it be skillful? Bull Am Meteorol Soc90:1467–1485
Murphy AH (1973) A new vector partition of the probability score. J ApplMeteorol 12:595–600
Palmer TN, Alessandri A, Andersen U, Cantelaube P, Davey M, Delecluse P, DequeM, Diez E, Doblas-Reyes FJ, Feddersen H, Graham R, Gualdi S, Gueremy JF,Hagedorn R, Hoshen M, Keenlyside N, Latif M, Lazar A, Maisonnave E,Marletto V, Morse AP, Orfila B, Rogel P, Terres JM, Thomson MC (2004)Development of a European multimodel ensemble system for seasonal-to-interannual prediction (DEMETER). Bull Am Meteorol Soc 2004(85):853–872
Rajagopalan B, Lall U, Zebiak SE (2002) Categorical climate forecasts throughregularization and optimal combination of multiple GCM ensembles. MonWeather Rev 130:1792–1811
Recalde-Coronel GC, Barnston AG, Munoz AG (2014) Predictability of December-April rainfall in coastal and Andean Ecuador. J Appl Meteorol Climatol 53, inpress [http://journals.ametsoc.org/toc/apme/0/0]
Robertson AW, Lall U, Zebiak SE, Goddard L (2004) Improved combination ofmultiple atmospheric GCM ensemble for seasonal prediction. Mon WeatherRev 132:2732–2744
Robertson A, Moron WV, Swarinoto Y (2009) Seasonal predictability of dailyrainfall statistics over Indramayu district Indonesia. Int J Climatol29:1449–1462
Robertson AW, Baethgen W, Block P, Lall U, Sankarasubramanian A, Filho FAS,Verbist K (2014) Climate risk managment in water for semi-arid regions. EarthPerspect 1:12
Ropelewski CF, Janowiak JE, Halpert MS (1985) The analysis and display of realtime surface climate data. Mon Weather Rev 113:1101–1106
Solomon S, Qin D, Manning M, Chen Z, Marquis M, Averyt KB, Tignor M, Miller HL(2007) Climate Change: The Physical Science Basis Contribution of WorkingGroup I to the Fourth Assessment Report of the Intergovernmental Panel onClimate Change. Cambridge University Press, Cambridge, United Kingdomand New York, NY, USA
Sun L, Moncunill DF, Li H, Moura AD, Filho FAS (2005) Climate downscaling overNordeste, Brazil, using the NCEP RSM97. J Clim 18:551–567
Thomson MC, Doblas-Reyes SJ, Mason SJ, Hagedorn R, Connor SJ, Phindela T,Morse AP, Palmer TN (2006) Malaria early warnings based on seasonalclimate forecasts from multi-model ensembles. Nature 439:576–579
Tippett MK, Barnston AG (2008) Skill of multimodel ENSO probability forecasts.Mon Weather Rev 136:3933–3946, Doi: 10.1175/2008MWR24311
Tippett MK, Barnston AG, Li S (2012) Performance of recent multimodel ENSOforecasts. J Appl Meteorol Climatol 51:637–654
Van den Dool HM, Toth Z (1991) Why do forecasts for “near normal” often fail?Wea Forecasting 6:76–85
Weigel AP, Mason SJ (2011) The generalized discrimination score for ensembleforecasts. Mon Weather Rev 139:3069–3074
Wilks DS (2006) Statistical Methods in the Atmospheric Sciences. Academic Press,San Diego, California, p 627
Xie P, Arkin PA (1997) Global precipitation: A 17-year monthly analysis based ongauge observations, satellite estimates, and numerical model outputs. BullAm Meteorol Soc 78:2539–2558
doi:10.1186/2194-6434-1-20Cite this article as: Barnston and Tippett: Climate information, outlooks,and understanding–where does the IRI stand? Earth Perspectives2014 1:20.
Submit your manuscript to a journal and benefi t from:
7 Convenient online submission
7 Rigorous peer review
7 Immediate publication on acceptance
7 Open access: articles freely available online
7 High visibility within the fi eld
7 Retaining the copyright to your article
Submit your next manuscript at 7 springeropen.com