Optimal Infrastructure Planning for EVs Fast Charging ...
13
General rights Copyright and moral rights for the publications made accessible in the public portal are retained by the authors and/or other copyright owners and it is a condition of accessing publications that users recognise and abide by the legal requirements associated with these rights. Users may download and print one copy of any publication from the public portal for the purpose of private study or research. You may not further distribute the material or use it for any profit-making activity or commercial gain You may freely distribute the URL identifying the publication in the public portal If you believe that this document breaches copyright please contact us providing details, and we will remove access to the work immediately and investigate your claim. Downloaded from orbit.dtu.dk on: Mar 14, 2022 Optimal Infrastructure Planning for EVs Fast Charging Stations based on Prediction of User Behavior Gjelaj, Marjan; Toghroljerdi, Seyedmostafa Hashemi; Andersen, Peter Bach; Træholt, Chresten Published in: I E T Electrical Systems in Transportation Link to article, DOI: 10.1049/iet-est.2018.5080 Publication date: 2019 Document Version Peer reviewed version Link back to DTU Orbit Citation (APA): Gjelaj, M., Toghroljerdi, S. H., Andersen, P. B., & Træholt, C. (2019). Optimal Infrastructure Planning for EVs Fast Charging Stations based on Prediction of User Behavior. I E T Electrical Systems in Transportation, 10(1), 1 – 12. https://doi.org/10.1049/iet-est.2018.5080
Transcript of Optimal Infrastructure Planning for EVs Fast Charging ...
General rights Copyright and moral rights for the publications made accessible in the public portal are retained by the authors and/or other copyright owners and it is a condition of accessing publications that users recognise and abide by the legal requirements associated with these rights.
Users may download and print one copy of any publication from the public portal for the purpose of private study or research.
You may not further distribute the material or use it for any profit-making activity or commercial gain
You may freely distribute the URL identifying the publication in the public portal If you believe that this document breaches copyright please contact us providing details, and we will remove access to the work immediately and investigate your claim.
Downloaded from orbit.dtu.dk on: Mar 14, 2022
Optimal Infrastructure Planning for EVs Fast Charging Stations based on Prediction ofUser Behavior
Gjelaj, Marjan; Toghroljerdi, Seyedmostafa Hashemi; Andersen, Peter Bach; Træholt, Chresten
Published in:I E T Electrical Systems in Transportation
Link to article, DOI:10.1049/iet-est.2018.5080
Publication date:2019
Document VersionPeer reviewed version
Link back to DTU Orbit
Citation (APA):Gjelaj, M., Toghroljerdi, S. H., Andersen, P. B., & Træholt, C. (2019). Optimal Infrastructure Planning for EVsFast Charging Stations based on Prediction of User Behavior. I E T Electrical Systems in Transportation, 10(1),1 – 12. https://doi.org/10.1049/iet-est.2018.5080

1
Optimal Infrastructure Planning for EV Fast-Charging Stations Based on Prediction of User Behaviour
Marjan Gjelaj, Seyedmostafa Hashemi, Peter Bach Andersen, Chresten Træholt
Department of Electrical Engineering, Technical University of Denmark, 2800 Kgs. Lyngby, Denmark
Abstract: Electric vehicles (EVs) appear to offer a promising solution to support sustainable transportation and the reduction of CO2 emissions in the metropolitan areas. To satisfy the EV load demand of the new EV models with larger battery capacities, public direct-current fast-charging stations (DCFCSs) are essential to recharge EVs rapidly. A stochastic planning method of the DCFCSs is presented considering user behaviour and the probabilistic driving patterns in order to predict EVs charging demand. According to the stochastic method, a coordinated charging demand and storage charging demand are proposed with the objective of minimising peak load from EVs and charging-infrastructure costs. The proposed planning method can prevent additional grid reinforcement costs due to EV demand during the peak hours. In the coordinated charging demand, the peak load from EVs is managed by controlling the DCFCSs. Instead, in the battery energy storage (BES) charging demand, an optimal BES is proposed as an alternative solution to reduce the peak demand of EVs as well as DCFCSs operational costs. Finally, an economic analysis is carried out to evaluate the technical and economic aspects related to DCFCSs, the BES life-cycle costs as well as the financial performance of BES costs versus grid reinforcement costs.
Nomenclature
Abbreviations
AC Alternating Current
BES Battery Energy Storage
B/C Benefit-Cost ratio
BMS Battery Management System
CBA Cost-Benefit Analysis
CCS Combined Charging System
DC Direct Current
DSO Distribution System Operator
DCFCS DC Fast-Charging Station
DNTS Danish National Transport Survey
EV Electric Vehicle
IEC International Electrotechnical Commission
ICE Internal Combustion Engine
LV Low Voltage
LTO Lithium Titanate Oxide battery
MV Medium Voltage
NPV Net Present Value
NMC Nickel Manganese Cobalt battery
PDF Probability Density Function
PS Peak Shaving
PBP Payback Period
SoC State of Charge
SD Standard Deviation
V2G Vehicle to Grid
Parameters
B Benefit [€]
C Costs [€]
E Energy [kWh]
EVD EV demand [kWh]
EVr Electric Vehicle range [km]
EVmp EV maket penetration [%]
ICEr ICE vehicle range [km]
K BES cycles
P Power [kW]
T Investment life
Vec EV consumption [kWh/km]
d Driving distance [km]
t time
ln PFD logarithmic distribution
ɳ Efficiency
µ Mean
σ Standard deviation
τ EV charging time
α DCFCS charging power setting
β DCFCS charging duration setting
γ DCFCS power and charging duration setting
1. Introduction
MANY European cities consider introducing driving
restriction for diesel vehicles in and around metropolitan
areas [1]. Electric vehicles (EVs) are a smart alternative to
replace traditional vehicles in order to support sustainable
transportation. For this reason, the demand for EV charging
is expected to increase rapidly and could lead to load
congestion in power systems [2].
This increase in EVs’ penetration is an essential aspect of
the planning for EVs charging infrastructures, in particular on
the use of direct-current fast-charging stations (DCFCSs).
Several studies have been carried out to analyse the possible
impact of EVs on power systems considering various
planning methods. The authors of [3] proposed an optimal
location of the charging stations by taking into account the
power transmission grid. Alternatively, [4] recommended a
prediction method based on the energy-equivalent model for
both centralised and decentralised charging loads. In addition,
the authors of [5] suggested a multi-objective collaborative
planning strategy in order to minimise the annual cost of
investments in EV charging systems. Likewise, [6] proposed
an optimal approach for sizing and siting fast-charging
stations in order to reduce the infrastructure costs. The
2
authors of [7] exanimated the EV charging demand using
demand-response programs and uncertainty problems.
Differently, [8] considered travel distance using a
probabilistic model of EV charging loads. Similary, [9] used
statistical data to establish a multi-objective EV charging
planning model, with the goal of maximising captured traffic
flow.
Another popular method for generating the EV load
profiles involves Monte Carlo’ simulations. The authors of
[10] proposed a stochastic method in which Monte Carlo’
simulations are used to calculate the EVs’ arrival times and
state of charge (SoC). Monte Carlo simulations in
combination with Markov modelling can be used to
statistically examine EVs, regardless of whether they are
moving or parked. The stochastic method replicates different
observations such as time of day, day of week and the driving
patterns. Using this probabilistic method, it is possible to
estimate the expected EV load profile using stochastic
individual driving behaviour as a time-dependent function of
the number trips and the driving distance. Likewise, [11]
proposed to use the Markov chain in order to calculate the EV
charging times. The Monte Carlo samples of driving patterns
use discrete-times and states according to Markov chains [12].
In this framework, several states are defined (e.g., parked in
a residential area, parked in a commercial area or in transit)
[13]. Consequently, it is essential to predict the DCFCSs load
demand.
In addition, the DCFCSs add a high-power consumption
load that the distribution system operators (DSOs) must
consider [14]. The impact of the DCFCSs such as generation
planning [15], distribution transformers under different
penetration levels [2] the aggregated EV charging demand
[16], distribution network losses [17] and voltage drops have
been investigated and analysed [18]-[19].
EVs have a serious impact on the grid, including various
aspects of power systems; for example distribution
transformers can become overloaded during peak hours [20],
causing violations in voltage constraints [21]-[22]. To
resolve these issues, for instance, large-scale vehicle-to-grid
(V2G) can provide energy storage as part of the power grid
by offering spinning reserves and regulating frequency
through aggregators [23]. Likewise, [24] suggested V2G for
ancillary services in particular frequency regulation and peak
shaving (PS) by using a large fleet of EVs. V2G has
demonstrated the potential to mitigate the negative grid
impact of EVs by controlling DCFCSs during the charging
and discharging processes. Alternatively, [25] proposed using
stationary batteries as a buffer between the grid and the
charging stations, thus helping to limit the peak consumption.
On the other hand, [26] explored the optimal size of battery
energy storage (BES) within DCFCSs using a dynamic traffic
model to minimise the DCFCSs costs. The design criteria of DCFCSs with BES were proposed
in [27] considering EV energy consumed based on the driving
distance. However, in urban areas, to satisfy the load demand
of the new EV models, public DCFCSs that can recharge EVs
rapidly are indispensable. In our previous work, we sought to
reduce DCFCSs’ charging time using a modular BES within
DCFCSs as a buffer to decouple the EV load from the low
voltage (LV) grid [28]. In addition, the integration of
DCFCSs must meet the EV demand in order to evaluate the
grid-related infrastructure costs [29].
Although recent papers have recently discussed using BES
with DCFCSs, more work is required to predict the DCFCSs
demand given EVs’ increased market penetration [2].
Additionally, the integration of the BESs within the power
systems must consider the evolution of the power electronics,
the new lithium-ion battery technologies [30] and the gradual
reductions in the costs of BES[31].
Assuming the state-of-the-art of the public DCFCSs, this
work proposes a stochastic planning method of the DCFCSs
considering user behaviour and probabilistic driving patterns
in order to predict EV charging demand. According to the
stochastic method, a coordinated charging demand and BES
charging demand are proposed with the objective of
minimising peak EV load and the charging infrastructure
costs. In the coordinated charging demand, the peak EV load
is managed by controlling the DCFCSs in terms of power and
charging duration. Instead, in the BES charging demand, an
optimal BES is proposed as an alternative solution to reduce
DCFCSs operational costs as well as peak EV demand. The
case studies in consideration use the real data from Nordhavn
Project in Copenhagen [32] such as the electrical grid, BES
and the DCFCSs. In addition, the proposed stochastic
planning method is formulated as a multi-objective
optimisation problem based on EV charging demand. The
two objectives are, first, to minimise the DCFCSs’
installation and operation costs and, second, to minimise the
BES systems’ size.
In conclusion, the main contributions of this paper are:
To propose a stochastic planning method to analyse
the expected charging demand from the DCFCSs
according to different properties and probabilistic
driving patterns.
To propose a method to determine an optimal
coordinated charging demand to avoid the DCFCSs
peak load in order to minimise the grid installation
costs by controlling the DCFCSs.
To propose a method to determine optimal storage
charging demand to avoid the DCFCSs peak load
in order to minimise the grid installation costs by
integrating BES within the power systems.
To propose a cost-benefit analysis (CBA) to
evaluate the financial feasibility of BES within the
power systems by considering the DCFCS costs,
grid connection costs and battery life cycle cost.
This work comprises an analysis the of DCFCSs’ impacts
of in a realistic case study in Copenhagen grid.
The paper is organised as follows. The method used to
calculate the EV demand is introduced in Section 2, and the
models for the stochastic method used in determining the EV
loads are described in Section 3. The optimisation problems
are introduced in Sections 4, 5, 6. The results are presented in
Section 7 and the conclusions in Section 8.
2. EV charging modes
The IEC 61851 describes the “electric vehicle conductive
charging system,” and the four charging modes. The charging
modes are classified as Mode 1, 2, 3 and 4 [33]. These
charging modes affect the charging power during the entire
EV-charging process. The EV charing poprcess depends on
the type of EV battery and on the battery-management system
(BMS). Modes 1, 2 and 3 are designed to charge EVs in
alternating current (AC) and the mode 4 in direct current (DC).
3
At the moment, the power delivered in AC is between 3kW
and 43kW, and it is mainly used at home, offices or for slow
public charging stations. The DC method (Mode 4) is
designed only for public charging stations; it allows for
charging in a short period of time. Mode 4 is implemented for
off-board chargers. IEC 61851 (parts, 23 – 24) and IEC15118
provide the general requirements for the control of
communication between DCFCSs and an EVs [33]. In
addition, IEC15118 provides guidance on how EVs can
provide power to the grid, as well as services such as voltage
support and frequency regulation [34]. The evolution of
power electronics, including new control interfaces and EV
batteries, will play an important role in the development of
competitive EVs. Table 1 summarises the main charging
modes’ characteristics and power levels according to IEC
61851 and IEC 62196 [33]-[35].
Table 1. Charging modes according to IEC61851 [33] EV50[kWh]
20% SoC
Mode
1
Mode
2
Mode
3
Mode
4
Mode
4
Mode
4
Pc [kW] 3.5 11 22 50 150 300
t1_SoC 80% 9.15h 2.8h 1.5h 38min 12.6min 6.3min
t2_SoC 100% 13.7h 4.3h 2.15h 1.28h 25.2min 12.7min
t1 [km] 368 368 368 368 368 368
t2 [km] 500 500 500 500 500 500
Recently, to reduce the charging times, many companies have
started to develop DCFCSs with power ranging from 150kW
to 300kW at 800V considering the socket-outlets in combined
charging systems (CCSs) [30]. These new DCFCSs require a
strong grid infrastructure, which carries a high investment
cost. These large installed capacities also require a dedicated
connection to the medium-voltage (MV) grid, including an
appropriate transformer. The transformer has high economic
costs and space restrictions, especially if the installation takes
place in the cities. In this paper, it is assumed the EVs will be
charged using Mode 4 at public charging stations in and
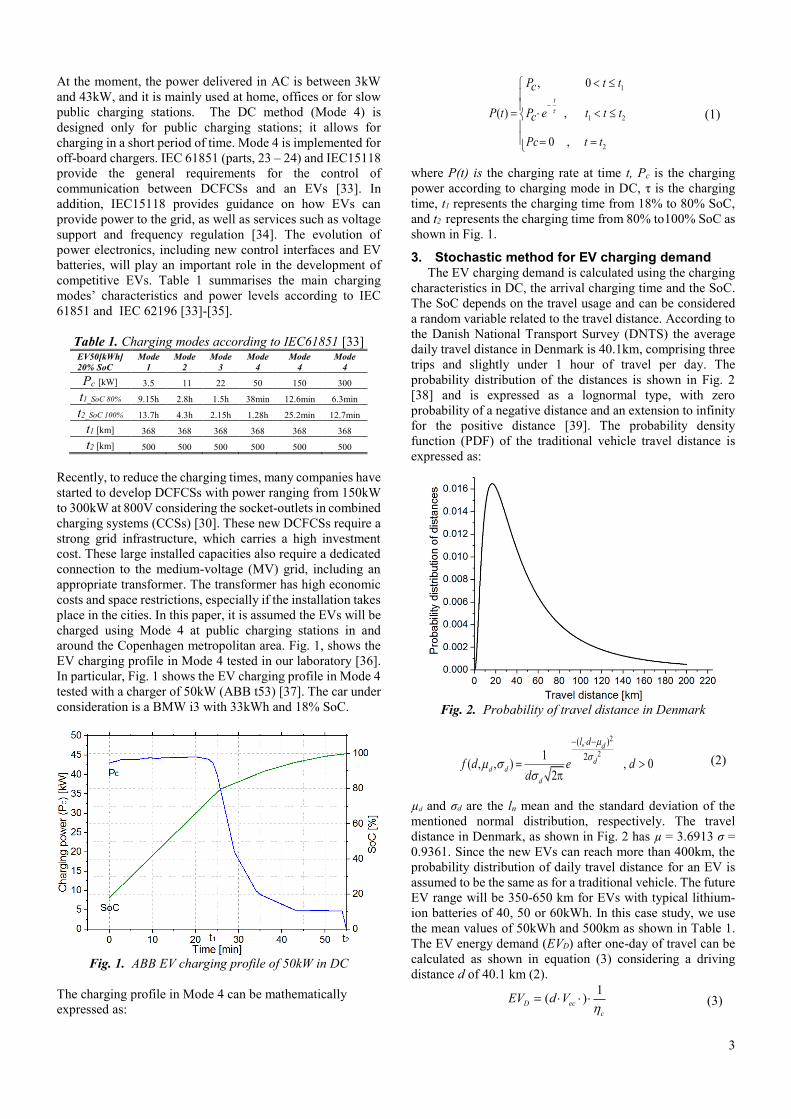
around the Copenhagen metropolitan area. Fig. 1, shows the
EV charging profile in Mode 4 tested in our laboratory [36].
In particular, Fig. 1 shows the EV charging profile in Mode 4
tested with a charger of 50kW (ABB t53) [37]. The car under
consideration is a BMW i3 with 33kWh and 18% SoC.
Fig. 1. ABB EV charging profile of 50kW in DC
The charging profile in Mode 4 can be mathematically
expressed as:
1
1 2
2
, 0
( ) ,
0 ,
t
P t tc
P t P e t t tc
Pc t t
(1)
where P(t) is the charging rate at time t, Pc is the charging
power according to charging mode in DC, τ is the charging
time, t1 represents the charging time from 18% to 80% SoC,
and t2 represents the charging time from 80% to100% SoC as
shown in Fig. 1.
3. Stochastic method for EV charging demand The EV charging demand is calculated using the charging
characteristics in DC, the arrival charging time and the SoC.
The SoC depends on the travel usage and can be considered
a random variable related to the travel distance. According to
the Danish National Transport Survey (DNTS) the average
daily travel distance in Denmark is 40.1km, comprising three
trips and slightly under 1 hour of travel per day. The
probability distribution of the distances is shown in Fig. 2
[38] and is expressed as a lognormal type, with zero
probability of a negative distance and an extension to infinity
for the positive distance [39]. The probability density
function (PDF) of the traditional vehicle travel distance is
expressed as:
Fig. 2. Probability of travel distance in Denmark
µd and σd are the ln mean and the standard deviation of the
mentioned normal distribution, respectively. The travel
distance in Denmark, as shown in Fig. 2 has µ = 3.6913 σ =
0.9361. Since the new EVs can reach more than 400km, the
probability distribution of daily travel distance for an EV is
assumed to be the same as for a traditional vehicle. The future
EV range will be 350-650 km for EVs with typical lithium-
ion batteries of 40, 50 or 60kWh. In this case study, we use
the mean values of 50kWh and 500km as shown in Table 1.
The EV energy demand (EVD) after one-day of travel can be
calculated as shown in equation (3) considering a driving
distance d of 40.1 km (2).
1( )D ec
c
EV d V
(3)
2
2
( )
21( , , ) , 0
2
n
d d
d
d
d
l d
f d e dd
(2)
4
Instead, ɳc represents the efficiency of the DCFCS, and Vec is
the vehicle’s energy consumption. The energy consumption
is based on the driving pattern, which changes according to
the EV’s performance. The current EVs’ consumption vary
between 0.1 and 0.2 kWh/km [28] and this paper considers
Vec of 0.15kWh/km. According to the daily travel distance,
the SoC after one day can be calculated as:
0 1 max
max
, 0d
SoC SoC d dd
(4)
where SoC0 is the residual battery capacity after one day,
SoC1 is dimensionless with value 1, d is the daily travel
distance of the EVs and dmax is the maximum range of the
EVs. Assuming that SoC0 drops linearly with the travel
distance d, the PDF can be calculated by substituting equation
(4) into equation (2) and changing variable form d to SoC.
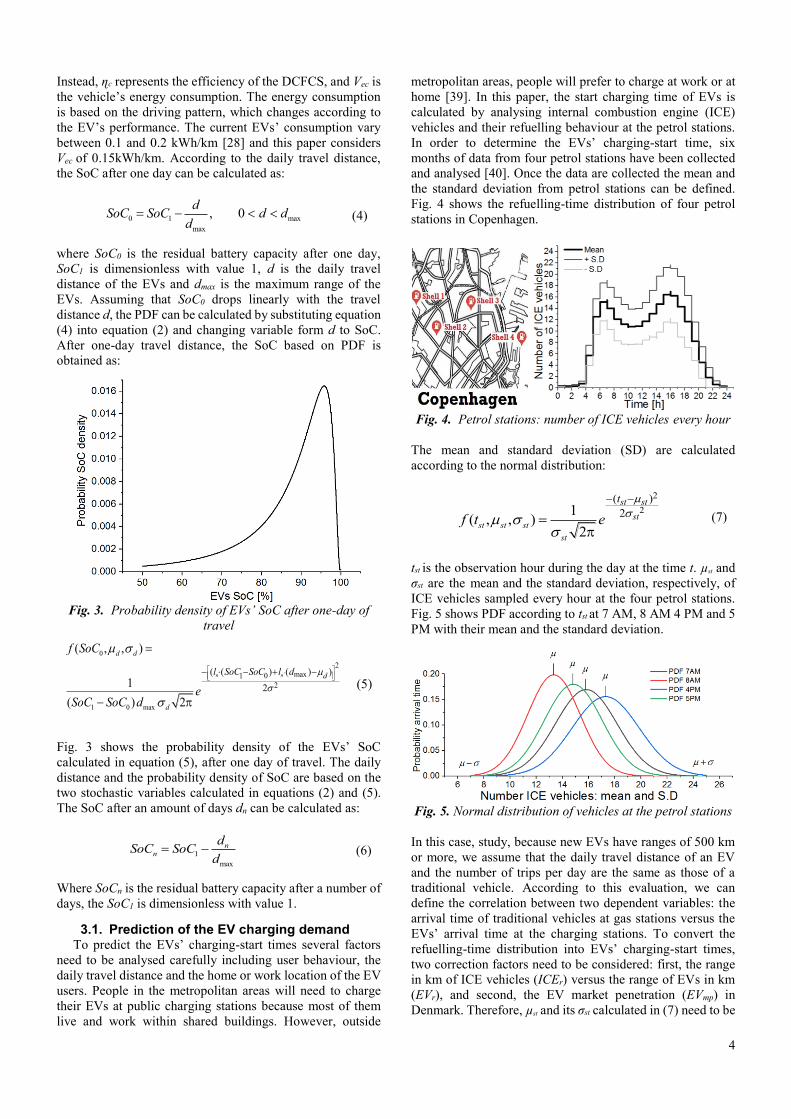
After one-day travel distance, the SoC based on PDF is
obtained as:
Fig. 3. Probability density of EVs’ SoC after one-day of
travel
Fig. 3 shows the probability density of the EVs’ SoC
calculated in equation (5), after one day of travel. The daily
distance and the probability density of SoC are based on the
two stochastic variables calculated in equations (2) and (5).
The SoC after an amount of days dn can be calculated as:
1
max
nn
dSoC SoC
d (6)
Where SoCn is the residual battery capacity after a number of
days, the SoC1 is dimensionless with value 1.
3.1. Prediction of the EV charging demand To predict the EVs’ charging-start times several factors
need to be analysed carefully including user behaviour, the
daily travel distance and the home or work location of the EV
users. People in the metropolitan areas will need to charge
their EVs at public charging stations because most of them
live and work within shared buildings. However, outside
metropolitan areas, people will prefer to charge at work or at
home [39]. In this paper, the start charging time of EVs is
calculated by analysing internal combustion engine (ICE)
vehicles and their refuelling behaviour at the petrol stations.
In order to determine the EVs’ charging-start time, six
months of data from four petrol stations have been collected
and analysed [40]. Once the data are collected the mean and
the standard deviation from petrol stations can be defined.
Fig. 4 shows the refuelling-time distribution of four petrol
stations in Copenhagen.
Fig. 4. Petrol stations: number of ICE vehicles every hour
The mean and standard deviation (SD) are calculated
according to the normal distribution:
tst is the observation hour during the day at the time t. µst and
σst are the mean and the standard deviation, respectively, of
ICE vehicles sampled every hour at the four petrol stations.
Fig. 5 shows PDF according to tst at 7 AM, 8 AM 4 PM and 5
PM with their mean and the standard deviation.
Fig. 5. Normal distribution of vehicles at the petrol stations
In this case, study, because new EVs have ranges of 500 km
or more, we assume that the daily travel distance of an EV
and the number of trips per day are the same as those of a
traditional vehicle. According to this evaluation, we can
define the correlation between two dependent variables: the
arrival time of traditional vehicles at gas stations versus the
EVs’ arrival time at the charging stations. To convert the
refuelling-time distribution into EVs’ charging-start times,
two correction factors need to be considered: first, the range
in km of ICE vehicles (ICEr) versus the range of EVs in km
(EVr), and second, the EV market penetration (EVmp) in
Denmark. Therefore, µst and its σst calculated in (7) need to be
0
1 0 max
2max1 0
2
( ( ) ( ) )
2
( , , )
1
( ) 2
n n
d d
d
dl SoC SoC l d
f SoC
eSoC SoC d
(5)
2
2
( )
21( , , )
2st st st
st
st st
st
t
f t e
(7)
5
converted according to EVmp expressed in [%] and the EVr in
Denmark [2].
( ) ( ( ) ( )) ,100
mprev st
r
EVICEt t t t
EV
(8)
µev (t) is the mean number of EVs at the tth hour at the public
charging stations, µst (t) is the mean number of ICE vehicles
at the tth hour at the petrol stations considering σst (t) with a
confidence interval of 95%. In Copenhagen ICEr vehicles
have a mean driving range of 710km and the mean of EVr
range in 2020-2025 will be 500km [41]. Since the EVs range
is lower than ICEr vehicles range, the charging frequency of
EVs at the DCFCSs will be higher than the frequency of
refuelling at the current petrol stations. Therefore, ICEr/EVr
defines the correlation between refuelling frequency of ICEr
vehicles and the EVs charging frequency. According to (8),
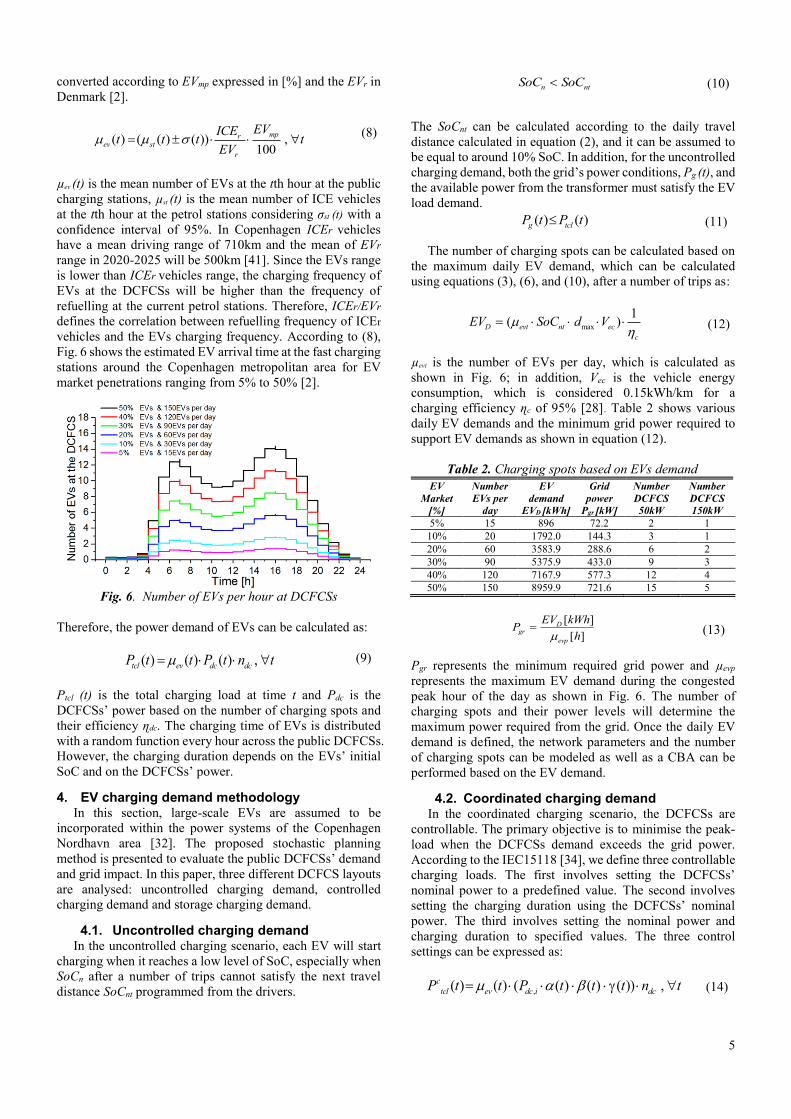
Fig. 6 shows the estimated EV arrival time at the fast charging
stations around the Copenhagen metropolitan area for EV
market penetrations ranging from 5% to 50% [2].
Fig. 6. Number of EVs per hour at DCFCSs
Therefore, the power demand of EVs can be calculated as:
( ) ( ) ( ) ,tcl ev dc dcP t t P t n t (9)
Ptcl (t) is the total charging load at time t and Pdc is the
DCFCSs’ power based on the number of charging spots and
their efficiency ɳdc. The charging time of EVs is distributed
with a random function every hour across the public DCFCSs.
However, the charging duration depends on the EVs’ initial
SoC and on the DCFCSs’ power.
4. EV charging demand methodology In this section, large-scale EVs are assumed to be
incorporated within the power systems of the Copenhagen
Nordhavn area [32]. The proposed stochastic planning
method is presented to evaluate the public DCFCSs’ demand
and grid impact. In this paper, three different DCFCS layouts
are analysed: uncontrolled charging demand, controlled
charging demand and storage charging demand.
4.1. Uncontrolled charging demand In the uncontrolled charging scenario, each EV will start
charging when it reaches a low level of SoC, especially when
SoCn after a number of trips cannot satisfy the next travel
distance SoCnt programmed from the drivers.
n ntSoC SoC (10)
The SoCnt can be calculated according to the daily travel
distance calculated in equation (2), and it can be assumed to
be equal to around 10% SoC. In addition, for the uncontrolled
charging demand, both the grid’s power conditions, Pg (t), and
the available power from the transformer must satisfy the EV
load demand.
( ) ( )g tclP t P t (11)
The number of charging spots can be calculated based on
the maximum daily EV demand, which can be calculated
using equations (3), (6), and (10), after a number of trips as:
max
1( )D evt nt ec
c
EV SoC d V
(12)
µevt is the number of EVs per day, which is calculated as
shown in Fig. 6; in addition, Vec is the vehicle energy
consumption, which is considered 0.15kWh/km for a
charging efficiency ɳc of 95% [28]. Table 2 shows various
daily EV demands and the minimum grid power required to
support EV demands as shown in equation (12).
Table 2. Charging spots based on EVs demand
EV
Market
[%]
Number
EVs per
day
EV
demand
EVD [kWh]
Grid
power
Pgr [kW]
Number
DCFCS
50kW
Number
DCFCS
150kW
5% 15 896 72.2 2 1
10% 20 1792.0 144.3 3 1
20% 60 3583.9 288.6 6 2
30% 90 5375.9 433.0 9 3
40% 120 7167.9 577.3 12 4
50% 150 8959.9 721.6 15 5
[ ]
[ ]
Dgr
evp
EV kWhP
h
(13)
Pgr represents the minimum required grid power and µevp
represents the maximum EV demand during the congested
peak hour of the day as shown in Fig. 6. The number of
charging spots and their power levels will determine the
maximum power required from the grid. Once the daily EV
demand is defined, the network parameters and the number
of charging spots can be modeled as well as a CBA can be
performed based on the EV demand.
4.2. Coordinated charging demand In the coordinated charging scenario, the DCFCSs are
controllable. The primary objective is to minimise the peak-
load when the DCFCSs demand exceeds the grid power.
According to the IEC15118 [34], we define three controllable
charging loads. The first involves setting the DCFCSs’
nominal power to a predefined value. The second involves
setting the charging duration using the DCFCSs’ nominal
power. The third involves setting the nominal power and
charging duration to specified values. The three control
settings can be expressed as:
,( ) ( ) ( ( ) ( ) ( )) ,c
tcl ev dc i dcP t t P t t t n t (14)
6
where Pctcl
(t) is the controlled load demand during the day by
using the three control settings parameters. α is the DCFCS
charging power setting to a predefined value that can vary
from 0 to 1. β is the charging duration of the DCFCSs
expressed in minutes. Instead, γ includes α and β. In addition,
α, β and γ are three independent parameters. The selected
parameters define the communication protocols and the
controllability modes between the DCFCS and the EV
according to international standard IEC15118 [34]. In our
case, the coordinated charging mode of each DCFCS is
controllable by γ. Using γ avoids the congested peak hours
during the workday by reducing the DCFCSs’ nominal power
and charging duration. The objective in equation (15) is to
provide as much energy as possible to the users according to
the grid conditions Pg (t) at the time t. The controlled load can
be expressed as:
max ( )
: ( ) ( )
( ) ( )
: ( ) ( )
1
c
tcl
c
tcl g
c
tcl g
c
tcl g
P t
if P t P t
set with P t P t
if P t P t
set
(15)
Therefore, the nominal DCFCSs power can exceed the
available power of the transformer as long as γ is used to set
the DCFCSs power.
4.3. Storage charging demand In this section, an optimal PS management is proposed to
minimise the EV load during the congestion hours by using
BES as a stationary application. The introduction of the BES
within the DCFCs helps to minimise the DCFCSs’ operation
costs and reduce the charging time during the congestion
hours. The cost reduction of the lithium-ion batteries is an
important parameter, which must be taken into account. This
represents an opportunity to integrate the EVs’ penetration
and charging systems into the power systems. The BES
systems have been estimated to decrease in price by 8%
annually [31]. DCFCSs, in combination the BES, can thus
represent a smart way of minimising grid-reinforcement costs
and meeting EV demand during peak hours. In this case
study, the controllability mode is not used, and the EVs peak
demand will be supported by the BES. Storage charging
demand must include the system’s overall power balance
over a specified time:
,
,
( )( ) ( ) , discharging
( ) ( ) ( ) , charging
b dis
g tcl
dis
g tcl b ch ch
P tP t P t if
P t P t P t if
(16)
Pb (t) is the power given or absorbed from the BES, ɳdis and
ɳch are the BES’s converter efficiency which is 95% during
the discharging and charging processes, respectively. The
objective function is used to minimise the EV energy peak
demand by using the minimum BESs Eb (t) within the
DCFCSs as described in the following equations:
0
0 0
min ( )
( ) ( ) ( ( ) ( )) ( ( ) ( ))
: ( ) ( ) ,discharging
: ( ) ( ) ,chargin
g
b
T T
b b tcl g g tcl
t t
tcl g
tcl g
E t
E t E t E t E t E t E t
if E t E t BES
if E t E t BES
(17)
Eg (t) is the grid energy, Eb (t0) is the BES at the time 0t , Etcl
(t) is the energy required from the DCFCSs during the
discharging and charging processes according to available
energy Eg (t). During the EVs charging demand, the BES
operates in parallel with the DCFCSs, and the PS is provided
during the congestion hours due to the high EV demand. The
BES charging power is limited by the available grid power Pg
(t) at the time t. The discharging power is defined by the
converter’s power and the difference between the grid and the
DCFCSs power (16). The BES is calculated based on
equations (16) and (17). Once the BES size is defined, a CBA
can be implemented in order to evaluate the financial
feasibility of BES within the DCFCSs by considering the
installation costs, grid connection and battery life cycle cost.
5. Results of the EVs charging demand This case study consideres the future EVs demand in
Copenhagen, which could vary from 15 to 300 EVs per day
for each charging station. As shown in Table 2, the minimum
power required from the grid depends on the daily EV
demand and on the EVs’ market penetration. To analyse the
EV demand, three scenarios have been considered:
uncontrolled charging demand, coordinated charging demand,
storage charging demand. All scenarios consider chargers of
150kW in DC. The 150kW charging profiles are obtained
considering the performed tests in our laboratory with
chargers of 50kW in DC as shown in Fig. 1 [36]. In addition,
based on the performed tests, the 150kW charging profile is
assumed to follow the same trend of the 50kW charger as
described in equation (1). To generate the 150kW-DCFCSs’
load demand simulations are carried out by using
MATLAB/Simulink for the given mean and standard
deviation functions (7), (8). The distribution functions of
those random variables can be obtained from the equations
calculated in Section 3 and 4.
5.1. Results for uncontrolled charging demand This scenario considers the daily EV demand from 15 to
150 EVs in Nordhavn-Copenhagen area as shown in Table 2.
Various charging configurations can be utilised to support the
EV demand. As shown in Table 2, the minimum grid power
required to support the EVs demand varies according to the
EVs demand. In all scenarios chargers of 150kW are
considered. Fig. 7 shows the results from five DCFCSs,
where all the input parameters are assumed to follow the
stochastic demand model calculated in Section 3 and 4. The
DCFCSs load profile is one of the most critical parameters
obtained from the stochastic model. It shows the daily
pulsating load profiles of the EVs charging demand on the
grid side according to equations (9) and, (11). The case study
considers 50 % EV market penetration and five chargers of
150kW, as shown in Fig. 7.
7
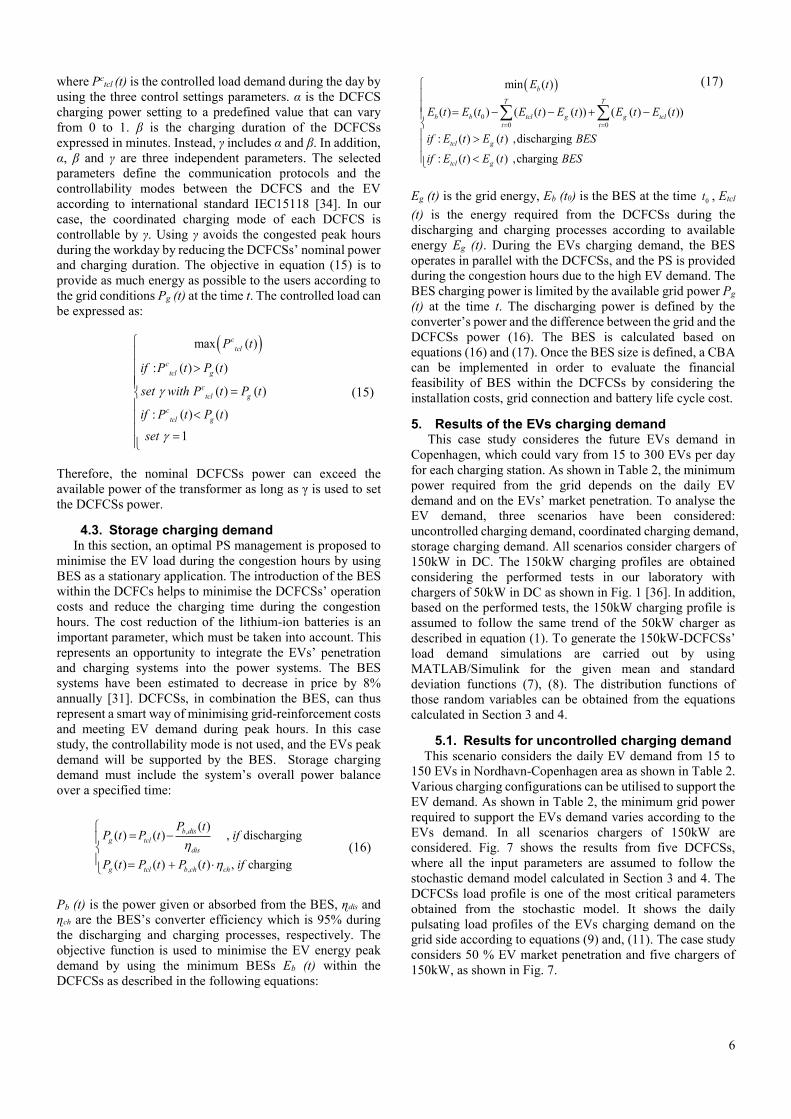
Fig. 7. DCFCSs load demand for: a) a congested workday
150EVs, b) a normal workday 140EVs, c) Saturday 90EVs,
d) Sunday 80EVs
Fig. 7 shows five DCFCSs of 150kW supplied by two
transformers of 500kVA. The EV demand is considered for a
congested workday, a normal day, a Saturday, and a Sunday.
According to Table 2, in this scenario, two transformers can
serve150 EVs and 140 EVs during the congestion and the
normal workdays, respectively. For this grid configuration,
high investment costs are required to reinforce the grid by
adding a new transformer, especially when the EVs demand
will increase over the years. Therefore, as shown in Fig.7, in
addition to the initial investment, which includes one MV
transformer and two or three DCFCSs of 150kW over the next
10 years, an additional MV transformer will be required to
support the growing number of EVs. The new MV
transformer requires a new investment cost which includes
new dedicated LV and MV lines, switchboards as well as the
installation costs [28]. In the next section, a CBA is
performed according to the EV demand.
5.2. Results for coordinated charging demand In the optimal coordinated strategy, the primary objectives
are to minimise the peak-load demand and to reduce the grid-
reinforcement costs. In the coordinated charging mode, each
DCFCS is controllable using α, β and γ according to equations
(14) and (15). In this case study, γ is used to control DCFCSs
during the peak hours by reducing the nominal DCFCSs
power and the charging duration, as shown in Fig. 8.
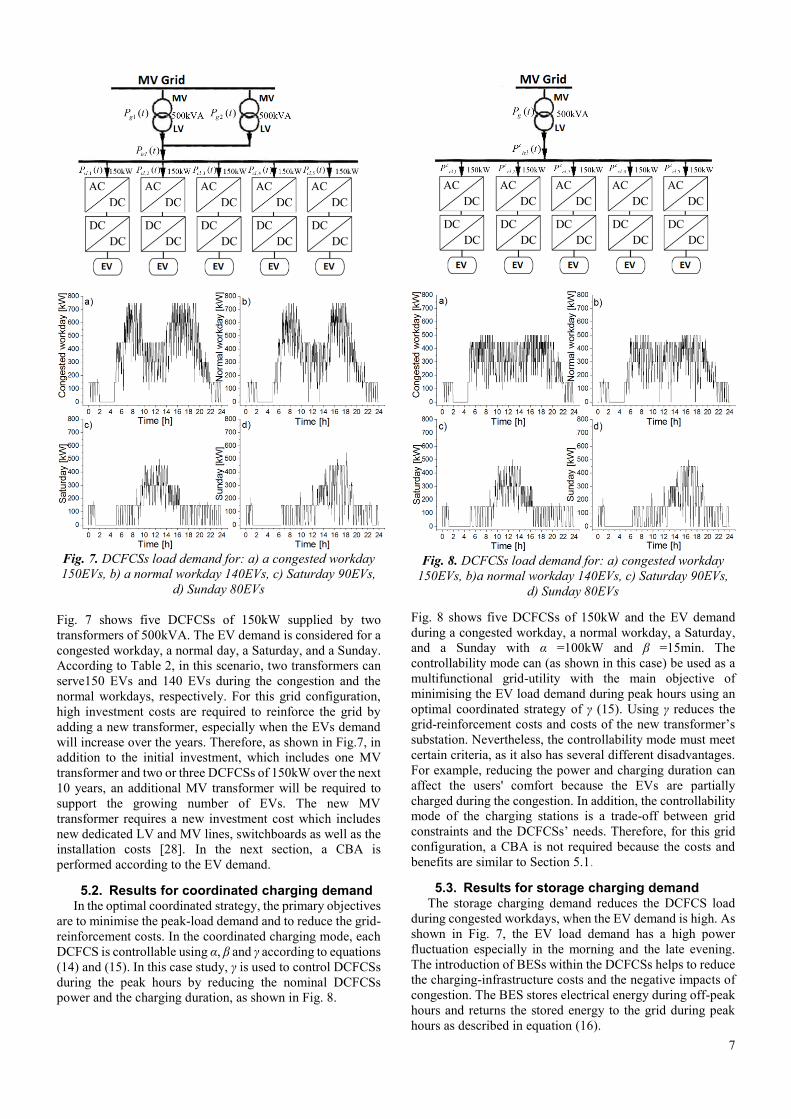
Fig. 8. DCFCSs load demand for: a) congested workday
150EVs, b)a normal workday 140EVs, c) Saturday 90EVs,
d) Sunday 80EVs
Fig. 8 shows five DCFCSs of 150kW and the EV demand
during a congested workday, a normal workday, a Saturday,
and a Sunday with α =100kW and β =15min. The
controllability mode can (as shown in this case) be used as a
multifunctional grid-utility with the main objective of
minimising the EV load demand during peak hours using an
optimal coordinated strategy of γ (15). Using γ reduces the
grid-reinforcement costs and costs of the new transformer’s
substation. Nevertheless, the controllability mode must meet
certain criteria, as it also has several different disadvantages.
For example, reducing the power and charging duration can
affect the users' comfort because the EVs are partially
charged during the congestion. In addition, the controllability
mode of the charging stations is a trade-off between grid
constraints and the DCFCSs’ needs. Therefore, for this grid
configuration, a CBA is not required because the costs and
benefits are similar to Section 5.1.
5.3. Results for storage charging demand The storage charging demand reduces the DCFCS load
during congested workdays, when the EV demand is high. As
shown in Fig. 7, the EV load demand has a high power
fluctuation especially in the morning and the late evening.
The introduction of BESs within the DCFCSs helps to reduce
the charging-infrastructure costs and the negative impacts of
congestion. The BES stores electrical energy during off-peak
hours and returns the stored energy to the grid during peak
hours as described in equation (16).
8
In the optimal storage strategy, the primary objectives are to
minimise the peak demand and to reduce grid-reinforcement
costs. Consequently, an optimal BES size is determined to
support the EV demand during a congested workday and a
typical workday. According to Table 2, the charging-storage
method considers the daily demand from 100 to 150 EVs for
which either grid reinforcement or BES is required. As shown
in Table 2, the minimum charging power is 600kW to support
the EV demand from 100 to 130 EVs/day, and with a demand
from 140 to 150 EVs/day, the minimum charging power is
750kW. Thus, four or five chargers of 150kW are required for
a normal and a congested workday. In this case study, with
demand from 100 to 150 EVs/day the grid power is fixed at
500kW, and the remaining energy will be provided by the
BES which is connected in parallel as shown in Fig. 9. The
EV load can be obtained from the equations calculated in
Section 3 and 4. Fig. 9 shows five DCFCSs of 150kW and an
EV demand during a congested workday. The storage-
charging interface plays an important role during the
congested hours, and it can be used as a multifunctional grid-
utility with the primary objective of minimising the peak EV
demand through the optimal coordination of BES.
Fig. 9. DCFCSs load for150 EVs: a) EV demand and BES in
kWh, b) required grid power, c) BES charging and
discharging process, d) BES SoC during the EV demand
As shown in Fig. 9, the EV load demand fluctuates
significantly, especially in the morning and the late evening.
At this stage, the BES helps to prevent the grid reinforcement
by providing power to the grid during peak hours. The
optimal BES size varies as a function of the daily EVs
demand, as shown in Table 3. In addition, the integration of
BESs within the power systems is a trade-off between the grid
reinforcement costs and the BES investment cost. Table 2
shows EVs daily demand from 15 to 90 EVs where the grid
reinforcement is not required. However, from 100 to 150 EVs
grid reinforcement is required to support the demand.
Alternatively, as shown in Table 3 the storage charging
demand can prevent the grid upgrade by using different BESs
as grid reinforcement.
Table 3. Storage and charging strategy
Number
EVs per
day
Grid
power
[kW]
Power
DCFCSs
[kW]
Overload
grid
[%]
Overload
time
[h]
BES
[kWh]
Eb
15 500 150 0 0 0
20 500 150 0 0 0
60 500 300 0 0 0
90 500 450 0 0 0
100 500 600 20 1.04 18.2
110 500 600 20 1.27 23.5
120 500 600 20 2.13 28.17
130 500 600 20 3.18 31.12
140 500 750 50 5.15 437
150 500 750 50 7.44 586
The BES size is calculated according to equation (17). Based
on Table 3 a CBA is analysed as a function of various BES
size to evaluate the financial feasibility of BES within the
DCFCSs by considering daily demands from 15 to 150EVs.
6. Cost-benefit analysis methodology
This section two cases of grid reinforcement are
considered. A CBA approach is used to compare the
profitability of the DCFCSs investment within power systems
considering different EVs charged per day.
In the first case, Case A uses the BESs as stationary
application during the congestion hours to support increasing
EV demand over the years as shown in Table 4 and Section
5.3. In this case, the BES operates as PS in parallel with the
grid. In the second case, Case B adopts grid reinforcement by
using a new MV transformer to sustain the increasing EV
demand over the years as shown in Table 4 and Section 5.1.
Table 4.CBA of the case A and B
Number of
EVs per
day
Number of
DCFCSs
150kW
Case A
grid power
[kVA]
Case B
grid power
[kVA]
15 1 500 500
20 1 500 500
60 2 500 500
90 3 500 500
100 4 500+BES 1000
110 4 500+BES 1000
120 4 500+BES 1000
130 4 500+BES 1000
140 5 500+BES 1000
150 5 500+BES 1000

9
In both cases, at the beginning, reinforcement of the MV grid
is required with a transformer of 500kVA as shown in Table
4. Since the EVs demand will increase during the years [2],
extra chargers will be required to sustain the EVs demand. As
shown in Table 4, 500kVA is the minimum grid power
required to support the demand up to 90 EVs/day. However,
if the EV demand increases over the years from 100 to 150
EVs per day, new chargers in DC, as well as a new
transformer of 500kVA must be installed. The main objective
of the CBA is to evaluate the economic performance of Case
A versus Case B. In particular, the financial performance of
Case A, which must take into account the BES costs and the
lifetime versus a traditional grid upgrade.
The key parameters of the CBA are listed below.
The payback period (PBP) is the amount of time necessary to
recover the investment, which can be calculated as follows
[42]:
t
t
CPBP
B (18)
Ct represents the cost of the investment, and Bt is the annual
benefit or revenue per year during the investment period T.
Net present value (NPV) is the present value of cash
inflows and the present value of cash outflows [42]:
0
1 1(1 ) (1 )
T Tt t
t tt t
B CNPV C
r r
(19)
r is the discount rate or interest, and C0 is the initial
investment cost.
Instead, the method used to evaluate the economic
performance of one or more investments is the benefit-cost
ratio (B/C), which can be expressed as follows [42]:
1
0
1
(Benefits) (1 )/
(Costs)
(1 )
Tt
tt
Tt
tt
B
NPV rB C
CNPVC
r
(20)
The costs and revenues are calculated for the two cases under
consideration: the Case A – DCFCSs with BES and Case B –
DCFCSs considering a new connection to the MV grid.
6.1. Case A cost and revenue In Case A, the annual costs and benefits associated with
adding BES to the charging stations can be calculated using
the infrastructure costs and as benefits the consumption of
electricity from the EV users.
The total annual costs of Case A (Ct,A) are calculated as:
,t A A I OMC C C C (21)
CI is the installation cost, and COM is the operation and
maintenance cost. Instead, CA includes component costs, as
the chargers cost CC, and the batteries cost considering
replacement during the investment life t (22).
, ,
1
T
A D t BES t C
t
C BES C C
(22)
BESD is the BES degradation life per year, CBES represents the
BES costs per kWh considering replacement costs during
investment life T. The BESD can be calculated as:
1
0
( ) | ( ) |
2
t
D b
D
PYD
b
PYDD
BES
Te
E t P t dt
EK
E
KBES
K
(23)
ED (t) represents the enegry consumed at time t. Instead, Pb (t)
is the power provided from the BES during the PS process. In
addition, KPYD considers the number of cycles utilised during
a year. BESD is the BES degradation per year under at a
predefined variable work temperature ∆Te =0,9814 [43]. KBES
are the number of cycles given by the manufacturers.
The total annual benefits or revenue for Case A (Bt,A) can
be calculated as:
,t A tB E Ce t (24)
where E is the daily energy consumed as a function of the EV
demand, which is calculated in (12). Ce is the cost of
electricity paid by the EV users and tt is the total time in a
year.
6.2. Case B cost and revenue In the Case B the annual costs and benefits associated to
grid upgrade are calculated considering the infrastructure
costs such as new lines and a transformer of 500 kVA as well
as the installation and DCFCS costs [28]. Instead, the benefits
are calculated considering the consumption of electricity
from EVs as shown in (24).
The total annual costs for Case B (Ct,B) are calculated as:
,t B B I OMC C C C (25)
where CB is the component cost, which includes the costs of
the chargers, lines, and transformer. The total annual revenue
for Case B (Bt,B) can be calculated as shown in (24).
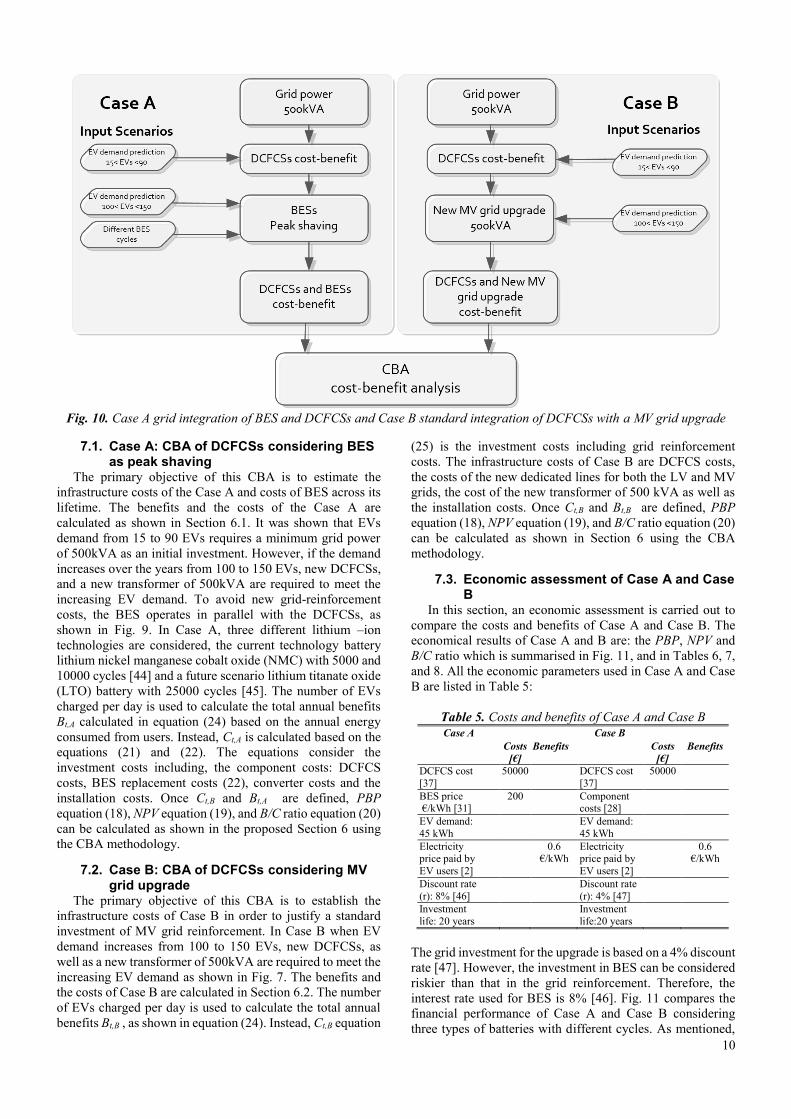
7. Cost-benefit analysis results
In this section, two separate layouts to connect the
charging systems within the power systems are considered.
Case A considers a CBA by using BES as stationary
application during the congestion hours to support the
increasing EV demand over the years as shown in Fig. 10. In
this case, the BES provides PS only during the congestion
hours. Instead, Case B considers a CBA by using a new grid
reinforcement to MV grid to sustain the increasing EV
demand over the years. In both cases, at the beginning, a grid
reinforcement is required with a transformer of 500kVA. A
flowchart model is proposed for each scenario based on the
same EV demand per day as shown in Fig. 10.
10
7.1. Case A: CBA of DCFCSs considering BES as peak shaving
The primary objective of this CBA is to estimate the
infrastructure costs of the Case A and costs of BES across its
lifetime. The benefits and the costs of the Case A are
calculated as shown in Section 6.1. It was shown that EVs
demand from 15 to 90 EVs requires a minimum grid power
of 500kVA as an initial investment. However, if the demand
increases over the years from 100 to 150 EVs, new DCFCSs,
and a new transformer of 500kVA are required to meet the
increasing EV demand. To avoid new grid-reinforcement
costs, the BES operates in parallel with the DCFCSs, as
shown in Fig. 9. In Case A, three different lithium –ion
technologies are considered, the current technology battery
lithium nickel manganese cobalt oxide (NMC) with 5000 and
10000 cycles [44] and a future scenario lithium titanate oxide
(LTO) battery with 25000 cycles [45]. The number of EVs
charged per day is used to calculate the total annual benefits
Bt,A calculated in equation (24) based on the annual energy
consumed from users. Instead, Ct,A is calculated based on the
equations (21) and (22). The equations consider the
investment costs including, the component costs: DCFCS
costs, BES replacement costs (22), converter costs and the
installation costs. Once Ct,B and Bt,A are defined, PBP
equation (18), NPV equation (19), and B/C ratio equation (20)
can be calculated as shown in the proposed Section 6 using
the CBA methodology.
7.2. Case B: CBA of DCFCSs considering MV grid upgrade
The primary objective of this CBA is to establish the
infrastructure costs of Case B in order to justify a standard
investment of MV grid reinforcement. In Case B when EV
demand increases from 100 to 150 EVs, new DCFCSs, as
well as a new transformer of 500kVA are required to meet the
increasing EV demand as shown in Fig. 7. The benefits and
the costs of Case B are calculated in Section 6.2. The number
of EVs charged per day is used to calculate the total annual
benefits Bt,B , as shown in equation (24). Instead, Ct,B equation
(25) is the investment costs including grid reinforcement
costs. The infrastructure costs of Case B are DCFCS costs,
the costs of the new dedicated lines for both the LV and MV
grids, the cost of the new transformer of 500 kVA as well as
the installation costs. Once Ct,B and Bt,B are defined, PBP
equation (18), NPV equation (19), and B/C ratio equation (20)
can be calculated as shown in Section 6 using the CBA
methodology.
7.3. Economic assessment of Case A and Case B
In this section, an economic assessment is carried out to
compare the costs and benefits of Case A and Case B. The
economical results of Case A and B are: the PBP, NPV and
B/C ratio which is summarised in Fig. 11, and in Tables 6, 7,
and 8. All the economic parameters used in Case A and Case
B are listed in Table 5:
Table 5. Costs and benefits of Case A and Case B
Case A Case B
Costs
[€]
Benefits Costs
[€]
Benefits
DCFCS cost
[37]
50000 DCFCS cost
[37]
50000
BES price €/kWh [31]
200 Component costs [28]
EV demand:
45 kWh
EV demand:
45 kWh
Electricity price paid by
EV users [2]
0.6 €/kWh
Electricity price paid by
EV users [2]
0.6 €/kWh
Discount rate
(r): 8% [46]
Discount rate
(r): 4% [47]
Investment
life: 20 years
Investment
life:20 years
The grid investment for the upgrade is based on a 4% discount
rate [47]. However, the investment in BES can be considered
riskier than that in the grid reinforcement. Therefore, the
interest rate used for BES is 8% [46]. Fig. 11 compares the
financial performance of Case A and Case B considering
three types of batteries with different cycles. As mentioned,
Fig. 10. Case A grid integration of BES and DCFCSs and Case B standard integration of DCFCSs with a MV grid upgrade
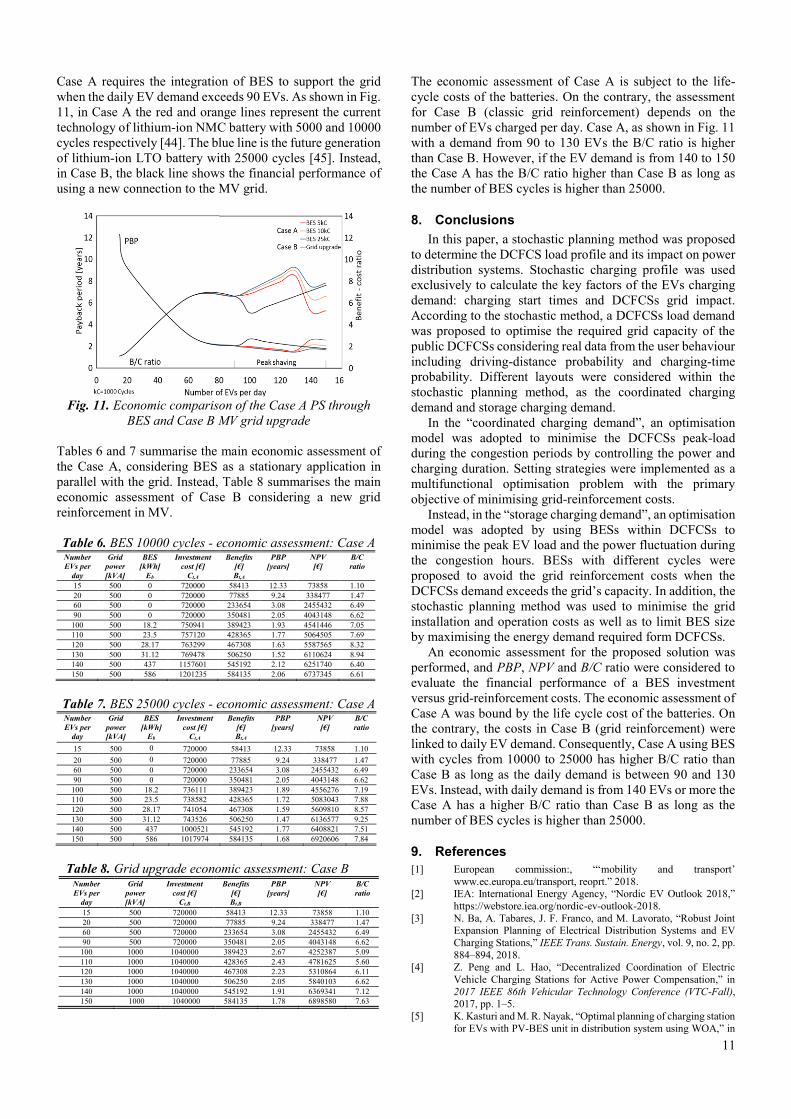
11
Case A requires the integration of BES to support the grid
when the daily EV demand exceeds 90 EVs. As shown in Fig.
11, in Case A the red and orange lines represent the current
technology of lithium-ion NMC battery with 5000 and 10000
cycles respectively [44]. The blue line is the future generation
of lithium-ion LTO battery with 25000 cycles [45]. Instead,
in Case B, the black line shows the financial performance of
using a new connection to the MV grid.
Fig. 11. Economic comparison of the Case A PS through
BES and Case B MV grid upgrade
Tables 6 and 7 summarise the main economic assessment of
the Case A, considering BES as a stationary application in
parallel with the grid. Instead, Table 8 summarises the main
economic assessment of Case B considering a new grid
reinforcement in MV.
Table 6. BES 10000 cycles - economic assessment: Case A Number
EVs per
day
Grid
power
[kVA]
BES
[kWh]
Eb
Investment
cost [€]
Ct,A
Benefits
[€]
Bt,A
PBP
[years]
NPV
[€]
B/C
ratio
15 500 0 720000 58413 12.33 73858 1.10
20 500 0 720000 77885 9.24 338477 1.47
60 500 0 720000 233654 3.08 2455432 6.49
90 500 0 720000 350481 2.05 4043148 6.62
100 500 18.2 750941 389423 1.93 4541446 7.05
110 500 23.5 757120 428365 1.77 5064505 7.69
120 500 28.17 763299 467308 1.63 5587565 8.32
130 500 31.12 769478 506250 1.52 6110624 8.94
140 500 437 1157601 545192 2.12 6251740 6.40
150 500 586 1201235 584135 2.06 6737345 6.61
Table 7. BES 25000 cycles - economic assessment: Case A Number
EVs per
day
Grid
power
[kVA]
BES
[kWh]
Eb
Investment
cost [€]
Ct,A
Benefits
[€]
Bt,A
PBP
[years]
NPV
[€]
B/C
ratio
15 500 0 720000 58413 12.33 73858 1.10
20 500 0 720000 77885 9.24 338477 1.47
60 500 0 720000 233654 3.08 2455432 6.49
90 500 0 720000 350481 2.05 4043148 6.62
100 500 18.2 736111 389423 1.89 4556276 7.19
110 500 23.5 738582 428365 1.72 5083043 7.88
120 500 28.17 741054 467308 1.59 5609810 8.57
130 500 31.12 743526 506250 1.47 6136577 9.25
140 500 437 1000521 545192 1.77 6408821 7.51
150 500 586 1017974 584135 1.68 6920606 7.84
Table 8. Grid upgrade economic assessment: Case B Number
EVs per
day
Grid
power
[kVA]
Investment
cost [€]
Ct,B
Benefits
[€]
Bt,B
PBP
[years]
NPV
[€]
B/C
ratio
15 500 720000 58413 12.33 73858 1.10
20 500 720000 77885 9.24 338477 1.47
60 500 720000 233654 3.08 2455432 6.49
90 500 720000 350481 2.05 4043148 6.62
100 1000 1040000 389423 2.67 4252387 5.09
110 1000 1040000 428365 2.43 4781625 5.60
120 1000 1040000 467308 2.23 5310864 6.11
130 1000 1040000 506250 2.05 5840103 6.62
140 1000 1040000 545192 1.91 6369341 7.12
150 1000 1040000 584135 1.78 6898580 7.63
The economic assessment of Case A is subject to the life-
cycle costs of the batteries. On the contrary, the assessment
for Case B (classic grid reinforcement) depends on the
number of EVs charged per day. Case A, as shown in Fig. 11
with a demand from 90 to 130 EVs the B/C ratio is higher
than Case B. However, if the EV demand is from 140 to 150
the Case A has the B/C ratio higher than Case B as long as
the number of BES cycles is higher than 25000.
8. Conclusions
In this paper, a stochastic planning method was proposed
to determine the DCFCS load profile and its impact on power
distribution systems. Stochastic charging profile was used
exclusively to calculate the key factors of the EVs charging
demand: charging start times and DCFCSs grid impact.
According to the stochastic method, a DCFCSs load demand
was proposed to optimise the required grid capacity of the
public DCFCSs considering real data from the user behaviour
including driving-distance probability and charging-time
probability. Different layouts were considered within the
stochastic planning method, as the coordinated charging
demand and storage charging demand.
In the “coordinated charging demand”, an optimisation
model was adopted to minimise the DCFCSs peak-load
during the congestion periods by controlling the power and
charging duration. Setting strategies were implemented as a
multifunctional optimisation problem with the primary
objective of minimising grid-reinforcement costs.
Instead, in the “storage charging demand”, an optimisation
model was adopted by using BESs within DCFCSs to
minimise the peak EV load and the power fluctuation during
the congestion hours. BESs with different cycles were
proposed to avoid the grid reinforcement costs when the
DCFCSs demand exceeds the grid’s capacity. In addition, the
stochastic planning method was used to minimise the grid
installation and operation costs as well as to limit BES size
by maximising the energy demand required form DCFCSs.
An economic assessment for the proposed solution was
performed, and PBP, NPV and B/C ratio were considered to
evaluate the financial performance of a BES investment
versus grid-reinforcement costs. The economic assessment of
Case A was bound by the life cycle cost of the batteries. On
the contrary, the costs in Case B (grid reinforcement) were
linked to daily EV demand. Consequently, Case A using BES
with cycles from 10000 to 25000 has higher B/C ratio than
Case B as long as the daily demand is between 90 and 130
EVs. Instead, with daily demand is from 140 EVs or more the
Case A has a higher B/C ratio than Case B as long as the
number of BES cycles is higher than 25000.
9. References
[1] European commission:, “‘mobility and transport’
www.ec.europa.eu/transport, reoprt.” 2018. [2] IEA: International Energy Agency, “Nordic EV Outlook 2018,”
https://webstore.iea.org/nordic-ev-outlook-2018.
[3] N. Ba, A. Tabares, J. F. Franco, and M. Lavorato, “Robust Joint Expansion Planning of Electrical Distribution Systems and EV
Charging Stations,” IEEE Trans. Sustain. Energy, vol. 9, no. 2, pp.
884–894, 2018. [4] Z. Peng and L. Hao, “Decentralized Coordination of Electric
Vehicle Charging Stations for Active Power Compensation,” in
2017 IEEE 86th Vehicular Technology Conference (VTC-Fall), 2017, pp. 1–5.
[5] K. Kasturi and M. R. Nayak, “Optimal planning of charging station
for EVs with PV-BES unit in distribution system using WOA,” in
12
Proceedings - 2017 2nd International Conference on Man and
Machine Interfacing, MAMI 2017, 2018, vol. 2018–March, pp. 1–
6. [6] C. Sheppard, A. Harris, and A. Gopal, “Cost-Effective Siting of
Electric Vehicle Charging Infrastructure with Agent-Based
Modeling,” IEEE Trans. Transp. Electrif., vol. 7782, no. MARCH, pp. 1–1, 2016.
[7] S. Shojaabadi, S. Abapour, M. Abapour, and A. Nahavandi,
“Optimal planning of plug-in hybrid electric vehicle charging station in distribution network considering demand response
programs and uncertainties,” IET Gener. Transm. Distrib., vol. 10,
no. 13, pp. 3330–3340, 2016. [8] M. Neaimeh, S. D. Salisbury, G. A. Hill, P. T. Blythe, D. R.
Scoffield, and J. E. Francfort, “Analysing the usage and evidencing
the importance of fast chargers for the adoption of battery electric vehicles,” Energy Policy, vol. 108, no. April, pp. 474–486, 2017.
[9] A. Gusrialdi, Z. Qu, and M. A. Simaan, “Distributed Scheduling
and Cooperative Control for Charging of Electric Vehicles at Highway Service Stations,” IEEE Trans. Intell. Transp. Syst., vol.
18, no. 10, pp. 2713–2727, 2017.
[10] P. Grahn, “Electric Vehicle Charging Modeling, Doctoral Thesis KTH Universily, Stockholm, 2014.”
[11] G. Hill, P. T. Blythe, and C. Higgins, “Deviations in Markov chain
modeled electric vehicle charging patterns from real world data,”
IEEE Conf. Intell. Transp. Syst. Proceedings, ITSC, pp. 1072–
1077, 2012.
[12] R. J. Bessa, M. A. Matos, F. J. Soares, and J. A. P. Lopes, “Optimized Bidding of a EV Aggregation Agent in the Electricity
Market,” IEEE Trans. Smart Grid, vol. 3, no. 1, pp. 443–452, Mar.
2012. [13] F. J. Soares, J. A. Pecas Lopes, and P. M. Rocha Almeida, “A
Monte Carlo method to evaluate electric vehicles impacts in
distribution networks,” in 2010 IEEE Conference on Innovative Technologies for an Efficient and Reliable Electricity Supply, 2010,
vol. 77, no. 5, pp. 365–372.
[14] S. Habib, M. M. Khan, F. Abbas, L. Sang, M. U. Shahid, and H. Tang, “A Comprehensive Study of Implemented International
Standards, Technical Challenges, Impacts and Prospects for
Electric Vehicles,” IEEE Access, vol. 6, no. March, pp. 13866–13890, 2018.
[15] O. Erdinc, A. Tascikaraoglu, N. G. Paterakis, I. Dursun, M. C.
Sinim, and J. P. S. Catalao, “Optimal sizing and siting of distributed generation and EV charging stations in distribution
systems,” 2017 IEEE PES Innov. Smart Grid Technol. Conf. Eur.
ISGT-Europe 2017 - Proc., vol. 2018–Janua, pp. 1–6, 2018.
[16] M. R. Sarker, H. Pandžić, K. Sun, and M. A. Ortega-Vazquez,
“Optimal operation of aggregated electric vehicle charging stations
coupled with energy storage,” IET Gener. Transm. Distrib., vol. 12, no. 5, pp. 1127–1136, 2018.
[17] O. Beaude, S. Lasaulce, M. Hennebel, and J. Daafouz,
“Minimizing the impact of EV charging on the electricity distribution network,” 2015 Eur. Control Conf. ECC 2015, vol. 7,
no. 6, pp. 648–653, 2015. [18] Q. R. Hamid and J. A. Barria, “Congestion Avoidance for
Recharging Electric Vehicles Using Smoothed Particle
Hydrodynamics,” IEEE Trans. Smart Grid, vol. 31, no. 2, pp. 1014–1024, 2016.
[19] S. Martinenas, K. Knezovic, and M. Marinelli, “Management of
Power Quality Issues in Low Voltage Networks using Electric Vehicles: Experimental Validation,” IEEE Trans. Power Deliv.,
vol. 32, no. 2, pp. 971–979, 2016.
[20] A. T. Procopiou, J. Quiros-Tortos, and L. F. Ochoa, “HPC-Based Probabilistic Analysis of LV Networks with EVs: Impacts and
Control,” IEEE Trans. Smart Grid, vol. 8, no. 3, pp. 1479–1487,
2017.
[21] C. Kattmann, K. Rudion, and S. Tenbohlen, “Detailed power
quality measurement of electric vehicle charging infrastructure,”
CIRED - Open Access Proc. J., vol. 2017, no. 1, pp. 581–584, 2017. [22] K. Hou et al., “A Reliability Assessment Approach For Integrated
Transportation and Electrical Power Systems Incorporating
Electric Vehicles,” IEEE Trans. Smart Grid, vol. 9, no. 1, pp. 1–1, 2016.
[23] K. S. Ko and D. K. Sung, “The Effect of EV Aggregators with
Time-Varying Delays on the Stability of a Load Frequency Control System,” IEEE Trans. Power Syst., vol. 33, no. 1, pp. 1–1, 2017.
[24] N. Banol A., S. Hashemi, P. Bach Andersen, C. Træholt, and R.
Romero, “V2G Enabled EVs Providing Frequency Containment Reserves: Field Results,” 2017 IEEE Int. Conf. Ind. Technol., p. 6,
2018.
[25] Y. Huo, F. Bouffard, and G. Joós, “An Energy Management
Approach for Electric Vehicle Fast Charging Station,” 2017. [26] S. Negarestani, M. Fotuhi-Firuzabad, M. Rastegar, and A. Rajabi-
Ghahnavieh, “Optimal Sizing of Storage System in a Fast
Charging Station for Plug-in Hybrid Electric Vehicles,” IEEE Trans. Transp. Electrif., vol. 2, no. 4, pp. 443–453, 2016.
[27] M. Gjelaj, C. Træholt, S. Hashemi, and P. B. Andersen, “Optimal
design of DC fast-charging stations for EVs in low voltage grids,” 2017 IEEE Transp. Electrif. Conf. Expo, ITEC 2017, pp. 684–689,
2017.
[28] M. Gjelaj, S. Hashemi, C. Træholt, and P. B. Andersen, “Grid Integration of DC Fast-Charging Stations for EVs by using
Modular Li-ion Batteries,” IET Gener. Transm. Distrib., 2018.
[29] M. Gjelaj, C. Traholt, S. Hashemi, and P. B. Andersen, “Cost-benefit analysis of a novel DC fast-charging station with a local
battery storage for EVs,” 2017 52nd Int. Univ. Power Eng. Conf.,
pp. 1–6, 2017. [30] M. A. Hannan, M. M. Hoque, A. Hussain, Y. Yusof, and P. J. Ker,
“State-of-the-Art and Energy Management System of Lithium-Ion
Batteries in Electric Vehicle Applications: Issues and Recommendations,” IEEE Access, vol. 3536, no. c, pp. 1–1, 2018.
[31] B. Nykvist and M. Nilsson, “Rapidly falling costs of battery packs
for electric vehicles,” Nat. Clim. Chang., vol. 5, no. 4, pp. 329–332,
2015.
[32] Nordhaven project:, “Design - dimensioning of the energy
infrastructure of future sustainable cities,” http://energylabnordhavn.weebly.com/ , Copenhagen, 2018.
[33] International Electrotechnical Commission (IEC) standard, “IEC
61851: Conductive charging systems for EV, version 2017.” . [34] International Electrotechnical Commission (IEC) standard, “IEC
15118: Vehicle to grid communication interface within the power
systems, version 2018.” [35] International Electrotechnical Commission (IEC) standard, “IEC
62196 : Connectors for conductive charging of electric vehicles,
version 2017.” . [36] DTU Elektro, “Electric Vehicle Lab: Electric vehicle power
system integration’, http://www.powerlab.dk/Facilities/Electric-
Vehicle-Lab.” [37] ABB, “High-Power Electric Vehicle Fast Charging Station, report
2018,” https://new.abb.com/ev-charging/products/car-
charging/high-power-charging. [38] H. Christiansen, “Documentation of the Danish National Travel
Survey,” no. August, 2016.
[39] M. Fosgerau, K. Hjorth, T. C. Jensen, and N. Prameswari,
Prediction model for travel time variability. 2016.
[40] Shell, “Copenhgen: Annual report of users’ refuelling behaviour,”
https://www.shell.dk/refuelling/behaviour, 2017, 2017. [41] IEA: International Energy Agency, “Technology Roadmap -
Electric and Plug-in Hybrid Electric Vehicles, 2017.”
[42] D. Boardman, A., Greenberg, D., Vining, A. and Weimer, Cost Benefit Analysis: Concepts and Practice, 4th Editio. 2018.
[43] Y. Cao, C. Li, X. Liu, B. Zhou, C. Y. Chung, and K. W. Chan, “Optimal scheduling of virtual power plant with battery
degradation cost,” IET Gener. Transm. Distrib., vol. 10, no. 3, pp.
712–725, 2016. [44] B. Xu, A. Oudalov, A. Ulbig, G. Andersson, and D. S. Kirschen,
“Modeling of lithium-ion battery degradation for cell life
assessment,” IEEE Trans. Smart Grid, vol. 9, no. 2, pp. 1131–1140, 2018.
[45] N. Takami, H. Inagaki, Y. Tatebayashi, H. Saruwatari, K. Honda,
and S. Egusa, “High-power and long-life lithium-ion batteries using lithium titanium oxide anode for automotive and stationary
power applications,” J. Power Sources, vol. 244, pp. 469–475,
2013.
[46] B. Kaun and S. Chen, “Cost-Effectiveness of Energy Storage in
California: Application of the Energy Storage Valuation Tool to
Inform the California Public Utility Commission Proceeding,” EPRI Energy Storage Valuat. Tool California, Palo Alto, p. 10,
2015.
[47] Montell & Partners, “Energimarknadsinspektionen: Framtagande av kalkylränta för en skälig avkastning för elnätsföretagen för
perioden 2016-2019 [online]. Available: http://ei.se/
Documents/Forhandsreglering_el/2016_2019/Dokument/Framtagande_av_kalkylranta_for_en_ skalig_avkas.”


![Determining optimal locations for charging stations of ...to find (sub)optimal locations for public charging stations for EVs was developed by Dong et al. [17], who also provided](https://static.fdocuments.us/doc/165x107/5f25d904e7955f66a92bb144/determining-optimal-locations-for-charging-stations-of-to-ind-suboptimal.jpg)