EVs´ impact on Power Quality related to harmonics · User dependent charging: EVs are charged when...
57
Deliverable 4.3 – A1 “EV’s impact on Power Quality” GA MOVE/FP7/265499/Green eMotion Page 1 of 57 Deliverable D4.3 – A1 Grid Impact studies of electric vehicles EVs´ impact on Power Quality related to harmonics Prepared by: Jan Rasmussen Jacob Aarøe Bjørn Danish Energy Association Date: January 24 th , 2014 Version: 1.2
Transcript of EVs´ impact on Power Quality related to harmonics · User dependent charging: EVs are charged when...

Deliverable 4.3 – A1 “EV’s impact on Power Quality”
GA MOVE/FP7/265499/Green eMotion Page 1 of 57
Deliverable D4.3 – A1Grid Impact studies of electric vehicles
EVs´ impact on Power Quality related toharmonics
Prepared by:
Jan RasmussenJacob Aarøe Bjørn
Danish Energy Association
Date: January 24th, 2014
Version: 1.2

Deliverable 4.3 – A1 “EV’s impact on Power Quality”
Page 2 of 57 GA MOVE/FP7/265499/Green eMotion
Document Information
AuthorsName Company
Key authors Jan Rasmussen Danish Energy AssociationJakob Aarøe Bjørn Danish Energy Association
Contributors Luc Berthet EDFThomas Wiedermann RWEWP4 partners
DistributionDissemination levelPU Public xPP Restricted to other programme participants (including the Commission Services)RE Restricted to a group specified by the consortium (including the Commission Services)CO Confidential, only for members of the consortium (including the Commission Services)
Revision historyVersion Date Author Description1.0 Sep 20 2013 Jan Rasmussen Submission for
Approval1.1 Nov 22 2013 Jan Rasmussen Submission for
Approval1.2 Jan 24 2014 Jan Rasmussen Final Version
StatusStatusFor InformationDraft VersionFinal Version (Internal document)Submission for Approval (deliverable)Final Version (deliverable, approved on) x

Deliverable 4.3 – A1 “EV’s impact on Power Quality”
GA MOVE/FP7/265499/Green eMotion Page 3 of 57
Table of Contents
1 Executive summary 5
2 Introduction 8
2.1 Electric Vehicles for personal transportation 82.1.1 EU Project Green eMotion and D4.3 92.1.2 The subject for the Investigation 9
2.2 Outline of this report 102.2.1 Terms and Abbreviations 10
3 Review on Harmonics 12
3.1 Description of Harmonics 12
3.2 Concerns regarding Harmonics 13
3.3 Relevant Standards 14
4 Harmonic Calculations and Simulations 20
4.1 Basis for calculations and simulations 204.1.1 Grids 20
4.2 IEC Guidelines 204.2.1 Method of calculation 21
4.3 Simulations in Digsilent Power Factory 234.3.1 Method of simulation 234.3.2 Treatment of data. 284.3.3 Simulations with User Dependent Charging 304.3.4 Simulations with Timer Based Charging 314.3.5 Simulations with Load Dependent Charging 32
5 Analysis of results 34
6 Analysis of influence of charging strategy and grid topology 41
7 Perspectives 52
7.1 Improvement of knowledge 52
7.2 Distributed generation and new technologies 53
7.3 Grid planning 53
8 Conclusion 54
9 Appendix 55
9.1 Derivation of harmonic sources of EV 55
Deliverable 4.3 – A1 “EV’s impact on Power Quality”
Page 4 of 57 GA MOVE/FP7/265499/Green eMotion
List of Figures
Figure 2.1.1: Overview of deliverable D4.3. ................................................................................ 9Figure 3.1.1 Harmonic distortion of fundamental waveform .................................................... 13Figure 3.3.1 System disturbance level and equipment immunity level ...................................... 15Figure 4.3.1 Duration curves for Line loads. .............................................................................. 28Figure 4.3.2 shows two voltage scenarios, the base scenario (to the left) and the final scenario
(100 % EV penetration, to the right). ............................................................................... 29Figure 4.3.3 shows two harmonic scenarios, the base scenario (to the left) and the final
scenario (100 % EV penetration, to the right). ................................................................. 30Figure 4.3.1 The current state of the grid, assuming zero EVs is implemented in the grid. As seen
in the figure, it is already surpassing the Low-voltage limits of the grid. .......................... 41Figure 4.3.2 This picture contains two scenarios, at the top User dependent charging. The
bottom picture is illustrating a Timer based charging strategy, both at 200 EVs. ............. 42Figure 4.3.3 This picture contains two scenarios, at the top Load dependent charging. The
bottom picture is illustrating a zero background noise scenario, both at 200 EVs. ........... 43Figure 4.3.4 The current state of the grid, assuming zero EVs is implemented in the grid. As seen
in the figure, it is already surpassing the Low-voltage limits of the grid. .......................... 44Figure 4.3.5 This picture contains two scenarios, at the top User x<dependent charging. The
bottom picture is illustrating a Timer based charging strategy, both at 100 EVs. ............. 45Figure 4.3.6 This picture contains two scenarios, at the top Load dependent charging. The
bottom picture is illustrating a zero background noise scenario, both at 100 EVs. ........... 46Figure 4.3.7 The current state of the grid, assuming zero EVs is implemented in the grid. As seen
in the figure, it is already surpassing the Low-voltage limits of the grid. .......................... 47Figure 4.3.8 This picture contains two scenarios, at the top User dependent charging. The
bottom picture is illustrating a Timer based charging, both at 100 EVs. ........................... 48Figure 4.3.9 This picture contains two scenarios, at the top Load dependent charging. The
bottom picture is illustrating a zero background noise scenario, both at 35 EVs. ............. 49Figure 4.3.10 Topology of Grid 6 ............................................................................................... 51
List of Tables
Table 2.2.1 Abbreviations of importance. ................................................................................. 11Table 4.2.1 Compability levels in low-voltage grids ................................................................... 21Table 4.3.1 Emission values of base load (existing load) ........................................................... 25Table 4.3.2 Emission levels of EVs and IEC limits for 16A apparatus .......................................... 26Table 4.3.3 Grid data ................................................................................................................. 33Table 4.3.1 IEC calculations and PowerFactory simulations ...................................................... 35Table 4.3.2 Clarification of columns in Table 4.3.3, Table 4.3.4 and Table 4.3.5 ........................ 36Table 4.3.3 Results of User dependent charging ....................................................................... 37Table 4.3.4 Results of Timer based charging ............................................................................. 38Table 4.3.5 Results of Load dependent charging ....................................................................... 39

Deliverable 4.3 – A1 “EV’s impact on Power Quality”
GA MOVE/FP7/265499/Green eMotion Page 5 of 57
1 Executive summary
The scope of this report is to describe the impact of EVs related to harmonics, i.e.electric voltage and current that appear on the electric power system as a result ofnon-linear electric loads, with focus on low-voltage grids in households asprimary consumption. The method has been chosen and developed in accordancewith EV charging done in household installations and with focus on a charginglevel of 16 A at 230V.
Harmonic load flow simulations in Power Factory have been performed for threedifferent charging strategies, User dependent, Timer Based and Load dependent.Based on a “base-case” simulation on 30 specific low-voltage grids from Italy,Spain and Denmark, 6 specific grids have been selected for a more comprehensiveassessment.
By adding one EV at a time to a grid, the maximum number of EVs to beconnected to the grid was determined in terms of the voltage getting too low(Voltage), overload of the cables (Line Load ) and electrical distortion of thesupply voltage from power supplies and chargers etc. (Harmonics). The figurebelow gives an overview of the results.
User dependent charging
User dependent charging: EVs are charged when people returns from work, i.e. in thepeak hours.*) With no EVs the limit is exceed.
0%
20%
40%
60%
80%
100%
Grid 1 Grid 2*) Grid 3*) Grid 4*) Grid 5 Grid 6
EVpe
netr
atio
nin
feed
erbe
fore
limit
isex
cedd
ed Line Load
Voltage
Harmonics

Deliverable 4.3 – A1 “EV’s impact on Power Quality”
Page 6 of 57 GA MOVE/FP7/265499/Green eMotion
Load dependent charging
Load dependent charging: EVs are charged in low load situation i.e. not in the peak hours*) With no EVs the limit is exceed.
In the load dependent charging, the charge power is modulated (reduced) tominimize the overall peak load. When the charge power is modulated, thedistortion of the supply voltage is increased due to the behavior of the powerelectronics. Thus the relative harmonic emission per EV is higher in the loaddependent charging scenario compared to the user dependent charging. However,the total level of harmonics is lower in the load dependent charging as themaximum total charge power is reduced and the charging takes place when theexisting load is relatively low.
From the analysis, harmonic emissions from EVs are not expected to create a needfor reinforcement of the grid in nearest future, but could be considered as a severeissue for communication like e.g. Power Line Communication. The results showthat sufficient short-circuit level is the most important parameter to avoidharmonic distortion. This should be considered when extending or reinforcing theexisting grid, as great improvements can be achieved with relatively low costs.Furthermore, the results show that the total level of harmonics is highly dependenton other types of equipment connected to the grid also.
Even though it is outside the scope of this assessment, it is to be mentioned thatEVs cannot be assessed separately from other distorting equipment; thus the topicneeds attention to develop the right standards and assessment methods.
A closer cooperation between manufactures and DSOs in the field ofelectromagnetic compatibility should be established in order to ensurecompatibility between equipment connected to the public electricity grids.
Smart meters or any other sensor device, capable of measure harmonics, can playa key role in the future for integrating harmonics into the grid planning. A
0%
50%
100%
150%
Grid 1 Grid 2*) Grid 3*) Grid 4*) Grid 5 Grid 6
EVpe
netr
atio
nin
feed
erbe
fore
limit
isex
ceed
ed Line Load
Voltage
Harmonics

Deliverable 4.3 – A1 “EV’s impact on Power Quality”
GA MOVE/FP7/265499/Green eMotion Page 7 of 57
comprehensive collection of data regarding harmonics is very expensive due tothe personal costs related to on-site measurements. An evolution of the alreadyexisting functionalities related to harmonics in today’s smart meters, couldprovide the required data in order to include harmonics into future grid planningtools.

Deliverable 4.3 – A1 “EV’s impact on Power Quality”
Page 8 of 57 GA MOVE/FP7/265499/Green eMotion
2 Introduction
Europe is undergoing a change from fossil based energy consumption torenewable energy sources such as wind, water, solar energy, burning of waste andbio products. A great part of this development has been in the electric market,exchanging the known power production units to something more environmentfriendly, thus reducing CO2 emission and lowering the dependency on heavy fueloil products (HFO). For a likewise exchange in the transportation sector, theelectric vehicles have long been in use as trams and trains. To fulfill the Transportroadmap 20501 which states a drastic reduction of CO2-emission from thetransport sector, new technology is needed and for the ICE car the electric car ismoving in.
2.1 Electric Vehicles for personal transportation
The exchange from oil based cars to electric cars (EVs) will have a significant andpositive effect on society, local environment in particular and set new demands tothe electric grid.
Despite Internal Combustion Engine Cars (ICE), EVs are connected to and usesthe electric grid when refueling, either via an On-board charger or via an Off-board charger.
Chargers are in general connected to the low-voltage grid, and characterized bydrawing a non-sinusoidal current. This characteristic leads to voltage distortionsin the electric system. The degree of voltage distortions is depending on severalparameters, both parameters related to the charger and parameters related to thegrid.
To determine whether voltage distortions should be considered in planning andmaintenance of low-voltage grid or not, several topics are outlined in thefollowing.
1A goal for the future in the transportation sector, details can be seen e.g. at:http://europa.eu/rapid/pressReleasesAction.do?reference=IP/11/372&format=HTML&

Deliverable 4.3 – A1 “EV’s impact on Power Quality”
GA MOVE/FP7/265499/Green eMotion Page 9 of 57
2.1.1 EU Project Green eMotion and D4.3
The large EU project Green eMotion focuses on electric vehicles; the technicaldevelopment, penetration, and interaction with society. The project consists ofeleven work packages investigating numerous topics related to EVs. The project issupported by partners throughout the European continent and each investigationstands as a small part of a larger picture.
D4.3 will include recommendations for future planning tools for DSOs and aninvestigation of the effect EVs have on the grid and power quality. D4.3 consistsof several reports covering different topics relating EVs to the electrical grid. Anoverview of D4.3 is shown in Figure 2.1.1.
Figure 2.1.1: Overview of deliverable D4.3.
All reports are available on the Green Emotion website under following link:http://www.greenemotion-project.eu/dissemination/deliverables-infrastructure-solutions.php
2.1.2 The subject for the Investigation
In the following, the main subject for the investigations is EVs impact on the low-voltage grid in relation to harmonics due to a massive roll out of EVs. Theinvestigations are focused on charging at private households as it is deemed
Input from T4.2
A. Power QualityD4.3-A1investigates howEVs affect theharmonics in theelectrical grid. Itmay beadvantageous toread D4.3-B1 first.standards.
B. Grid impactD4.3-B1 is an overview of theparameters that relate EVs to theelectrical grid. It also defines many ofthe basic terms that are used throughoutthe deliverable D4.3 reports.
D4.3-B2 investigates the technical andeconomical grid impact of EVs based onthe parameters defined in D4.3-B1. It isrecommended to read D4.3-B1 first.
D4.3-B3 investigates the impact of EVson grid planning and the functionality ofplanning tools. It may be advantageousto read D4.3-B1 first.
C. Tool kitD4.3-C1 is a tool forassessing the technicaland economic impactof EVs in thedistribution network.The tool is calledITRES.

Deliverable 4.3 – A1 “EV’s impact on Power Quality”
Page 10 of 57 GA MOVE/FP7/265499/Green eMotion
important due to the number of charging facilities and a significant increase ofpower consumption at households.
The objective is to determine whether harmonics should be considered in gridplanning and to give recommendations to future standardization work in the areaof Harmonics. The investigations include:
Comparison of IEC calculations and PowerFactory simulationsAnalysis of charging strategies influence on harmonicsAnalysis of grid topologies influence on harmonics
2.2 Outline of this report
In this introduction the GeM-project has been described underlining the aspects ofthis investigation and their relation to the entirety. The introduction chapter endswith the terminology in use in this report, including a table as common source ofabbreviations, to aid the reading process.
Chapter 2 gives a review on harmonics, what is harmonics, what is the concernsregarding harmonics and which standards are relevant for assessing EVs impacton the grid in relation to harmonics.
Chapter 3 describes the methods used to perform the calculations and simulationscovered by this report.
In Chapter 4 the results of the calculations and simulations are presented followedby further analysis of the results.
Chapter 5 perspectives on the results are performed including recommendations tofurther actions related to the topic of harmonics.
2.2.1 Terms and Abbreviations
The commonly used abbreviations and terms are shortly described below. Sincethe project is European, the terms are all relate to the general European standard.
Abbreviation Representation Explanation
Deliverable 4.3 – A1 “EV’s impact on Power Quality”
GA MOVE/FP7/265499/Green eMotion Page 11 of 57
DSO Distribution SystemOperator, grid owners
The company which owns the lower voltagelevel grids. The company can be a privateowned enterprise, state-owned or mixed.
IEC InternationalElectrotechnicalCommission
International standardization organization thatdevelop standards for markets worldwide. IECin front of the number of a standard indicatesthat the standard is adopted by theInternational Electrotechnical Commission.
EN European Norm EN in front of the number of a standardindicates that the standard is adopted by theEuropean Committee for ElectrotechnicalStandardization (CENELEC)
EV Electric Vehicle Electric car which recharges its battery fromthe grid. Substitute for an ordinary commuterfamily car, not a truck or a train.
EVSE Electric VehicleSupply Equipment
The charger or charger stand, includingcables and electronics for communication.
PCC Point of CommonConnection
In general the point in a grid where a specificcomponent is connected.
PQ Power Quality Describes the quality of a grid or in a point ofthe grid, by use of several parameters whichcan be measured or calculated.
Table 2.2.1 Abbreviations of importance.

Deliverable 4.3 – A1 “EV’s impact on Power Quality”
Page 12 of 57 GA MOVE/FP7/265499/Green eMotion
3 Review on Harmonics
3.1 Description of Harmonics
During the last decades more electronic equipment is connected to the electricgrid via residential installations, such as cooking plates, televisions, computers,LEDs etc., contains semi-conductor based switch mode converters. Likewiselarger appliances, such as heat pumps, PV systems and EVs have become morecommon in residential installations over the past years. These types of equipmenthave one thing in common they do not draw a sinusoidal current from the electricgrid. These types of loads are characterized as non-linear loads, and are denoteddistorting loads or harmonic sources.
The current waveform of the non-linear loads can be characterized by acombination of a fundamental frequency, e.g. 50 Hz and a number of frequenciesas a multiple of the fundamental frequency. Last-mentioned are denoted harmonicand interharmonic frequencies.
Harmonic frequencies are integral multiples of the fundamental supplyfrequency, i.e. for a fundamental of 50 Hz, the third harmonic would be 150 Hzand the fifth harmonic would be 250 Hz.
Any frequency which is a non-integer multiple of the fundamental frequency isdenoted interharmonics. By analogy to the order of a harmonic, the order ofinterharmonic is given by the ratio of the interharmonic frequency to thefundamental frequency.
Harmonics and interharmonics of the current waveform lead to distortion of thevoltage waveform, e.g. the fundamental frequency of the voltage waveform issuperposed by frequencies as a multiple of the fundamental frequency –harmonics and interharmonics. The relation between the current waveform and thevoltage waveform is the impedance in the electric grid at the frequency underconsideration, e.g. the 5th harmonics (250 Hz).

Deliverable 4.3 – A1 “EV’s impact on Power Quality”
GA MOVE/FP7/265499/Green eMotion Page 13 of 57
Figure 3.1.1 Harmonic distortion of fundamental waveform
3.2 Concerns regarding Harmonics
Distribution Network Operators (DNOs) across Europe are under obligation todeliver a certain quality of service to the producers and consumers connected totheir grids. This service quality includes quality of supply (amount of poweroutage) and quality of the supply voltage, also denoted Power Quality.
The term Power Quality covers different elements, e.g. steady state voltage drop,rapid voltage drop, flicker and harmonics.
Steady state voltage drop, rapid voltage drop (caused by in-rush current of electricmotors) and grid capacity are well known terms for grid planners and engineersworking in the electricity industry, and have been used as design criteria for low-voltage grids and low-voltage installations for years.
Other elements such as flicker and harmonics are not considered in relation to thedesign of low-voltage grids and low-voltage installations. Those elements aretypically considered in relation to product design, where the acceptable emissionlimits and minimum immunity requirements are specified in international
Harmonics 3rd, 5th and 9th Fundamental
Total

Deliverable 4.3 – A1 “EV’s impact on Power Quality”
Page 14 of 57 GA MOVE/FP7/265499/Green eMotion
standards. The acceptable emission limits given in the standards are based onvarious assumptions, e.g. the electricity system to which the equipment is to beconnected, and the amount of equipment with non-linear characteristics.
The prevalence of non-linear loads i.e. EVs and production units, connected to thelow-voltage grid, may very well have an influence on the validity of theassumptions on which the emission standards are based. Seen from a gridperspective, EVs are relatively large appliances in terms of energy consumption,compared to other residential appliances.
A massive roll out of EVs is from a DNO’s perspective, connection of a largenumber of distorting energy consuming loads. The question is if a massive roll outof EVs is a reality, will DNO’s obligations regarding Power Quality then bemaintained? Does the fact that EVs are distorting loads make Harmonics anelement to consider when designing or reinforcing grids?
3.3 Relevant Standards
Within the European Union, requirements regarding harmonics are regulated bythe EU directive on Electromagnetic Compatibility 2004/108/EC. In short, thedirective states that one apparatus should not disturb another apparatus in a waythat could compromise its operation as intended. Opposite one apparatus shouldbe designed to operate without unacceptable degradation of its intended use in theenvironment in which the apparatus is intended to be used in. The EU directive isnot particularly operational, as the directive only includes essential requirementsand not specific values for maximum acceptable emission levels and minimumimmunity levels. As mentioned previously, emission and immunity levels arespecified in international standards. The most relevant standards concerningharmonics are the following standards:
IEC/EN 61000-2-2:2002 Electromagnetic compatibility (EMC) - Part 2-2:Environment - Compatibility levels for low-frequency conducted disturbances andsignalling in public low-voltage power supply systems
This Standard specifies compatibility levels at the point of common coupling. Thecompatibility levels specified in this standard are used as reference levels for co-ordination in the setting of emission and immunity limits for equipment orinstallations connected to the public low-voltage electric grid. Compatibilitylevels are generally based on the 95 % probability levels of entire systems, usingdistributions which represent both time and space variations of disturbances.
Deliverable 4.3 – A1 “EV’s impact on Power Quality”
GA MOVE/FP7/265499/Green eMotion Page 15 of 57
There is allowance for the fact that the system operator cannot control all points ofa system at all times. Therefore, evaluation with respect to compatibility levelsshould be made on a system-wide basis and no assessment method is provided forevaluation at a specific location.
Figure 3.3.1 System disturbance level and equipment immunity level
Figure 3.3.1 shows the relation between System disturbance level and theequipment immunity level. As long as the actual Disturbance level of the systemis lower than the actual immunity level of the equipment connected to the system,the equipment will operate as intended.
EN 50160:2010 Voltage characteristics of electricity supplied by publicelectricity networks
This European Standard specifies the main characteristics of the voltage at anetwork user's supply terminals in public low-voltage, medium and high-voltageelectricity networks under normal operating conditions. This standard describesthe limits or values within which the voltage characteristics can be expected toremain at any supply terminal in public European electricity networks, and doesnot describe the average situation usually experienced by an individual networkuser. DSOs across Europe refer to this standard in terms of accessing powerquality and to verify that their obligations related to power quality are met. Theharmonic voltage limits specified in this European standard are very similar to the

Deliverable 4.3 – A1 “EV’s impact on Power Quality”
Page 16 of 57 GA MOVE/FP7/265499/Green eMotion
compatibility levels given in IEC 61000-2-2, but the criterion used to assess theharmonic levels in EN 50160 is far more severe than the criterion correspondingto the definition of compatibility levels in IEC 61000-2-22.
To make system disturbance level meet the compatibility level and thus ensurethat equipment connected to the grid can operate satisfactorily together, theequipment needs to fulfill certain requirements. The requirements are specified ineither generic standards, product family standards or product specific standardsand specified in a way that enables the manufactures to test for compliance. Thegeneric standards are used where no product specific standards are available.Following two product family standards related to harmonics are relevant for EVs:
IEC/EN 61000-3-2:2009 Electromagnetic compatibility (EMC) - Part 3-2: Limits- Limits for harmonic current emissions (equipment input current <= 16 A perphase)
This standard covers EVs charging at maximum 16 A per phase. Typical charginglevels at residentials are covered by this standard. 16 A per phase corresponds to3.7 kW single phase and 11 kW three phase at 230 V.
IEC/EN 61000-3-12:2011 Electromagnetic compatibility (EMC) - Part 3-12:Limits - Limits for harmonic currents produced by equipment connected to publiclow-voltage systems with input current > 16 A and <= 75 A per phase
This standard covers charging levels up to 51.8 kW three phase at 230 V. Thuscharging spots, which are commonly used for public and semipublic, are coveredby this standard as the commonly rated power of those charging spots are 50 kWor less.
As well as standards have been developed for harmonic emission limits forequipment, a standard for immunity has also been developed. For EVs thefollowing standard is relevant:
IEC 61000-4-13:2002 Electromagnetic compatibility (EMC) - Part 4-13: Testingand measurement techniques - Harmonics and interharmonics including mainssignalling at a.c. power port, low frequency immunity tests
2 Harmonic level measurements on French low-voltage networks, CIRED' 2007.

Deliverable 4.3 – A1 “EV’s impact on Power Quality”
GA MOVE/FP7/265499/Green eMotion Page 17 of 57
This basic standard covers charging levels up to 3.68 kW. Immunity test methodfor higher power ratings still needs to be considered.
With respect to emissions from large installations connected to public low-voltagepower systems, the following technical report gives guidance to system operators:
IEC/TR 61000-3-14 Electromagnetic compatibility (EMC) - Part 3-14:Assessment of emission limits for harmonics, inter-harmonics, voltage fluctuationsand unbalance for the connection of disturbing installations to LV power systems
This technical report provides guidance on the principles that can be used as thebasis for determining the requirements for the connection of large disturbinginstallations to low-voltage public power systems. In addressing installations, thisreport is not intended for replacing equipment standards for emission limits.The procedure is divided into three stages:
Stage 1: Simplified evaluation of disturbance emissionIn general small appliances can be installed and connected to the grid without aspecific evaluation of harmonics by the DSO. This is typically the case where themanufactures have designed equipment in compliance with EN61000-3-2 orIEC/EN61000-3-12. This means that chargers for residentials (on-board chargers),semipublic and public charging spots are not specifically evaluated by the DSO.
Stage 2: Emission limits relative to actual system characteristicsIf the installation does not meet the criteria of stage 1 evaluation, the harmonicdistorting equipment must be evaluated together with the absorption capacity ofthe electric grid. Related to EVs this is only relevant for fast charging with powerratings greater than 51.8 kW or dedicated charging stations with multiplechargers.
Stage 3: Acceptance of higher emission levels on a conditional basisWhere the installation does not fulfill the basic limits in stage 2, the customer andthe DSO may agree on higher levels of emissions than the basic limits in stage 2.However, a comprehensive study of actual and future system characteristics mustbe carried out in order to ensure that the DSOs meet their obligations to othercustomers. As for stage 2, this is only relevant for fast charging with powerratings greater than 51.8 kW and dedicated charging stations.

Deliverable 4.3 – A1 “EV’s impact on Power Quality”
Page 18 of 57 GA MOVE/FP7/265499/Green eMotion
As stated previously, this technical specification is not applicable to determineemission requirements to specific equipment; however, it can be used todetermine the maximum global emission contribution of EVs, and to determineemission limits to large installations containing EVSEs, e.g. large chargingstations.
In the previous report prepared by D4.3-B1 “Grid Impact studies of electricvehicles_Parameters for Assessment of EVs Impact on LV Grid” severalparameters are identified, which are to be considered when performing acomprehensive assessment of EVs impact on electric low-voltage grid. One ofthose parameters is Power Quality -a set of parameters (harmonics, voltage,flicker) that describes the state of the grid and the likelihood of certain types offailure. The results of a comprehensive assessment of EVs impact on harmonicdistortion in the low-voltage grid is presented in this report, taking into accountthe influence of other parameters identified. Following parameters have beenconsidered in the assessment:
Grid TopologyThe setup and components of the grid including sizeA variety of specific low-voltage grids in terms of design, length, rural and urbanareas and number of customers connected to the grid is used as basis for theassessment. However, the assessment is limited to low-voltage grids supplyingresidential areas.
Number of EVsThe number of EVs either on a radial, in a grid or in a countryThe number of EVs have a significant impact on the level of harmonics in aspecific grid as each individual EV contributes to the total level of harmonics. Allgrids have been assessed for penetration rates from 0-100 % EVs, correspondingto one EV per household.
Charging profileA charging profile for a number of EVs: typically a curve depicting demand perhour or 15 minutes during a day.The number of EVs which can be connected to the electric grid depends on thecharging profile. Thus the level of harmonics depends on the charging profile, aslevel of harmonics are affected by the number of EVs. Three different chargingprofiles have been assessed. More details on the charging profiles can be found inannex 2 in “D4.3 Parameters for Assessment of EVs impact on Low-voltage Grid”

Deliverable 4.3 – A1 “EV’s impact on Power Quality”
GA MOVE/FP7/265499/Green eMotion Page 19 of 57
Charge ManaGeMent StrategyThe strategy or philosophy of how the charge of many EVs should be done inorder to minimize negative effects on the gridThe Charge ManaGeMent Strategy has been indirectly assessed by changing theassessment of different charging profiles. More details on Charge ManaGeMentStrategies can be found in “D4.2 Recommendation on grid-supportingopportunities of EVs”3
ConsumptionThe general consumption of electricity at a given time, often expressed as hourlyvalues during a day.Most of the assessments are performed considering both the consumption of EVsand the traditional consumptions. This is done in order to determine whether thenumber of EVs to be connected is limited by harmonics or other parameters suchas capacity.
CapacityThe capacity of a grid varies with the size the components and the level ofvoltage, current etc.The grid capacity is considered in most of the assessments, as the number of EVsto be connected is limited by the capacity of the grid or due to harmonics. Thecapacity has been considered in both balanced connection of EVs and unbalancedconnection of EVs. The last mentioned is relevant in case of single phaseconnections, which is common practice today.
3 Available on Green Emotion website under following link:http://www.greenemotion-project.eu/dissemination/deliverables-infrastructure-solutions.php

Deliverable 4.3 – A1 “EV’s impact on Power Quality”
Page 20 of 57 GA MOVE/FP7/265499/Green eMotion
4 Harmonic Calculations and Simulations
4.1 Basis for calculations and simulations
4.1.1 Grids
The grids under examination in this report, are choosen to be very different gridexamples, the only thing in common for each grid under investigation, is the factthat the grids consist of ordinary households only, thereby none of the grids arepolluted by major industry etc.The grids under the loop are from three different countries, more preciselyDenmark, Spain and Italy. Furthermore, the grids differentiate from each other ina great many other parameters; number of consumers, the age of the grid etc.By investigating such a variety of different grids, a broader perspective on theresults is achieved, and thus gives a more reliable answer to the investigatedproblems.
4.2 IEC Guidelines
The International Electrotechnical Commission – IEC has provided a set ofguidelines to determine the requirements for connection of large distortinginstallations to the public low-voltage electric grid. Guidelines related toharmonics are described in:
IEC/TR 61000-3-14 Electromagnetic compatibility (EMC) - Part 3-14:Assessment of emission limits for harmonics, interharmonics, voltage fluctuationsand unbalance for the connection of disturbing installations to LV power systems
In most of the European countries, some of the calculations methods described inthe above mentioned guidelines are used as basis for assessing distortinginstallations, however, mostly for production units. The assessments are typicallycarried out in a manual process, e.g. by using a calculator or an EXCEL spreadsheet. Simulations tools, such as Digsilent Power Factory, already providefeatures to assess harmonics; however, the assessment of distorting installations inlow-voltage grids are typically carried out manually, as low-voltage grids are notintegrated into the simulations tools.

Deliverable 4.3 – A1 “EV’s impact on Power Quality”
GA MOVE/FP7/265499/Green eMotion Page 21 of 57
Despite the fact that the IEC guidelines are not intended for assessment purposeson impact from specific equipment the calculation methods described in the IECguidelines are used as a basis for determing the global emission limits from EVsand the global contribution from EVs. A comprehensive assessment with a largenumber of loads according to the guidelines is very time consuming, why thecalculations have been simplified by applying an average impedance.
4.2.1 Method of calculation
As mentioned in section 3.3 the IEC guidelines IEC/TS 61000-3-14 uses threestages of evaluation. The basis of the calculation method is stage 2 where theharmonic distorting equipment must be evaluated together with the absorptioncapacity of the electric grid. However, the calculations are simplified compared tothe guidelines, in order to enable a manual process. The method is described in thefollowing.
The starting point is to define the overall acceptable level for each harmonic,including both existing load and EV load. For this purpose the compatibilitylevels of low-voltage grids presented in the guidelines is used.
Table 4.2.1 Compability levels in low-voltage grids
According to the technical specification, a relatively high share of approximately75% of the overall acceptable level for each harmonic is reserved for thecontribution from the upstream voltage level. This means that only 25% isreserved for the contributions from appliances connected to the low-voltage grid.
Only part of the total level of harmonics can be reserved for EVs, as the existingloads need its share too. The share to be reserved for EVs is calculated fromfollowing formula:

Deliverable 4.3 – A1 “EV’s impact on Power Quality”
Page 22 of 57 GA MOVE/FP7/265499/Green eMotion
= ∙
Where: GhEV = Maximum contribution to the hth harmonic voltage
from EVs.GhEV = Maximum contribution to the hth harmonic voltageanywhere in the low-voltage system .SEV = Nominel apparent power for the total amount of EVsconnected to the grid.Strf = Nominel apparent power of the low-voltage transformer.α = Summation exponent
Harmonic order α (alfa)
h < 5 1
5 ≤ h ≤ 10 1,4
h > 10 2
The contribution from each individual EV is characterized by a harmonic currentIh,i of each harmonic order h. The harmonic current of harmonic order h for thetotal number of EVs connected to the low-voltage grid Ih is determined by thefollowing formula:
= ,
Where: Ih = Harmonic current of harmonic order h for the total number ofEVs.Ih,I = Harmonic current of harmonic order h for individual EV i.Nev = Total number of EVs connected to the gridα = summation exponent
To determine the harmonic currents contribution to the voltage harmonic, theimpedance of the grid at the frequency corresponding to the harmonic order underconsideration, is determined. For this purpose, an average resistance at 50 Hz andreactance is determined for each grid. This is done by calculating the averageimpedance of each node in the grid. The frequency dependency is characterizedby following formula:
= + 50The prerequisite of the scenario is that emission from each EV corresponds to theemission limits specified in EN61000-3-2.

Deliverable 4.3 – A1 “EV’s impact on Power Quality”
GA MOVE/FP7/265499/Green eMotion Page 23 of 57
4.3 Simulations in Digsilent Power Factory
4.3.1 Method of simulation
The method of simulation has been split into several steps, this has been done toensure the procedure reflects the grid under evaluation as close to the actual gridas possible. The steps for setting up the simulations are as follows:
· Gathering information of real grid examples· Establishing the grids in a proper simulation tool· Generating load- and charging profiles· Setting up harmonic data· Placement of EVs· 0-100% simulated penetration of EVs· Choosing interesting grid examples from the grid pool
This report aims to investigate the impact of EVs on a wide variety of grids, andfor that purpose it has been required to collect data from grids not likely to matcheach other. In order to accomplish this, this report contains grid data from thefollowing countries; Denmark, Spain and Italy. The entire pool of grids, consist of10 Danish, 9 Spanish and 2 Italian grids.
Establishing the grids in a proper simulation toolThe grids have been established in the DIgSILENT ® PowerFactory.The calculation program PowerFactory, is a computer aided engineering tool forthe analysis of transmission, distribution, and industrial electrical power systems.It has been designed as an advanced integrated and interactive software packagededicated to electrical power system and control analysis in order to achieve themain objectives of planning and operation optimization.
Generating Load and Charging profiles

Deliverable 4.3 – A1 “EV’s impact on Power Quality”
Page 24 of 57 GA MOVE/FP7/265499/Green eMotion
To be able to make a precise simulation of the chosen grids, different profiles ofloads have to be taken into account. This covers load profiles for: Everyhousehold, EVs and additional network feeders connected to the same low-voltagetransformer. In order to achieve a precise result of the simulations of the grids, arange of load profiles depending on the number of customers and a range ofcharging profiles depending on the number of EVs have been included in thesimulation tool, PowerFactory.
· Consumer base load· EV Charging profile· Accumulated Consumer base loads for additional feeders
The consumer base load is representing the load already present in the grid, due toordinary households. This base load is based upon averaged country specificmeasurements, i.e. to a Danish grid the consumer base load is based on an averageDanish load profile. The consumer base load is furthermore influenced by adiversity factor, and will thereby appear diminishing relatively as the number ofconsumer grows.
For this analysis, three different charging profiles, User dependent, Timer Basedand Load dependent have been included in this analysis, representing the load ofEVs. The charging profiles are country specific as the traffic patterns differslightly from country to country. Furthermore the load dependent charging profilemust be adapted to the country specific load profile.
Details of the load profiles and charging profiles can be found in D4.3 Parametersfor Assessment of EVs impact on Low-voltage Grid.
Setting up harmonic dataTwo different harmonic sources have been added to the simulation tool,PowerFactory.
· Consumer base load background noise· Harmonic source for EVs
Consumer base load background noiseThe harmonic component of the households/base load is measured values fromChristmas Eve in Denmark, and has been chosen to ensure a kind of worst casescenario. The base loads implemented in the grids are containing a harmonicsource to illustrate the background noise already present in the grid, even before

Deliverable 4.3 – A1 “EV’s impact on Power Quality”
GA MOVE/FP7/265499/Green eMotion Page 25 of 57
any EVs are to be implemented. The background noise is not a symmetricalloading. The harmonic source of the base load is as shown in the table below:
Consumer BaseLoad Background Noise
HarmonicPhase 1 Phase 2 Phase 3
Ih/In Ih/In Ih/In
Order % % %
3 9,812012 10,55846 9,6478285 6,107552 5,966593 7,0353327 3,129378 2,680015 2,2050149 2,519235 2,976302 2,242232
11 1,167895 1,396946 1,23060713 0,5661846 0,574728 0,48918115 0,715251 0,846662 0,48069917 0,579144 0,741237 0,58209819 0,2370915 0,347408 0,36935521 0,2402822 0,190463 0,10160723 0,1975107 0,148217 0,09038725 0,1507719 0,084557 0,048903
Table 4.3.1 Emission values of base load (existing load)
Harmonic source for EVsTwo different harmonic sources for EVs are used in this analysis.
Each harmonic source illustrates the harmonic behavior of the EVs, whencharging with the User dependent –and Timer based charging scenarios. Thisharmonic source is an average with respect to the maximum values of eachindividual EV included in the measurements in D4.2 Recommendation on grid-supporting opportunities of EVs”, when charging at maximum power.
The second harmonic source used in this report has been created to define theharmonic behavior of EVs when charging with less than maximum power. This isdue to the fact that when charging with regards to the Load dependent chargingscenario, an EV will not be charging at maximum power. This harmonic source isbased on the measurement performed in “D4.2 Recommendation on grid-supporting opportunities of EVs”, and is an average with respect to the maximumvalues of each individual EV at any power range.
For User dependent/Timer based charging as for Load dependent charging, theaverage of the individual EV has been chosen due to the fact that different EVs

Deliverable 4.3 – A1 “EV’s impact on Power Quality”
Page 26 of 57 GA MOVE/FP7/265499/Green eMotion
have different harmonic spectrums. Thus EVs connected to the same gridprobably do not have the same harmonic spectrum. More details on the harmonicsources can be found in the Appendix. The table below shows the harmonicemissions from the two sources used for this analysis. The IEC limits of theindividual harmonic order for a 16A EV on board-charger are shown forinformation:
Harmonic sources
Harmonicorder
UD/TB LD IEC limits
Harmonicorder
UD/TB LD IEC limitsIh/In
%
Ih/In
%2 0,49% 0,78% 6,75% 14 0,11% 0,17% 0,82%
3 7,48% 10,33% 14,38% 15 0,52% 0,93% 0,94%
4 0,19% 0,27% 2,69% 16 0,08% 0,12% 0,72%
5 2,31% 3,30% 7,13% 17 0,52% 0,86% 0,83%
6 0,16% 0,22% 1,88% 18 0,08% 0,12% 0,64%
7 1,88% 2,71% 4,81% 19 0,64% 0,91% 0,74%
8 0,14% 0,18% 1,44% 20 0,09% 0,11% 0,58%
9 1,37% 2,13% 2,50% 21 0,42% 0,58% 0,67%
10 0,12% 0,14% 1,15% 22 0,09% 0,12% 0,52%
11 1,08% 1,29% 2,06% 23 0,39% 0,55% 0,61%
12 0,11% 0,15% 0,96% 24 0,06% 0,13% 0,48%
13 0,82% 1,50% 1,31% 25 0,32% 0,48% 0,56%
Table 4.3.2 Emission levels of EVs and IEC limits for 16A apparatus
It should be noted that the relative emission levels for the 13th, 17th and the 19th
harmonic order in the load dependent (LD) scenario exceed the relative IEC limitsfor 16A apparatus.
Location of EVsThe EV placement strategy chosen is a strategy where the EVs are distributedalong the feeder. The EVs are placed as single phase units switching between thethree phases (a, b, c) for every EV, based on a voltage ranking. Thus, the EVlocation is neither overly pessimistic (worst case) nor optimistic (best case), butstill errs on the side of caution (is closer to worst case than best case).
- Worst caseThe EVs are placed in the nodes with the lowest voltage. If a node hasseveral customers connected to it, then each of these customers will get anEV, before EVs are placed in any of the other nodes.
- DistributedThe EVs are placed in the nodes with the lowest voltage. If a node has

Deliverable 4.3 – A1 “EV’s impact on Power Quality”
GA MOVE/FP7/265499/Green eMotion Page 27 of 57
several customers connected to it, only one of them will get an EV, beforemoving on to the next node.
- Best caseThe EVs are placed in the nodes with the highest voltage. If a node hasseveral customers connected to it, then each of these customers will get anEV, before EVs are placed in any of the other nodes.
The example below shows a feeder with voltage ranking of the nodes. Blacknumbers denote the number of customers. Red numbers are node names anddenote the voltage ranking of nodes from worst/lowest voltage (1) to best/highestvoltage (4). Applying the above EV placement strategies will place EVs in thenodes in the following order:
- Worst case: 1a,1b,2c,2a,3b,4c,4a,4b- Distributed: 1a,2b,3c,4a,1b,2c,4a,4b- Best case: 4a,4b,4c,3a,2b,2c,1a,1b
EV penetration
Every simulation will revolve around penetrating the grid with EVs. This is doneby sequentially implementing from 0-100% EVs to the grid, by adding one EV atthe time until 100% penetration is reached. By using this approach, thedevelopment can be followed as the penetration increases. The penetration can bedescribed by following formula:
= ℎ ℎ = ℎ ℎ
Choosing interesting grid examples from the grid poolAll grids have been subject to a base case simulation as described in section4.3.3.1. For the final part of the simulation method, the entire grid pool willselectively be deducted to six grids, which contains PQ issues to be investigatedfurther. The chosen grids will then be tested in regards to a variety of simulationscenarios to confirm the grids reaction on these scenarios.

Deliverable 4.3 – A1 “EV’s impact on Power Quality”
Page 28 of 57 GA MOVE/FP7/265499/Green eMotion
4.3.2 Treatment of data.
When treating the output data from the simulations into usable and graphicalrepresentation in this report, the data has to be converted into a table form. Theoutput of every simulation is a huge data mass, this is due to the way the outputshave been chosen to be extracted from PowerFactory. When simulating a grid, theoutput contains three different output categories, namely voltage, grid capacityand harmonic distortion.Each of these categories again contains one data-file per implemented EV in thegrid, plus a base scenario of 0% EV penetration. In order to handle such a hugeamount of data visually, every output data file from 0-100% EV penetration hasbeen converted into a duration-curve for every increment in EVs for all of thethree categories.
The duration curve is containing every result from every node in the grid.
In the duration curve where the harmonics are depicted, the limit in the curve ofthe harmonics has been normalized for every harmonic order, and thereby makingit easier for the reader.
The above clarification of the data handling is underlined as an example of datafrom Grid 1, in the analysis below:
Figure 4.3.1 Duration curves for Line loads.
% of time during the day % of time during the day

Deliverable 4.3 – A1 “EV’s impact on Power Quality”
GA MOVE/FP7/265499/Green eMotion Page 29 of 57
Figure 4.3.1 shows two line load scenarios, the base scenario (to the left) and thefinal scenario (100 % EV penetration, to the right). The figure shows two differentpictures of the line load, the base scenario and the scenario with a 100 % EVpenetration. To determine whether an asset is overloaded or not, a limit of 100%of the capability of the asset is selected. It is clear at the base scenario that theline load of the grid is nowhere near getting overloaded, since the peak load is30%. The scenario with 100 % EV penetration shows a peak load close to 200 %of the line load the grid is actually capable of, and that the line is overloaded 10 %of the time. Therefore the limit of EVs able to be connected to this grid withrespect to the line load is less than 100% EV penetration. The exact limit can befound by analyzing the other penetration rates.
Figure 4.3.2 shows two voltage scenarios, the base scenario (to the left) and the finalscenario (100 % EV penetration, to the right).
Figure 4.3.2 shows two different pictures of the voltage, the base scenario and thescenario with a 100 % EV penetration. Due to technical reasons the scaling of they-axis is different in the two pictures. To determine whether the voltage limit isviolated or not, a voltage drop of 5% is selected, as this is a commonly useddesign criteria. The maximum allowed duration of voltage violation is 5% inaccordance with EN 50160 Voltage characteristics of electricity supplied bypublic electricity networks. It is clear at the base scenario that the voltage of thegrid is nowhere near getting below the required 95% (0.95 p.u.) of the nominalvoltage level, more than 5% of the time. Whereas the scenario with 100 % EVpenetration, shows a voltage dive to 95% of the nominal current 5% of the time,
Deliverable 4.3 – A1 “EV’s impact on Power Quality”
Page 30 of 57 GA MOVE/FP7/265499/Green eMotion
which is not acceptable. Therefore the limit of EVs able to be implemented in thisgrid with respect to the voltage is found in between 0- 100% EV penetration.
Figure 4.3.3 shows two harmonic scenarios, the base scenario (to the left) and the finalscenario (100 % EV penetration, to the right).
The Figure 4.3.3 shows two different pictures of the harmonics, the base scenarioand the scenario with a 100 % EV penetration. To determine whether theharmonic limits are violated or not, limits have be chosen in accordance with EN50160 Voltage characteristics of electricity supplied by public electricitynetworks. The maximum allowed duration of harmonic violation is 5% inaccordance with EN 50160. The base scenario shows the level of harmonics in thegrid is less than 11% of the low-voltage emission limits, 95 % of the time. Thescenario with 100% EV penetration has a change in the level of harmonics lessthan 40% of the low-voltage emission limits, 95% of the time. It can beconcluded, that in this scenario the grid is capable of handling the harmonics fromEVs.
4.3.3 Simulations with User Dependent Charging
4.3.3.1 With background noise
The entire pool of grids has been simulated with a user dependent chargingstrategy. This has been done in order to be able to analyse which one of the gridsis showing signs of a weakness when looking at power quality under the loop.
U normalized to IEC limits
Deliverable 4.3 – A1 “EV’s impact on Power Quality”
GA MOVE/FP7/265499/Green eMotion Page 31 of 57
This simulation is the “base-case”, and therefore, this scenario has been used tosort the entire grid pool down to the six chosen grids to be further investigated.
The composition of this charging strategy is as follows:· Every household is simulated with a base load· EVs are simulated from 0-100 % penetration· EVs are sequentially implemented as single phase loads on the three
phases by turn· User dependent charging profile· UD/TB harmonic source
4.3.3.2 Without background noise, with IEC limits and measured noise
The six chosen grids have been simulated, only with respect to calculating voltagedistortion derived from the EVs. This procedure has been done as a doublescenario by changing the harmonic EV source between the UD/TB harmonicsource and the LD harmonic source according to Table 4.3.2. This has been doneto determine the differences between real measurements and the IEC limits fordistortion, and in addition to determine whether or not the calculation methodperformed by PowerFactory and the IEC calculations is in compliance.
The composition of this simulation is as follows:
· Every household is removed from the simulation· EVs are simulated from 0-100% penetration· EVs are sequentially implemented as single phase loads on the three
phases by turn· User dependent charging profile· UD/TB harmonic source according to Table 4.3.2
4.3.4 Simulations with Timer Based Charging
4.3.4.1 With background noise
In this simulation scenario the chosen grids, Grid 1-6, are simulated with regardsto assess whether a Timer Based charging profile is improving the grids’capability to handle a great penetration of EVs, compared to both User definedand load dependent charging strategies.

Deliverable 4.3 – A1 “EV’s impact on Power Quality”
Page 32 of 57 GA MOVE/FP7/265499/Green eMotion
The composition of this charging strategy is as follows:
· Every household is simulated with a base load· EVs are simulated from 0-100% penetration· EVs are sequentially implemented as single phase loads on the three
phases by turn· Timer Based charging profile· UD/TB harmonic source
4.3.5 Simulations with Load Dependent Charging
4.3.5.1 With background noise
In this simulation scenario the chosen grids, Grid 1-6, are simulated with regardsto assess whether a Load dependent charging profile is improving the grids’capability to handle a great penetration of EVs, compared to both User definedand Timer Based charging strategies.
The composition of this charging strategy is as follows:
· Every household is simulated with a base load· EVs are simulated from 0-100% penetration· EVs are sequentially implemented as single phase loads on the three
phases by turn· Load dependent charging profile· Load dependent harmonic source (OPT)
Information of grid selectionThis report aims to investigate the impact of EVs on a wide variety of grids, andto do that, it is needed to collect data for grids not likely to match each other. Inorder to accomplish this, this report contains grid data from the followingcountries; Denmark, Spain and Italy. The entire pool of grids, consists of 10Danish, 9 Spanish and 2 Italian grids.An investigation on the entire grid pool has been performed, and out of thisinvestigation 6 grids, which are of special interest when looking at the three powerquality parameters have been chosen.

Deliverable 4.3 – A1 “EV’s impact on Power Quality”
GA MOVE/FP7/265499/Green eMotion Page 33 of 57
Data for the chosen grids can be seen in the following table:
Grid information
Grids Length Transformer size Short-ciruit CurrentAvg. impedans
Comments
. 102m 400 5.77KA 0,079 Ω Surburban grid2 109m 400 5.77KA 0.101 Ω Surburban grid3 60m 200 5.77KA 0.166 Ω Surburban grid4 101m 400 11.5KA 0.219 Ω Surburban/city grid5 109m 630 7.2KA 0.063 Ω City grid6 74m 630 7.2KA 0.087 Ω City grid
Table 4.3.3 Grid data
The chosen grids do all have that in common that they are only supplyinghouseholds, and are not polluted by industry or bigger production facilities. Thethings which differ from grid to grid, is the grid topology e.g. type of cables,length of cables, size of transformer together with the number of consumers andthe density of the consumers in the grid. The diversity of the grids gives differentcharacteristics of the different grids related to harmonics, but also related tocapacity and voltage drop.

Deliverable 4.3 – A1 “EV’s impact on Power Quality”
Page 34 of 57 GA MOVE/FP7/265499/Green eMotion
5 Analysis of results
Comparison of IEC calculations and simulationsThis section will make a comparison of IEC calculations and the PowerFactorysimulations. This is done to investigate how the calculations and simulationsdiffer, including which parameters are influencing the results.
These calculations have been made without any background noise, and are onlytaking the harmonic distortion caused by the EVs into consideration. This is doneby looking at whether the distortion of the EVs is surpassing the LV voltagedistortion limits. The table will only show the state of grids with 100% EVpenetration in order to show a direct comparison between the two calculationmethods.
The results from the IEC and PowerFactory calculations are as follows:
IEC CALCULATIONS
Grid Info 3. Harmonic 15. Harmonic
Grid N EVsn EVs Harmonics %
/Harmonics %
/(IEC) LV limit LV limit
1 184 184 94% 27%2 167 167 86% 33%3 53 53 77% 28%4 339 339 166% 33%5 59 59 133% 33%6 80 80 277% 80%

Deliverable 4.3 – A1 “EV’s impact on Power Quality”
GA MOVE/FP7/265499/Green eMotion Page 35 of 57
POWERFACTORY SIMULATIONSGrid Info 3. Harmonic 15. Harmonic
Grid N EVsn EVs Harmonics %
/Harmonics %
/(PF) LV limit LV limit
1 184 184 45% 95%2 167 167 77% 220%3 53 53 39% 99%4 339 339 110% 250%5 59 59 12% 32%6 80 80 119% 155%
· N EVs is the number of consumers in the grid, and will be equal to thenumber of EVs in the grid when looking at 100 % penetration
· n EVs is the number of EVs the grid can absorb before hitting theharmonic distortion limit
· Harmonic % / LV limit is the percentage of how much of the LV limit isoccupied at 100 % EV penetration in the specific grid, at the respectivecalculation method.
Table 4.3.1 IEC calculations and PowerFactory simulations
Sub conclusion:When examining the results from the comparison between IEC and PowerFactorysimulations, the IEC calculations are generally obtaining significantly higherharmonic distortion at the 3rd harmonic order. When looking at the 15th harmonicorder, the PowerFactory simulations are widespread and give significantly highervalues for the harmonic distortion.
The IEC calculation method is very simplified and strongly dependent on thetransformer capacity and the short-ciruit level. In the IEC calculations theemission limits for each EV are proportional to the share of the transformercapacity. The Power Factory simulations are strongly dependent on the location ofeach EV and the short-ciruit level. In the PowerFactory simulations the distortionis calculated for each individual node in the grid. Situations where EVs arelocated relatively close to the transformer give better results than situations whereEVs are located relatively far from the transformer. Thus the location of the EVsis of great importance. In both methods the short-ciruit level has an influence oncurrent emissions impact on the voltage.

Deliverable 4.3 – A1 “EV’s impact on Power Quality”
Page 36 of 57 GA MOVE/FP7/265499/Green eMotion
Influence of Charging StrategyThis section contains data on how a change in charging strategy influences the PQand limitations of the grids. The simulation contains the three charging scenarios:User dependent charging, Timer Based charging and Load dependent charging.
A clarification of the tables and the results of the charging strategies can be seenin the tables below.
Terms used in the chargingstrategy tables
Clarification of the terms used
Country The country in which the grid is locatedGrid The particular grid name under examinationN EV's The maximum number of EVs/Consumers in the gridLine load The number of EVs the grid can contain before a violation of the
line loadVoltage The number of EVs the grid can contain before a violation of the
voltageHarmonics The number of EVs the grid can contain before a violation of the
harmonic emissionn EV's The maximum number of EVs the grid can contain without
violating any of the three parameters above
Abb. An abbreviation of which of the three parameters is the mostcritical, VHL mean Voltage is the most limiting parameter, thenharmonic and last Line load.
Comments The comment section contains information on the state of thegrid with a EV penetration of 100 %
Table 4.3.2 Clarification of columns in Table 4.3.3, Table 4.3.4 and Table 4.3.5
Deliverable 4.3 – A1 “EV’s impact on Power Quality”
GA MOVE/FP7/265499/Green eMotion Page 37 of 57
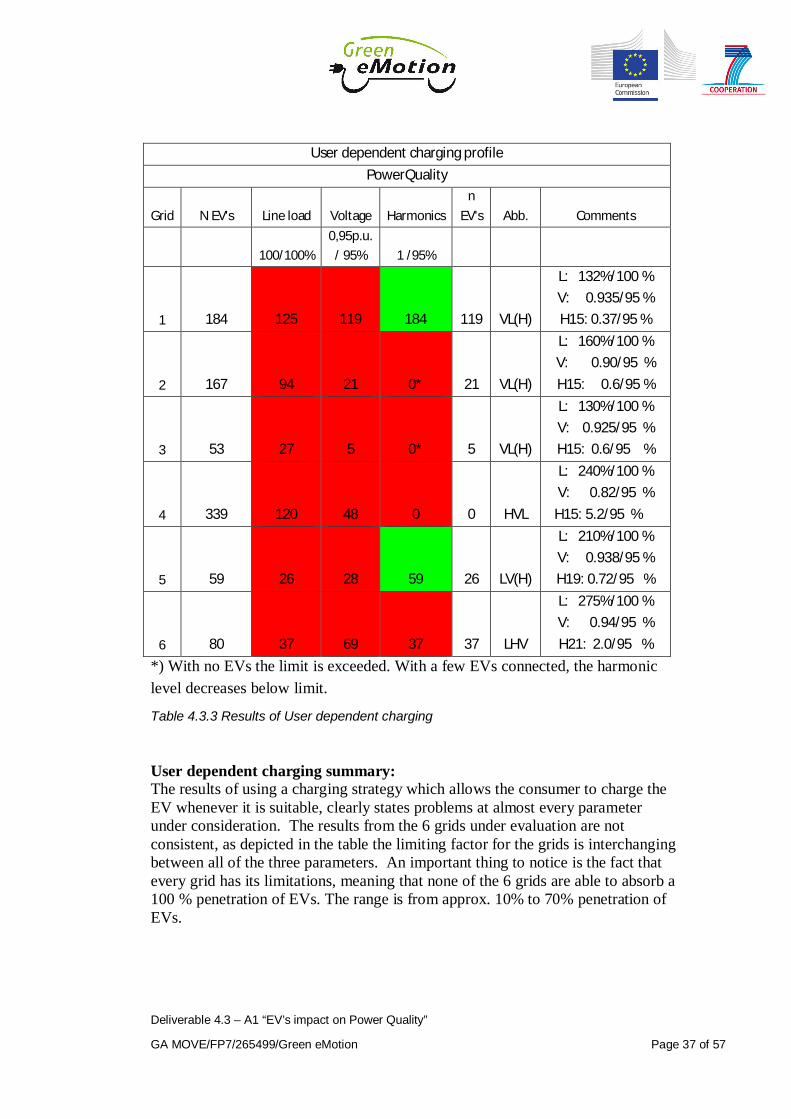
User dependent charging profilePowerQuality
Grid N EV's Line load Voltage Harmonicsn
EV's Abb. Comments
100/100%0,95p.u.
/ 95% 1 /95%
1 184 125 119 184 119 VL(H)
L: 132%/100 %V: 0.935/95 %H15: 0.37/95 %
2 167 94 21 0* 21 VL(H)
L: 160%/100 %V: 0.90/95 %H15: 0.6/95 %
3 53 27 5 0* 5 VL(H)
L: 130%/100 %V: 0.925/95 %H15: 0.6/95 %
4 339 120 48 0 0 HVL
L: 240%/100 %V: 0.82/95 %
H15: 5.2/95 %
5 59 26 28 59 26 LV(H)
L: 210%/100 %V: 0.938/95 %H19: 0.72/95 %
6 80 37 69 37 37 LHV
L: 275%/100 %V: 0.94/95 %H21: 2.0/95 %
*) With no EVs the limit is exceeded. With a few EVs connected, the harmoniclevel decreases below limit.
Table 4.3.3 Results of User dependent charging
User dependent charging summary:The results of using a charging strategy which allows the consumer to charge theEV whenever it is suitable, clearly states problems at almost every parameterunder consideration. The results from the 6 grids under evaluation are notconsistent, as depicted in the table the limiting factor for the grids is interchangingbetween all of the three parameters. An important thing to notice is the fact thatevery grid has its limitations, meaning that none of the 6 grids are able to absorb a100 % penetration of EVs. The range is from approx. 10% to 70% penetration ofEVs.

Deliverable 4.3 – A1 “EV’s impact on Power Quality”
Page 38 of 57 GA MOVE/FP7/265499/Green eMotion
*) With no EVs the limit is exceeded. With a few EVs connected, the harmoniclevel decreases below limit.
Table 4.3.4 Results of Timer based charging
Timer Based charging summary:The results of using a charging strategy which allows the consumer to charge theEV, outside of grid load peaks, clearly states problems at every parameter underconsideration.When looking at Timer Based charging compared to User dependent charging, itis noticeable that the number of EVs that the grids can absorb does not changesignificantly. This is due to the fact that all EVs start charging at the same timeafter the prohibited period is over. Common to Timer Based and User dependentcharging is that neither of the grids can absorb a 100 % penetration of EVs. Therange is from approx. 20 % to 75 % penetration of EVs. With respect to UserDependent charging, it can be concluded that using a Timer Based chargingprofile, in all situations, will be able to postpone grid reinforcement till a laterstage in all situations.
Timer Based charging profilePowerQuality
GridN
EV's Line load Voltage Harmonicsn
EV's Abb. Comments
100/100%0,95 pu
/95% 1 /95%
1 184 132 132 184 132 LV(H)
L: 135%/100 %V: 0.94/95 %H15: 0.45/95 %
2 167 107 52 0* 167 VL(H)
L: 150%/100 %V: 0.91/95 %H15: 0.67/95 %
3 53 29 9 0* 9 VL(H)
L: 120%/100 %V: 0.93/95 %H15: 0.65/95 %
4 339 31 25 0 0 HVL
L: 240%/100 %V: 0.82/95 %H21: 4.9/95 %
5 59 32 36 59 32 LV(H)
L: 210%/100 %V: 0.938/95 %H21: 0.45/95 %
6 80 30 66 33 30 LHV
L: 275%/100 %V: 0.94/95 %H21: 2.2/95 %

Deliverable 4.3 – A1 “EV’s impact on Power Quality”
GA MOVE/FP7/265499/Green eMotion Page 39 of 57
Table 4.3.5 Results of Load dependent charging
*) EVs are not charged during the peak hour, thus harmonics introduced by base-load is not influenced
Load dependent charging summary:When looking at a load dependent charging profile with respect to the previouscharging scenarios, there is a distinct difference between them. The loaddependency in a charging profile ensures that the load coming from charging anEV at a given time is spread widely over the 24 hours of the day.None of the grids in this scenario are experiencing any problems concerning thevoltages or the line loads in the grid.
Sub conclusion:
Load dependent charging profilePowerQuality
Grid N EV's Line load Voltage HarmonicsnEV's Abb. Comments
100/100%0,95 pu/95% 1 /95%
1
184 184 184 184 184
N/A L: 37%/100 %V: 0.97/95 %H15: 0.7/95 %
2
167 167 167 0* 167
N/A L: 25%/100 %V: 0.97/95 %H15: 1.15/95 %
3
53 53 53 0* 53
N/A L: 17%/100 %V: 0.99/95 %H15: 1.2/95 %
4
339 339 339 0* 339
N/A L: 33%/100 %V: 0.97/95 %H15: 1.3/95 %
5
59 59 59 59 59
N/A L: 45%/100 %V: 0.975/95 %H15: 0.15/95 %
6
80 80 80 80 80
N/A L: 47%/100 %V: 0.98/95 %H15: 0.68/95 %

Deliverable 4.3 – A1 “EV’s impact on Power Quality”
Page 40 of 57 GA MOVE/FP7/265499/Green eMotion
The most important conclusion is the fact that overload and voltage violations canbe avoided by introducing Load dependent charging without EVs having asignificant impact on the harmonics.
The common picture is that thermal or voltage limits are exceeded before theharmonic limits are exceeded. Only for one single grid (grid 6) in the userdependent scenario, the harmonic limits are exceeded with the same number ofEVs at approx. 45 % penetration of EVs. In the load dependent scenario 100 %penetration of EVs can be absorbed by the same grid.
It is worth noticing that all scenarios in three grids exceed the harmonic limit with0 EVs connected to the grid, which means that the exceeding of the limit is causedby the existing load and not the EVs. For two of those grids in the User dependentand Timer based scenarios, the harmonics are actually damped by introducingEVs into the grids. In the Load dependent scenario this is not the case, as EVs arenot charging at peak hours.

Deliverable 4.3 – A1 “EV’s impact on Power Quality”
GA MOVE/FP7/265499/Green eMotion Page 41 of 57
6 Analysis of influence of charging strategy and gridtopology
This section will contain an analysis of the influence of charging strategies in thedifferent grids, with concerns to the harmonics. It will be represented by showingthe duration curves of the grids at 0 EVs and a random number of EV penetrationof interest.In both of the aforementioned duration curves, at picture of each scenario willappear, User dependent, Timer Based, Load dependent and the only EV scenario.
Grid 4
Figure 4.3.1 The current state of the grid, assuming zero EVs is implemented in the grid.As seen in the figure, it is already surpassing the Low-voltage limits of the grid.

Deliverable 4.3 – A1 “EV’s impact on Power Quality”
Page 42 of 57 GA MOVE/FP7/265499/Green eMotion
Figure 4.3.2 This picture contains two scenarios, at the top User dependent charging. Thebottom picture is illustrating a Timer based charging strategy, both at 200 EVs.
Deliverable 4.3 – A1 “EV’s impact on Power Quality”
GA MOVE/FP7/265499/Green eMotion Page 43 of 57
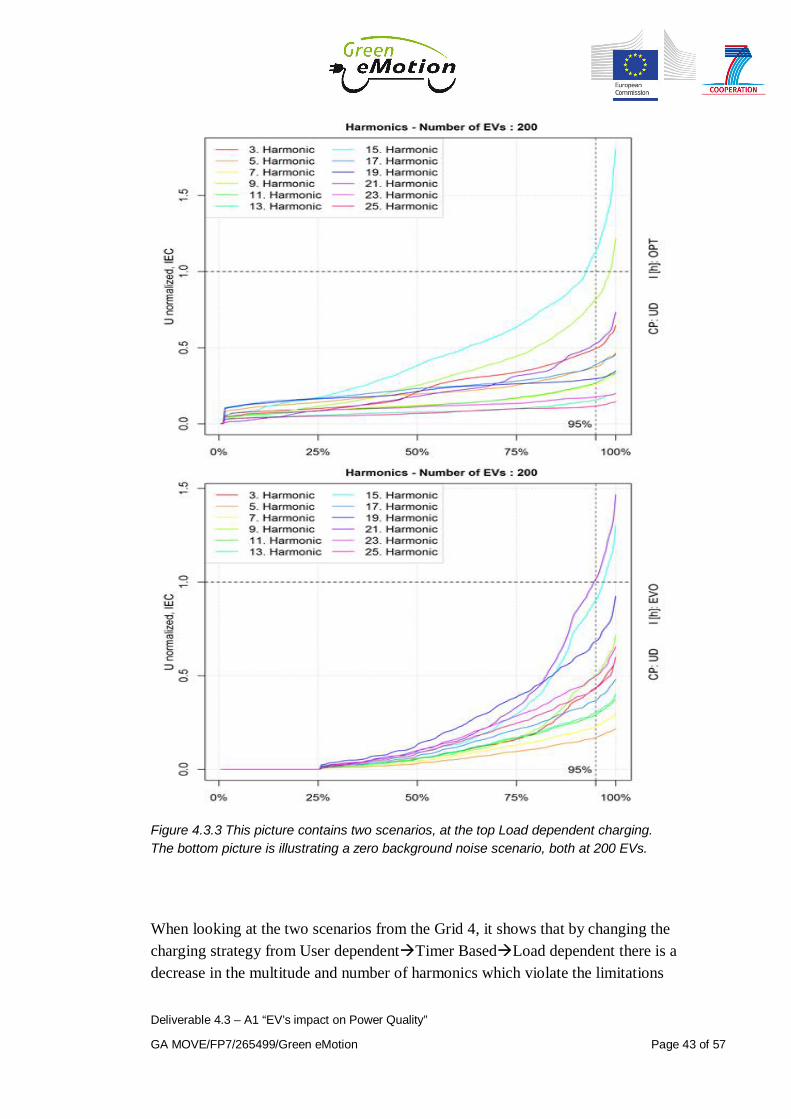
Figure 4.3.3 This picture contains two scenarios, at the top Load dependent charging.The bottom picture is illustrating a zero background noise scenario, both at 200 EVs.
When looking at the two scenarios from the Grid 4, it shows that by changing thecharging strategy from User dependentàTimer BasedàLoad dependent there is adecrease in the multitude and number of harmonics which violate the limitations

Deliverable 4.3 – A1 “EV’s impact on Power Quality”
Page 44 of 57 GA MOVE/FP7/265499/Green eMotion
of the LV-grid. Furthermore, can it be concluded that it is the harmonic orders of amultiple of three which invokes the biggest violations of the grid limitations.
When looking at the zero background noise scenario, it shows that by onlyimplementing EVs to the grid, it will still violate the limitations. Again it is themultiple of three harmonics which violate the limits, whereas the other harmonicsis not surpassing the limit.
GRID 2
Figure 4.3.4 The current state of the grid, assuming zero EVs is implemented in the grid.As seen in the figure, it is already surpassing the Low-voltage limits of the grid.

Deliverable 4.3 – A1 “EV’s impact on Power Quality”
GA MOVE/FP7/265499/Green eMotion Page 45 of 57
Figure 4.3.5 This picture contains two scenarios, at the top User x<dependent charging.The bottom picture is illustrating a Timer based charging strategy, both at 100 EVs.

Deliverable 4.3 – A1 “EV’s impact on Power Quality”
Page 46 of 57 GA MOVE/FP7/265499/Green eMotion
Figure 4.3.6 This picture contains two scenarios, at the top Load dependent charging.The bottom picture is illustrating a zero background noise scenario, both at 100 EVs.
When looking at the two scenarios from the Grid 2, it shows that by changing thecharging strategy from User dependentàTimer basedàLoad dependent there isan increase in the amplitude of the harmonics, but opposite Grid 4, there is never aviolation of the harmonic distortion boundaries (except when using a load

Deliverable 4.3 – A1 “EV’s impact on Power Quality”
GA MOVE/FP7/265499/Green eMotion Page 47 of 57
dependent user profile). Furthermore, can it be concluded that it is the harmonicorders of a multiple of three which invokes the biggest concerns in regards to thedistortion.
When looking at the zero background noise scenario, it shows that by onlyimplementing EVs to the grid, you will not encounter problems with concerns toviolating the limits of harmonic distortion. From the above observation, there isreason to believe that the already existing background noise present in the grid, isdominating compared to the added noise from the EVs.
Grid 5
Figure 4.3.7 The current state of the grid, assuming zero EVs is implemented in the grid.As seen in the figure, it is already surpassing the Low-voltage limits of the grid.

Deliverable 4.3 – A1 “EV’s impact on Power Quality”
Page 48 of 57 GA MOVE/FP7/265499/Green eMotion
Figure 4.3.8 This picture contains two scenarios, at the top User dependent charging. Thebottom picture is illustrating a Timer based charging, both at 100 EVs.

Deliverable 4.3 – A1 “EV’s impact on Power Quality”
GA MOVE/FP7/265499/Green eMotion Page 49 of 57
Figure 4.3.9 This picture contains two scenarios, at the top Load dependent charging.The bottom picture is illustrating a zero background noise scenario, both at 35 EVs.
When looking at the two scenarios from Grid 5, it shows that by changing thecharging strategy from User dependentàTimer based it states a minor increase inthe amplitude of the harmonics. It has to be noted that none of the charging

Deliverable 4.3 – A1 “EV’s impact on Power Quality”
Page 50 of 57 GA MOVE/FP7/265499/Green eMotion
scenarios is violating the grid limits. As a side note, it can be concluded that it isthe harmonic orders of a multiple of three which invokes the biggest harmonicvoltage distortion.When looking at Load dependent charging compared to the two previous chargingstrategies, it is noticeable that the grid is encountering less harmonic distortion.
When looking at the zero background noise scenario with user dependentcharging, it shows a minor decrease when compared to the User dependentscenario incl. background noise. By that it can furthermore be concluded that it isthe EVs which are the distorting part of this grid.
Sub Conclusion:Despite higher emissions from each individual EV in the load dependent scenario,the general trend is a decrease in the total level of harmonics when applying thischarging strategy. The decrease in the total level of harmonics is achieved as themaximum load is reduced in the load dependent scenario. I.e. that in relativenumbers the harmonic emissions are increased by load dependent charging (due tocharge power modulation), but in absolute numbers they are decreasing due to thereduced overall load.
In general harmonic orders of a multiple of three are the most significantharmonics. Typical the 15th and the 9th order compose the highest values relativeto the limits followed by the 21th and the 3rd.
As shown in Table 4.3.3 Grid 4 has significantly higher average impedancecompared to the other grids. All simulations and calculations show a greaterimpact on Grid 4 compared to the other grids. Thus a high short-ciruit level is ofimportance.
Furthermore, the analysis show where a large number of customers or EVs areconnected to the same node in the grid results in a higher level of harmonics,especially harmonic orders of multiple of three. In real grids, cancelation to someextend of those harmonics would occur due to diversity of different EV chargers.A closer look at Grid 6 shows that the customers are located in relatively biggroups far from the transformer which leads to higher levels of harmonics.

Deliverable 4.3 – A1 “EV’s impact on Power Quality”
GA MOVE/FP7/265499/Green eMotion Page 51 of 57
Figure 4.3.10 Topology of Grid 6
25c29c
26c
Contracts
Transformer
8c

Deliverable 4.3 – A1 “EV’s impact on Power Quality”
Page 52 of 57 GA MOVE/FP7/265499/Green eMotion
7 Perspectives
7.1 Improvement of knowledge
The studies carried out within the scope of this report are based on a numberprerequisites and simplifications, for instance the chosen charging profile for loaddependent charging, where the charging power in the peak hours is very limited.Additionally all EVs and loads were set to have the same level of harmonicsrespectively. In real life this is not the case, why the results should be treated withcare.
As the results show in the previous chapter, it is very difficult to assess the impacton the grid as different methods give different results, why knowledge in this fieldshould be improved, explicit taking the evolution of the use of the electricity gridinto account. It is of importance also to include the evolution of the electricity gridup to today, as the local level of harmonics varies.
Measurements of power quality, including harmonics, are the key to gainknowledge in this field as local conditions must be considered in assessing powerquality. Standardization related to EVs is covered by the emission standard EN61000-3-2 Electromagnetic compatibility (EMC) -- Part 3-2: Limits - Limits forharmonic current emissions (equipment input current <= 16 A per phase.) Theemission limits, which cover EVs, are set as absolute values. This has thedisadvantage that the relative emission limits increase when charging power isreduced. Thus it is recommended to develop limits, taking into account reductionof charging power.
Even though, it is out of the scope of this report, it is worth mentioning that thereis a need to develop emission limits between 2 and 150 kHz, so that disturbancesemitted by EVs in this frequency range, do not disturb PLC communications usedfor smart metering and intended to be used in the Smart Grid.
In addition it is recommended to consider future interactions between EVs andDSOs when developing communication standards for EVs as this is a prerequisiteto avoid violations of voltage and capacity limits in the low-voltage grid.

Deliverable 4.3 – A1 “EV’s impact on Power Quality”
GA MOVE/FP7/265499/Green eMotion Page 53 of 57
7.2 Distributed generation and new technologies
The scope of this assessment is to evaluate EVs impact on the existing grid withexisting traditional loads. It must be noticed that this framework will change in thefuture. Distributing generation is emerging and results in more distorting unitsconnected to the grid. Furthermore, new technologies is emerging as well, e.g.LEDs, Heat Pumps, Variable Speed Drives in freezers etc. All together this mightlead to higher levels of harmonics in the distribution grids.
In the short run, it is recommended that DSOs build up knowledge in the field ofelectromagnetic compatibility, develop emission limits for distorting installationsand participate in the standardization work, the latter for the following reasons;Working groups developing standards in the field of electromagneticcompatibility are dominated by manufactures, which involve a high risk thatDSOs needs, are not covered sufficiently.
7.3 Grid planning
As this stage it is not feasible to include harmonics from EVs in the grid planningof low-voltage grid due to the imprecise methods to assess harmonics. Roll out ofSmart meters or any other sensor devices with harmonic measurementcapabilities, could be the first step of including harmonics in grid planning.

Deliverable 4.3 – A1 “EV’s impact on Power Quality”
Page 54 of 57 GA MOVE/FP7/265499/Green eMotion
8 Conclusion
The focus has been low-voltage grids with households as primary consumption.The method has been chosen and developed in accordance with the EV chargingdone in installations of the households and with a focus on charging level of 16 Aat 230/220 V.
From the analysis, harmonic emissions from EVs is not expected to create a needof reinforcement of the grid in nearest future, however, due to the fact that EVscannot be assessed separately from other distorting equipment, the topic needsattention as the development of the right standards and assessment methods willtake some time.
Moreover, the scope of this report only covers residential areas. The harmoniccurrents produced by commercial and industrial customers were not taken intoaccount: their effect at MV cannot be neglected.
Sufficient short-circuit level is the most important parameter to avoid harmonicdistortion. This should be considered when extending or reinforcing the existinggrid, as great improvements can be achieved at relatively low costs.
Furthermore, attention must be paid to harmonic orders of multiple of three asthose harmonics are the most significant relative to the limits. Existing methods toassess harmonics are not very accurate, which makes it difficult to includeharmonics into grid planning.
Smart meters or any other sensor devices, capable of measuring harmonics, canplay a key role in the future for integrating harmonics into the grid planning. Acomprehensive collection of data regarding harmonics is very expensive due tothe personal costs related to on-site measurements. An evolution of the alreadyexisting functionalities related to harmonics of today’s smart meters, couldprovide the required data, in order to include harmonics into future grid planningtools.
Last but not least, a closer cooperation between manufactures and DSOs in thefield of electromagnetic compatibility should be established in order to ensurecompatibility between equipment connected to the public electricity grids.

Deliverable 4.3 – A1 “EV’s impact on Power Quality”
GA MOVE/FP7/265499/Green eMotion Page 55 of 57
9 Appendix
9.1 Derivation of harmonic sources of EV
In this appendix, the derivation of the harmonic sources, used for User dependent(UD)/Timer Based (TB) and the Load Dependent (LD) charging strategy, isdescribed. The harmonic sources of EVs for this analysis are based on the powerquality measurements carried out in “D4.2 Recommendation on grid-supportingopportunities of EVs”
Taking into account that EVs connected to the same grid are not the same type ofEVs, it is most likely that all chargers are not the same type either. Thusharmonics from different EVs should be considered. Simulation of harmonics isvery complex. In order to simplify simulations, the same harmonic source has tobe applied to all EVs connected to the grid in the simulations respectively.
In “D4.2 Recommendation on grid-supporting opportunities of EVs”, PowerQuality measurements have been carried out on five different EVs (E-car1 – E-car5) at three different charging power levels (Pc).
E-car1 E-car2 E-car3 E-car4 E-car5
Full 3.0 kW 2.6 kW 3.0 kW 3.0 kW 3.0 kWMid 2.6 kW 2.1 kW 2.3 kW 2.5 kW 2.5 kWLow 2.3 kW 1.3 kW 1.4 kW 1.4 kW 1.4 kW
To consider that different chargers are used in different EVs, an average of theharmonics from all five EVs is calculated for this study.
For the UD and TB strategies, it is assumed that EVs are charging at full power.Thus the harmonic source for UD/TB is an average of the harmonic currentsmeasured at full charging power.
The LD charging strategy requires variable charging power levels, for whichreason it cannot be assumed that EVs are charging at full power. Thus theharmonic source for LD is an average, taking into account charging at differentpower levels. An average including all EVs is calculated for full, mid and low

Deliverable 4.3 – A1 “EV’s impact on Power Quality”
Page 56 of 57 GA MOVE/FP7/265499/Green eMotion
charging power level, after which the maximum value of the three charging powerlevels is selected for the LD harmonic source.
In the following, the method of deriving the harmonic sources is described:
The harmonic current (in % of Ic) of order (h) from each E-car and chargingpower level is shown in the following table:
E-car1 E-car2 E-car3 E-car4 E-car5
h Full Mid Low Full Mid Low Full Mid Low Full Mid Low Full Mid Low
2 1.47 1.12 1.08 0.33 0.26 1.75 0.15 0.13 0.16 0.28 0.31 0.42 0.23 0.37 0.37
3 6.67 6.62 7.14 3.73 4.38 6.95 12.1 12.5 12.7 7.79 9.25 12.5 6.64 9.45 12.7
4 0.37 0.32 0.24 0.19 0.34 0.59 0.08 0.09 0.12 0.13 0.13 0.22 0.21 0.23 0.24
5 1.42 1.95 1.88 1.98 2.53 4.17 1.25 1.38 1.51 3.06 3.66 5.13 3.78 3.92 4.6
6 0.4 0.28 0.21 0.12 0.12 0.41 0.06 0.12 0.09 0.12 0.15 0.25 0.11 0.17 0.14
7 2.63 2.23 2.74 1.13 1.83 2.84 0.97 1.47 2.12 1.34 1.67 2.67 3.23 3.83 3.32
8 0.32 0.22 0.19 0.1 0.11 0.27 0.07 0.08 0.1 0.09 0.12 0.19 0.11 0.17 0.16
9 2.1 2.13 2.31 1.48 1.8 2.18 1.23 1.88 2.57 1.36 1.01 1.19 0.69 0.75 2.3
10 0.2 0.15 0.17 0.07 0.09 0.21 0.08 0.09 0.09 0.12 0.09 0.12 0.13 0.15 0.11
11 1.35 1.29 1.12 1.03 1.11 1.2 0.9 1.22 1.55 1.08 0.62 1.3 1.06 0.82 1.39
12 0.15 0.13 0.12 0.08 0.11 0.23 0.07 0.11 0.12 0.13 0.1 0.19 0.1 0.09 0.13
13 0.74 1.04 1.29 1.1 1.5 2.06 0.6 0.72 1.09 1.17 1.49 1.03 0.52 1.41 1.09
14 0.15 0.11 0.11 0.09 0.12 0.38 0.09 0.1 0.1 0.1 0.12 0.16 0.1 0.11 0.16
15 0.5 0.65 0.78 0.43 0.7 0.95 0.28 0.37 0.56 0.78 0.62 0.65 0.61 0.58 1.8
16 0.12 0.1 0.09 0.07 0.08 0.24 0.05 0.09 0.08 0.07 0.07 0.11 0.1 0.09 0.14
17 0.52 0.85 0.91 0.47 0.67 0.98 0.44 0.5 0.58 0.43 0.43 0.61 0.72 1.06 0.6
18 0.13 0.08 0.11 0.06 0.07 0.21 0.06 0.08 0.06 0.09 0.08 0.11 0.08 0.12 0.13
19 0.71 0.67 0.6 0.72 0.73 0.93 0.53 0.57 0.69 0.71 0.71 0.62 0.54 1.05 0.52
20 0.16 0.08 0.11 0.06 0.06 0.17 0.07 0.09 0.08 0.06 0.09 0.08 0.11 0.12 0.1
21 0.46 0.47 0.42 0.44 0.55 0.49 0.42 0.41 0.35 0.37 0.37 0.77 0.43 0.61 0.79
22 0.13 0.09 0.1 0.07 0.07 0.15 0.06 0.07 0.08 0.07 0.08 0.1 0.1 0.17 0.1
23 0.46 0.48 0.44 0.49 0.59 0.53 0.46 0.45 0.45 0.29 0.34 0.42 0.28 0.45 0.97
24 0.12 0.08 0.13 0.05 0.09 0.14 0 0.08 0.08 0.07 0.08 0.09 0.08 0.19 0.09
25 0.28 0.44 0.43 0.43 0.44 0.39 0.39 0.36 0.32 0.23 0.44 0.49 0.28 0.3 0.33
In % of Ic.
The average current nominated to one single EV Ih,EV [%] is calculated by usingthe following formulas:
The charging current Ic is calculated for all EVs and charging power levels.

Deliverable 4.3 – A1 “EV’s impact on Power Quality”
GA MOVE/FP7/265499/Green eMotion Page 57 of 57
= ∙ 100
The harmonic current Ih, is calculated for all EVs and charging power levels.
= [%]100
The total harmonic current Ih,total is calculated for all five EVs for all charginglevels
, = , + , +⋯+ , , ℎ = 1
For this study α is set to 1 for the following reasons. In “D4.2 Recommendationon grid-supporting opportunities of EVs” following conclusion has been drawn:
• Harmonics from 3rd to 17th are very close to each other, then an harmonicpollution increment is possible
• Harmonics from 19th to 25th are more equal distributed, in terms ofpercentage. However these harmonics are characterized by a lowamplitude
Additionally the simulations in PowerFactory creates an cancellation effect as thephase angle of the harmonics provided in the simulation is relative to the phaseangle of the fundamental current of the EV, which differs for all connection pointsin the grid. To avoid too optimistic results of the simulations, α is set to 1.
The harmonic current of an average EV Ih,EV (in % of Ic) is calculated
, [%] = ,
, , ⋯∙ 100
The values adopted for this study can be described as follow:
| = , @
=, @, @, @