October 2016 the woodlands market report
1
Price Range Jan Feb Mar Apr May Jun Jul Aug Sep Oct Nov Dec Below $200,000 27 25 25 18 16 19 30 22 30 35 $200,001 -$300,000 142 130 115 111 110 133 171 158 162 163 $300,001 - $400,000 150 154 160 169 176 172 167 154 152 148 $400,001 - $500,000 106 96 104 117 108 118 133 126 119 115 $500,001 - $600,000 71 90 105 104 109 95 98 91 108 104 $600,001 - $700,000 58 61 72 80 76 75 84 88 78 63 $700,001 - $800,000 52 50 48 48 61 61 56 66 50 49 $800,001 - $900,000 25 35 42 47 39 42 47 37 42 37 $900,001 - $1,000,000 19 25 30 29 25 30 28 25 27 29 Over $1,000,001 144 147 158 161 165 167 163 158 140 140 TOTALS 794 813 859 884 885 912 977 924 908 884 Compliments of Betther Homes And Gardens Real Estate Gary Greene. Price Range Jan Feb Mar Apr May Jun Jul Aug Sep Oct Nov Dec Below $200,000 22 32 16 18 12 17 24 20 17 $200,001 -$300,000 40 63 55 63 50 60 60 53 44 $300,001 - $400,000 23 39 44 67 60 49 52 47 30 $400,001 - $500,000 6 21 23 43 34 28 28 26 26 $500,001 - $600,000 5 16 19 26 20 17 23 23 16 $600,001 - $700,000 5 13 8 28 13 12 13 13 5 $700,001 - $800,000 7 4 6 7 11 9 10 10 7 $800,001 - $900,000 3 3 3 10 8 7 3 2 6 $900,001 - $1,000,000 0 3 3 3 6 5 7 7 4 Over $1,000,001 12 9 9 14 8 3 14 9 6 TOTALS 129 203 183 279 222 209 230 210 156 Sold Price To Original List Price % 93% 93% 93% 94% 94% 95% 95% 95% 95% Compliments of Better Homes and Gardens Real Estate Gary Greene 2016 Supply Of Homes On The Market - The Woodlands TX Inventory of homes available for sale on the first day of the month. 2016 Home Buying Demand By Month - The Woodlands TX Represents listings placed Under Contract during the month and is expressed by the list price range as recorded by HAR MLS. NOTE: This representation is based in whole or in part on data supplied by the Houston Board of Realtors Multiple Listing Service. Neither the Board not its MLS guarantees or is in any way responsible for its accuracy. Any market data maintained by the Board or its MLS necessarily does not include information on listings not published at the request of the seller, listings of brokers who are not members of the Board of MLS, unlisted properties, rental properties, etc. The Woodlands October 2016 713.628.3846 Office: 281.367.3531 x 543 [email protected] www.WymoreSellsTheWoodlands.com Debra Wymore REALTOR ® , CRS, ePRO, GRI, GREEN Here’s the housing market in YOUR neighborhood!
-
Upload
debra-wymore -
Category
Real Estate
-
view
6 -
download
1
Transcript of October 2016 the woodlands market report
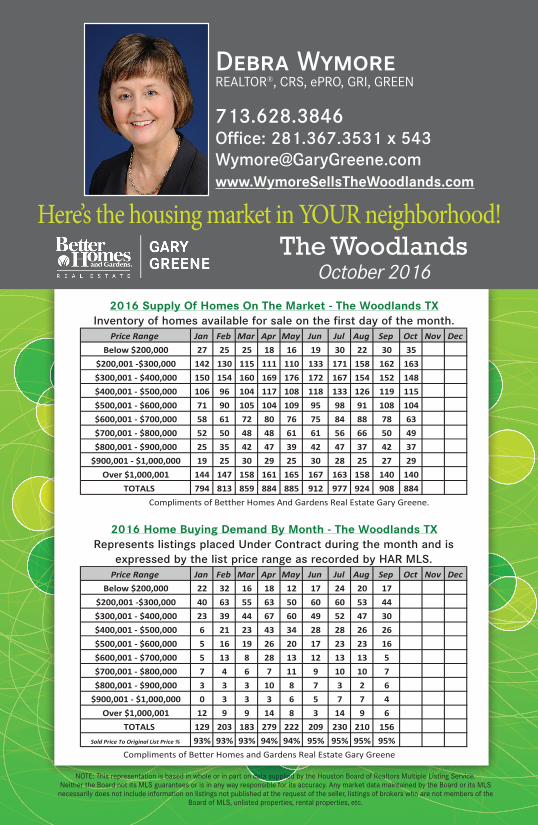
Price Range Jan Feb Mar Apr May Jun Jul Aug Sep Oct Nov DecBelow $200,000 27 25 25 18 16 19 30 22 30 35
$200,001 -$300,000 142 130 115 111 110 133 171 158 162 163$300,001 - $400,000 150 154 160 169 176 172 167 154 152 148$400,001 - $500,000 106 96 104 117 108 118 133 126 119 115$500,001 - $600,000 71 90 105 104 109 95 98 91 108 104$600,001 - $700,000 58 61 72 80 76 75 84 88 78 63$700,001 - $800,000 52 50 48 48 61 61 56 66 50 49$800,001 - $900,000 25 35 42 47 39 42 47 37 42 37
$900,001 - $1,000,000 19 25 30 29 25 30 28 25 27 29Over $1,000,001 144 147 158 161 165 167 163 158 140 140
TOTALS 794 813 859 884 885 912 977 924 908 884 Compliments of Betther Homes And Gardens Real Estate Gary Greene.
Price Range Jan Feb Mar Apr May Jun Jul Aug Sep Oct Nov DecBelow $200,000 22 32 16 18 12 17 24 20 17
$200,001 -$300,000 40 63 55 63 50 60 60 53 44$300,001 - $400,000 23 39 44 67 60 49 52 47 30$400,001 - $500,000 6 21 23 43 34 28 28 26 26$500,001 - $600,000 5 16 19 26 20 17 23 23 16$600,001 - $700,000 5 13 8 28 13 12 13 13 5$700,001 - $800,000 7 4 6 7 11 9 10 10 7$800,001 - $900,000 3 3 3 10 8 7 3 2 6
$900,001 - $1,000,000 0 3 3 3 6 5 7 7 4Over $1,000,001 12 9 9 14 8 3 14 9 6
TOTALS 129 203 183 279 222 209 230 210 156Sold Price To Original List Price % 93% 93% 93% 94% 94% 95% 95% 95% 95%
Compliments of Better Homes and Gardens Real Estate Gary Greene
2016 Supply Of Homes On The Market - The Woodlands TXInventory of homes available for sale on the first day of the month.
2016 Home Buying Demand By Month - The Woodlands TXRepresents listings placed Under Contract during the month and is
expressed by the list price range as recorded by HAR MLS.
NOTE: This representation is based in whole or in part on data supplied by the Houston Board of Realtors Multiple Listing Service. Neither the Board not its MLS guarantees or is in any way responsible for its accuracy. Any market data maintained by the Board or its MLS
necessarily does not include information on listings not published at the request of the seller, listings of brokers who are not members of the Board of MLS, unlisted properties, rental properties, etc.
The WoodlandsOctober 2016
713.628.3846Office: 281.367.3531 x [email protected]
Debra WymoreREALTOR®, CRS, ePRO, GRI, GREEN
Here’s the housing market in YOUR neighborhood!