July 2014 The Woodlands Texas Market Report
1
Price Range Jan Feb Mar Apr May Jun Jul Aug Sep Oct Nov Dec MSI* Below $200,000 36 27 22 32 36 27 25 21 Days $200,001 -$300,000 70 61 57 59 61 68 95 1.7 Months $300,001 - $400,000 46 45 47 46 70 81 85 2.2 Months $400,001 - $500,000 47 42 55 64 78 77 78 3.1 Months $500,001 - $600,000 32 22 28 26 37 56 73 4.7 Months $600,001 - $700,000 24 31 40 47 43 52 57 4.5 Months $700,001 - $800,000 31 30 42 37 40 48 53 6.4 Months $800,001 - $900,000 27 22 20 24 30 30 31 5.4 Months $900,001 - $1,000,000 15 14 15 19 14 19 25 6.5 Months Over $1,000,001 58 76 84 83 95 97 100 9.9 Months TOTALS 386 370 410 437 504 555 622 0 0 0 0 0 2.9 Months Price Range Jan Feb Mar Apr May Jun Jul Aug Sep Oct Nov Dec Below $200,000 34 31 32 45 44 38 $200,001 -$300,000 46 56 84 68 70 69 $300,001 - $400,000 33 36 53 53 59 58 $400,001 - $500,000 23 17 30 38 38 54 $500,001 - $600,000 19 14 23 22 25 26 $600,001 - $700,000 9 11 12 32 17 12 $700,001 - $800,000 8 7 14 11 20 12 $800,001 - $900,000 5 9 8 13 9 8 $900,001 - $1,000,000 7 1 6 9 8 3 Over $1,000,001 11 17 13 16 10 15 TOTALS 195 199 275 307 300 295 0 0 0 0 0 0 List/Sales Price Ratio 98% 98% 98% 98% 98% 98% SUPPLY OF HOMES ON THE MARKET Inventory of homes available for sale on the first day of the month. HOME BUYING DEMAND OF THE MARKET Represents contracts initiated during the month and is expressed as the list price range of the home as recorded by HAR MLS. NOTE: This representation is based in whole or in part on data supplied by the Houston Board of Realtors Multiple Listing Service. Neither the Board nor its MLS guarantees or is in any way responsible for its accuracy. Any market data maintained by the Board or its MLS necessarily does not include information on listings not published at the request of the seller, listings of brokers who are not members of the Board of MLS, unlisted properties, rental properties, etc. THE WOODLANDS July 2014 *MSI – Months Supply of Inventory, which indicates the sales velocity by price range in your neighborhood. 713.628.3846 Office: 281.367.3531 x 543 Wymore@GaryGreene.com www.WymoreSellsTheWoodlands.com Debra Wymore REALTOR ® , CRS, GRI, GREEN
-
Upload
debra-wymore -
Category
Real Estate
-
view
20 -
download
0
Transcript of July 2014 The Woodlands Texas Market Report
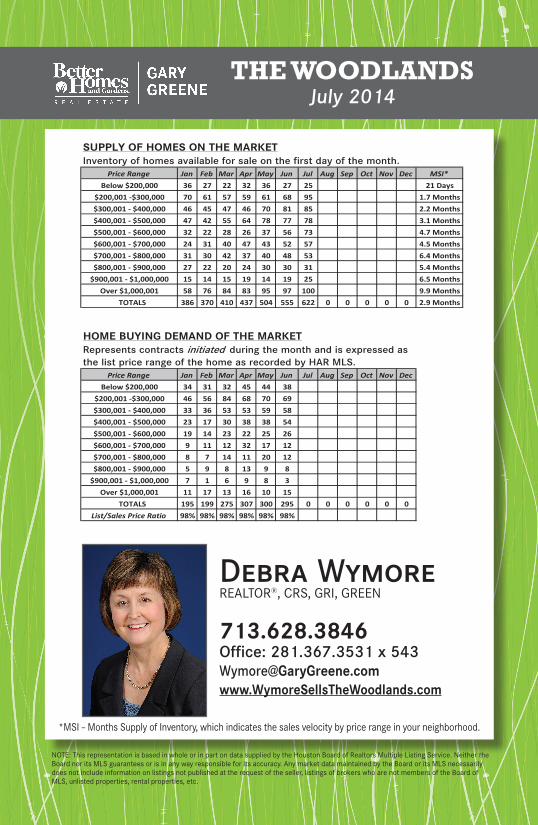
Price Range Jan Feb Mar Apr May Jun Jul Aug Sep Oct Nov Dec MSI*Below $200,000 36 27 22 32 36 27 25 21 Days
$200,001 -$300,000 70 61 57 59 61 68 95 1.7 Months$300,001 - $400,000 46 45 47 46 70 81 85 2.2 Months$400,001 - $500,000 47 42 55 64 78 77 78 3.1 Months$500,001 - $600,000 32 22 28 26 37 56 73 4.7 Months$600,001 - $700,000 24 31 40 47 43 52 57 4.5 Months$700,001 - $800,000 31 30 42 37 40 48 53 6.4 Months$800,001 - $900,000 27 22 20 24 30 30 31 5.4 Months
$900,001 - $1,000,000 15 14 15 19 14 19 25 6.5 MonthsOver $1,000,001 58 76 84 83 95 97 100 9.9 Months
TOTALS 386 370 410 437 504 555 622 0 0 0 0 0 2.9 Months
Price Range Jan Feb Mar Apr May Jun Jul Aug Sep Oct Nov DecBelow $200,000 34 31 32 45 44 38
$200,001 -$300,000 46 56 84 68 70 69$300,001 - $400,000 33 36 53 53 59 58$400,001 - $500,000 23 17 30 38 38 54$500,001 - $600,000 19 14 23 22 25 26$600,001 - $700,000 9 11 12 32 17 12$700,001 - $800,000 8 7 14 11 20 12$800,001 - $900,000 5 9 8 13 9 8
$900,001 - $1,000,000 7 1 6 9 8 3Over $1,000,001 11 17 13 16 10 15
TOTALS 195 199 275 307 300 295 0 0 0 0 0 0List/Sales Price Ratio 98% 98% 98% 98% 98% 98%
SUPPLY OF HOMES ON THE MARKETInventory of homes available for sale on the first day of the month.
HOME BUYING DEMAND OF THE MARKETRepresents contracts initiated during the month and is expressed as the list price range of the home as recorded by HAR MLS.
NOTE: This representation is based in whole or in part on data supplied by the Houston Board of Realtors Multiple Listing Service. Neither the Board nor its MLS guarantees or is in any way responsible for its accuracy. Any market data maintained by the Board or its MLS necessarily does not include information on listings not published at the request of the seller, listings of brokers who are not members of the Board of MLS, unlisted properties, rental properties, etc.
The WoodlandsJuly 2014
*MSI – Months Supply of Inventory, which indicates the sales velocity by price range in your neighborhood.
713.628.3846Office: 281.367.3531 x [email protected]
Debra WymoreREALTOR®, CRS, GRI, GREEN