Ocean Energy Overview: Wave Power & Tidal Power May 10, 2007.
16
Ocean Energy Overview: Wave Power & Tidal Power May 10, 2007
-
Upload
imogene-clemence-houston -
Category
Documents
-
view
217 -
download
1
Transcript of Ocean Energy Overview: Wave Power & Tidal Power May 10, 2007.
Ocean Energy Overview:Wave Power & Tidal Power
May 10, 2007
2
Wave Power
3
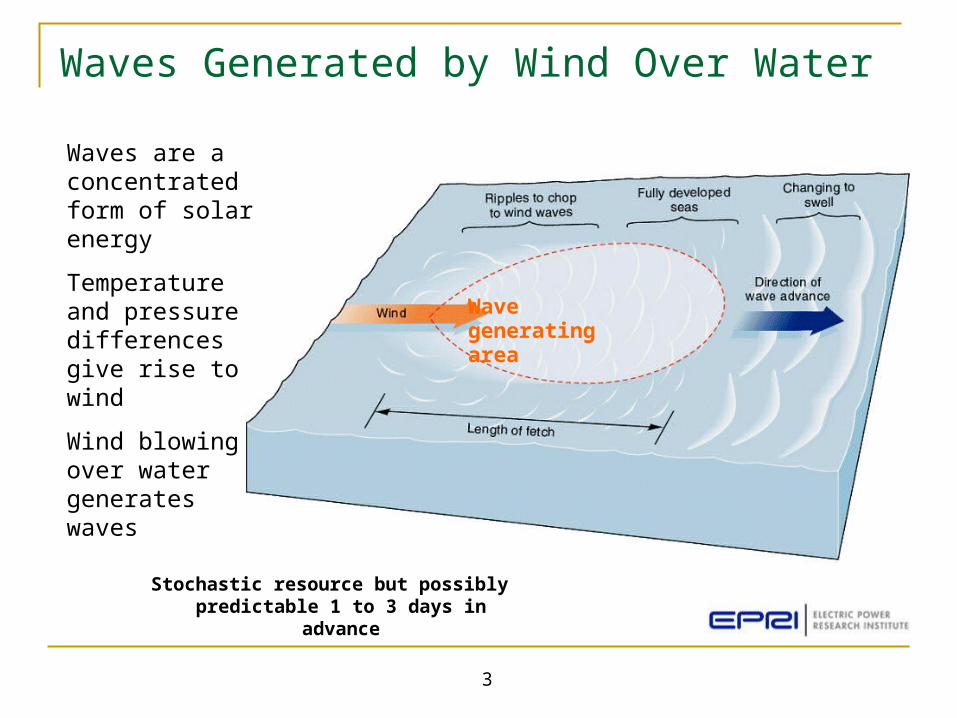
Waves Generated by Wind Over Water
Wave generating area
Stochastic resource but possibly predictable 1 to 3 days in advance
Waves are a concentrated form of solar energy
Temperature and pressure differences give rise to wind
Wind blowing over water generates waves
4
Wave Power Overview
What is wave power? For PG&E, opportunity to extract renewable energy from waves along northern coast of
California Most wave energy conversion (‘WEC’) devices are deployed on surface of water
Like wind turbines, multiple WEC devices are aggregated in ‘farms’ Operate in varying depths (60-600 feet) Nascent technology (mostly pre-commercial)
California has high potential PG&E service territory borders 600 miles of Pacific coastline
High wave power densities suggest good economics Potential annual energy production could be as high as 48,000 GWh
Wave power could make a significant contribution to future RPS goals
Permitting of wave power plants follows FERC hydropower licensing process Many stakeholders – environmentalists, fishermen, surfers, etc. Roughly 5 year process expected for development license grant
5
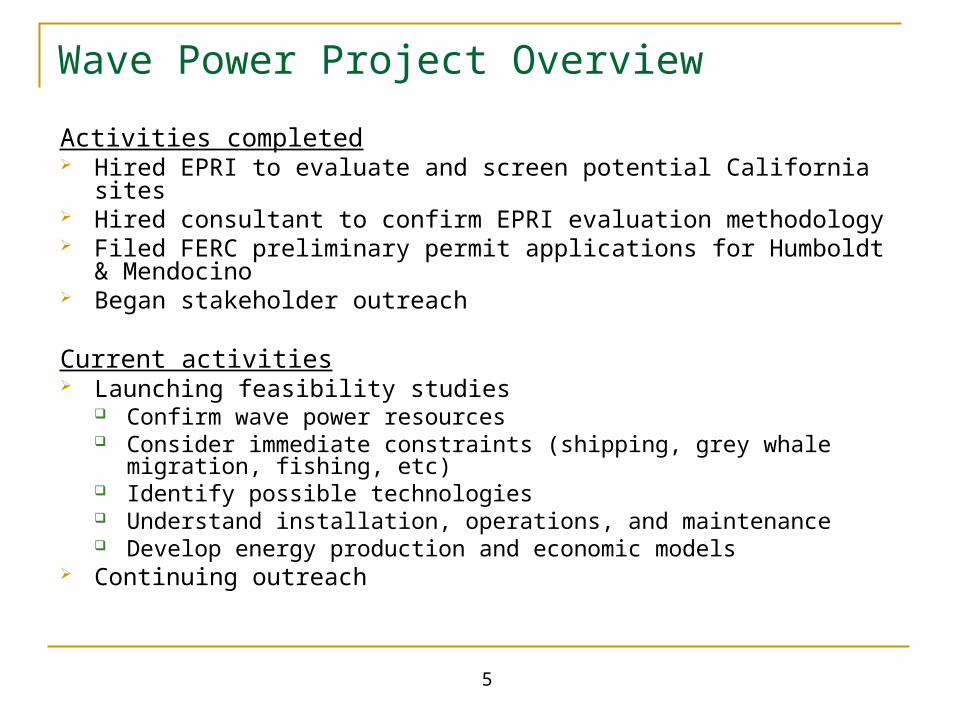
Wave Power Project Overview
Activities completed Hired EPRI to evaluate and screen potential California sites Hired consultant to confirm EPRI evaluation methodology Filed FERC preliminary permit applications for Humboldt & Mendocino Began stakeholder outreach
Current activities Launching feasibility studies
Confirm wave power resources Consider immediate constraints (shipping, grey whale migration, fishing,
etc) Identify possible technologies Understand installation, operations, and maintenance Develop energy production and economic models
Continuing outreach
6
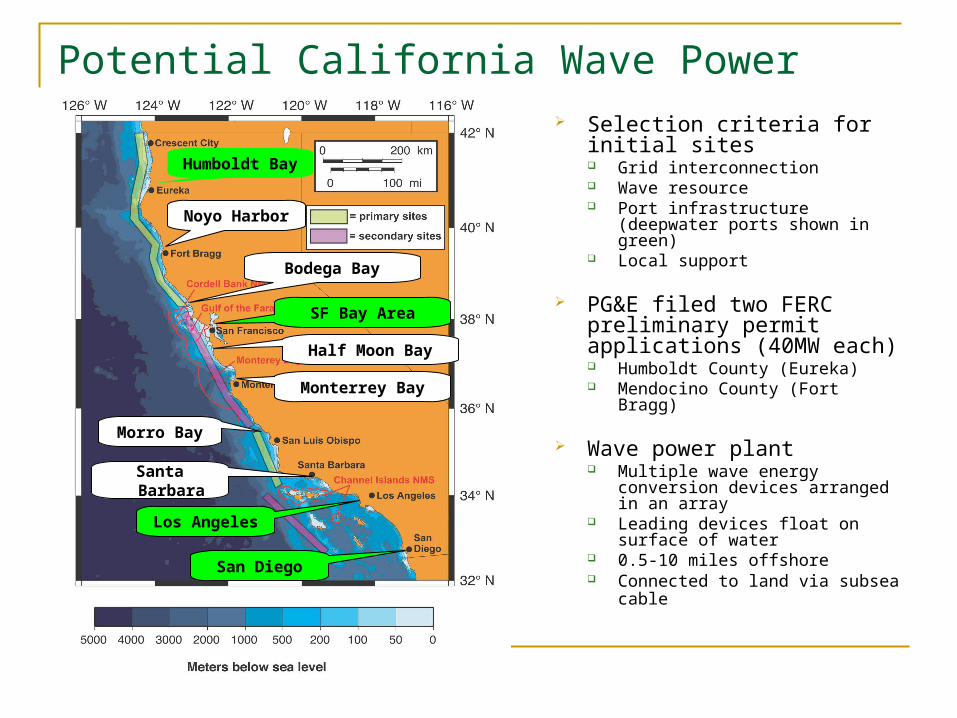
Potential California Wave Power Generation Selection criteria for initial
sites Grid interconnection Wave resource Port infrastructure (deepwater
ports shown in green) Local support
PG&E filed two FERC preliminary permit applications (40MW each) Humboldt County (Eureka) Mendocino County (Fort Bragg)
Wave power plant Multiple wave energy conversion
devices arranged in an array Leading devices float on surface
of water 0.5-10 miles offshore Connected to land via subsea
cable
Humboldt Bay
Noyo Harbor
Bodega Bay
SF Bay Area
Half Moon Bay
Monterrey Bay
Morro Bay
Santa Barbara
Los Angeles
San Diego

7
Mendocino and Humboldt WaveConnect Projects
8
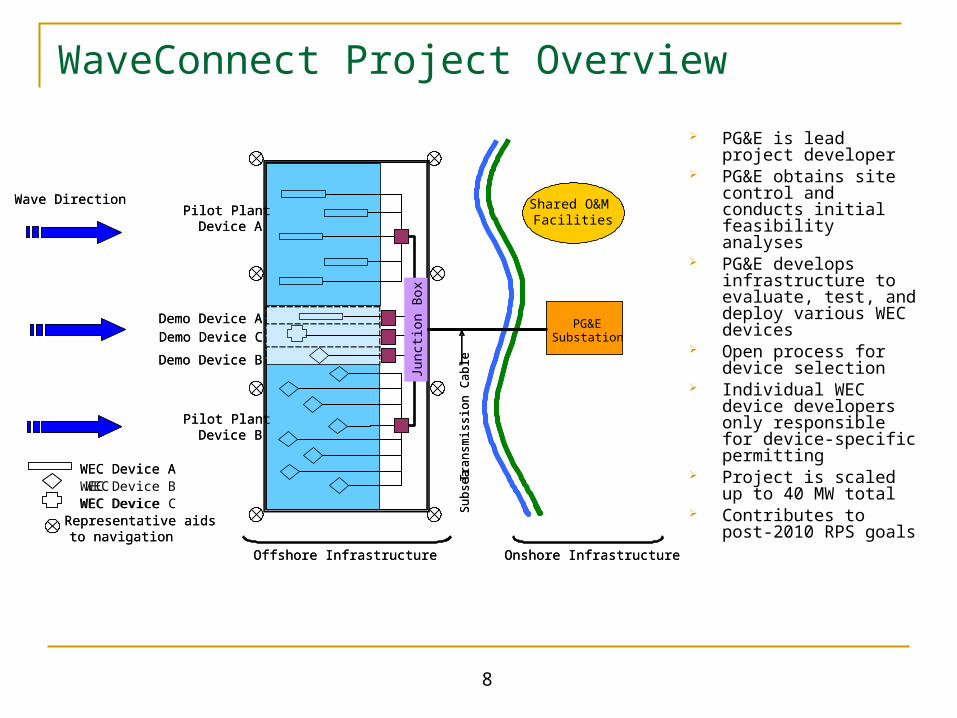
WaveConnect Project Overview
PG&E is lead project developer
PG&E obtains site control and conducts initial feasibility analyses
PG&E develops infrastructure to evaluate, test, and deploy various WEC devices
Open process for device selection
Individual WEC device developers only responsible for device-specific permitting
Project is scaled up to 40 MW total
Contributes to post-2010 RPS goals
PG&ESubstation
Junc
tion
Box
Pilot PlantDevice A
Pilot PlantDevice B
Demo Device A
Demo Device B
Demo Device C
Shared O&M Facilities
Wave Direction
WEC Device A
Offshore Infrastructure Onshore Infrastructure
Representative aids to navigation
Sub
sea
Tra
nsm
issi
on
Ca
ble
WEC Device BWEC Device C
PG&ESubstation
Junc
tion
Box
Pilot PlantDevice A
Pilot PlantDevice B
Demo Device A
Demo Device B
Demo Device C
Shared O&M Facilities
Wave Direction
WEC Device A
Offshore Infrastructure Onshore Infrastructure
Representative aids to navigation
Sub
sea
Tra
nsm
issi
on
Ca
ble
WEC WEC Device
9
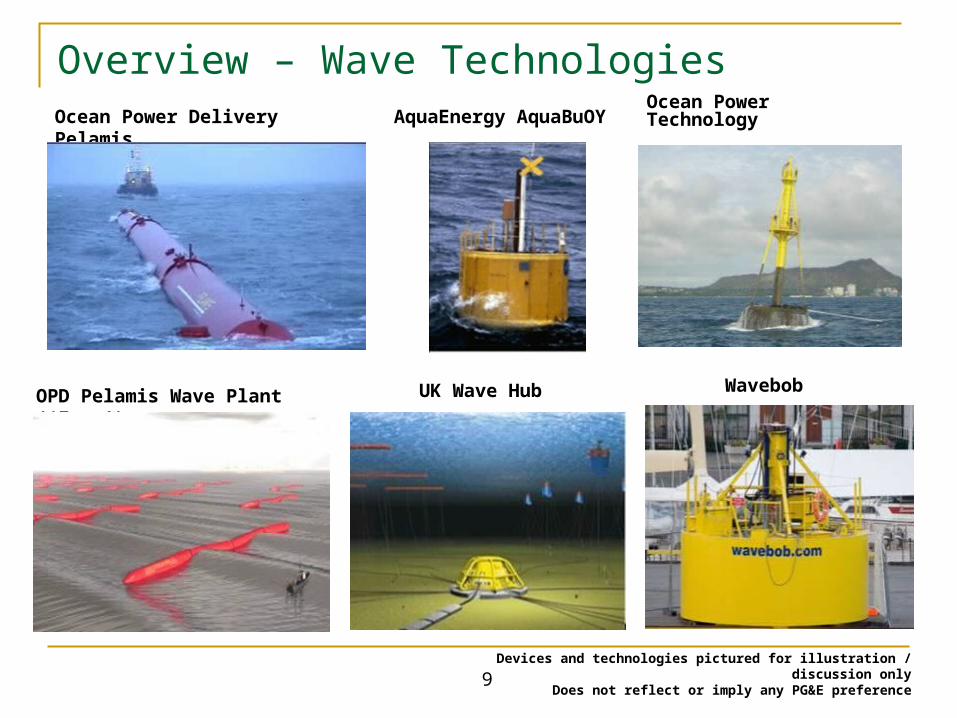
Overview – Wave Technologies
OPD Pelamis Wave Plant (‘Farm’) UK Wave Hub Wavebob
Ocean Power Delivery PelamisOcean Power Technology
PowerBuoy TMAquaEnergy AquaBuOY
Devices and technologies pictured for illustration / discussion only Does not reflect or imply any PG&E preference

10
Tidal Power
11
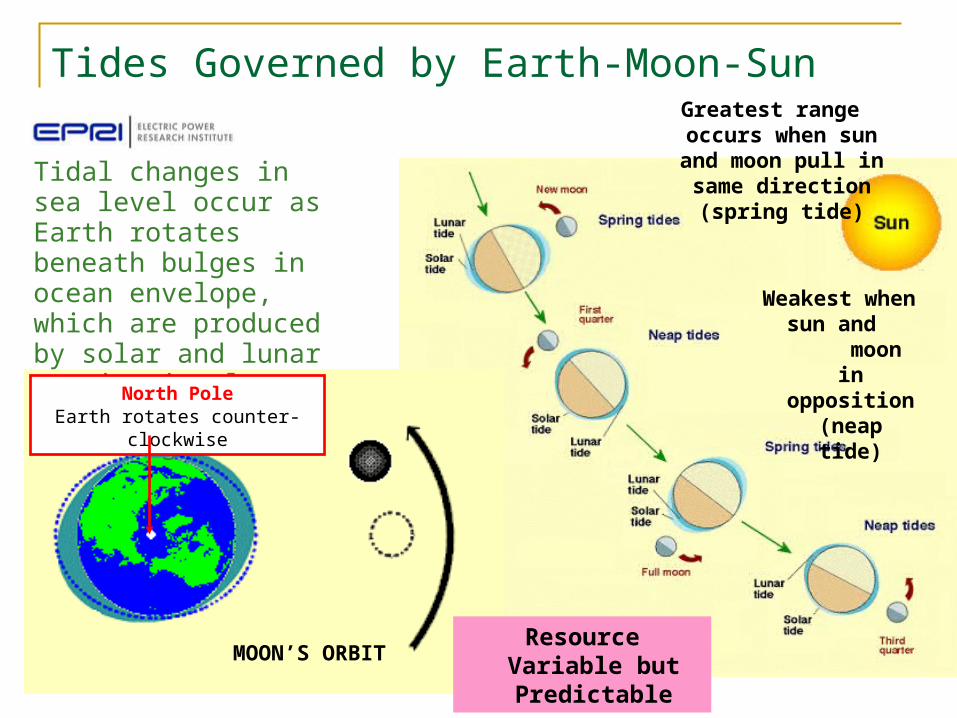
Tides Governed by Earth-Moon-Sun
Tidal changes in sea level occur as Earth rotates beneath bulges in ocean envelope, which are produced by solar and lunar gravitational forces and centrifugal forces
MOON’S ORBIT
North PoleEarth rotates counter-clockwise
Resource Variable but Predictable
Greatest range occurs when sun and moon
pull in same direction (spring tide)
Weakest when sun and
moon in opposition (neap tide)
12
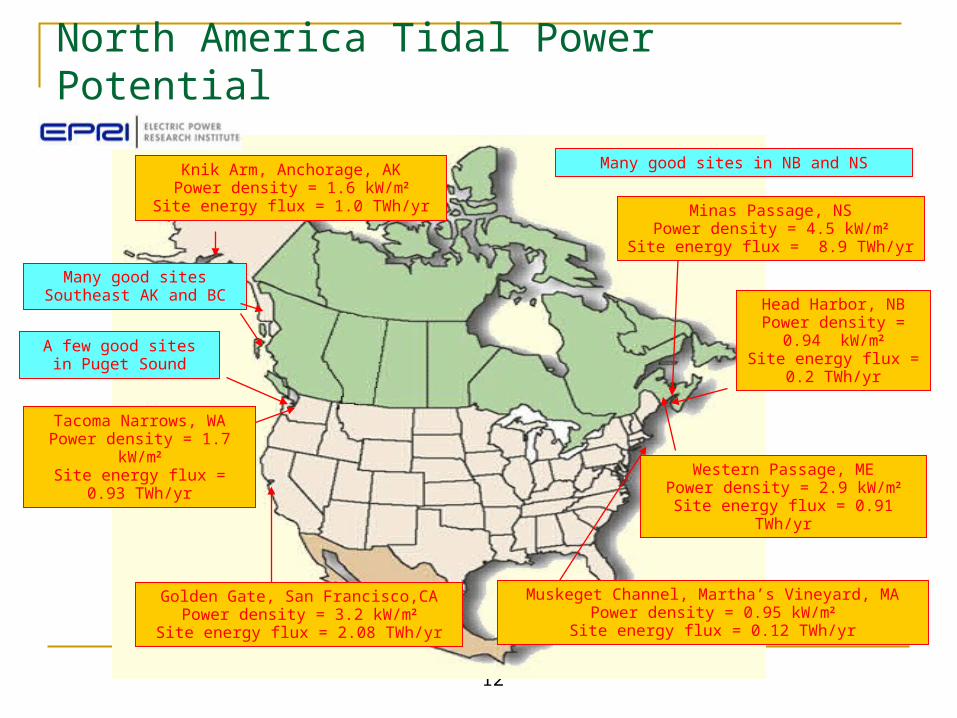
North America Tidal Power Potential
Tacoma Narrows, WAPower density = 1.7 kW/m2
Site energy flux = 0.93 TWh/yr Western Passage, ME
Power density = 2.9 kW/m2
Site energy flux = 0.91 TWh/yr
Muskeget Channel, Martha’s Vineyard, MAPower density = 0.95 kW/m2
Site energy flux = 0.12 TWh/yr
Knik Arm, Anchorage, AKPower density = 1.6 kW/m2
Site energy flux = 1.0 TWh/yr
Golden Gate, San Francisco,CAPower density = 3.2 kW/m2
Site energy flux = 2.08 TWh/yr
Many good sites Southeast AK and BC
Minas Passage, NSPower density = 4.5 kW/m2
Site energy flux = 8.9 TWh/yr
Head Harbor, NBPower density = 0.94
kW/m2
Site energy flux = 0.2 TWh/yr
Many good sites in NB and NS
A few good sites in Puget Sound
13
Tidal Power Overview
What is tidal power? For PG&E, opportunity to extract renewable energy from tidal flows
entering and exiting San Francisco Bay For SF Bay, tidal turbines are most likely technology
Deployed underwater, totally submerged Like wind turbines, multiple turbines are aggregated in ‘farms’ Nascent technology (mostly pre-commercial)
SF Bay has been identified as a high potential site for tidal power
Permitting of wave power plants follows FERC hydropower licensing process Many stakeholders – environmentalists, fishermen, commercial shipping,
etc.
14
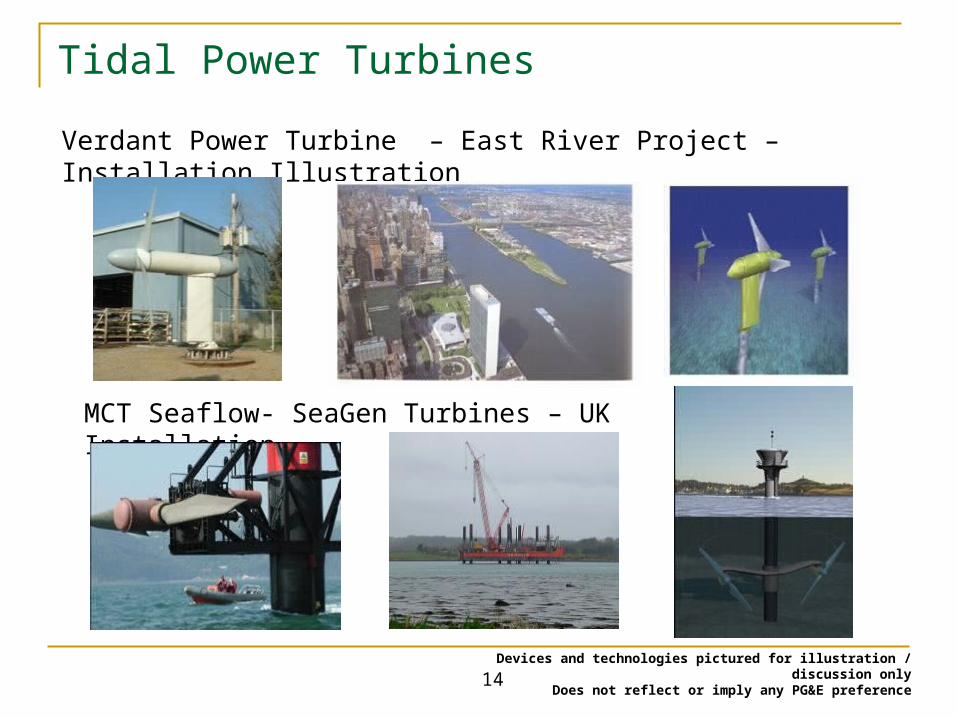
Tidal Power Turbines
Verdant Power Turbine – East River Project – Installation Illustration
MCT Seaflow- SeaGen Turbines – UK Installation
Devices and technologies pictured for illustration / discussion only Does not reflect or imply any PG&E preference
15
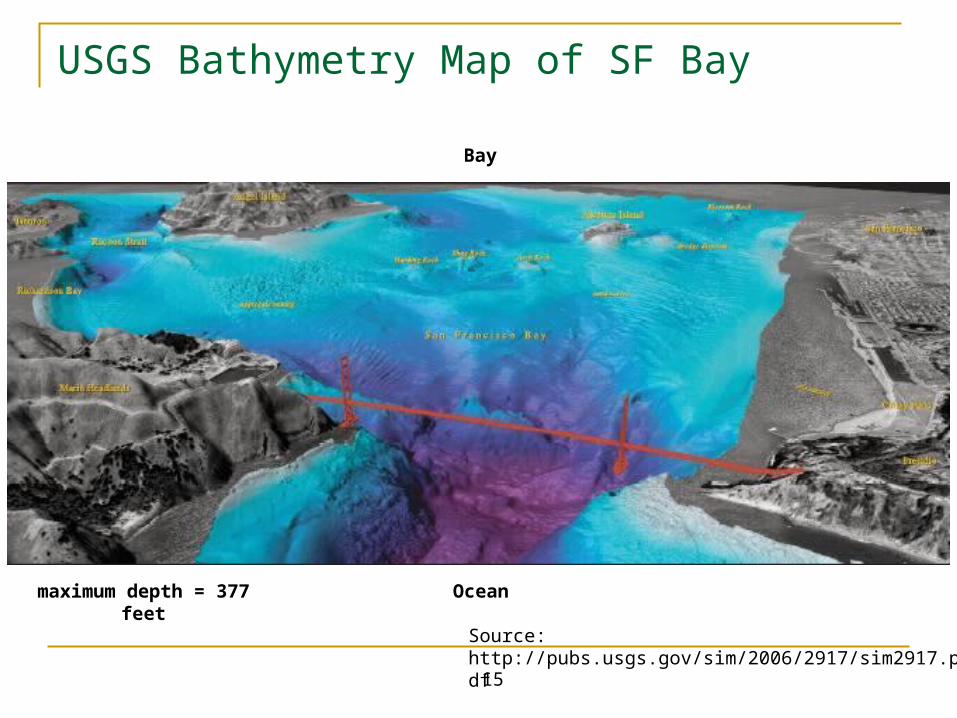
USGS Bathymetry Map of SF Bay
Ocean
Bay
maximum depth = 377 feet
Source: http://pubs.usgs.gov/sim/2006/2917/sim2917.pdf
16
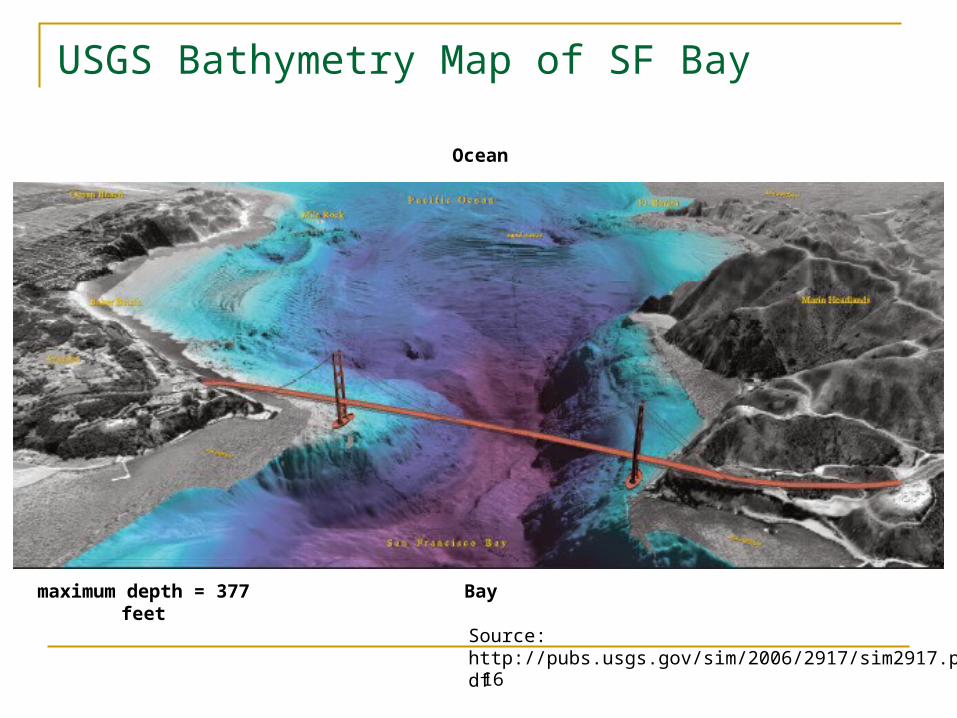
USGS Bathymetry Map of SF Bay
Bay
Ocean
Source: http://pubs.usgs.gov/sim/2006/2917/sim2917.pdf
maximum depth = 377 feet