Project Evaluation Models - US Department of Energy photovoltaics Solar thermal power Ocean current...
32
NREL is a national laboratory of the U.S. Department of Energy, Office of Energy Efficiency and Renewable Energy, operated by the Alliance for Sustainable Energy, LLC. Project Evaluation Models Ian Baring-Gould Alaska Native Village Energy Development Workshop April 30, 2014
Transcript of Project Evaluation Models - US Department of Energy photovoltaics Solar thermal power Ocean current...

NREL is a national laboratory of the U.S. Department of Energy, Office of Energy Efficiency and Renewable Energy, operated by the Alliance for Sustainable Energy, LLC.
Project Evaluation Models
Ian Baring-Gould Alaska Native Village Energy Development Workshop
April 30, 2014

2
Why do we need options analysis?

3
There are many different energy resources Which ones are available in Alaska?
4
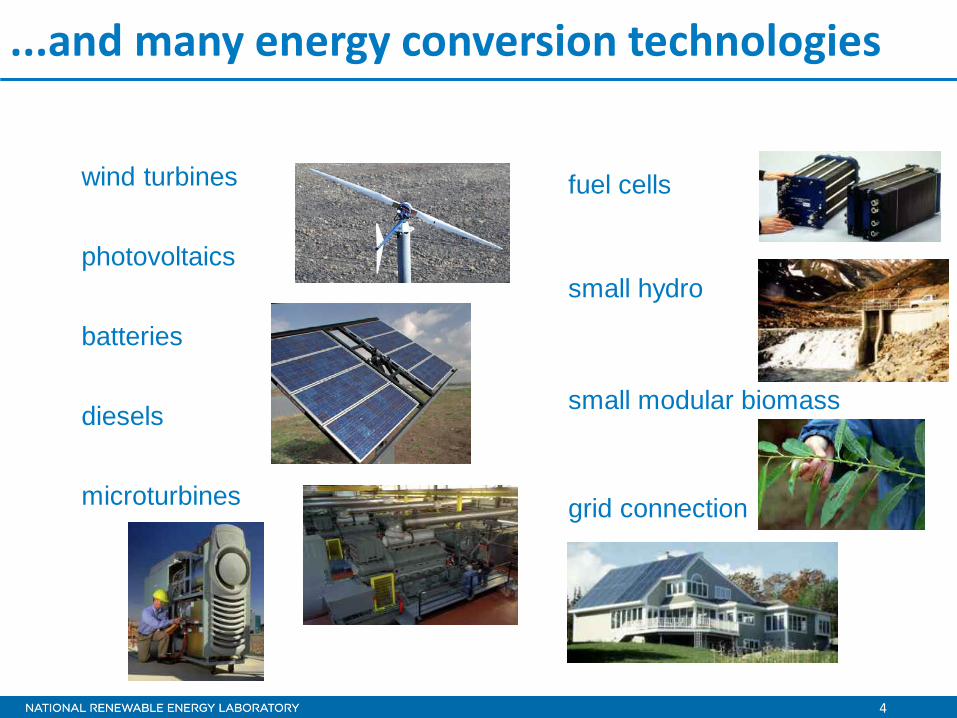
photovoltaics
fuel cells wind turbines
batteries
diesels
microturbines
small hydro
small modular biomass
grid connection
...and many energy conversion technologies

5
…which have different operating requirements, advantages, disadvantages, costs, etc.
Diesel generators
Wind turbines
Solar PV
Biomass generators
Dispatchable, significant maintenance, fuel supply issues and costs
Not dispatchable, maintenance
requirements, variability of power Not dispatchable, low maintenance, very
seasonal
Dispatchable, varying maintenance
requirements, fuel supply issues
Different technology combinations require different additional equipment to insure reliability including
different storage options, power converters, synchronous condensers, etc.

6
These components can be combined in a variety of ways
From a techno-economic standpoint, the most effective technology choice & system configuration generally depends on:
o Available energy resources o Energy demand characteristics (load size,
composition, reliability requirements, etc.) o The ability to provide long term service to the
energy choices selected

7
So the question is...
What technologies should be used, in what quantities, and in what combinations?
This is what we call
“Rural Energy Options Analysis”

8
Options Analysis Helps Answer Questions & Guide Decision-making
• Questions about markets, policies, and impacts
(“policy analysis”) • Questions about system costs and performance
(“project analysis”)
Different applications often imply different options analysis methods

9
• Simple online tool for non-experts needing basic solar performance estimation
• Used extensively by solar installers to qualify for subsidies
• SolarCity, Sunrun, etc. use PVWatts
• One of NREL’s most heavily trafficked websites
• Currently under development for both improved interface and improved accuracy
9
PVWatts

10
System Advisor Model
National Renewable Energy Laboratory Innovation for Our Energy Future
These calculations are done using detailed performance models, a detailed cash flow finance model, and a library of reasonable default values for each technology and target market. Technologies SAM can model: - Photovoltaics (Flat plate, CPV) - Solar Water Heating - Concentrating Solar Power
(Trough, Tower, Linear Fresnel, Dish Stirling)
- Geothermal - Wind (Small + Utility scale) - Biomass Power
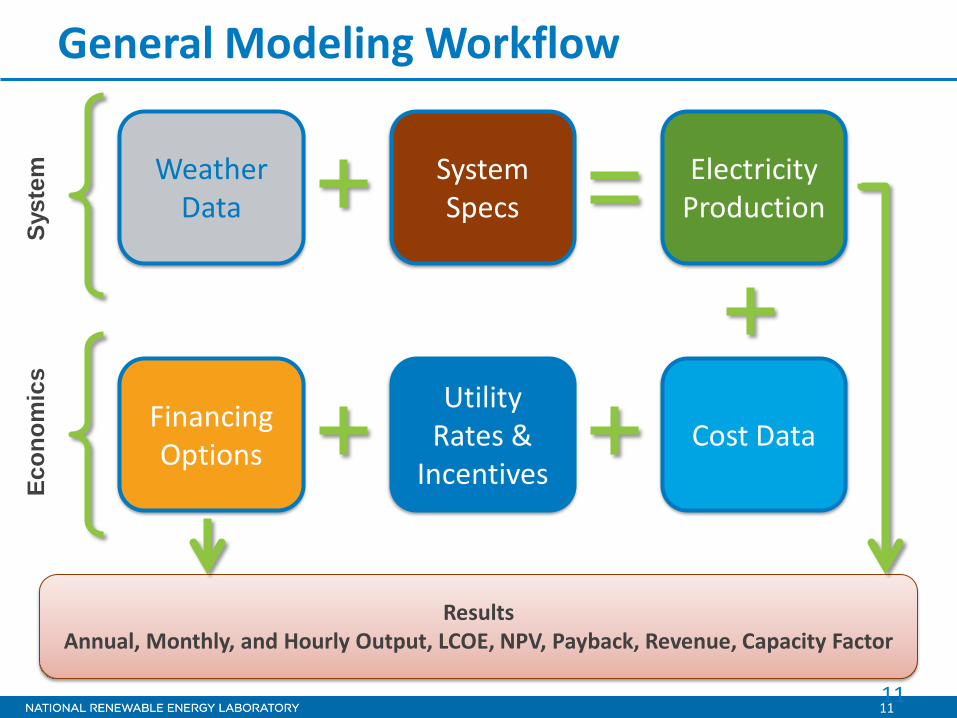
The System Advisor Model (SAM) is a free user-friendly computer program that calculates a renewable energy system’s hourly energy output over a single year, and calculates the cost of energy for a renewable energy project over the life of the project.
Weather Data
System Specs
Energy Production Cost Data
Financing Options
Utility Rates &
Incentives + » + + + »
Annual, Monthly, and Hourly Output,
LCOE, NPV, Payback, Revenue,
Capacity Factor
11
General Modeling Workflow
11
Weather Data
System Specs
Electricity Production
Cost Data Financing Options
Results Annual, Monthly, and Hourly Output, LCOE, NPV, Payback, Revenue, Capacity Factor
Syst
em
Econ
omic
s
Utility Rates &
Incentives

12 12
Technologies in SAM
Photovoltaics Concentrating PV Solar Water Heating Geothermal
Dish-Stirling Linear Fresnel Power Tower Parabolic Trough
Small Wind Utility-scale Wind Biomass Power Conventional
13
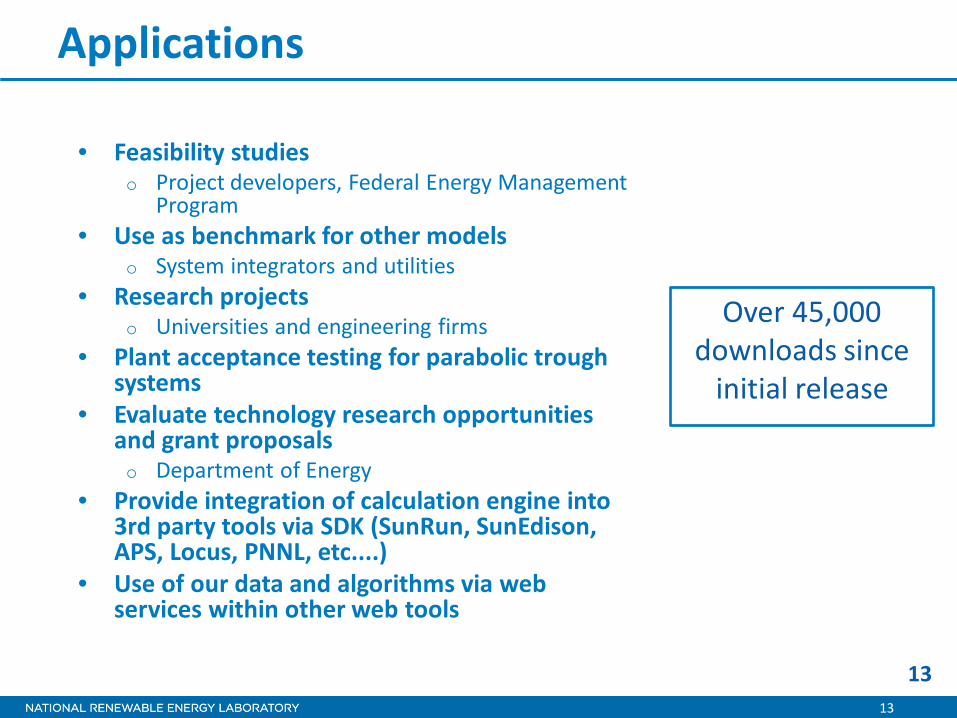
Applications
• Feasibility studies o Project developers, Federal Energy Management
Program • Use as benchmark for other models
o System integrators and utilities • Research projects
o Universities and engineering firms • Plant acceptance testing for parabolic trough
systems • Evaluate technology research opportunities
and grant proposals o Department of Energy
• Provide integration of calculation engine into 3rd party tools via SDK (SunRun, SunEdison, APS, Locus, PNNL, etc....)
• Use of our data and algorithms via web services within other web tools
13
Over 45,000 downloads since
initial release

14
Integrated Expertise and Capabilities enabled at NREL
SAM Engine
Solar Prospector Resource Data Service
DOE-funded Utility Rate Database
Sandia/CEC PV Module and Inverter Databases
Impacted by new data and algorithms from other PV/CSP
projects
Default Costs through latest published Data and Experts (Al Goodrich)
Current best-in-class PV and CSP models
Current best-in-class public finance models
DOE-funded DSIRE Incentive web service
Conferences, Journal Articles, Tech. Reports, Documentation
Engine available to Programmers (SDK)
SAM Desktop Software Application (Windows and Mac)
Web Services (generally PVWatts)
Underpinnings for updated PVWatts Online Application
15
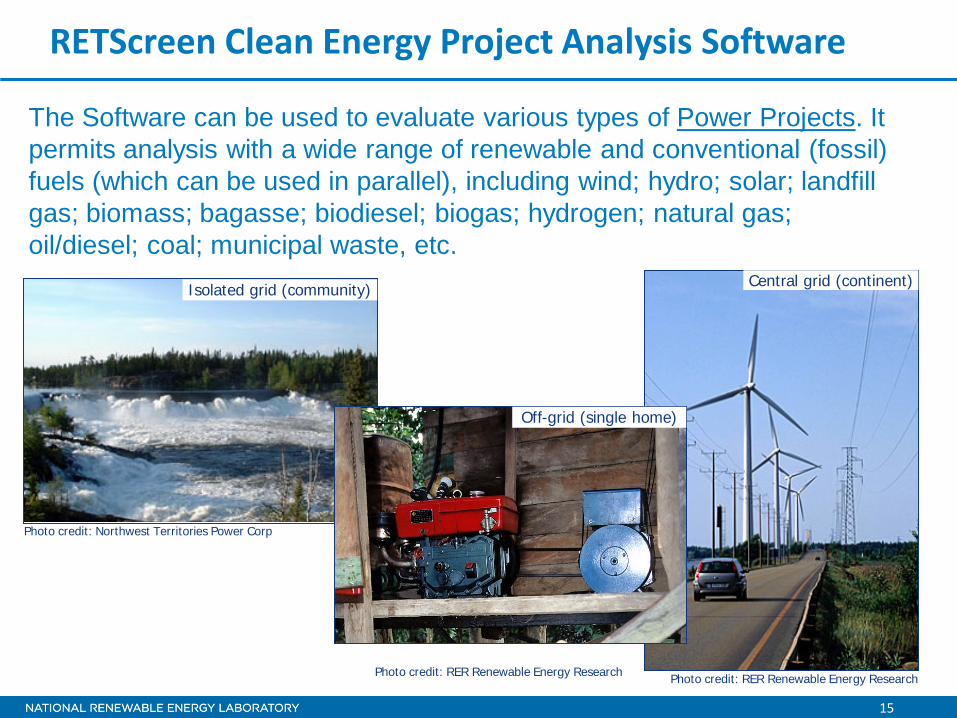
RETScreen Clean Energy Project Analysis Software
Photo credit: Northwest Territories Power Corp
Isolated grid (community)
Photo credit: RER Renewable Energy Research Photo credit: RER Renewable Energy Research
Central grid (continent)
The Software can be used to evaluate various types of Power Projects. It permits analysis with a wide range of renewable and conventional (fossil) fuels (which can be used in parallel), including wind; hydro; solar; landfill gas; biomass; bagasse; biodiesel; biogas; hydrogen; natural gas; oil/diesel; coal; municipal waste, etc.
Off-grid (single home)

16
RETScreen Technologies Renewable Technologies Wind turbines Hydroelectric Geothermal power Solar photovoltaics Solar thermal power Ocean current power Tidal power Wave power
Conventional Combustion Technologies Steam turbine Gas turbine Gas turbine - Combined
cycle Reciprocating engine
Other technologies Fuel cells Microturbines
Photo credit: RER Renewable Energy Research
On-grid PV, Bavaria, Germany

17
Fuels and System Types
Combustible Fuels Fossil fuels: coal, diesel,
natural gas, propane, oil, etc. Biomass: bio-diesel, ethanol,
bagasse, wood, bark, coconut fibre, straw, hemp, peat, willow, switch grass, etc.
Waste: tires, landfill gas, food waste, forest residue, coffee refuse, Christmas trees, poultry litter, packaging waste, etc.
Hydrogen Renewable Energy “Fuels” Sunshine, wind, waves, tides,
geothermal, water, etc.
For small power system technologies

18
Power Projects with RETScreen Analysis steps: • Base case load and power system
characteristics (for off-grid systems and internal loads)
• Proposed case power system characteristics (energy + costs)
• Operating strategy • Summary (energy) • Emission analysis • Financial analysis (including sensitivity
and risk analysis) Project Types: • Choose technology (steam turbine,
geothermal, photovoltaic, wind, etc.) • Power-Multiple Technologies • Other project types: o Heating & Power o Cooling & Power o Heating, Cooling & Power o Project types unrelated to power
19
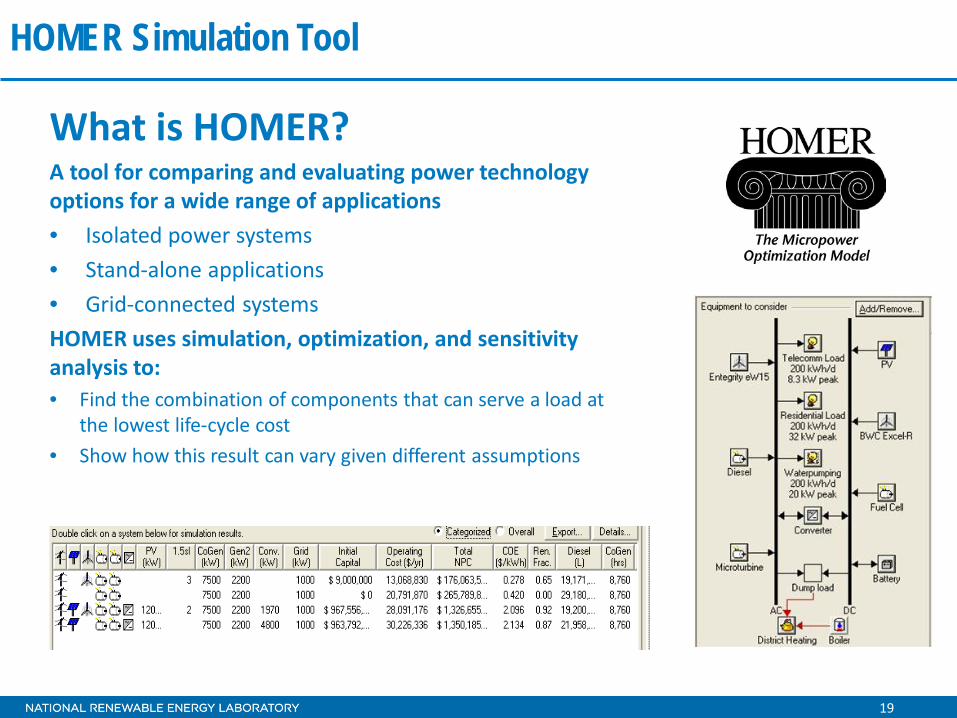
What is HOMER? A tool for comparing and evaluating power technology options for a wide range of applications • Isolated power systems • Stand-alone applications • Grid-connected systems HOMER uses simulation, optimization, and sensitivity analysis to: • Find the combination of components that can serve a load at
the lowest life-cycle cost • Show how this result can vary given different assumptions
HOMER Simulation Tool

20
HOMER Simulation Results • Cost of a particular system configuration • Performance of a system • Sensitivity analysis displayed as graphs Questions that HOMER can answer • Purchase wind turbine, PV array, or both? • Will design meet growing demand? • How big should my battery bank be? • What if the fuel price changes? • How should I operate my system? • And many others…
HOMER Simulation Tool – Results

21
Load Profile • Simulates hour-by hour operation of the system and
load profile to evaluate its performance and lowest cost of energy
• Uses hourly resource data for wind and solar Renewable Energy Options • Models existing generation (Grid, backup
generators, Cogeneration) – fuels include biogas, diesel, gasoline, propane
• PV- Capacities (kW) and operational maintenance • Wind Turbines – Capacities (kW) • Hydro generation • Batteries, pumped hydro Simulation Results • Results include all combinations of system
configuration • Monthly or hourly fuel use, output and runtime • % of renewable energy used in the system
configuration
HOMER Simulation Tool - Data Inputs
Lanai LoadPeak Day (December 27, 2006)
0
1
2
3
4
5
6
1 2 3 4 5 6 7 8 9 10 11 12 13 14 15 16 17 18 19 20 21 22 23 24 25
Hour
Pow
er (M
W)
Peak Load of 5.4MW

22
Simulate a system design • HOMER optimizes the system design by
simulating the various configurations of RE.
• HOMER ranks the feasible system configuration according to total net present cost.
Sensitivity Analysis • Explore the effects of uncertainty or
changes in one or more input variables. • Compare various PV system with the
variable cost of natural gas. Indicates when PV system is more cost effective
Backup Analysis • Using the hourly solar resource data
and hourly load to analyze hybrid system to determine how many days of poor solar resource would require grid or backup generation. Details of cost required to meet the backup load if grid goes down
HOMER Simulation Tool (Overview)
Using actual solar and load data, HOMER analyzes how many bad solar days forces the need for a generator

23
Hybrid2 Simulation Software
A simulation tool designed to accurately predict long term performance of a
wide variety of power systems made up of conventional fuel generators, wind generators, photovoltaics and battery storage

24
Alaska Energy Financial Model • Simple financial model
for Alaskan isolated power systems
• Spreadsheet model with open architecture (go Inside the box)
• Wind, Diesel and other energy options
• Electric and Thermal options
• Use performance data from other tools
• Allows calculation of: • Internal Rate of
Return • Power Price • Payback Period
• Beta version – really looking for feedback

25
Jobs & Economic Impacts from the JEDI Model Economic Impact of Energy Projects
26
JEDI Model Availability • Current JEDI models
o Utility-scale wind o Natural gas (combined cycle) o Coal (pulverized coal) o Marine and hydrokinetic o Concentrating solar power o Dry mill corn ethanol o Lignocellulosic ethanol o Photovoltaic.
• JEDI models under development o Hydropower (conventional) o Natural gas (combined cycle) o Offshore wind & small wind o Transmission o Geothermal o Biopower o Petroleum.
Phot
o fr
om S
ally
Wrig
ht, R
enew
able
Ene
rgy
Rese
arch
Lab
- U
mas
s, N
REL/
PIX1
5160
27
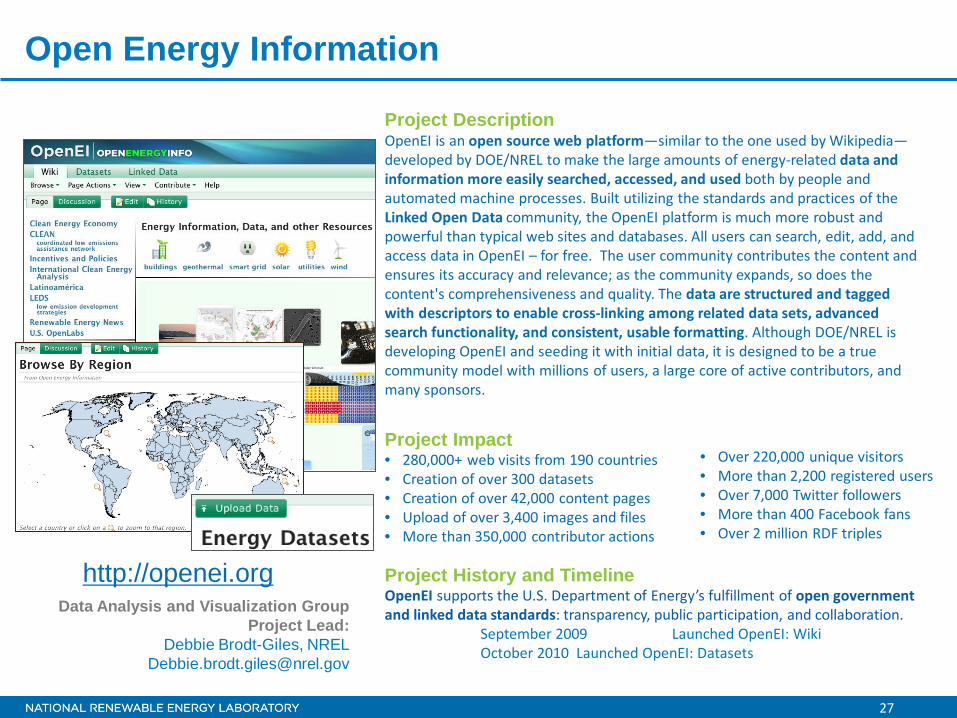
Project Description OpenEI is an open source web platform—similar to the one used by Wikipedia—developed by DOE/NREL to make the large amounts of energy-related data and information more easily searched, accessed, and used both by people and automated machine processes. Built utilizing the standards and practices of the Linked Open Data community, the OpenEI platform is much more robust and powerful than typical web sites and databases. All users can search, edit, add, and access data in OpenEI – for free. The user community contributes the content and ensures its accuracy and relevance; as the community expands, so does the content's comprehensiveness and quality. The data are structured and tagged with descriptors to enable cross-linking among related data sets, advanced search functionality, and consistent, usable formatting. Although DOE/NREL is developing OpenEI and seeding it with initial data, it is designed to be a true community model with millions of users, a large core of active contributors, and many sponsors.
Project Impact • 280,000+ web visits from 190 countries • Creation of over 300 datasets • Creation of over 42,000 content pages • Upload of over 3,400 images and files • More than 350,000 contributor actions
• Over 220,000 unique visitors • More than 2,200 registered users • Over 7,000 Twitter followers • More than 400 Facebook fans • Over 2 million RDF triples
Project History and Timeline OpenEI supports the U.S. Department of Energy’s fulfillment of open government and linked data standards: transparency, public participation, and collaboration. September 2009 Launched OpenEI: Wiki October 2010 Launched OpenEI: Datasets
Data Analysis and Visualization Group Project Lead:
Debbie Brodt-Giles, NREL [email protected]
Open Energy Information
http://openei.org

28
NREL Tools Links Map Apps at NREL http://maps.nrel.gov MapSearch http://www.nrel.gov/gis/mapsearch/ REAtlas http://maps.nrel.gov/reatlas IMBY http://mercator.nrel.gov/imby HyDRA http://maps.nrel.gov/hydra BioFuels Atlas http://maps.nrel.gov/biomass BioPower Atlas http://http://rpm.nrel.gov/biopower/biopower/launch Solar Prospector http://maps.nrel.gov/prospector Wind Prospector http://maps.nrel.gov/wind_prospector PVDAQ http://maps.nrel.gov/pvdaq LCOE Calculator http://www.nrel.gov/analysis/tech_lcoe.html GeoREServ API http://rpm.nrel.gov/docs/georeserv/ REEDS http://www.nrel.gov/analysis/reeds/ PV JEDI http://www.nrel.gov/analysis/jedi/ Open Energy Info http://openei.org Smartgrid.gov http://smartgrid.gov

NREL is a national laboratory of the U.S. Department of Energy, Office of Energy Efficiency and Renewable Energy, operated by the Alliance for Sustainable Energy, LLC.
E. Ian Baring-Gould Technology Deployment Manager
National Wind Technology Center & Deployment and Industrial Partnerships
303-384-7021
30
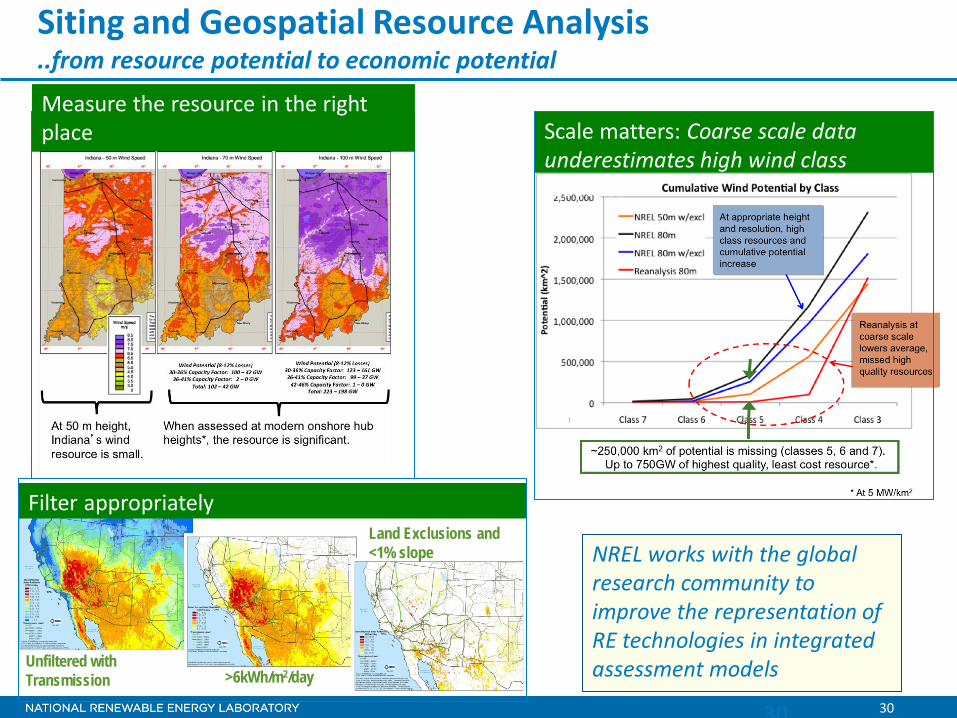
Siting and Geospatial Resource Analysis ..from resource potential to economic potential
Unfiltered with Transmission >6kWh/m2/day
Land Exclusions and <1% slope
Measure the resource in the right place
Scale matters: Coarse scale data underestimates high wind class resource
Filter appropriately
NREL works with the global research community to improve the representation of RE technologies in integrated assessment models
30
31
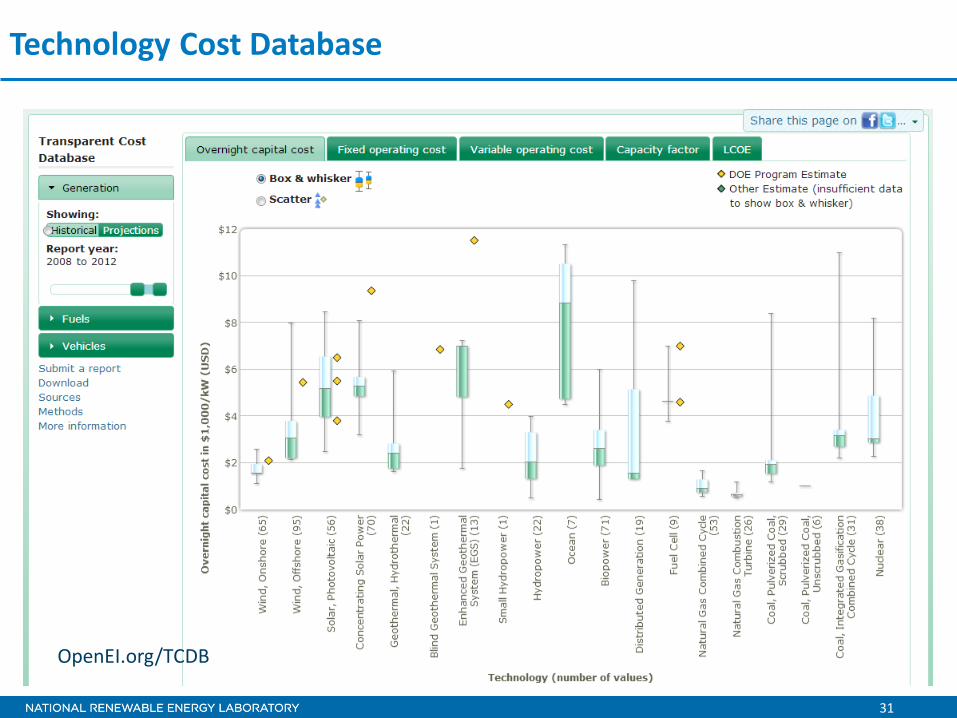
Technology Cost Database
OpenEI.org/TCDB

32
Renewable Energy Data Book
U.S. RE Capacity as % of Total Generating Capacity 2011 U.S. Nameplate Electricity Capacity and Generation
Top States for RE Installed Capacity Top Countries for Installed Renewable Generation