SPECIAL SENSES SMELL, TASTE, AND HEARINGSMELL, TASTE, AND HEARING.
Upload
gertrude-mcdanielCategory
view
213download
0
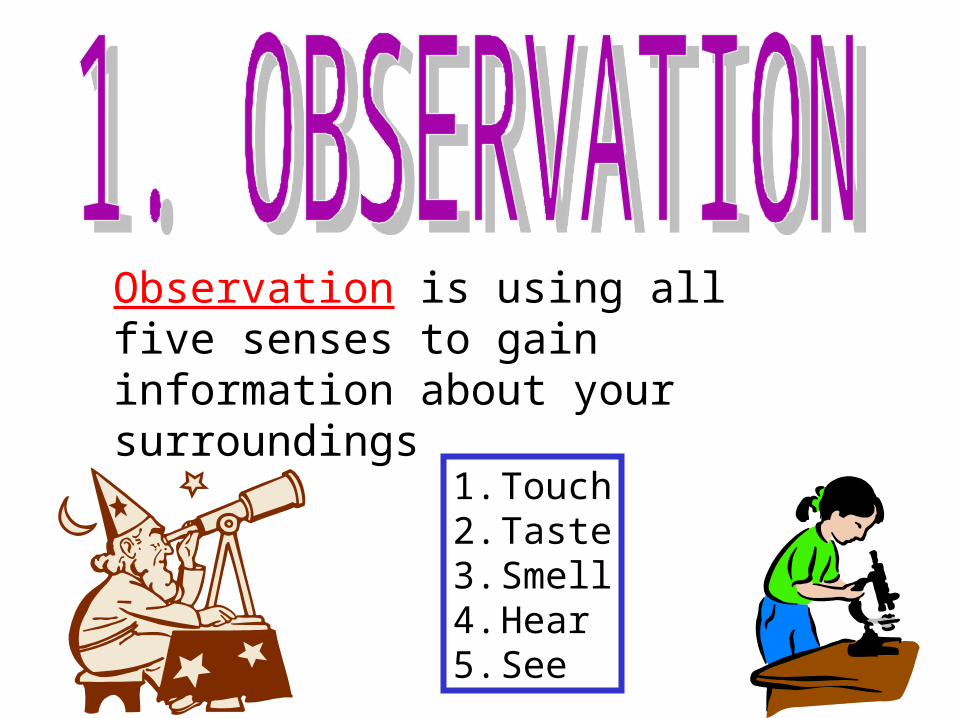
Observation is using all five senses to gain information about your surroundings
1. Touch2. Taste3. Smell4. Hear5. See
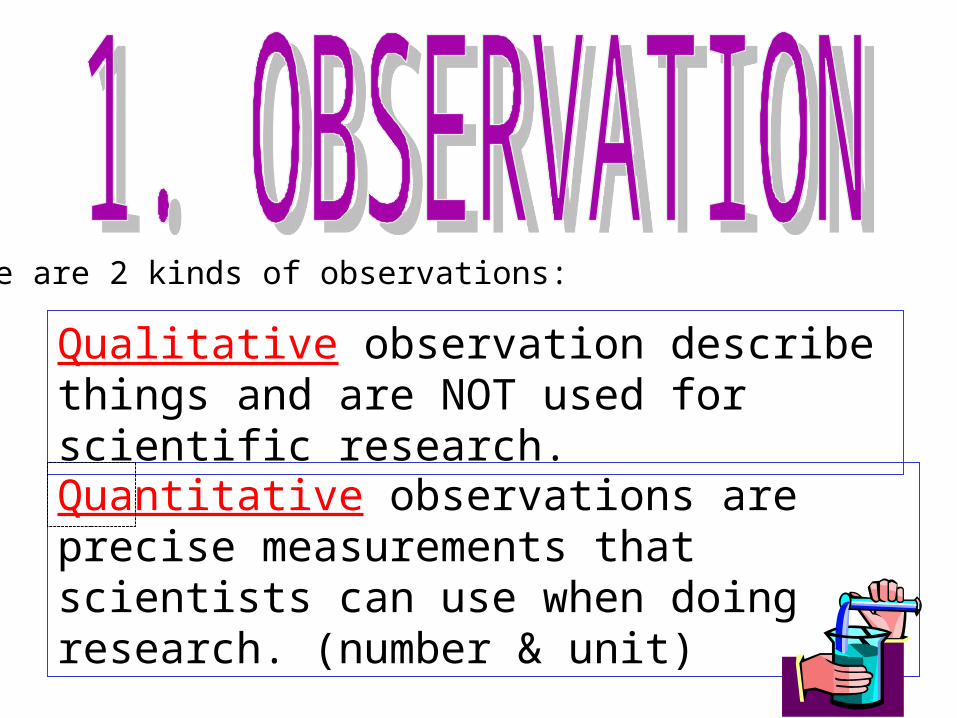
There are 2 kinds of observations:
Qualitative observation describe things and are NOT used for scientific research.Quantitative observations are precise measurements that scientists can use when doing research. (number & unit)
Scientists around the world use a quantitative system of measurement called the international system (SI) or the metric system. Scientists can communicate information to anyone in the world using this system.
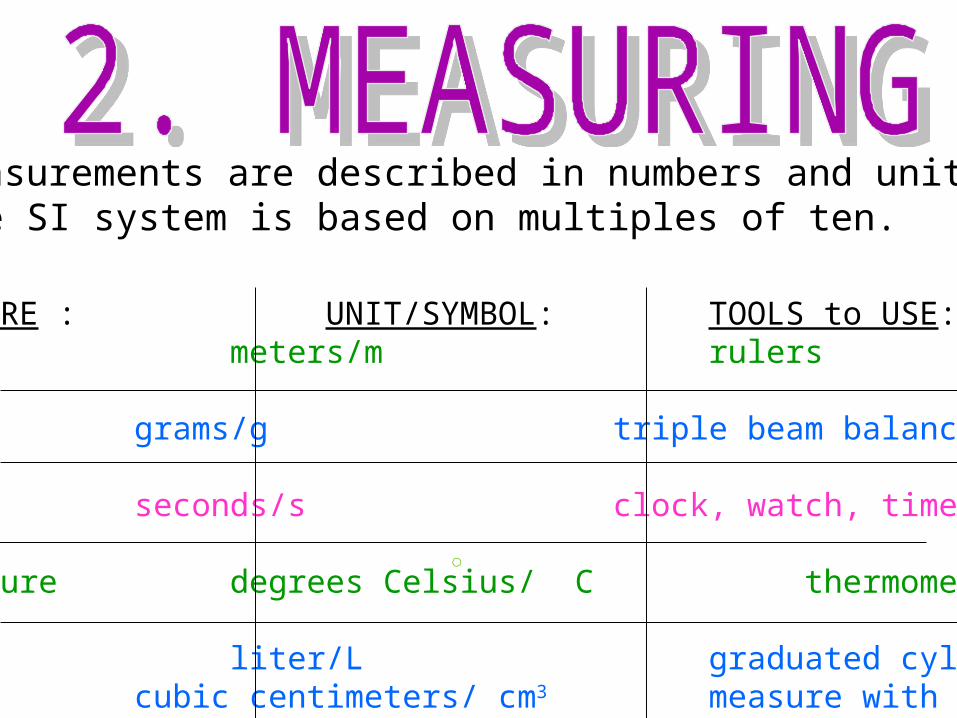
•Measurements are described in numbers and units.•The SI system is based on multiples of ten.
TO MEASURE : UNIT/SYMBOL: TOOLS to USE:Length meters/m rulers
Mass grams/g triple beam balance
Time seconds/s clock, watch, timer
Temperature degrees Celsius/ C thermometer
Volume liter/L graduated cylindercubic centimeters/ cm3 measure with ruler
Inference- to draw a conclusion based on the facts learned from an observation.
Scientists make observations and develop a problem or question. Then, scientists design experiments to gain information about the problem or question.

A scientists must begin an experiment with a plan. First, the scientist must make decisions about VARIABLES. 3 Kinds of Variables :1)Independent Variable (Manipulated
Variable)- the variable that the scientist purposely changes (ONLY ONE of these)
2)Dependent Variable (Responding Variable)- the variable that responds in an experiment; the scientist can’t control this variable (what the scientist measures)
3)Constants (controlled variables)- factors that must be the same in both groups
The scientist must identify the control group and the experimental groups for the experiment.
Control Group- •group in the experiment where everything is natural or unchanged as possible•There will be only ONE of these (or there may be no control group at all.)
Experimental Group-•Group in the experiment that has a single factor changed•There can be more than one of these groups
Leticia timed how fast apple slices turned brown after being dipped in different preservatives, such as lemon juice, fruit freshener, and lime soda.
Title: How do preservatives affect how fast apple slices turn brown?
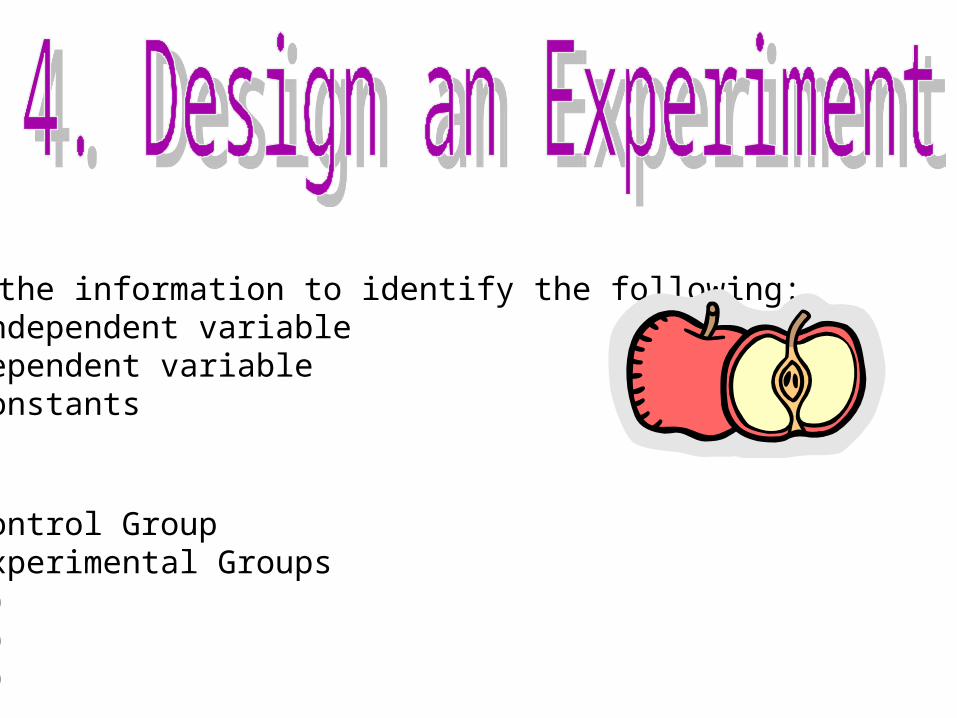
Use the information to identify the following:• Independent variable• Dependent variable• Constants
• Control Group• Experimental Groups
1) 2)3)
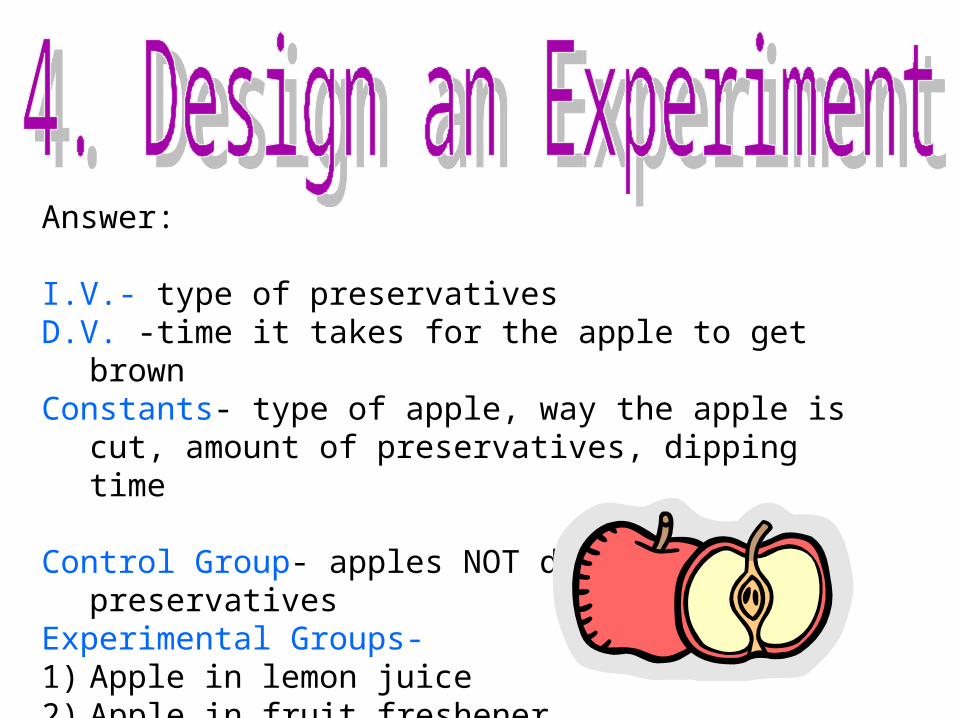
Answer:
I.V.- type of preservativesD.V. -time it takes for the apple to get brownConstants- type of apple, way the apple is cut,
amount of preservatives, dipping time
Control Group- apples NOT dipped in any preservatives
Experimental Groups-1) Apple in lemon juice2) Apple in fruit freshener3) Apple in lime soda
Before the scientists actually does an experiment, he/she must write a hypothesis.Hypothesis- a statement about the predicted relationship between the independent variable and the dependent variable.
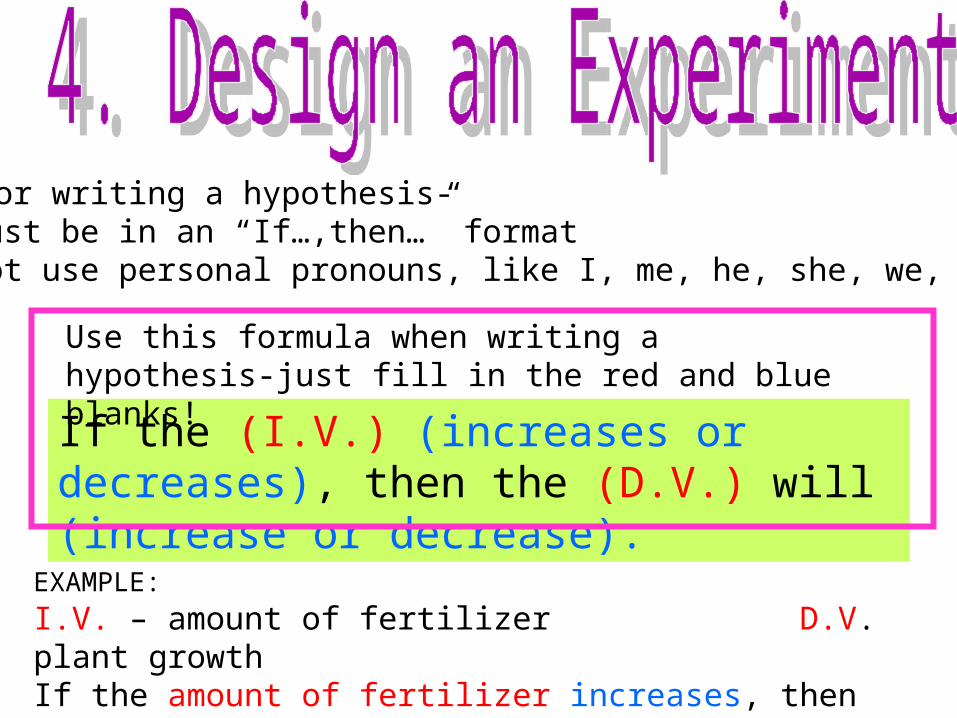
Rules for writing a hypothesis-1) It must be in an “If…,then…” format2) Do not use personal pronouns, like I, me, he, she, we, us, them…
If the (I.V.) (increases or decreases), then the (D.V.) will (increase or decrease).
EXAMPLE: I.V. – amount of fertilizer D.V. plant growthIf the amount of fertilizer increases, then the plant growth will increase.
Use this formula when writing a hypothesis-just fill in the red and blue blanks!
Repeated Trials are done to make sure that the results of an experiment are as accurate as possible. Doing many trials ensures that the results are NOT because of an error or mistake.

HOMEWORK: Fill out another experimental design diagram using the following experiment:
Title: How does the length of the paper helicopter blade affect the rotational speed of the blades?
A title is written as a question.
HOMEWORK: Fill out another experimental design diagram using the following experiment:Write the title on your blank experimental design diagram.
Title: How does the height of a container’s sides affect the time for liquid to evaporate?
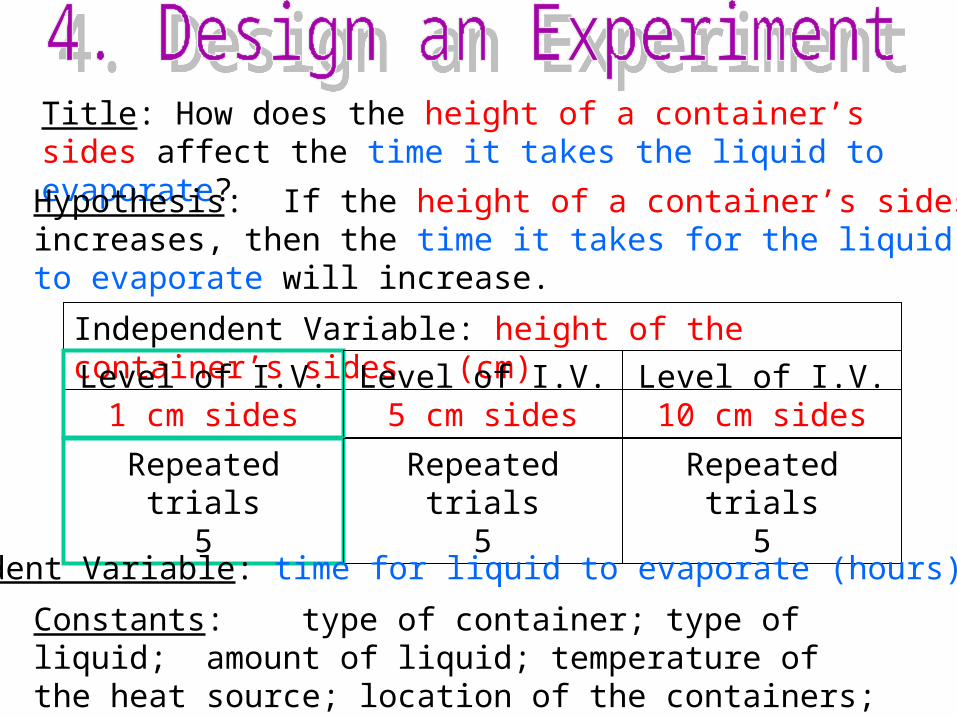
Title: How does the height of a container’s sides affect the time it takes the liquid to evaporate?
Hypothesis: If the height of a container’s sides increases, then the time it takes for the liquid to evaporate will increase.
Independent Variable: height of the container’s sides (cm) Level of I.V.
1 cm sidesLevel of I.V.5 cm sides
Level of I.V.10 cm sides
Repeated trials5
Repeated trials5
Repeated trials5
Dependent Variable: time for liquid to evaporate (hours)
Constants: type of container; type of liquid; amount of liquid; temperature of the heat source; location of the containers; starting time
HOMEWORK: Fill out another experimental design diagram using the following experiment:Write the title on your blank experimental design diagram.
Title: How does the height of a ramp affect the distance a toy car will move?
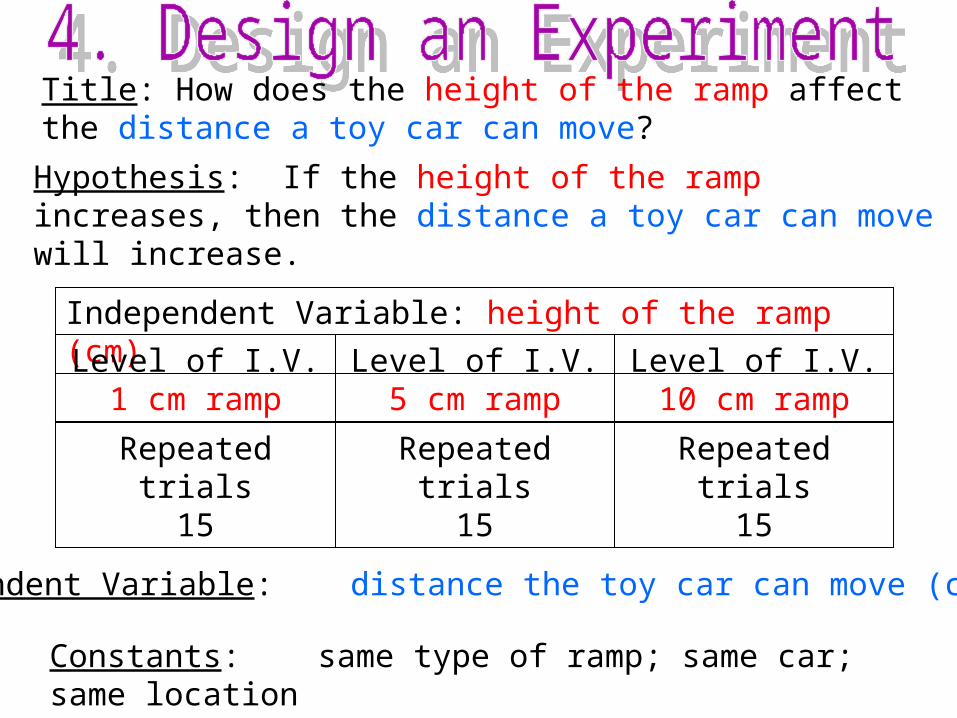
Title: How does the height of the ramp affect the distance a toy car can move?
Hypothesis: If the height of the ramp increases, then the distance a toy car can move will increase.
Independent Variable: height of the ramp (cm) Level of I.V.
1 cm rampLevel of I.V.5 cm ramp
Level of I.V.10 cm ramp
Repeated trials15
Repeated trials15
Repeated trials15
Dependent Variable: distance the toy car can move (cm)
Constants: same type of ramp; same car; same location
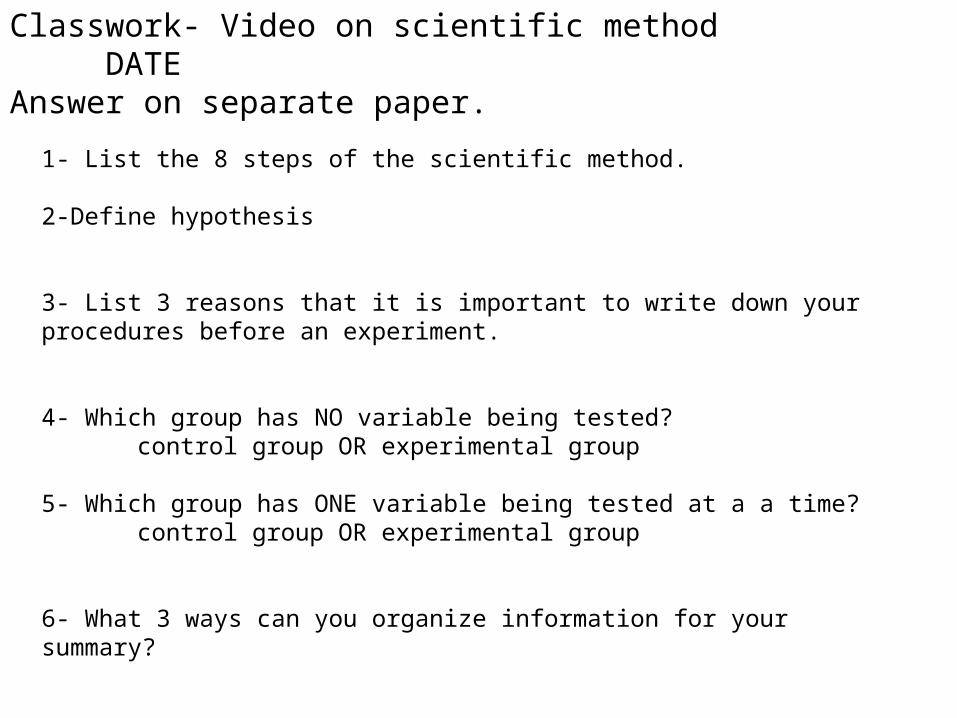
Classwork- Video on scientific method DATEAnswer on separate paper.
1- List the 8 steps of the scientific method.
2-Define hypothesis
3- List 3 reasons that it is important to write down your procedures before an experiment.
4- Which group has NO variable being tested?control group OR experimental group
5- Which group has ONE variable being tested at a a time?control group OR experimental group
6- What 3 ways can you organize information for your summary?
7- What do you do in the conclusion?
•Organizing data from experiments into data tables helps scientists better understand their results.
•A scientist must design a data table to use during the course of the experiment to record measurements of the DEPENDENT VARIABLE.
•There is usually an area on the data table to record the average of the repeated trials. The average is calculated after ALL data has been gathered and recorded.
•The data will be used to make a graph to illustrate the findings of the experiment.
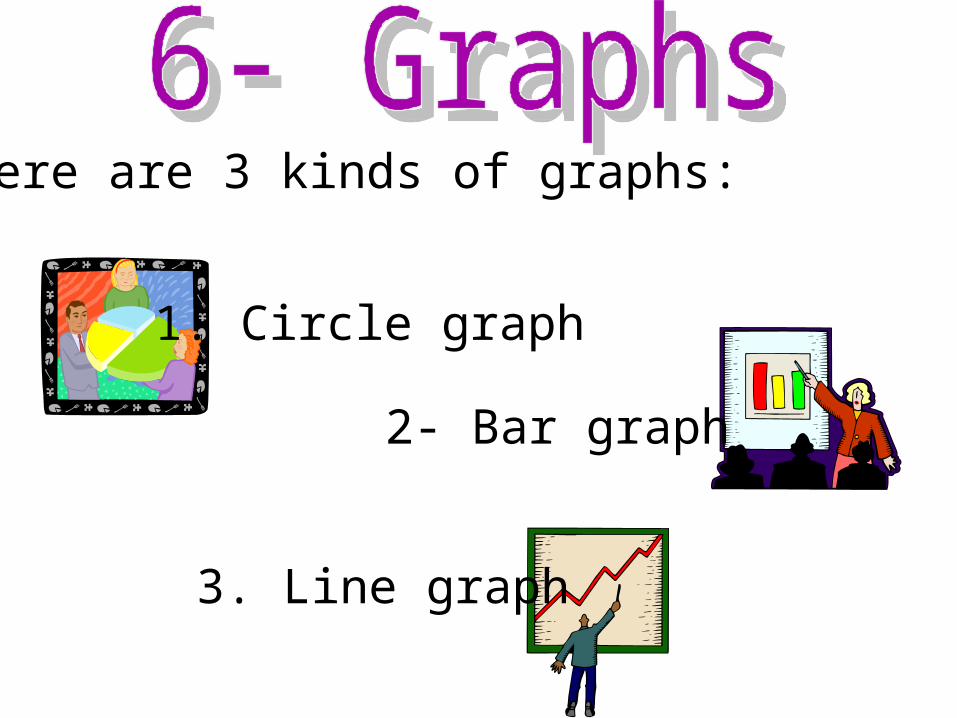
There are 3 kinds of graphs:
1. Circle graph
2- Bar graph
3. Line graph

CIRCLE GRAPH
•A divided circle•It shows how a part relates to a whole•The numbers are written as percents•The total of the numbers will be 100%
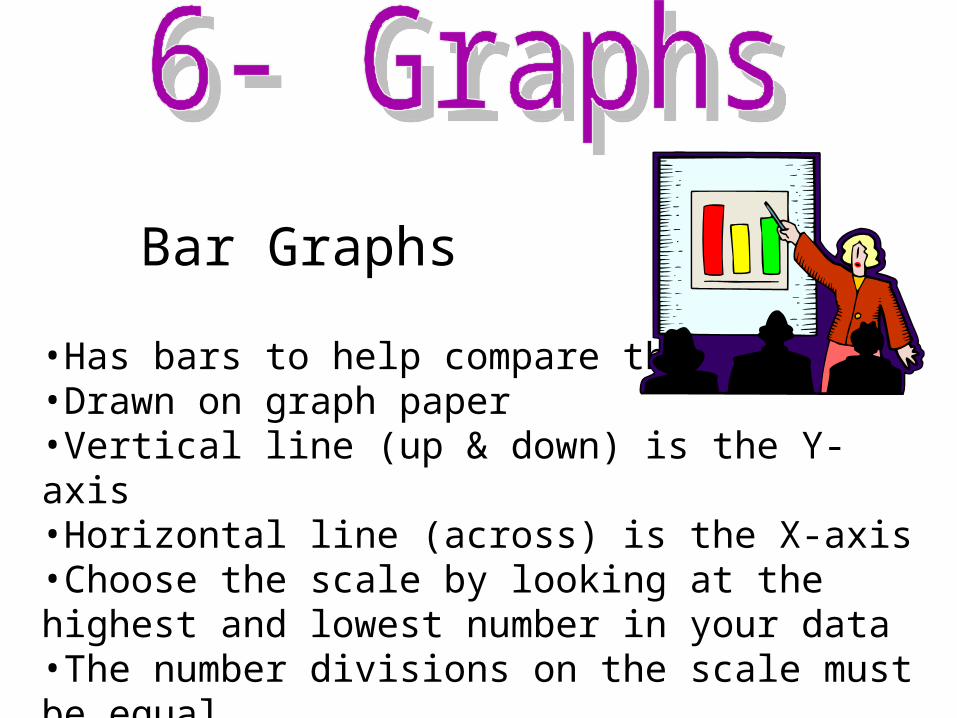
Bar Graphs
•Has bars to help compare things•Drawn on graph paper•Vertical line (up & down) is the Y- axis•Horizontal line (across) is the X-axis•Choose the scale by looking at the highest and lowest number in your data•The number divisions on the scale must be equal•ALL bar graphs have a scale and equal divisions
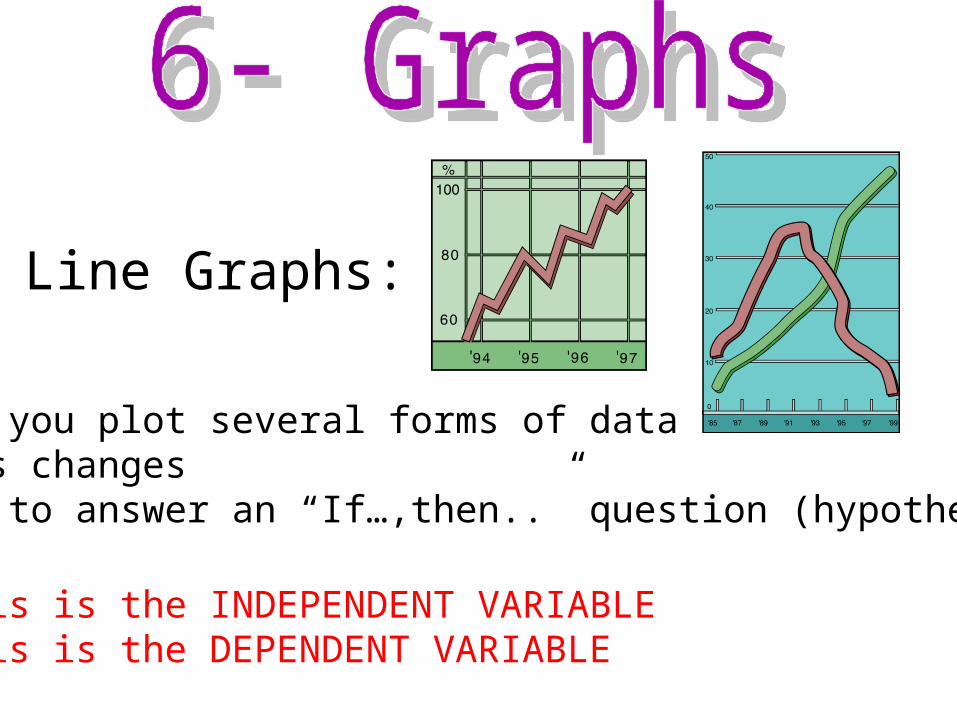
Line Graphs:
•Lets you plot several forms of data•Shows changes•Help to answer an “If…,then..” question (hypothesis)
•X-axis is the INDEPENDENT VARIABLE•Y-axis is the DEPENDENT VARIABLE
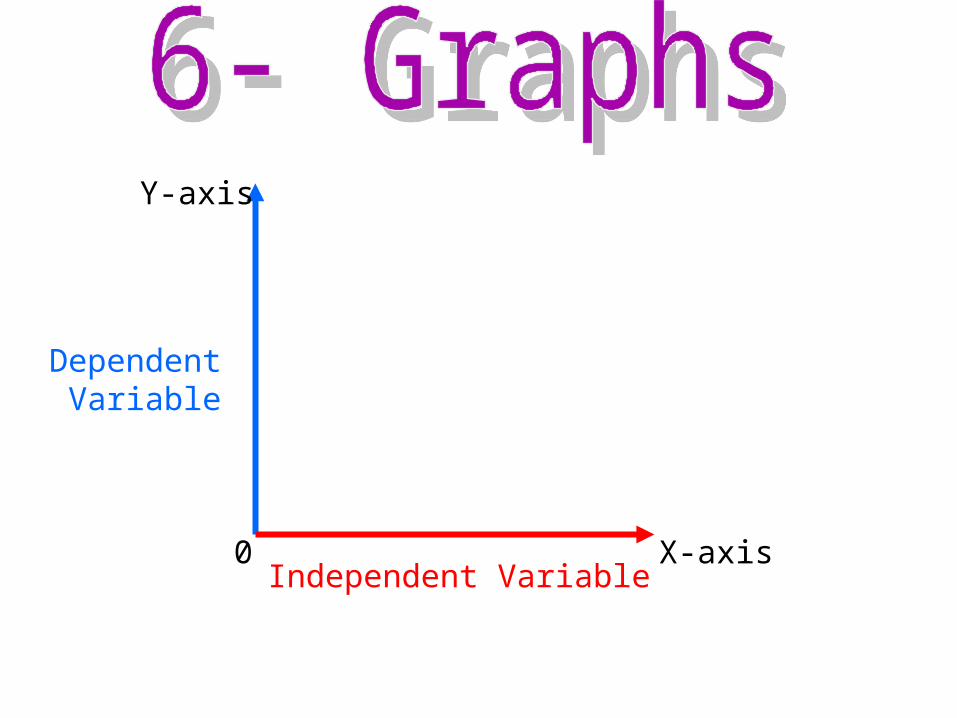
0Independent Variable
Dependent Variable
Y-axis
X-axis

When a scientists finishes an experiment, he/she must communicate the results in a lab report.
Rules for a Lab Report:•Use proper spelling, grammar, and punctuation•Write in complete sentences•Do NOT use personal pronouns (I, we, he, she, us, you, them, ect.)•Do NOT lie or make up data•A stranger should be able to repeat the experiment exactly by reading the report.
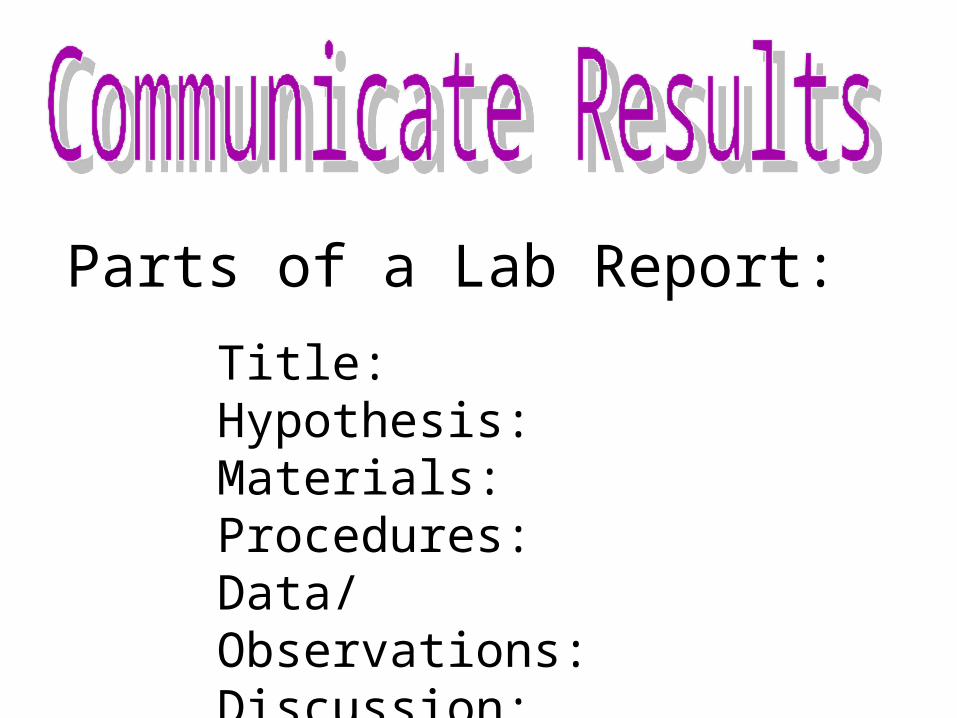
Title:Hypothesis:Materials: Procedures:Data/Observations:Discussion:
Parts of a Lab Report:
Parts of a Lab Report:
Title:
Hypothesis:
** Copy both of these from the experimental design diagram you completed during the planning of the experiment
Parts of a Lab Report:Materials: (You must list every single thing that you used) JUST LIST-NO SENTENCES
Materials: 15 small styrofoam cupsplain potting soil 250 ml measuring cupwater
Parts of a Lab Report:Procedures: (You must list in detail every step you did when setting up this experiment)***Someone should be able to repeat the experiment exactly by reading your directions
Procedures: Get 15 small styrofoam cups. Label each cup with a number 1-5 for the control group and the 2 experimental groups. Organize all of the cups in the tray. Put 10 scoops of plain potting soil in all of the cups. Put one lima been seed 5 cm into the soil and cover the seed with soil.
Parts of a Lab Report:Data/Observations: (look at the measurements and notes in your lab log for important information about the results of the experiment)
Data/Observations: The data collected shows that the plants that received vinegar did not grow. The plants without vinegar grew an average of 5 cm in 2 weeks. The plants without vinegar were tall and very bright green.
Parts of a Lab Report:Discussion: (write a conclusion about whether or not the results supported the hypothesis)
Discussion: The data collected did not support the hypothesis. The plants with vinegar did not grow more than the plants with the vinegar.
Discussion: A conclusion can not be made because of error in the experiment. All of the plants were destroyed by a dog.
`