NVivo Guide - Precision Consulting
29
Precision Consulting 228 PARK AVENUE SOUTH NEW YORK, NY 10003-1502 PHONE: 646-553-4730 FAX: 646-304-9595
Transcript of NVivo Guide - Precision Consulting

Precision Consulting228 PARK AVENUE SOUTHNEW YORK, NY 10003-1502PHONE: 646-553-4730FAX: 646-304-9595

Overview of User Interface
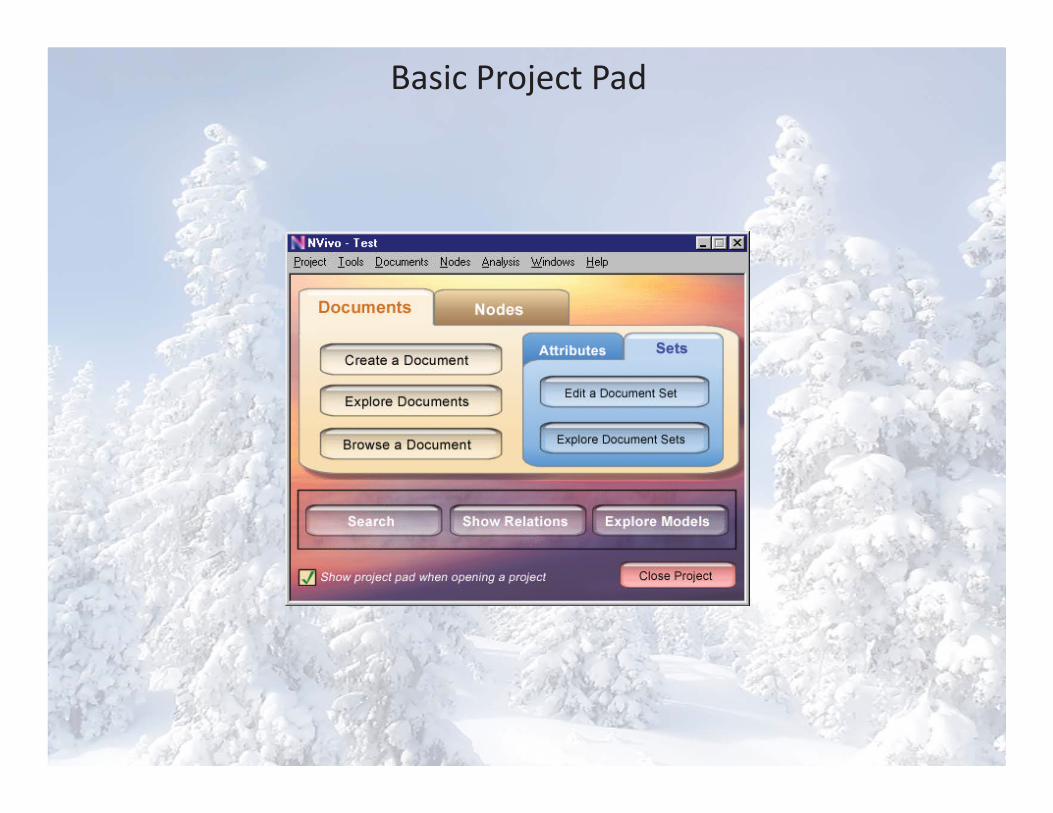
Basic Project Pad

To create a new project:
1.Click the QSR Nvivo icon on your desktop to open the application. Onfirst launch, the NVivo User dialog box is displayed.
2.By default, your Windows user name is displayed in the Name field. Youcan update the name if required. If you are sharing this Windows login
with another user, enter your own name.
3.In the Initials field, enter your initials. Click OK.
4.On theWelcome screen, click the New Project button.
Creating a Project

4. The New Project dialog box is displayed.
5. Enter a name for your project in the Title field.
6. If required, enter a description of your project in the Descriptionfield. For example, this might include information about the
objectives of your research project.
7.To change the location of the project, click the Browse button.
8.Click OK. The NVivo window is displayed with the name of yourproject in the Title bar and your user initials in the Status bar.
Creating a Project

1. Free Nodes (no hierarchy)
2. Tree NodesParent Nodes (general categories)
Child Nodes (specific sub categories)
3. Cases (for demographic information)
4. Relationships (nodes that describe the connection between two projectitems)
5.Matrices (a collection of nodes resulting from a matrix coding query.
5 Types of Nodes

Navigation View:On the left side of the screen, you can navigate your way
around your sources.
List View:On the top potion of the workspace screen, the list view allowsyou to see a list of the contents of the sources you click on in
navigation view.
Detail View:This makes up the center of the screen, extending to the lowerright hand corner. This is where you see the content of your
sources, and is where the coding takes place. In detail view, youcan open multiple tabs of different sources. The tabs are in the
top left hand of the detail view screen.
3 Types of Views

Sets:Sets provide a flexible way of grouping project items of different types. Forexample, you might create a set for the photographs and videos taken in a
particular setting. You can customize the order of the items in a set to make avirtual ‘album’ or photo gallery.
Useful Terms
Queries:Queries enable you to question your data, find patterns and pursue ideas. Youcan save queries, re run them through new data and track the evolution of
results.
Models:Models can illustrate initial ideas about your project or identify emerging
patterns and connections. Make a ‘static’ model to represent your project at aspecific point in time. Make a ‘dynamic’ model to represent your project in real
time.
Links:NVivo provides the following ways to link your data:

Memo Links:Use ‘memo links’ to attach a memo to the source or node that
is related to it.
See Also Links:Use ‘see also’ links to place pointers between the content of
sources, nodes, models or sets.
Annotations:Like scribbled notes in a margin, annotations enable you to
comment on selected content.
Classifications:
a) Cases by setting up attributes such as gender, age andlocation.
b) Relationships by setting up relationship types (loves,impacts, employs, is married to and so on).
More Useful Terms
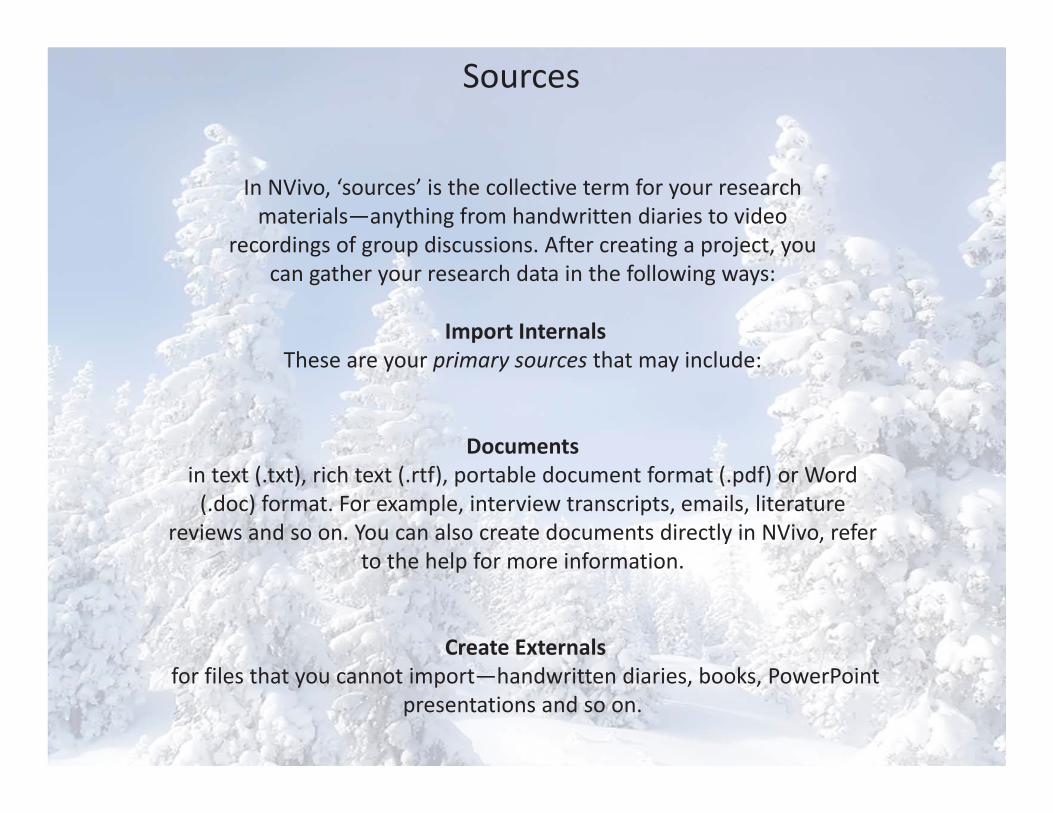
Import InternalsThese are your primary sources that may include:
Documentsin text (.txt), rich text (.rtf), portable document format (.pdf) or Word(.doc) format. For example, interview transcripts, emails, literature
reviews and so on. You can also create documents directly in NVivo, referto the help for more information.
Create Externalsfor files that you cannot import—handwritten diaries, books, PowerPoint
presentations and so on.
Sources
In NVivo, ‘sources’ is the collective term for your researchmaterials—anything from handwritten diaries to video
recordings of group discussions. After creating a project, youcan gather your research data in the following ways:

Video recordings in .mpg, .mpeg, .mpe, .wmv, .avi,.mov, .qt or .mp4 format. This might include videorecordings of interviews or research settings, media
clips and so on.
Audio recordings in .mp3, .wma or .wav format. Thismight include audio interviews, podcasts, music or
whatever audio material is relevant to yourresearch.
Pictures that are in .bmp, .gif, .jpg, .jpeg, .tif or .tiffformat. For example, you might have photos that
are used to elicit responses from researchparticipants or photos taken by the participants
themselves.
More Sources
•Coding allows you to gather together all the material relatedto a topic. When you open the node, you can see all the
references gathered there.
•NVivo also provides advanced coding methods. You can run atext search query to find all occurrences of a word and thencode these occurrences at a node—for example, you could
search for all occurrences of the word ‘fun’ and code these atthe node Enjoyment.
•If you are dealing with structured information such as surveyresponses, you can use NVivo’s auto code functions to code by
paragraph, paragraph style or transcript field.
Simple Coding

To code document content—simply drag and drop:
1.Open the document you want to code—it is displayed in DetailView.
2. Open the required node folder to display the nodes in List View.
3. If required, re arrange the views for easy coding—on the Viewmenu, click Detail View>Right.
4. Select the content you want to code and drag it to the requirednode. To code at a new node:
a. On the Coding toolbar, select the Name option from theCode At drop down list.
b. Enter a name for the new node in the next drop down list.c. From the In drop down list, select the location for the node.
d. Click the Code button.
The content is coded at the node. If you open the node (by doubleclicking on it), you can see coded content.
Coding in a Document

1.To code the content of an audio or video source:
2.Open the audio or video source you want to code—it isdisplayed in Detail View.
3.Open the required node folder to display the nodes in ListView.
4.To code directly on the audio or video, select a portion of thetimeline and drag and drop it on the required node.
5.To code text in the transcript, select a row and drag and drop iton the required node. You can also select specific text in the
Content column and right click to code at a node.
Coding an Audio or Video Source

To open a node and see all the referencesthat have been coded there:
1.In Navigation View, click on Nodes.
2.Click the required node type.
3.In List View, double click the requirednode.
4.The node is opened in Detail Viewwiththe Reference tab displayed.
Exploring a Node
When you are familiar with sources,nodes and coding you can begin toexplore other features:
1. Finding project items
2. Querying your data
3. Creating models
4. Creating charts
5. Running reports
6. Exporting data
h

NVivo provides a number of tools forfinding and filtering your data.
Use the Find function to locate text ina source—on the Editmenu, click Find.
Finding Project Items

Advanced FindUsed to filter project items based on selected criteria—forexample, find all the cases who are women or find all the
cases who are women, over 50, and retired.
Finding Project Items

Grouped FindUsed to find items related to other items. For example, you can
view a selected source and the nodes that code it.
Finding Project Items

Creating Tree Nodes
To add children under this node:
1. Click the parent node.
2. On theMain toolbar, click the New button.
3. Click the Tree Node in this Folder option.
4. The New Tree Node dialog box is displayed.
5. Enter the required name and description.
6. Click OK.
The node is added under the parent node. Add as many children as required.

Coding Query:
Gathers content based on how it was coded. For example,show me all the content where women talked about
personal goals.
Querying Your Data

Matrix Coding Query:
Creates a matrix of nodes based on search criteria. Forexample, show me attitudes about volunteering by age
group.
Querying Your Data

Compound Query:Combines text and coding queries—search for
specified text in or near coded content.
Querying Your Data
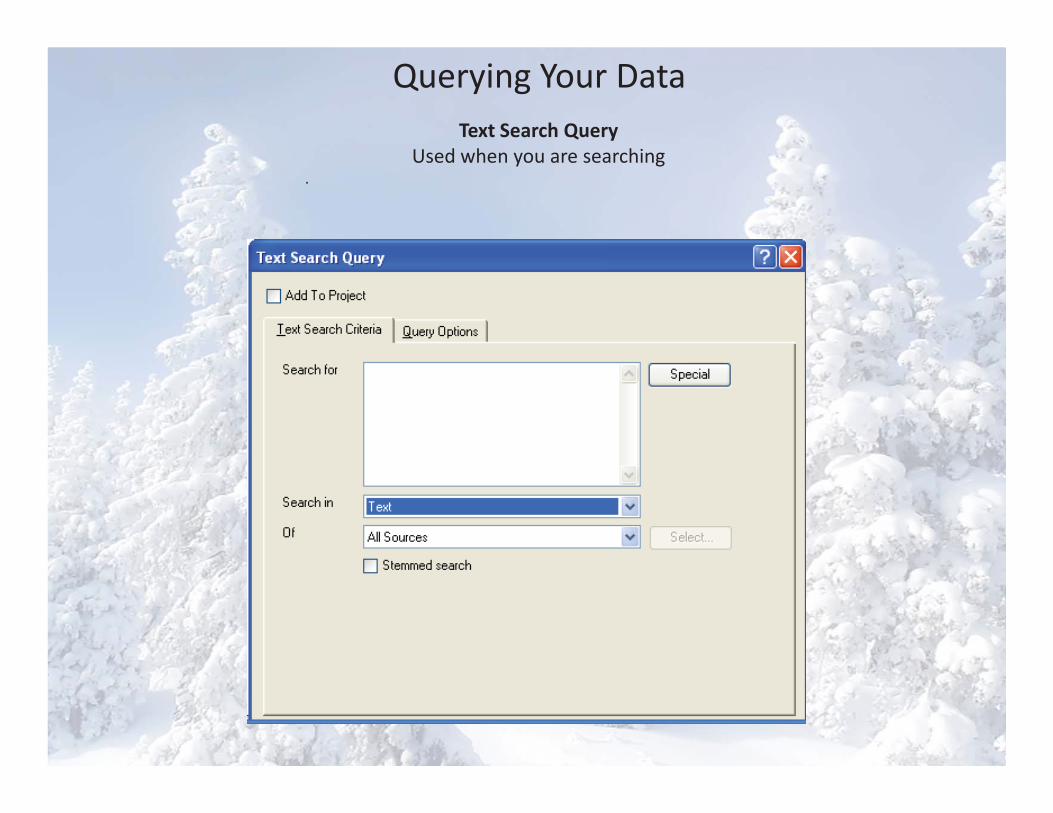
Text Search QueryUsed when you are searching
.
Querying Your Data

Word Frequency Query:Lists words and the number of times they occur inselected items. Seeing which words appear most
frequently can help you to identify themes and concepts.
.
Querying Your Data

Coding Query:Gathers content based on how it was coded. Forexample, show me all the content where women
talked about personal goals.
Querying Your Data

1.On the Toolsmenu, click Charts. The Chart Wizarddialog box is displayed.
2.Select the chart you want to create and click Next.
3.Select the data you want to chart in the optionsprovided. These options will change depending on the
chart you want to generate.
4.Click Finish to generate the chart. The chart will bedisplayed in Detail View.
Creating Charts
To run a report:
1. On the Toolsmenu, click Reports.
2. Select the required report.
3. Select options for the report layout.
4. Click OK.
The report is displayed in the Report Viewer.
Running Reports

Source Summary:A list of the sources in the project including the number of nodesthat code them. It also contains information about paragraph and
word length.
Node Summary:A list of the nodes in the project including the number of sources
coded at each node. This can help you to see which themes or ideasare occurring more than others.
Relationship Summary:A list of relationships organized by relationship type. This gives you
an indication of how much coding has been done for eachrelationship type.
Running Reports
Project Summary:A list of the project status in terms of the items it contains. This
can be useful for communicating or recording the overallprogress of your project.

Attribute Summary:A list of attributes and the number of cases assigned to each
attribute value. This is a useful way of checking for consistency andbalance in the project sample.
Coding Summary:A list of sources and the nodes that code them—a useful way to
check the progress of your coding. You can report on sources codedby all or selected users.
Running Reports