Nutrients Desk Study
26
Nutrients Desk Study Presented 3 March 2021 By Connie Chiang and Saisunee Chaksuin
Transcript of Nutrients Desk Study

Nutrients Desk Study
Presented 3 March 2021
By Connie Chiang
and
Saisunee Chaksuin

Objectives
∙ Identify the sources, sinks, fate and transport, and impacts of pollution, focusing
mainly on nitrogen and phosphorus.
∙ Provide information on national and regional nutrient reduction commitments,
targets, measures, gaps in management and governance
∙ Identify existing monitoring and assessment programmes in COBSEA countries.
Proposed Regional Responses
COBSEA can move forward and implement the Pollution Component of its Strategy

Methodology∙ Team of 2 consultants
Research – literature review, focused on N and P in coastal and marine
environments
- Online research
- Questionnaire sent to experts in the countries – Status of N and P in the country,
management of N and P
- Drew upon personal knowledge
- Dialogues with individuals
- UN-led initiatives
∙ Working schedule from Jan. 2021 to Mid-March 2021

Sources of N and P
Mainly from land-based sources
∙ Agriculture – chemical fertilizers, pesticides, herbicides
∙ Domestic waste
∙ Industry
∙ Some aquaculture
∙ Other non-point sources: rivers, reservoirs
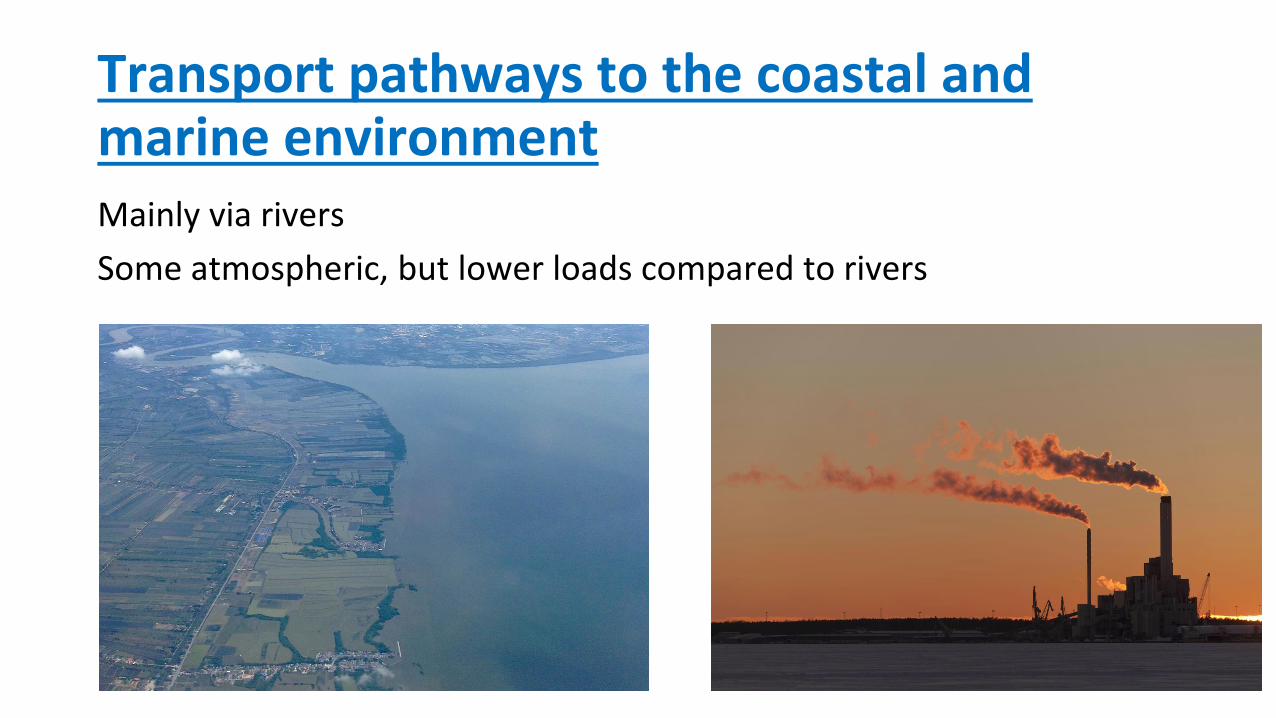
Transport pathways to the coastal and marine environmentMainly via rivers
Some atmospheric, but lower loads compared to rivers

Sinks • Floating in sea water
• Deposited into coastal terrestrial areas, sediments & offshore seabeds
• Taken up by algae, aquatic plants

Impacts● Coastal water quality: eutrophication > HABs
● Marine Environment & Biodiversity: fish, shellfish killed
● Fisheries > livelihood
● Tourism > economic

Some Hotspots (or highly eutrophicated areas)∙ Yangtze and Pearl River deltas; Liaodong and Bohai Bays,
China
∙ HABs observed in:
- 1x in Kep - Cambodia coastal area (2016)
- Jakarta Bay, Indonesia
- Masan Bay, Shiwha Lake, ROK
- Upper and Inner Gulf of Thailand
- Khanh Hoa, Ninh Thuan, and Binh Thuan coasts, Vietnam
• High eutrophication – Manila Bay, Philippines

GOVERNANCE

Targets for Nutrients and Pollution Reduction
China
• 5-year plans
• reduce emissions by 10-15 % from 2015 levels
• ammonia nitrogen (10%), NOx emissions (10%)
Indonesia
• Water Quality Index system
• physical and chemical (NH4, NO3, PO4) parameters, dissolved metals, organism
concentration, and radioactive materials
• Target indicators in Citarum Watershed, e.g. # water pollution control facilities

Targets for Nutrients and Pollution Reduction
Malaysia
• 10th and 11th national plans - targets for WQ improvement
• Assess maximum daily loads of pollutants
• Develop the National Marine Water Quality Index
ROK
• Many WQ standards and monitoring around all coastal areas
• Total Pollution Load Management System (TPLMS) for 5 Special Management Areas
• P reductions targets are applied to the TPLMS
• Three largest riverine systems, Geum, Yeongsang, and Nakdong have set water quality targets
for P and BOD

Targets for Nutrients and Pollution Reduction
Singapore
• WQ targets in recreational beaches
• Intensive wastewater management facilities for reservoirs to serve potable and
recreational use
Vietnam
• WQ standards for surface, coastal and groundwater
• Standards for effluents from domestic, industrial and medical wastewater
No specific targets set in Thailand, Cambodia or Philippines but have WQ standards

Monitoring Programmes• Chapter 3.3
• Not sufficient in some countries
• Wish to improve/expand
• Coastal areas – in nearly all countries
• Cambodia – monthly monitoring of freshwater; no regular marine and coastal water
quality monitoring system yet
• China – along the coast & in atmosphere over the seas; results reported in Annual Marine
Bulletin
• Indonesia – each Directorate monitors N and P in their coast & in watersheds

Monitoring Programmes• Malaysia – MWQI & specific island monitoring
• Philippines – EMB & regional offices monitor monthly or quarterly; freshwater &
marine areas
• ROK – all coastal areas – publicly available data online
NIFS – use of technology – RS, ocean colour, physical, chemical, biological monitoring
• Singapore – recreational beaches; real-time data available to the public
• Thailand – 2x a year in the coast, some data available in Thai to the public
• Vietnam – at least 2x a year in the coast; offshore & island monitoring

Regional & Global Measures toTackle Pollution∙ ASEAN – WQ monitoring and guidelines
∙ RC3S – Regional Capacity Centre, Bali
∙ UNEP Regional Seas Programme
Caribbean – Cartegena Convention, strategy under
development
SACEP (South Asian Seas) – nutrients projects,
scoping study, ecosystem health report card, N Hub
NOWPAP – Common Procedures, eutrophication tool
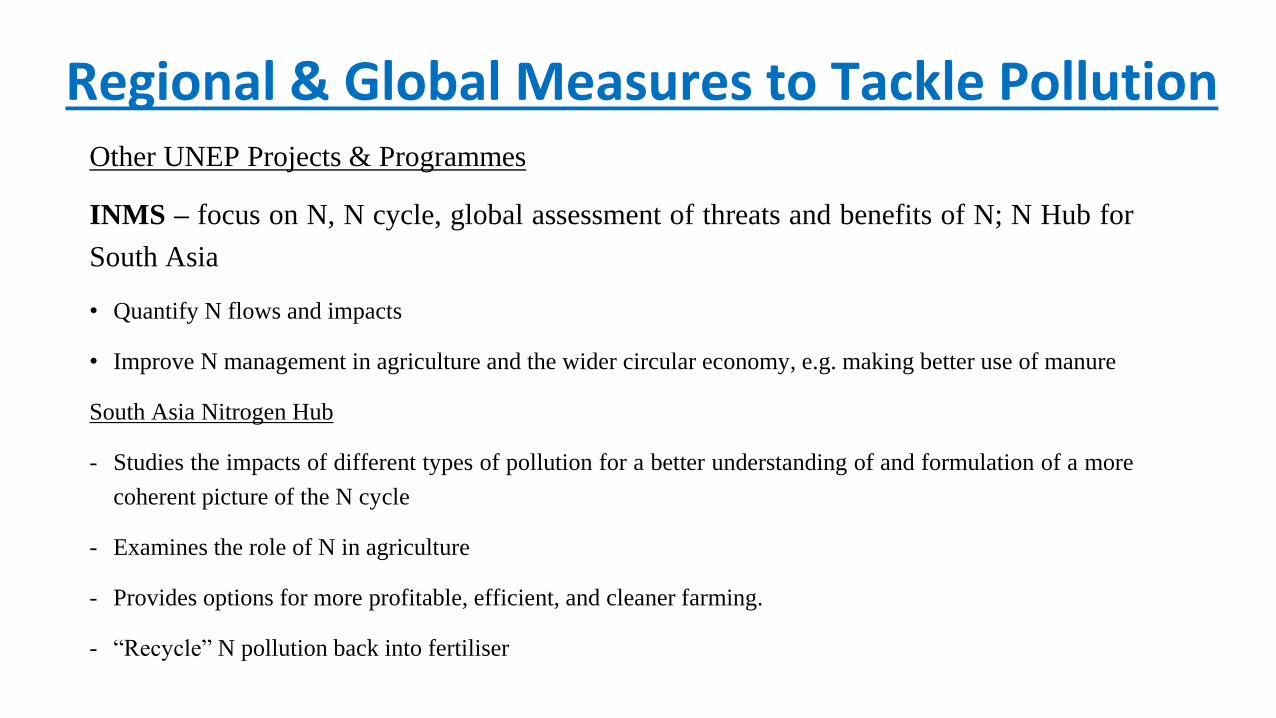
Regional & Global Measures to Tackle PollutionOther UNEP Projects & Programmes
INMS – focus on N, N cycle, global assessment of threats and benefits of N; N Hub for
South Asia
• Quantify N flows and impacts
• Improve N management in agriculture and the wider circular economy, e.g. making better use of manure
South Asia Nitrogen Hub
- Studies the impacts of different types of pollution for a better understanding of and formulation of a more
coherent picture of the N cycle
- Examines the role of N in agriculture
- Provides options for more profitable, efficient, and cleaner farming.
- “Recycle” N pollution back into fertiliser

Regional & Global Measures to Tackle Nutrients and Pollution
• GNC – Global N Cycle – modelling for nutrient reduction strategies, Manila Bay as
demo site
• GPNM – already mentioned by Mahesh
• SCS-SAP – South China Sea Strategic Action Progamme
- National action plans and ocean model under development
- Nutrient carrying capacity of water bodies

Regional & Global Measures to Tackle Nutrients and Pollution
Data bases and tools:
• TWAP data portal of river basin & ocean assessment globally
• HydroATLAS, IMAGE, NEWS – info on rivers, watersheds, nutrient sources,
models

Gaps and Opportunities
∙ Need for more data and knowledge
✔ Enough?
✔Where are data?
✔ Access
✔More sharing and monitoring in some places
∙ Need to strengthen coordination
⮚Across agencies, with NGOs & all stakeholders
⮚Law enforcement, compliance, self-regulation, fines
⮚Jurisdiction over different land areas

Gaps and Opportunities∙ Research and analytical capacity to be increased
⮚“More reliable” data
⮚Calibrated and comparable data
⮚Research for carrying capacity and NUE
∙ Insufficient understanding of non-point sources – research, hard and soft technology
∙ Insufficient waste management approaches
⮚Carried out in limited areas
⮚Insufficient budget and manpower
⮚More affordable measures (technology)

Proposed Regional Responses
Purpose: To prevent and reduce eutrophication and
sedimentation and their impact on the marine and coastal
environment
Activities:
1. Development of regional guideline for identifying and addressing
sources of nutrients, sediments and wastewater
2. Policy and information exchange, including sharing of outputs,
results and best practice from projects addressing land-based
sources of pollution, including activities towards implementation
of the Strategic Action Programme (SAP) for the South China
Sea
3. Technical training and capacity building

Proposed Regional ResponsesMonitoring and assessment
- Support to develop/improve monitoring programmes
- Improve on existing ones – seasonal variability
- Ecosystem health report cards – examples from Lake Chilika and Manila Bay
- Common procedures, harmonized monitoring
Research and Knowledge Sharing
- NUE, quantify usage chain
- Platform for experience and knowledge exchange: non-point sources, recycling N and
P wastes, technology, carrying capacity
- Develop realistic & reacheable WQ standards esp. for coastal areas, setting targets

Proposed Regional ResponsesData Services
- Refine/adapt existing ones for the region
- Data storage – hubs?
- Fill monitoring gaps
- Scoping studies
- INMS modelled the ECS, where else needs this? Hotspots?
- NOWPAP Eutrophication Tool & SCS-SAP project results for future action
Capacity building
- GPNM Training on Phosphorus
- Sustainable aquaculture
- Intercalibration for “reliable” data

Proposed Regional ResponsesRegional Hub
- Knowledge service center
- Service capacity building needs
- Mirror S. Asia N Hub
Integration and coordination
- Meeting international commitments
- Link to and support from international progammes, e.g. CBD, GPA, other Regional
Seas
- Stronger stakeholder involvement

Proposed Regional Responses
Regional Strategy, Guidelines and/or Action Plan
- Caribbean Programme’s example
Expert Working Group
- Prioritise the actions to take
- Advise on what and how to implement actions

What’s Next?
• Finalise report in mid-March
• COBSEA Secretariat to take further action based on agreement by COBSEA countries