Help Desk Benchmark Study - Information Systems &...
37
1 Help Desk Benchmark Study A Financial Methodology Anne Brisbois Denna Information Services & Technology, Massachusetts Institute of Technology March 15, 2004
Transcript of Help Desk Benchmark Study - Information Systems &...

1
Help Desk Benchmark Study
A Financial MethodologyAnne Brisbois Denna
Information Services & Technology, Massachusetts Institute of Technology
March 15, 2004

2
Focus of this Presentation
• A ‘how-to’ guide for a low-tech, flexible, repeatable and sustainable method for determining costs across multiple institutions for a particular area of activity
• A description of our financial benchmarking process
• An opportunity

3
This presentation is not ~
• A high-tech solution
• A top-down solution
• A comprehensive benchmarking project plan
• An analysis of financial and performance benchmarks

4
Agenda
• Impetus at MIT and at Stanford• Project objectives• Financial objectives• Financial methodology objectives• Step-by-step methodology • Lessons learned and questions

5
Impetus at MIT
• Among the findings of Visiting Committee review of IT services in 2002 • “glaring need for meaningful data” • Lack of data an obstacle to completing the full scope
of the review• Specific data needed
• Detailed cost data for IT activities• Useful benchmark data from peer institutions
• Provost and Executive Vice President support

6
Impetus at Stanford
• “Sit on a ton of data and just don’t use it”
• Significant IT investments
• MIT asked
• Comparable high-level support

7
Common Threads • Reliance on anecdote rather than ‘designed’
management information to guide decision-making
• Need for quantitative as well as qualitative information
• Budget Pressures• Need to demonstrate value in IT investments• Ever present change factors

8
Project Objectives
• Understand each other’s IT services and performance• How effective are we?• How do we compare to other universities and by what
measures?• How can we use our IT systems to help us manage
ourselves and our investments better?• Develop meaningful metrics and comparative data• Develop a methodology to conduct comparisons• Use data to drive cultural change

9
Criteria for Success• In-depth understanding of each other’s processes
• Clearly defined and “normalized” operational data to ensure meaningful apples-to-apples comparisons
• Normalized method for capturing costs of first tier help desk services under study

10
Financial Objectives
• Gauge investment and effectiveness. • How do the demographics, budgets, total IT costs and
Help Desk activity compare and what do these measures tell us?
• Understand costs and the cost drivers

11
Financial Methodology Objectives
• Create a sustainable process for capturing detailed and summarized financial data for the activity being benchmarked
• Provide comparable total cost by institution for allocation to operational metrics to be used by on-line managers and decision-makers
• Ensure integrity of the financial data for apples-to-apples comparison

12
Before you begin …• Be patient
• Ask questions
• Appreciate complexity
• Remain focused and engaged
• Enjoy the team effort

13
Normalizing the Process
• Goal - Document cost component (general ledger account) definitions and group at a summary level
• Compare detailed G/L reports• What are the options for various report formats • Are they downloadable to Excel?• Similarities and differences in the types of costs?

14
Step-by-Step Methodology1. Determine and document all cost components,
direct, indirect and overheada) Define their meaning b) Agree on whether to include in cost poolc) Group similar costs in sub-categories and establish
common terminology
2. Determine staff effort and operating costs that are not part of the benchmark activity

15
Step-by-Step Methodology
3. Create individual cost object detail reports that reflect the excluded costs determined in Step 2
4. Create one-page summary view of cost components by sub-category with a total cost figure.
5. Allocate costs to first tier help desk cases

16
Cost Components
• Similarities and Differences• Do they matter?• What do they mean?• Are they meaningful to this effort and to whom?• How to capture significance • How or should differences be “normalized” across
institutions

17
1. Determine and Document Cost Components
• Iterative process to fine-tune understanding• Document cost by name and definition by institution• Allocate to ‘normalized’ sub-categories of expense• Record decisions about what are considered direct,
indirect and overhead costs and whether they are included in the cost pool
• Determine differences in cost components and decide whether ‘normalizing’ or determining equivalent cost is important
• Document what is in and what is out of the cost pool for future reference

Sample Direct Cost ComponentsCost Component Groups Description MIT Name Definition SU Name Definition
Professional Development:
Travel Travel (allow. & un-allow) Travel not for staff/prof devel. Travel (allow. & un-allow)at Stanford all travel is counted the same
Prof. Development & Training Travel - Prof. Developm'tProf. Development/Training Staff Training Tuition
Conference Fees Conference Fees Fees for confs outside MIT Conference fees Fees for conf outside StanfordMemberships and Dues Memberships and Dues Prof'l Memberships & Dues
Materials and Services:
Maintenance & Repair Maintenance & Repair
Costs for building and equipm't repairs not covered by service contracts Vehicle Repair & maint.
Gen Purpose Equipmt repairCosts for equipm't repairs not covered by service contracts
Service ContractsMaint contract costs for equipmt Maintenance Contracts same
Office Supplies, copying, printing Office Supplies Dept'l Supplies & Expenses
Copying expense -includes copyingPrinting Printing Services
Meetings, Food & Beverages Meetings - Food & Beverages Food and Entertainment Recreation-related expenses Employee Morale
Prizes & Awards - Other Alcohol or EntertainmentEntertainmentAudio Visual
Non-reimbursable expenses
Costs that do not qualify for reimbursement from Federal sponsors
Seminar/Workshop/Con ference Costs
costs of seminars/workshops offered by IS for MIT community.
Mailing and Shipping Postage Mailing & Shipping Service Center Charges ?Postage & Freight
Telecomm. & Networking Non-IS Tel & Network Chrgs
Non-IS telephone and network vendor payments and for reimbursements to staff for non-IS services at home for MIT purposes. Telecommunications same
IS Tel & Network one-time
one-time moves and intallation charges for jacks and telephones Not charged back at SU
IS Tel Monthly chrgsmonthly phone service, pager usage and voice mail charges Stanford Communications
IS Tel usage chrgstoll calls and tel credit card charges Billable calls
18a
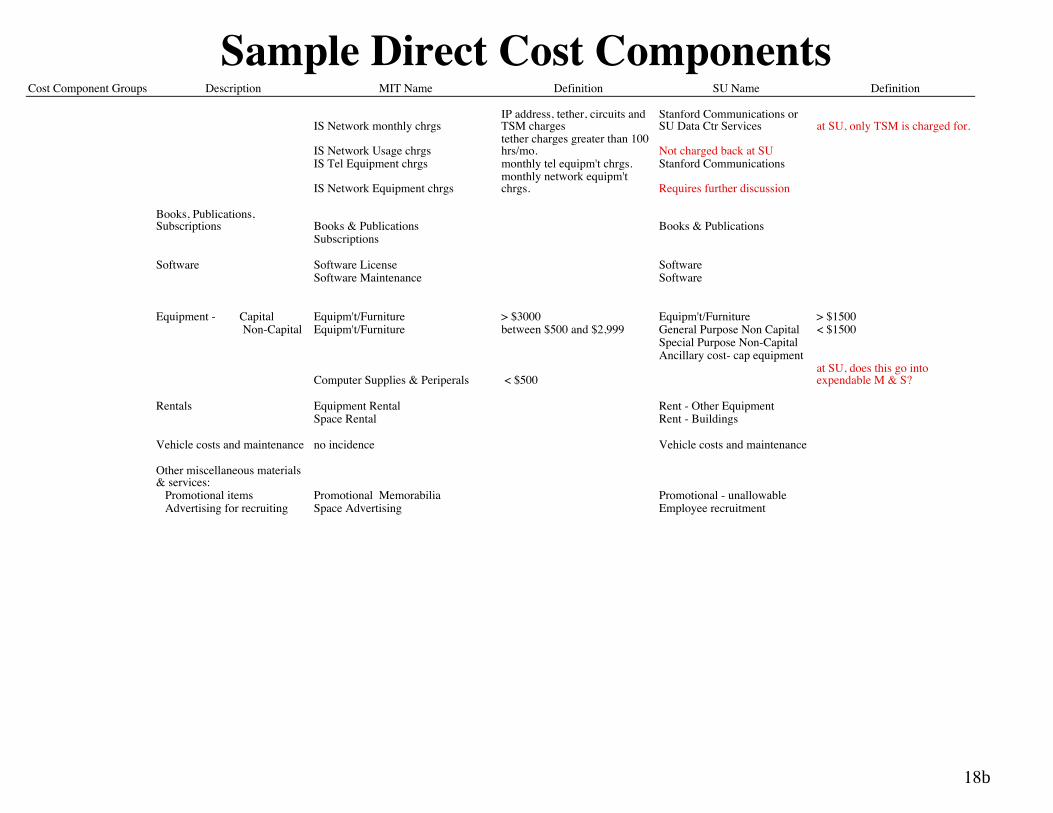
Sample Direct Cost ComponentsCost Component Groups Description MIT Name Definition SU Name Definition
IS Network monthly chrgsIP address, tether, circuits and TSM charges
Stanford Communications or SU Data Ctr Services at SU, only TSM is charged for.
IS Network Usage chrgstether charges greater than 100 hrs/mo. Not charged back at SU
IS Tel Equipment chrgs monthly tel equipm't chrgs. Stanford Communications
IS Network Equipment chrgsmonthly network equipm't chrgs. Requires further discussion
Books, Publications, Subscriptions Books & Publications Books & Publications
Subscriptions
Software Software License SoftwareSoftware Maintenance Software
Equipment - Capital Equipm't/Furniture > $3000 Equipm't/Furniture > $1500 Non-Capital Equipm't/Furniture between $500 and $2,999 General Purpose Non Capital < $1500
Special Purpose Non-CapitalAncillary cost- cap equipment
Computer Supplies & Periperals < $500at SU, does this go into expendable M & S?
Rentals Equipment Rental Rent - Other EquipmentSpace Rental Rent - Buildings
Vehicle costs and maintenance no incidence Vehicle costs and maintenance
Other miscellaneous materials & services: Promotional items Promotional Memorabilia Promotional - unallowable Advertising for recruiting Space Advertising Employee recruitment
18b

Indirect and Overhead CostsThe following costs will not be included in the first pass of comparable benchmarks.
Description MIT Name SU Name A Denna Comments 10/6/02
A. Administrative and Operational Costs managed and paid for by IT but not included in the cost pool: (May or may not be charged back)
Other IT-provided services cha IS Mainframe chargesSU does not charge back for mainframe usage Eliminate from study.
Administrative and Operating costs not included in the Federal cost recovery rate at MIT
IS Recruiting and CG (HR) staff effort and costs some HR support
IS financial management team IT Finance Staff Building Site costs:
Water, coffee, tea, etc
Common area equipment and maintenance (copiers/printers) Moving costs for staff around ISRenovations to common building areas Renovation
ACD system costs To be determined Anything to add here on the SU side?
Etc.
B. Administrative and Operating Costs managed and paid for at the Institute or University-wide level: (May or may not be charged back)
Inst.-wide charged back costs:Campus Activities Complex See Rentals (line 80). Is this a duplicate
MIT costs included in F & A:Renovations RenovationOperating costs of MIT bldgs Contract Custodial Services
Interest & Depreciation Interest - External unallowableDepreciation
Central Admin salaries and expenses for CIO, IT Directors other than Director of Support, CAO, and central HR functions
ITSS Mgmt & Admin GL: -Designated Credits (cr) -Chrgs to/fr Other Depts (db) This is the 'G & A' removed
19
20
2. Exclusion of Effort
• Determination of non-benchmark activity made as a percentage of EFT by team leader/direct manager
• Cost of exclusion based on percentage of EFT x annual salary equivalent
• Total excluded cost subtracted from total salaries and wages costs for team for the period

Exclusion of EffortEXCLUDED EFT AND OPERATING $ BY TEAM
Sept-Feb Sept-Feb Sept-Feb Sept-Feb Sept-FebExcluded Excluded Excluded Excluded Total
Project EFT EFT $ Operations Operations $ Excluded Cost Explanations
Business Liaison Team
BLT - 1 EHS 0.1 $2,500 2,500Environmental Health & Safety project team. Work outside the scope of the Help Desk function.
BLT - 2 Distributed Support 0.20 $4,000 NEXTEL Cell 218 4,218
Dispatch work for the School of Science pilot & DITR is outside the scope of the Help Desk function, as is the cost of his cell phone for dispatch-related work.
BLT total 0.30 $6,500 218 6,718
ATHENA/RCC NOTE: Wireless and Linux costs are already excluded
A/RCC - 1 Other Infrastructure 0.10 2,500 0 2,500Teaching classes for Training team. Outside of Help Desk function.
IS Home Page Project 0.05 1,250 0 1,250 Outside of Help Desk function
A/RCC - 2 RCC Student Support 0.13 3,000 0 3,000 All RCC (student) related support - 80% for Sept. only
Other Infrastructure 0.40 9,000 0 9,000Discovery Projects, Distributed Support (Net Security, Housing, Residential Life), HP, Windows Cluster, MCCA project
A/RCC - 3 Client Advocacy 0.20 6,000 0 6,000 Residential computing, Academic Computing
Other Infrastructure 0.10 3,000 3,000 Non-Help Desk casetracker work
A/RCC - 4 RCC Database 0.40 9,000 9,000 RCC ticket tracking system and backfilling for A/RCC - 3
StudentsRCC Residential
Computing 0.0 38,644 38,644Residential computing consulting outside of Help Desk Function being benchmarked
Athena/RCC Total 1.38 $72,394 0 72,394
HELP DESK NOTE: Wireless and Linux costs are already excluded
HD - 1 Provost Help Dist. Effort 0.50 6,000 0 6,000 50% of his half-time or 25% FTE
HD - 2 Other Infrastructure 0.10 2,500 0 2,500 10% TSM migration meeting facilitation
HD - 3 VIP Distributed Help 0.50 12,500 Sprint Cell 174 12,674 50% for distributed support
HD - 4 VIP Distributed Help effort 0.50 17,500 Nextel Cell 294 17,794 50% for distributed support.
HD - 5 Housecalls 0.70 $21,000 21,000 70% for distributed support. 25% for Wireless, 5% for Linux OS
HD - 6 Housecalls 0.50 15,000 15,000 50% time for distributed support
HD - 7 Professional Services 0.00 $0 5,920 5,920 50% of HD - 7's 50% EFT in Help Desk
Help Desk Total 2.8 $74,500 0 6,388 80,888
21a

Exclusion of EffortSept-Feb Sept-Feb Sept-Feb Sept-Feb Sept-FebExcluded Excluded Excluded Excluded Total
Project EFT EFT $ Operations Operations $ Excluded Cost Explanations
SOFTWARE LIBRARIES
SW Lib - 1 IS Home Page 0.10 3,000 0 3,000 10% project time
SW Lib - 2 Support Staff 0.65 $14,050Software sold to
DLCs 28,142 42,192
Support staff is for administrative function only. Operations costs are software and software maintenance costs for Compaq, SGI and Sun operating systems that are sold to DLCs.
Software Libraries Total 0.75 $17,050 28,142 45,192
Total Exclusions 5.23 $170,444 34,748 205,192
21b

22
3. Cost Object Detailed Reports
• Download period detailed reports into excel, 1 cost object per tab of workbook
• Format by sub-category of expense as determined earlier with cost sub-totals
• Input total EFT for each cost object report • Link excluded EFT and dollars to exclusion of
effort spreadsheet

23
3. Cost Object Reports - cont.
• Formulate percentage of EFT excluded by cost object
• Multiply percentage of EFT excluded x each line of operating expense to get excluded operating costs
• Formulate last columns for final EFT and costs for benchmark activity

Cost Object TemplateSAMPLE DATA
FY03 Total Excluded Excluded Excluded * Final IS Roll Up G/L Code & G/L Description FY03 Budget Expenses EFT EFT EFT $ Operations $ Final EFT Cost Pool
ExpensesSalaries
400250 - Administrative Staff-On $800,000 $700,000 13.00 2.50 $100,000 $0 10.50 $600,000400450 - Hourly Personnel-On $0 $13,000 0 $0 $0 0.00 $13,000400754 - MIT Students-On $115,500 $80,000 0 $0 $0 0.00 $80,000TOTAL Salaries $915,500 $793,000 13.00 2.50 $100,000 $0 10.50 $693,000
Employee Benefits600204 - EB On $144,000 $128,340 $18,000 $110,340TOTAL Employee Benefits $144,000 $128,340 0.00 0.00 $18,000 $0 0.00 $110,340
Travel & Professional Development420050 - Travel Expenses $9,993 $1,884 $9,993420080 - Travel-Unallowable Cost $0 $0420081 - Travel-Professional Devel $16,750 $4,423 $834 $4,423420131 - Prof Development/Training $11,500 $11,437 $2,157 $11,437TOTAL Travel & Professional Develo $28,250 $25,853 0.00 0.00 $0 $4,875 0.00 $25,853
Materials & Services420140 - Conference Expenses $75 $14 $61420220 - Maint & Repairs $1,000 $2,700 $509 $2,191420226 - Materials and Services $150 $3,433 $647 $2,785420254 - Non-Reimbursable Expenses $250 $422 $80 $342420258 - Office Supplies $2,200 $992 $187 $805420302 - Promotional & Memorabilia $1,154 $218 $936420318 - Recreation Related Expens $200 $732 $138 $594420319 - Prizes & Awards-Other $500 $0 $0420321 - Rewards & Recognition $0 $125 $24 $101420338 - Service Contracts $500 $96 $18 $78420392 - Copying Expense $250 $82 $15 $66420800 - Books & Publications $500 $421 $79 $341420890 - Subscriptions $240 $30 $6 $24420900 - Mail List Expense $270 -$267 -$50 -$216420920 - Postage Mailing and Shipp $275 $19 $4 $16421000 - Meetings - Food & Beverag $6,250 $5,670 $1,069 $4,601421420 - Space Advertising $1,230 $232 $998421586 - Memberships and Dues $760 $560 $106 $454421753 - Non-IS Telephone & Networ $4,700 $4,958 $1,871 $3,087421765 - IS Telephone & Network On $3,000 $3,240 $611 $2,629421767 - IS Telephone Monthly Char $17,800 $18,123 $3,417 $14,705421768 - IS Telephone Usage Charge $1,700 $1,091 $206 $886421769 - IS Network Monthly Charge $21,000 $24,920 $4,699 $20,221421770 - IS Network Usage Charges $0 $30 $6 $24421900 - Computer Supplies & Perip $7,115 $13,106 $2,471 $10,635421925 - Software $6,000 $3,576 $674 $2,902421935 - IS Mainframe Charges $25 $5 $20421940 - IS Mainframe Charges-not $11 $2 $9422065 - Travel Advance and Tickets $0 $0 $0TOTAL Materials & Services $74,660 $86,553 0.00 0.00 $0 $17,257 $69,296
24a

Cost Object TemplateSAMPLE DATA
FY03 Total Excluded Excluded Excluded * Final IS Roll Up G/L Code & G/L Description FY03 Budget Expenses EFT EFT EFT $ Operations $ Final EFT Cost Pool
Equipment421772 - IS Telephone Equipment Ch $9,800 $9,860 $1,859 $8,001421773 - IS Network Equipment-not $7,300 $9,616 $1,813 $7,803421818 - Equip/Furniture-Major-not $20,000 $19,647 $3,705 $15,942421827 - Equip/Furniture-Minor $24,870 $12,873 $2,427 $10,446TOTAL Equipment $61,970 $51,996 0.00 0.00 $0 $9,804 $42,191
Professional Services/Consulting420298 - Prof essional Services $40,840 $15,776 0 0 $15,776 $0TOTAL Professional Services $40,840 $15,776 0.00 0.00 0.00 $15,776 0.00 $0
TOTAL $1,265,220 $1,101,518 13.00 2.50 $118,000 $47,712 10.50 $940,681Student EFT based on tot hrs/1750hr/yr 3.55 0 $0 3.55Total Benchmarking EFT including Students 16.55 2.50 * 14.05
* Percentage of excluded operating costs based on % of EFT excluded plus specific other costs noted on Exclusion of Effort template* * (Tot cost/$14.50/hr)/1750 hrs/yr
24b

25
4. One-Page Cost Summary
• Summarizes costs by sub-category and EFT from each cost object
• Provides ratio for $ spent per EFT by sub-category
• Establishes final total cost for benchmark activity

One-Page Cost Summary
FY03 FY03 FY03 Excluded FY03 Excluded Final Final CostDescription FY03 Budget Actuals EFT Excl EFT EFT $ Operations $ EFT Pool $/EFT
Salaries $1,800,000 $1,750,000 24.50 5.45 $393,568 19.05 $1,356,432 $71,204
Employee Benefits $414,000 $402,500 $90,521 0.00 $311,979 $16,377
Travel & Professional Development $56,750 $50,000 $8,427 0.00 $41,573 $16,377
Materials & Services $275,000 $300,000 $188,988 0.00 $111,012 $5,827
Equipment $100,000 $75,000 $23,933 0.00 $51,067 $2,681
Professional Services/Consulting $60,000 $55,000 0.00 0.00 $0 $15,776 0.00 $39,224 $2,059
TOTAL $2,705,750 $2,632,500 24.50 5.45 $484,089 $237,125 19.05 $1,911,287 $114,525Plus Student EFT 9.45 2.95 6.50
25.55
Annual Financial Data Exclusions Benchmarking Data
26

27
5. Allocating Cost
• Collected and sorted all cases by topic • Used estimated ‘time to resolve’ as weighting
factor when calculating cost per ticket• Sampled to ensure that ‘time to resolve’ was
roughly proportional to estimated ‘time spent’• Unit cost calculated based on time to resolve all
cases• Cost per case = ‘time to resolve for case X * ‘unit
cost’

28
Operationalize the Method Excel Workbook Formulation
• Top page is summary by sub-category of expense
• Each team contributing to benchmark activity rolls up to the summary page
• Excluded effort page rolls up to each team page to adjust for EFT and cost

29
Project Outcomes
• Process improvements • New and increased abilities to handle
spikes• Marked improvement in performance• Shift in management culture • Data quantified support for IT investment

30
Financial Benchmarks ~ 2002Gauging investment and effectiveness
MIT Stanford Variance
IT Dept Expense / University Expense 2.9% 4.4% N/AHelp Desk Expenses / IT Expenses 4.1% 2.9% N/A Help Desk Expenses / School Pop. $96 $106 10%Help Desk Tickets / School Pop. 2.2 1.8 -18%Pop. Per Help Desk Employee 712 901 27%Help Desk Cases / Help Desk FTE 1,595 1,675 5%Help Desk Expenses / Help Desk Case $41.83 $64.18 53%

31
Key Learnings
• Define your role and responsibilities • Change is constant. Be flexible• Communicate readily• Benchmarking is an iterative process• Unusual events provide interesting analysis• Don’t eliminate important cost component
differences. They tell a story too.• Learn by doing
32
Acknowledgments
• Stanford and MIT Team– Greg Anderson, Anne Denna, Jennifer Dowling-
Dougherty (Project Manager), Barbara Goguen, Rob Smyser, Oliver Thomas, Carol Wood and Esther Yanow for MIT
– Bill Clebsch, Catherine Knipe, Chris Lundin, Lynne Myers, Melissa Janetos and April Wen for Stanford
– Special thanks to Jean Roberge and Sue St. Croix in CAO at MIT

33
MIT/Stanford Benchmarking Project Website
http://web.mit.edu/ist/about/benchmarking

34
Questions?