Nuclear Instruments and Methods in Physics Research A · PDF filemuons and a passive shield...
8
XMASS detector K. Abe a,c , K. Hieda a , K. Hiraide a,c , S. Hirano a , Y. Kishimoto a,c , K. Kobayashi a,c , S. Moriyama a,c , K. Nakagawa a , M. Nakahata a,c , H. Nishiie a , H. Ogawa a,c , N. Oka a , H. Sekiya a,c , A. Shinozaki a , Y. Suzuki a,c , A. Takeda a,c,n , O. Takachio a , K. Ueshima a,1 , D. Umemoto a , M. Yamashita a,c , B.S. Yang a , S. Tasaka b , J. Liu c , K. Martens c , K. Hosokawa e , K. Miuchi e , A. Murata e , Y. Onishi e , Y. Otsuka e , Y. Takeuchi e,c , Y.H. Kim f , K.B. Lee f , M.K. Lee f , J.S. Lee f , Y. Fukuda g , Y. Itow h,d , Y. Nishitani h , K. Masuda h , H. Takiya h , H. Uchida h , N.Y. Kim i , Y.D. Kim i , F. Kusaba j , D. Motoki k,1 , K. Nishijima j , K. Fujii l , I. Murayama l , S. Nakamura l a Kamioka Observatory, Institute for Cosmic Ray Research, The University of Tokyo, Higashi-Mozumi, Kamioka, Hida, Gifu 506-1205, Japan b Information and Multimedia Center, Gifu University, Gifu 501-1193, Japan c Kavli Institute for the Physics and Mathematics of the Universe, the University of Tokyo, Kashiwa, Chiba 277-8582, Japan d Kobayashi-Maskawa Institute for the Origin of Particles and the Universe, Nagoya University, Furo-cho, Chikusa-ku, Nagoya, Aichi 464-8602, Japan e Department of Physics, Kobe University, Kobe, Hyogo 657-8501, Japan f Korea Research Institute of Standards and Science, Daejeon 305-340, South Korea g Department of Physics, Miyagi University of Education, Sendai, Miyagi 980-0845, Japan h Solar Terrestrial Environment Laboratory, Nagoya University, Nagoya, Aichi 464-8602, Japan i Department of Physics, Sejong University, Seoul 143-747, South Korea j Department of Physics, Tokai University, Hiratsuka, Kanagawa 259-1292, Japan k School of Science and Technology, Tokai University, Hiratsuka, Kanagawa 259-1292, Japan l Department of Physics, Faculty of Engineering, Yokohama National University, Yokohama, Kanagawa 240-8501, Japan article info Article history: Received 22 January 2013 Accepted 25 March 2013 Available online 1 April 2013 Keywords: Revision 5 abstract The XMASS project aims to detect dark matter, pp and 7 Be solar neutrinos, and neutrinoless double beta decay using ultra pure liquid xenon. The first phase of the XMASS experiment searches for dark matter. In this paper, we describe the XMASS detector in detail, including its configuration, data acquisition equipment and calibration system. & 2013 Elsevier B.V. All rights reserved. 1. Introduction XMASS is a project aimed at detecting dark matter, pp and 7 Be solar neutrinos and neutrinoless double beta decay using ultra-pure liquid xenon. The original idea is presented in Ref. [1]. The first phase of the XMASS experiment concentrates on dark matter detection. Various astronomical observations [2] provide strong evidence for a large amount of dark matter in the universe. However, its nature is still unknown. Weakly interacting massive particles (WIMPs) are dark matter candidates motivated by theories beyond the Standard Model [3]. This project searches for nuclear recoils in liquid xenon caused by WIMPs. The advantages of using liquid xenon as the target material are, first, liquid xenon yields a large amount of scintillation light, comparable to the yield of a NaI(Tl) scintillator. Second, xenon has a high atomic number ðZ ¼ 54Þ, and liquid xenon has a high density (∼2:9g=cm 3 ). Thus, the target volume can be small, and external background (BG) gamma rays can be absorbed within a short distance from the detector wall. On the other hand, dark matter particles interact uniformly in the detector. By extracting events that occur only in the interior volume of the detector, a sensitive search for dark matter particles can be conducted. The XMASS detector is located at the Kamioka Observatory of the Institute for Cosmic Ray Research, the University of Tokyo, Japan. It is in the Kamioka mine 1000 m underneath the top of Mt. Ikenoyama (i.e. 2700 m water equivalent underground). The detector has two components, the inner and outer detectors (ID and OD, respectively). The ID is equipped with 642 inward-facing photomultiplier tubes (PMTs) in an approximate spherical shape in a copper vessel filled with pure liquid xenon. The amount of liquid xenon in the sensitive region is 835 kg. The ID is installed at the centre of the OD, which is a cylindrical water tank with seventy two 20-in. PMTs. The OD is used as an active shield for cosmic ray Contents lists available at SciVerse ScienceDirect journal homepage: www.elsevier.com/locate/nima Nuclear Instruments and Methods in Physics Research A 0168-9002/$ - see front matter & 2013 Elsevier B.V. All rights reserved. http://dx.doi.org/10.1016/j.nima.2013.03.059 n Corresponding author at: Kamioka Observatory, Institute for Cosmic Ray Research, the University of Tokyo, Higashi-Mozumi, Kamioka, Hida, Gifu 506-1205, Japan. Tel.: +81 578859610. E-mail addresses: [email protected] (Y. Suzuki), [email protected] (A. Takeda). 1 Now at Research Center for Neutrino Science, Tohoku University, Sendai 980- 8578, Japan. Nuclear Instruments and Methods in Physics Research A 716 (2013) 78–85
Transcript of Nuclear Instruments and Methods in Physics Research A · PDF filemuons and a passive shield...

Nuclear Instruments and Methods in Physics Research A 716 (2013) 78–85
Contents lists available at SciVerse ScienceDirect
Nuclear Instruments and Methods inPhysics Research A
0168-90http://d
n Corrthe UniTel.: +81
E-mtakeda@
1 N8578, Ja
journal homepage: www.elsevier.com/locate/nima
XMASS detector
K. Abe a,c, K. Hieda a, K. Hiraide a,c, S. Hirano a, Y. Kishimoto a,c, K. Kobayashi a,c, S. Moriyama a,c,K. Nakagawa a, M. Nakahata a,c, H. Nishiie a, H. Ogawa a,c, N. Oka a, H. Sekiya a,c, A. Shinozaki a, Y. Suzuki a,c,A. Takeda a,c,n, O. Takachio a, K. Ueshima a,1, D. Umemoto a, M. Yamashita a,c, B.S. Yang a, S. Tasaka b, J. Liu c,K. Martens c, K. Hosokawa e, K. Miuchi e, A. Murata e, Y. Onishi e, Y. Otsuka e, Y. Takeuchi e,c, Y.H. Kim f,K.B. Lee f, M.K. Lee f, J.S. Lee f, Y. Fukuda g, Y. Itowh,d, Y. Nishitani h, K. Masuda h, H. Takiya h, H. Uchida h,N.Y. Kim i, Y.D. Kim i, F. Kusaba j, D. Motoki k,1, K. Nishijima j, K. Fujii l, I. Murayama l, S. Nakamura l
a Kamioka Observatory, Institute for Cosmic Ray Research, The University of Tokyo, Higashi-Mozumi, Kamioka, Hida, Gifu 506-1205, Japanb Information and Multimedia Center, Gifu University, Gifu 501-1193, Japanc Kavli Institute for the Physics and Mathematics of the Universe, the University of Tokyo, Kashiwa, Chiba 277-8582, Japand Kobayashi-Maskawa Institute for the Origin of Particles and the Universe, Nagoya University, Furo-cho, Chikusa-ku, Nagoya, Aichi 464-8602, Japane Department of Physics, Kobe University, Kobe, Hyogo 657-8501, Japanf Korea Research Institute of Standards and Science, Daejeon 305-340, South Koreag Department of Physics, Miyagi University of Education, Sendai, Miyagi 980-0845, Japanh Solar Terrestrial Environment Laboratory, Nagoya University, Nagoya, Aichi 464-8602, Japani Department of Physics, Sejong University, Seoul 143-747, South Koreaj Department of Physics, Tokai University, Hiratsuka, Kanagawa 259-1292, Japank School of Science and Technology, Tokai University, Hiratsuka, Kanagawa 259-1292, Japanl Department of Physics, Faculty of Engineering, Yokohama National University, Yokohama, Kanagawa 240-8501, Japan
a r t i c l e i n f o
Article history:Received 22 January 2013Accepted 25 March 2013Available online 1 April 2013
Keywords:Revision 5
02/$ - see front matter & 2013 Elsevier B.V. Ax.doi.org/10.1016/j.nima.2013.03.059
esponding author at: Kamioka Observatory, Instversity of Tokyo, Higashi-Mozumi, Kamioka,578859610.ail addresses: [email protected] (Y.km.icrr.u-tokyo.ac.jp (A. Takeda).ow at Research Center for Neutrino Science, Topan.
a b s t r a c t
The XMASS project aims to detect dark matter, pp and 7Be solar neutrinos, and neutrinoless double betadecay using ultra pure liquid xenon. The first phase of the XMASS experiment searches for dark matter. Inthis paper, we describe the XMASS detector in detail, including its configuration, data acquisitionequipment and calibration system.
& 2013 Elsevier B.V. All rights reserved.
1. Introduction
XMASS is a project aimed at detecting dark matter, pp and 7Besolar neutrinos and neutrinoless double beta decay using ultra-pureliquid xenon. The original idea is presented in Ref. [1]. The first phaseof the XMASS experiment concentrates on dark matter detection.Various astronomical observations [2] provide strong evidence for alarge amount of dark matter in the universe. However, its nature isstill unknown. Weakly interacting massive particles (WIMPs) aredark matter candidates motivated by theories beyond the StandardModel [3]. This project searches for nuclear recoils in liquid xenoncaused by WIMPs. The advantages of using liquid xenon as the target
ll rights reserved.
itute for Cosmic Ray Research,Hida, Gifu 506-1205, Japan.
Suzuki),
hoku University, Sendai 980-
material are, first, liquid xenon yields a large amount of scintillationlight, comparable to the yield of a NaI(Tl) scintillator. Second, xenonhas a high atomic number ðZ ¼ 54Þ, and liquid xenon has a highdensity (∼2:9 g=cm3). Thus, the target volume can be small, andexternal background (BG) gamma rays can be absorbed within ashort distance from the detector wall. On the other hand, dark matterparticles interact uniformly in the detector. By extracting events thatoccur only in the interior volume of the detector, a sensitive searchfor dark matter particles can be conducted.
The XMASS detector is located at the Kamioka Observatoryof the Institute for Cosmic Ray Research, the University of Tokyo,Japan. It is in the Kamioka mine 1000 m underneath the top ofMt. Ikenoyama (i.e. 2700 m water equivalent underground). Thedetector has two components, the inner and outer detectors (IDand OD, respectively). The ID is equipped with 642 inward-facingphotomultiplier tubes (PMTs) in an approximate spherical shape ina copper vessel filled with pure liquid xenon. The amount of liquidxenon in the sensitive region is 835 kg. The ID is installed at thecentre of the OD, which is a cylindrical water tank with seventytwo 20-in. PMTs. The OD is used as an active shield for cosmic ray

72 20inch PMTs (veto)
Calibration system
Water tank
connectedto refrigerator
liquid collectionand circulation
ID
Electronicshut
connectedto circulator
liquid fillingand gas return
LN2 line
10m
10.5m
Fig. 1. OD consisting of water tank and 20 in. PMTs. The ID was installed at the centre of the water tank. Electronics hut on top of the tank records signals from PMTs in the IDand OD. A calibration system is also installed on top of the tank. A refrigerator that liquefies xenon gas and holds liquid xenon is located in the side of tank.
K. Abe et al. / Nuclear Instruments and Methods in Physics Research A 716 (2013) 78–85 79
muons and a passive shield for low-energy gamma rays andneutrons. Construction of the detector started in April 2007 andwas completed in September 2010. Commissioning runs wereconducted from October 2010 to June 2012.
In this paper, we describe the detector in detail, including theactive water shield, ID structure, distillation system, cryogenicsystem, low-BG PMTs, data acquisition equipment, and calibrationsystem.
2. Water shield
A water shield is more suitable than a conventional lead andcopper shield because it produces fewer neutrons from cosmic raysand provides a greater reduction in incoming fast neutrons.A cylindrical water tank 10.5 m in height and 10 m in diameter isused for the radiation shield, and seventy two 20-in. PMTs (HAMA-MATSU R3600) on the inner surface of the tank are used to activelyreject cosmic rays (Fig. 1). The ID was installed at the centre of thewater tank, so the water shield is more than 4 m thick in alldirections. The performance of the shield for gamma rays andneutrons from rock outside the tank was evaluated by a simulationstudy. The study showed that 2 m of water shield reduce the eventrate from external fast neutrons as well as gamma rays to levels thatare insignificant compared to the contributions from the ID PMTsthemselves. The actual size of the current water tank is thereforelarge enough to house future extensions of the XMASS experiment.The water is constantly circulated at 5 ton/h and purified through asystem consisting of filters, an ion-exchanger, a UV sterilizer and amembrane degasifier to remove impurities and radon gas. Radonreduced air processed by charcoal is supplied to the space betweenthe water surface and top of the water tank.
3. Structure of ID
The detector employs single-phase liquid xenon and uses onlyscintillation light emitted by dark matter or other interactions.No electric field is necessary as no ionization signal is extractedfrom the liquid. This makes it possible to realize a large scaledetector and maximize the detector uniformity and volume-to-surface ratio. Pulse shape discrimination for single-phase liquidxenon is also being studied [4].
Fig. 2 shows the structure of the ID. Six hundred and thirtyhexagonal PMTs (HAMAMATSU R10789-11) and twelve round PMTs(HAMAMATSU R10789-11MOD) are mounted in an oxygen free highconductivity (OFHC) copper holder with an approximately sphericalshape called a pentakis dodecahedron. Because the photo-cathodearea is maximized using hexagonal PMTs, a photo coverage of morethan 62% is achieved. The quantum efficiency at the scintillationwavelength of liquid xenon (∼175 nm) is more than 28%. The shapeof the pentakis dodecahedron consists of 60 isosceles triangles. Onetriangular module holds approximately 10 PMTs. The entire structureis immersed in liquid xenon. The vessel consists of outer and innerOFHC copper vessels 1280 mm and 1120 mm in diameter, respec-tively. The inner vessel holds liquid xenon and the PMT holder, andthe outer vessel is used for vacuum insulation. To reduce the amountof liquid xenon, an OFHC copper filler is installed in the gap betweenthe PMT holder and the inner vessel.
To avoid cosmogenic activation, the copper material used forthe PMT holder and vessels was brought into the Kamioka minewithin 1 month after it was electrorefined by Mitsubishi MaterialsCo., Ltd. From there it was sent to the company where the PMTholder was made, and then the holder was sent to the Kamiokamine. The total exposure time of copper on the surface was lessthan 130 days. This way, the production of 60Co, which is one of

OFHC copper vessel
~1.2mPMTs642
xenon835kgPentakis dodecahedron
HAMAMATSUR10789
Fig. 2. Structure of the ID.
Fig. 3. Flow map of xenon circulation and purification system for the XMASS detector.
K. Abe et al. / Nuclear Instruments and Methods in Physics Research A 716 (2013) 78–8580
the cosmogenic isotopes in copper [5], was kept below ourrequired level (0.25 mBq/kg). The estimated BG from 60Co incopper is negligible compared with our main BG because of thePMTs. To clean the surface after processing the PMT holder waschemically etched, while the inner surface of the inner vesselholding the xenon was electropolished, both to reduce radon andhydrogen emanation and 210Pb contamination.
PMT mounting and detector assembly were performed insidea clean booth constructed in the water tank from December 2009to September 2010. During the work, the radon concentration inthe water tank was maintained at approximately 200 mBq/m3,which is 1/100 of that in the atmosphere, and the dust level wasless than 1000 particles/ft3 (particle size 40:5 μm).
4. Distillation system
Xenon does not have long-lived radioactive isotopes, which isone of its most important advantages for a rare event search such
as a dark matter search. However, commercial xenon containsa small amount (0.1–1 ppm) of krypton, which has a radioactiveisotope, 85Kr (half-life of 10.76 years). The xenon acquired for theXMASS detector had a Kr/Xe content of 340 ppb, and a 85Kr/Krratio of ð0:670:2Þ � 10−11. This 85Kr/Kr ratio is an actual measuredvalue. After the distillation, xenon with high Kr concentration wasobtained as off-gas, which enabled us to measure 85Kr using a highpurity germanium (HPGe) detector. Our requirement for Kr/Xe isless than 2 ppt. Together with a company we developed a proto-type distillation system that achieved a Kr/Xe value of 3.371.1ppt; the details are reported in Ref. [6]. In order to process 1.2 tonof xenon for the XMASS detector, a new, high throughput systemwas built. The new distillation system has a tower length of2915 mm and column diameter of 40 mm. It is designed to reducethe amount of Kr by five orders of magnitude with one pass. Thesystem can collect purified xenon with 99% efficiency. The systemhad a process flow rate of 4.7 kg/h, and 1.2 ton of xenon wasprocessed in 10 days before it was introduced into the detector.During the commissioning run, a sample was taken and itskrypton concentration was measured by atmospheric pressure

K. Abe et al. / Nuclear Instruments and Methods in Physics Research A 716 (2013) 78–85 81
ionization mass spectroscopy (API-MS). No excess over the BGlevel of the API-MS was found, and an upper limit of 2.7 ppt wasobtained for its krypton contamination.
Table 1Radioactive contaminants in the hexagonal PMT (R10789-11) and its base.All values are in units of mBq=PMT. Decay gamma rays were measured with HPGedetectors. The observed gamma ray spectrum was analyzed using efficienciesevaluated by Monte Carlo simulation. To evaluate the uranium and thorium chain,gamma rays from 214Pb and 214Bi, and 228Ac, 212Pb 212Bi and 208Tl, were used.
Isotopes Radioactivity (mBq/PMT)
214Pb, 214Bi (U-chain) 0:7070:28228Ac, 212Pb, 212Bi, 208Tl (Th-chain) 1:570:3140K o5:160Co 2:970:16
5. Xenon circulation and purification system
Fig. 3 shows the flow map of the xenon circulation andpurification system for the XMASS detector. Xenon was kept inthe liquid xenon reservoir tank before the experiment. A 200 Wcooling power pulse tube refrigerator (PC105U, IWATANI) andvacuum insulation held the liquid xenon. The heat leakage wasless than 50 W. A rod heater in the liquid can evaporate the xenon.
When we filled the ID with liquid xenon, xenonwas evaporatedin the reservoir tank using the rod heater at approximately 300 W.The evaporated gas was purified by two getters (PS4-MT15, SAES),which are connected in series, at a flow rate of 30 L/min. The firststage getter was operated at high temperature, as designed, butthe second one was operated at room temperature to obtain betterperformance for removing hydrogen impurities. The purified gaswas monitored by a frost point meter (Pura, Michell Instruments),and the measured value was less than −120 1C at 0.06 MPa, whichcorresponded to less than 0.09 ppb water in the gas. Before the IDwas filled with liquid xenon, it was cooled by liquid nitrogen to−100 1C, and the xenon gas was liquefied by two pulse refrigera-tors (PC105U, IWATANI) each having a cooling power of 200 W.It takes 5 days to fill the ID with liquid xenon in this way.
After the first filling, we collected the liquid xenon from the IDto the reservoir tank at a liquid flow rate of 2 L/min. We completedthe xenon collection in approximately 3 h. This empty-refillprocedure with purification was repeated two times, and anincrease in light yield of approximately 16% compared with thatobtained after the first filling was observed with a 57Co source.The radon concentration in the liquid xenon was evaluated fromdata recorded in the XMASS detector. The obtained values were8.270.5 mBq for 222Rn and o0:28 mBq for 220Rn. Although theBG level caused by radon was estimated to be sufficiently low(∼10−4 keV−1 kg−1 day−1 at 5 keV) by a simulation study, furtherstudy for reduction of radon continues [7].
One of the two pulse refrigerators is used to maintain the liquidxenon temperature in the ID during normal operation. Less than35 W of cooling power are needed to compensate for heat leakage.Should the xenon gas pressure above the liquid surface in the IDchange for some reason safety system will automatically be acti-vated. The first system uses liquid nitrogen to reduce the tempera-ture in the ID in case e.g. the electrically powered refrigerator fails.The second system collects the xenon by compressing the evapor-ating gas into two 10 m3 emergency gas tanks. All gas lines areprotected by a appropriately chosen rupture disk.
We can also circulate and purify the liquid xenon in the IDusing a liquid xenon circulator and filter. The circulation speed is2 L/min as liquid. Liquid lines are connected from the inside/outside and top/bottom sides of the PMT holder to the circulator.The circulation lines can be selected by valve operation.
Table 2Radioactive contaminants in the Kovar sample. All values are in units of mBq/PMT.Isotopes for the thorium chain are the same as those in Table 1. Note that only asmall fraction of the Kovar body is protruding into the ID volume through.
Isotopes Kovar sample (mBq/PMT)
234Th o2:2214Bi o0:4210Pb o6:4Th-chain o0:32
6. Low-BG PMT
Because gamma rays and high-energy neutrons from the out-side are shielded against by the OD, the major origin of the BG wasexpected to be gamma rays from radioactive impurities inside theID PMTs. To minimize the BG, we developed low-radioactivityPMTs (R10789-11 and R10789-11MOD) with Hamamatsu Photo-nics K.K. giving special attention to radioactive contaminants intheir components. Table 1 shows the radioactive contaminants in a
PMT, including its voltage divider base as evaluated with HPGedetectors.
During the commissioning run further measurements for Kovaralloy (body of PMT) and aluminium components (sealing betweenthe PMT body and its window) by HPGe were made to estimatetheir contribution of low-energy gamma rays and related beta raysin addition to high-energy gamma rays from radioactive isotopes.Because Kovar and aluminium components are in contact with theliquid xenon of the sensitive region, beta rays from a radioactiveisotope possibly contribute to the BG. Although a quartz window isalso in contact with the liquid xenon, BG events occurring in thefront of the window from its contaminants can be easily rejectedusing information of hit pattern of PMTs. Because we cannotmeasure the Kovar and aluminium components currently withthe XMASS detector, we measured samples of the same materialsproduced by the same company. Tables 2 and 3 shows radioactivecontaminants in Kovar and aluminium samples, respectively.Significant amounts of 234Th and 210Pb were found in aluminiumsamples.
Three samples were used for the measurements of aluminiumcomponents. Sample 1 consists of leftovers from the actual PMTproduction; ∼15% of the PMTs in the XMASS detector were fabricatedwith materials from this particular batch. To evaluate variability ofcontaminants between batches, we also measured a sample 2 withmaterial from the prototype production for our PMTs, and finally asample 3 which is a bulk sample from the same supplier as theprevious samples. The results show the existence of the contaminants234Th, 210Pb and 232Th inside the aluminium components used for thePMTs although the contaminants of 214Bi in the same uranium chainare much smaller [8]. Concentrations of uranium and thorium insample 1 were confirmed by Hamamatsu Photonics K.K. usinginductively coupled plasma-mass spectrometry (ICP-MS) as shownin Table 4. The contributions of these materials to the observed BGwillbe described elsewhere.
7. Material selection
All the components and materials used for the detector werecarefully vetted. More than 250 potential candidates for compo-nents were measured with the HPGe detectors. The criterion formaterial selection was that based on our simulation no material
K. Abe et al. / Nuclear Instruments and Methods in Physics Research A 716 (2013) 78–8582
should contribute more than a small fraction of the BG expectedfrom the PMTs.
The radon emanation from components inside the ID was alsomeasured by a highly sensitive radon detector [9] before construc-tion. After detector construction, the radon concentration in thedetector's liquid xenon was evaluated by analyzing the data fromthe XMASS detector.
Impurity elution from the components was also checkedbeforehand in terms of the degradation of the light yield. For thiswe used a small test chamber consisting of two PMTs (R10789-11)and ∼3 kg of liquid xenon.
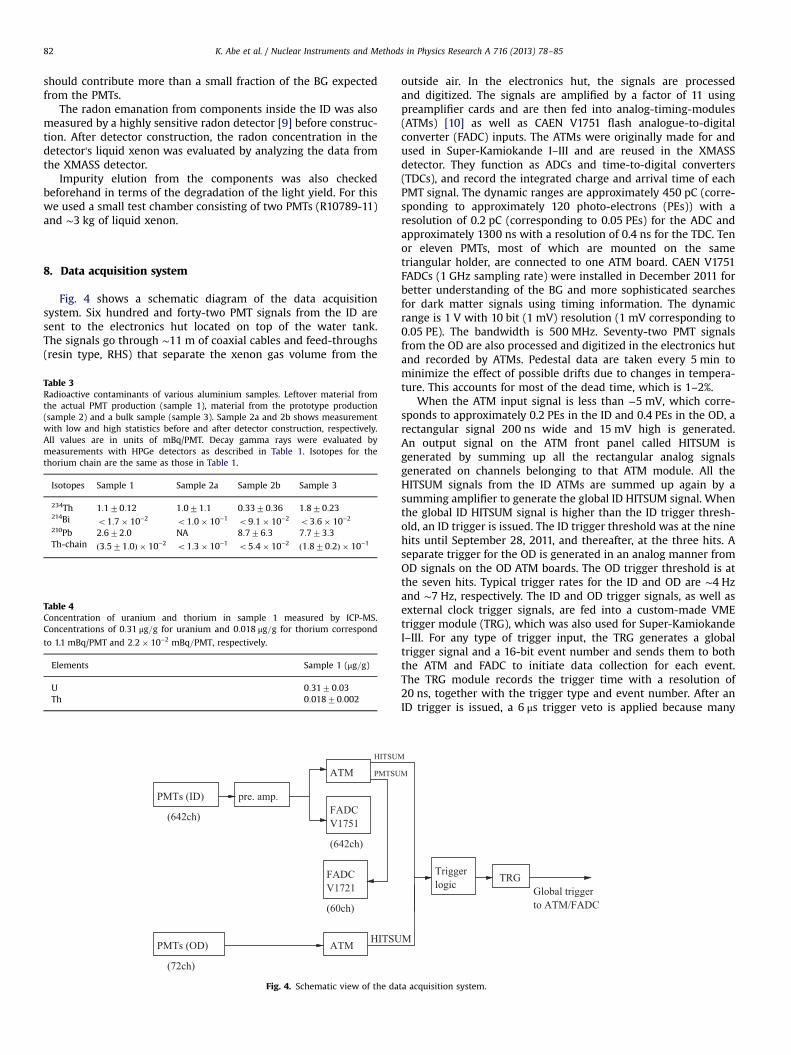
8. Data acquisition system
Fig. 4 shows a schematic diagram of the data acquisitionsystem. Six hundred and forty-two PMT signals from the ID aresent to the electronics hut located on top of the water tank.The signals go through ∼11 m of coaxial cables and feed-throughs(resin type, RHS) that separate the xenon gas volume from the
ATM
(72ch)
PMTs (OD) HITSU
ATM
(642ch)
PMTs (ID)
PMTSU
HITSUM
pre. amp.FADCV1751
FADCV1721
(642ch)
(60ch)
Fig. 4. Schematic view of the da
Table 3Radioactive contaminants of various aluminium samples. Leftover material fromthe actual PMT production (sample 1), material from the prototype production(sample 2) and a bulk sample (sample 3). Sample 2a and 2b shows measurementwith low and high statistics before and after detector construction, respectively.All values are in units of mBq/PMT. Decay gamma rays were evaluated bymeasurements with HPGe detectors as described in Table 1. Isotopes for thethorium chain are the same as those in Table 1.
Isotopes Sample 1 Sample 2a Sample 2b Sample 3
234Th 1:170:12 1:071:1 0:3370:36 1:870:23214Bi o1:7� 10−2 o1:0� 10−1 o9:1� 10−2 o3:6� 10−2
210Pb 2:672:0 NA 8:776:3 7:773:3Th-chain ð3:571:0Þ � 10−2 o1:3� 10−1 o5:4� 10−2 ð1:870:2Þ � 10−1
Table 4Concentration of uranium and thorium in sample 1 measured by ICP-MS.Concentrations of 0:31 μg=g for uranium and 0:018 μg=g for thorium correspond
to 1.1 mBq/PMT and 2:2� 10−2 mBq=PMT, respectively.
Elements Sample 1 (μg=g)
U 0:3170:03Th 0:01870:002
outside air. In the electronics hut, the signals are processedand digitized. The signals are amplified by a factor of 11 usingpreamplifier cards and are then fed into analog-timing-modules(ATMs) [10] as well as CAEN V1751 flash analogue-to-digitalconverter (FADC) inputs. The ATMs were originally made for andused in Super-Kamiokande I–III and are reused in the XMASSdetector. They function as ADCs and time-to-digital converters(TDCs), and record the integrated charge and arrival time of eachPMT signal. The dynamic ranges are approximately 450 pC (corre-sponding to approximately 120 photo-electrons (PEs)) with aresolution of 0.2 pC (corresponding to 0.05 PEs) for the ADC andapproximately 1300 ns with a resolution of 0.4 ns for the TDC. Tenor eleven PMTs, most of which are mounted on the sametriangular holder, are connected to one ATM board. CAEN V1751FADCs (1 GHz sampling rate) were installed in December 2011 forbetter understanding of the BG and more sophisticated searchesfor dark matter signals using timing information. The dynamicrange is 1 V with 10 bit (1 mV) resolution (1 mV corresponding to0.05 PE). The bandwidth is 500 MHz. Seventy-two PMT signalsfrom the OD are also processed and digitized in the electronics hutand recorded by ATMs. Pedestal data are taken every 5 min tominimize the effect of possible drifts due to changes in tempera-ture. This accounts for most of the dead time, which is 1–2%.
When the ATM input signal is less than −5 mV, which corre-sponds to approximately 0.2 PEs in the ID and 0.4 PEs in the OD, arectangular signal 200 ns wide and 15 mV high is generated.An output signal on the ATM front panel called HITSUM isgenerated by summing up all the rectangular analog signalsgenerated on channels belonging to that ATM module. All theHITSUM signals from the ID ATMs are summed up again by asumming amplifier to generate the global ID HITSUM signal. Whenthe global ID HITSUM signal is higher than the ID trigger thresh-old, an ID trigger is issued. The ID trigger threshold was at the ninehits until September 28, 2011, and thereafter, at the three hits. Aseparate trigger for the OD is generated in an analog manner fromOD signals on the OD ATM boards. The OD trigger threshold is atthe seven hits. Typical trigger rates for the ID and OD are ∼4 Hzand ∼7 Hz, respectively. The ID and OD trigger signals, as well asexternal clock trigger signals, are fed into a custom-made VMEtrigger module (TRG), which was also used for Super-KamiokandeI–III. For any type of trigger input, the TRG generates a globaltrigger signal and a 16-bit event number and sends them to boththe ATM and FADC to initiate data collection for each event.The TRG module records the trigger time with a resolution of20 ns, together with the trigger type and event number. After anID trigger is issued, a 6 μs trigger veto is applied because many
logicTrigger TRG
Global triggerto ATM/FADC
M
M
ta acquisition system.

Table 5Number of sensor channels in the status monitorsystem.
Items Number of channels
Temperature 117Pressure 18Liquid xenon level 3Vacuum 4Refrigerator heater duty 5Water purification 22Radon level 8ID HV 648OD HV 72Others 57
Total 954
K. Abe et al. / Nuclear Instruments and Methods in Physics Research A 716 (2013) 78–85 83
after pulses due to high energy events would issue unnecessarytriggers.
The ATM outputs the PMTSUM signal, which is an analoguesum of the 12 channels in one board, after the signal is attenuatedby a factor of eight compared to the input signal. Because we have60 ATM boards, 60 PMTSUM signals are fed into some older CAENV1721 FADCs, which have a 500 MHz sampling rate. We startedrecording these waveforms in February 2011. The dynamic range ofthese FADCs is 1 V with 8 bit (4 mV) resolution, corresponding to a1.25 PE pulse height. The acquisition window is 4 μs (approxi-mately 1 μs before the trigger and 3 μs after it). The FADC data areprimarily used for understanding the BG.
9. Status monitor
The status of the detector and its environment is monitored tomaintain stable data acquisition and safe operation. Many sensorsfor temperature, pressure, liquid xenon level, cryostat vacuum andPMT voltages and currents, etc. are monitored. Table 5 summarizesthe number of sensor channels. Readings from the sensors relatedto the liquid xenon status are examined every second by a web-based alert system. Two shift workers who are always present atthe laboratory also cross-check the status using on-site displayinstruments every hour. The pressure and temperature of thedetector in normal operation were 0.165 MPa (abs.) and −991 C,respectively. Except for some special data acquisition periods, thepressure change in the ID was within 0.006 MPa, and the tem-perature change in the ID was within 1.2 1C.
The PMT gain stability is monitored with signals generated byblue LEDs in the ID. A total of eight LEDs with Teflon diffusers areembedded in holes on the surface of the ID PMT holder. One PEsignal was taken with a low hit occupancy every week, and theADC mean was used to check the stability. The PMT gain is stablewithin 75%.
10. Commissioning run
During the commissioning period, various types of data weretaken in addition to normal run data for the dark matter search.Calibration runs using radioactive sources for better modeling ofthe detector in a simulation are summarized in the next section.The runs in Table 6 were used for optimization of the detectoroperation for the dark matter search and further understanding ofthe BG. High- and low-pressure runs using O2-doped liquid xenon(O2 injection run) and heat injection to produce higher fluctua-tions in the density of liquid xenon (boiling run) were made toexplore the liquid xenon's optical properties. A gas run was madeto understand the BG from the ID's inner surface. For this run, the
ID was filled with xenon gas instead of liquid. These runs wereuseful for understanding various conditions of the detector as wellas the BG. The details on them will be described elsewhere.Science results from the commissioning run are presented inRefs. [11,12].
11. Calibration
A calibration system is connected to the ID. This system enablesus to drive a radioactive source inside the ID PMT holder along thevertical axis (z-axis) with a precision of better than 1 mm). Fig. 5shows the calibration system, which consists of a radioactive source,an OFHC copper rod, a thin stainless steel wire and a steppingmotor. The radioactive source can be mounted at the tip of theOFHC copper rod. The rod is hung by the thin stainless steel wire,lowered through a guide pipe and inserted into the ID using amotion feed-through and stepping motor on top of the water tank.
The radioactive source can be exchanged without interruptingdetector operation. The source and their corresponding energiesare summarized in Table 7. 241Am and 57Co have a diameter of0.21 mm, which is much smaller than the absorption lengths for59.5 and 122 keV gamma rays in liquid xenon (∼0:44 mm and∼2:5 mm, respectively). This reduces the shadow cast by thesource assembly in the scintillation light pattern of these sources.All enclosure assemblies used in the XMASS detector so far arecylindrical.
There is also an external calibration system. A U-shaped softhose was attached to the outside of the vessel. A radioactive sourcecan be moved around the detector through the hose. This makes itpossible to study the detector response to the external radiation.
12. Detector simulation
An XMASS detector Monte Carlo (MC) simulation package basedon Geant4 [13] has been developed. The particle tracks, scintillationprocess, propagation of scintillation photons, PMT response andreadout electronics are simulated by this MC package.
Fig. 6 shows the geometry of the ID in the XMASS MC. Thecopper vessel is also defined, but it is omitted in the figure. Fortracing each scintillation photon, the precise geometries and opticalproperties of all the components in contact with liquid xenon aredefined. Several optical parameters need to be determined experi-mentally. They are the absorption and scattering coefficients ofliquid xenon, reflectance at the inner surface of the PMT copperholder and the aluminium strip on the PMT window, refractiveindices of liquid xenon and the quartz PMT window, and thereflection and absorption probabilities at a PMT photo-cathode.These parameters were tuned so that the observed numbers of PEs(n PEs) in each PMT in the simulated samples reproduce those inthe data for various source positions. Fig. 7 shows the n PE spectrumobserved using the 57Co source at z¼ 0 cm and the MC result. The nPE distribution was reproduced well by the MC, and a high lightyield, 14.771.2 PE/keV was obtained.
The MC tracks the incident particles and any energy depositedthrough various interactions. From the deposited energies in eachvertex, scintillation photons are generated by taking into accountthe dependence on energy and nature of the depositing particle,implementing a realistic, non-linear scintillation efficiency [14].This effect results in non-linearity of the scintillation efficiency.The energy distribution of the scintillation photons is based on themeasured value [15] which is a Gaussian distribution with a meanvalue of 7.078 eV and standard variation of 0.154 eV. The propaga-tion of scintillation photons is simulated and photons absorbed atthe photo-cathode of the PMT are treated as detected PEs, taking

Table 7Calibration sources and energies. The 8 keV (n1) in the 109Cd and 59.3 keV (n2) inthe 57Co source are Kα X-rays from the copper and tungsten, respectively, used forsource housing.
Isotopes Energy (keV) Shape
55Fe 5.9 Cylinder109Cd 8(*1), 22, 58, 88 Cylinder241Am 17.8, 59.5 Thin cylinder57Co 59.3(*2), 122 Thin cylinder137Cs 662 Cylinder
Table 6Special commissioning run summary.
Run condition Operation term
High-pressure run (0.23 MPa (abs.)) From March 25, 2011 to April 10, 2011Low-pressure run (0.13 MPa (abs.)) From April 13, 2011 to May 4, 2011O2 injection run From September 28, 2011 to January 11, 2012Boiling run From January 4, 2012 to January 10, 2012Gas run From January 13, 2012 to January 24, 2012
OFHC copper rod and source
gate valve
source exchange
OFHC copper rod
stepping motor
Flange for
movedalong z−axis
guide pipe
Calibration systemon the tank top
ID
Fig. 5. Calibration system on top of the tank. Source placed on the edge of the copper rod is inserted into the ID and can be moved along the z-axis.
Outside view Inside view
PMT (R10789−11)PMTs and PMT holder
Fig. 6. ID geometry, excluding vessels, in MC. Upper right: geometry of onehexagonal PMT. Upper left: part of PMT holder and some PMTs. Bottom: entirePMT holder and PMTs: outside and inside view.
K. Abe et al. / Nuclear Instruments and Methods in Physics Research A 716 (2013) 78–8584
into account the quantum efficiency of each PMT. The response ofeach PMT for single photon detection is also simulated on the basisof a single photon distribution measured using low-intensity LEDs.
Although our MC considers the non-linearity of the scintillationefficiency, some deviations exist in the total nPE from dataobtained for gamma rays with energies less than 122 keV. Fig. 8shows the ratios of the observed n PE and predicted n PE by theMC. This deviation is treated as the systematic error at the energyscale of our detector.
13. Vertex reconstruction
The vertex positions and energies of events were reconstructedusing n PE information from the PMTs. For various grid positionsinside the ID, expected n PE distributions in each PMT werecalculated in the MC. We use positions on a Cartesian grid, onradial lines from the centre of the detector, and on the innersurface of the detector including gaps between PMTs. Thesedistributions are normalized so that they can be used as theprobability density functions (PDFs) for each grid position. Theprobability, pi(n), that the ith PMT detects n PE is calculated usingthe PDF. The likelihood that the vertex is in the assumed position xis the product of all piðniÞ
LðxÞ ¼ ∏642
i ¼ 1piðniÞ ð1Þ
where ni represents n PE for the ith PMT. The most likely positionis obtained by maximizing L.
The performance of the vertex and energy reconstruction wasevaluated using several types of radioactive sources. The upperpanel of Fig. 9 shows the energy spectrum reconstructed using thesame data set in Fig. 7. The energy resolution for 122 keV gammarays is 4% (rms). The lower panel of Fig. 9 shows the reconstructed

0.6
0.7
0.8
0.9
1
1.1
1.2
0 20 40 60 80 100 120
Cal
ibra
tion
data
/ Sim
ulat
ion
Electron equivalent energy [keVee]
Fitted
Fig. 8. Comparison of energy scales in calibration data and MC.
Fig. 9. Energy spectra reconstructed using the 57Co source at z¼0 cm (upper) andvertex distributions reconstructed using the same source at z¼−40, −30,…, 40 cm(lower).
0
0.2
0.4
0.6
0.8
1
0 500 1000 1500 2000 2500
Eve
nts
(nor
mal
ized
)
total nPEs
real datasimulation (MC)
Fig. 7. Observed n PE spectrum using the 57Co source at z¼ 0 cm (red dots).Simulated spectrum is shown as blue histogram. (For interpretation of the referencesto color in this figure caption, the reader is referred to the web version of this article.)
K. Abe et al. / Nuclear Instruments and Methods in Physics Research A 716 (2013) 78–85 85
vertices for various 57Co source positions. The observed positionresolution (rms) is 1.4 cm at z¼0 cm and 1.0 cm at z¼720 cm for122 keV gamma rays. The distributions of the reconstructed
energy and vertices for 122 keV gamma rays are reproduced wellby the MC.
14. Conclusion
The construction of the XMASS detector was completed inSeptember 2010 and commissioning runs were conducted fromOctober 2010 to June 2012.
The XMASS detector is the world's largest (ton scale) single-phase liquid xenon detector for dark matter searches. The key ideafor BG reduction is self-shielding using vertex reconstruction. Theposition and energy resolution along the z-axis inside the detectorwere measured with radioactive sources and are well reproducedby MC. The observed position and energy resolution for 122 keVgamma rays are 1.0 cm at z¼720 cm and 4% (rms) at z¼0 cm,respectively.
A high light yield, 14:771:2 PE=keV, was obtained owing to thelarge photocoverage (462%) and small amount of impurities in theliquid xenon. This was achieved by careful control of dust and radonduring construction and purification by liquid collection and fillingwith purified gas. The concentrations of radon (8:270:5 mBq=835 kgfor 222Rn and o0:28 mBq=835 kg for 220Rn) and krypton (o2:7 ppt)in liquid xenon are also the lowest among liquid xenon detectorsfor dark matter searches.
Acknowledgments
We gratefully acknowledge the co-operation of KamiokaMining and Smelting Company. This work was supported bythe Japanese Ministry of Education, Culture, Sports, Science andTechnology, Grant-in-Aid for Scientific Research, and partly sup-ported by the National Research Foundation of Korea Grant fundedby the Korean Government (NRF-2011-220-C00006).
References
[1] Y. Suzuki, arXiv:hep-ph/0008296.[2] K.G. Begeman, A.H. Broeils, R.H. Sanders, Monthly Notices of the Royal
Astronomical Society 249 (1991) 523;J. Dunkley, et al., Astrophysical Journal Supplement 180 (2009) 306;R.A. Knop, et al., Astrophysical Journal 598 (2003) 102;S.W. Allen, et al., Monthly Notices of the Royal Astronomical Society 334(2002) L11;M. Tegmark, et al., Physical Review D 69 (2004) 103501.
[3] H.C. Cheng, et al., Physical Review Letters 89 (2002) 211301;A. Birkedal-Hansen, J.G. Wacker, Physical Review D 69 (2004) 065022;A. Bottino, et al., Physical Review D 69 (2004) 037302;J. Ellis, et al., Physical Review D 71 (2005) 095007.
[4] K. Ueshima, et al., the XMASS Collaboration, Nuclear Instruments and Methodsin Physics Research Section A 659 (2011) 161.
[5] M. Laubenstein, G. Heusser, Applied Radiation and Isotopes 67 (2009) 750.[6] K. Abe, et al., the XMASS Collaboration, Astroparticle Physics 31 (2009) 290.[7] K. Abe, et al., the XMASS Collaboration, Nuclear Instruments and Methods in
Physics Research Section A 661 (2012) 50.[8] I. Lawson, B. Cleveland, in: the Proceedings of the Low Radioactivity Techni-
ques, LRT2010, AIP Conference Proceedings, Sudbury, Canada, 28–29 August2010, pp. 68–77.
[9] Y. Takeuchi, et al., Nuclear Instruments and Methods in Physics ResearchSection A 421 (1999) 334.
[10] H. Ikeda, et al., Nuclear Instruments and Methods in Physics Research SectionA 320 (1992) 310;S. Fukuda, et al., Nuclear Instruments and Methods in Physics Research SectionA 501 (2003) 418.
[11] K. Abe, et al., the XMASS Collaboration, Physics Letters B 719 (2013) 78–82.[12] K. Abe, et al., the XMASS Collaboration arXiv:1212.6153.[13] S. Agostinelli, et al., Nuclear Instruments and Methods in Physics Research
Section A 506 (2003) 250.[14] T. Doke, et al., in: the Proceedings of the International Workshop on Technique
and Application of Xenon Detectors, Xenon01, World Scientific, the Universityof Tokyo, Japan, 3–4 December 2001, pp. 17–27.
[15] Y. Endo, et al., JSAP: The 72th Autumn Meeting, 2011, 30a-T-8.