NRB Bearings CMP - Spark Capitalmailers.sparkcapital.in/uploads/Mukesh/NRB_Bearings... · NRB...
19
NRB Bearings CMP Rs. 122 Target Rs. 155 Rating Buy Date Sep 23, 2014 Market Data SENSEX 27207 Nifty 8146 Bloomberg NRBBR IN Shares o/s 97mn Market Cap Rs. 12bn 52-wk High-Low Rs. 133-31 3m Avg. Daily Vol Rs. 42mn Index member BSESMCAP Latest shareholding (%) Initiating Coverage Moving the needle NRB Bearings (NRB) is the leading needle roller bearing supplier in India with a 70% market share. The company has created a niche by catering to customized requirements. With exposure to all domestic auto segments we expect the OEM demand revival to result in strong domestic revenue growth (FY14-FY17: ~16% CAGR ). Exports are expected to record 25% CAGR driven by new orders from key customers, Getrag and ZF. PAT CAGR of 43% from FY14-FY17 is driven by EBITDA margin improving to 22% in FY17. NRB is currently trading at (11.8x Sep’16 EPS) a steep discount to its peers. We initiate with a Buy rating and TP of Rs. 155 based on 15x Sep’16 EPS Strong domestic growth visible: NRB is among the few needle bearings manufacturers globally and has technology at par with MNCs. The company maintains strong relationship with OEMs by way of partnering from conceptualisation stage and manufacturing customized bearings. Key USP of NRB is to maintain large number of SKUs (2.5x that of nearest competitor), ability to supply smaller batch sizes and faster turn around time. With exposure to 2W (25% of domestic), CV (20%) and PV(20%) we expect domestic revenue to see strong growth with revival in CV and PV volumes and continued growth in 2W volumes. After market business has seen slower growth as NRB focused on OEM and exports in the recent years. However, with renewed focus and plans to supply kits in the aftermarket (including other complementary products) we expect aftermarket growth to improve and record a CAGR of 13% from FY14 – FY17 Steep exports growth: NRB’s technology to manufacture needle roller bearings has been inherited through its acquisitions of JVs with Nadella (France) and INA (Germany) who are currently among the leaders of needle roller 1 Stock performance (%) 1m 3m 12m NRB 15% 53% 276% Sensex 3% 8% 34% BSE Auto 7% 23% 63% Financial summary (Standalone) Year Revenues (Rs. mn) EBITDA (Rs. mn) EBITDA Margin % PAT (Rs. mn) EPS (Rs.) P/E (x) EV/EBITDA (x) FY14 5,945 1,006 16.9% 382 3.9 31.0 14.6 FY15E 6,792 1,324 19.5% 568 5.9 20.8 10.9 FY16E 8,186 1,760 21.5% 864 8.9 13.7 8.0 Find Spark research on Bloomberg (SPAK <go>), Thomson First Call, Reuters Knowledge and Factset Promoters 60.1 Institutions 23.8 Public 16.1 Mukesh Saraf [email protected] +91 44 4344 0041 Rohit Krishna [email protected] +91 44 4344 0020 bearings globally. With global OEMs and Tier-1 suppliers looking to expand vendor base with every new platform, NRB has a large scope given its ability to customize and supply at competitive prices. Currently, Getrag and ZF are key customers and are expected to drive growth in the near future. We expect 25% exports CAGR from FY14-FY17. Margin improvement: We expect NRB’s EBITDA margin to go back to its peak levels of 22% in FY17 driven primarily by steep volume growth and better product mix through higher exports and improvement in CVs. Historically, margin movements have mirrored 2W and CV OEM volumes and the expected pick-up in volumes augurs well for NRB Our analysis comparing NRB to SKF India, FAG India and Timken India suggests that NRB is the only company with in- house R&D and no royalty payments. NRB’s EBITDA margins are the best due to absence of traded products, which is also the reason for lower asset turns. Working capital is the highest due to lower after market exposure, higher SKUs and exports resulting in inventory at overseas warehouses. Net/net NRB stacks well amongst the MNC peers and we believe margin, revenue growth (current cap utilization of 65-70%) along with debt reduction would result in ~20% ROCE by FY17
Transcript of NRB Bearings CMP - Spark Capitalmailers.sparkcapital.in/uploads/Mukesh/NRB_Bearings... · NRB...

NRB Bearings CMP
Rs. 122
Target
Rs. 155
Rating
Buy
Date Sep 23, 2014
Market Data
SENSEX 27207
Nifty 8146
Bloomberg NRBBR IN
Shares o/s 97mn
Market Cap Rs. 12bn
52-wk High-Low Rs. 133-31
3m Avg. Daily Vol Rs. 42mn
Index member BSESMCAP
Latest shareholding (%)
Initiating Coverage
Moving the needle
NRB Bearings (NRB) is the leading needle roller bearing supplier in India with a 70% market share. The companyhas created a niche by catering to customized requirements. With exposure to all domestic auto segments weexpect the OEM demand revival to result in strong domestic revenue growth (FY14-FY17: ~16% CAGR ). Exportsare expected to record 25% CAGR driven by new orders from key customers, Getrag and ZF. PAT CAGR of 43%from FY14-FY17 is driven by EBITDA margin improving to 22% in FY17. NRB is currently trading at (11.8x Sep’16EPS) a steep discount to its peers. We initiate with a Buy rating and TP of Rs. 155 based on 15x Sep’16 EPS
Strong domestic growth visible: NRB is among the few needle bearings manufacturers globally and has technology at
par with MNCs. The company maintains strong relationship with OEMs by way of partnering from conceptualisation stage
and manufacturing customized bearings. Key USP of NRB is to maintain large number of SKUs (2.5x that of nearest
competitor), ability to supply smaller batch sizes and faster turn around time. With exposure to 2W (25% of domestic), CV
(20%) and PV(20%) we expect domestic revenue to see strong growth with revival in CV and PV volumes and continued
growth in 2W volumes. After market business has seen slower growth as NRB focused on OEM and exports in the recent
years. However, with renewed focus and plans to supply kits in the aftermarket (including other complementary products)
we expect aftermarket growth to improve and record a CAGR of 13% from FY14 – FY17
Steep exports growth: NRB’s technology to manufacture needle roller bearings has been inherited through its
acquisitions of JVs with Nadella (France) and INA (Germany) who are currently among the leaders of needle roller
1
Stock performance (%)
1m 3m 12m
NRB 15% 53% 276%
Sensex 3% 8% 34%
BSE Auto 7% 23% 63%
Financial summary (Standalone)
YearRevenues (Rs. mn)
EBITDA (Rs. mn)
EBITDA Margin %
PAT (Rs. mn)
EPS (Rs.)
P/E (x)
EV/EBITDA (x)
FY14 5,945 1,006 16.9% 382 3.9 31.0 14.6
FY15E 6,792 1,324 19.5% 568 5.9 20.8 10.9
FY16E 8,186 1,760 21.5% 864 8.9 13.7 8.0
Find Spark research on Bloomberg (SPAK <go>), Thomson First Call, Reuters Knowledge and Factset
Promoters 60.1
Institutions 23.8
Public 16.1
Mukesh [email protected]+91 44 4344 0041
Rohit [email protected]+91 44 4344 0020
bearings globally. With global OEMs and Tier-1 suppliers looking to expand vendor base with every new platform, NRB
has a large scope given its ability to customize and supply at competitive prices. Currently, Getrag and ZF are key
customers and are expected to drive growth in the near future. We expect 25% exports CAGR from FY14-FY17.
Margin improvement: We expect NRB’s EBITDA margin to go back to its peak levels of 22% in FY17 driven primarily by
steep volume growth and better product mix through higher exports and improvement in CVs. Historically, margin
movements have mirrored 2W and CV OEM volumes and the expected pick-up in volumes augurs well for NRB
Our analysis comparing NRB to SKF India, FAG India and Timken India suggests that NRB is the only company with in-
house R&D and no royalty payments. NRB’s EBITDA margins are the best due to absence of traded products, which is
also the reason for lower asset turns. Working capital is the highest due to lower after market exposure, higher SKUs and
exports resulting in inventory at overseas warehouses. Net/net NRB stacks well amongst the MNC peers and we believe
margin, revenue growth (current cap utilization of 65-70%) along with debt reduction would result in ~20% ROCE by FY17

NRB Bearings CMP
Rs. 122
Target
Rs. 155
Rating
Buy
Corporate Factsheet
Promoter Background
NRB Bearings (NRB) was incorporated in 1965 as a JV between French needle bearing manufacturer Nadella SA (Timken
France SAS) and Sahney family to become the first needle bearing manufacturing company in India. In 2005, Sahney family
bought out Nadella’s 26% stake. In 2012, the company’s industrial bearing business was demerged as NRB Industrial
Bearing ltd in which the promoters own 72.6%.
Business
Needle roller bearings form ~10% of the Indian auto bearings industry and NRB has a ~70% market share in needle roller
bearings. The company has inherited the technology by way of its JV with Nadella and then by way of the acquisition of SNL
Bearings (which was a JV between INA Germany of Schaffeler group and Shriram Group). The company supplies to all the
auto segments and hence OEM segment growth is driven by volume growth for OEMs. After market growth is driven by
distribution reach and range (variety) of products. NRB is looking to expand exports significantly by way of working with the
customer from R&D stage for new technologies and products.
ManagementMr. Trilochan S. Sahney – Executive Chairman; Ms. Harshbeena S. Zaveri – MD & President
Mr. Satish C. Rangani – Executive Director ; Ms. Tanushree Bagrodia – CFO
Mr. Gagan Mathur – VP, Sales & Marketing (India & ASEAN) ; Mr. Sumit Mitra – VP, International Business & Supply Chain
Company Background
2
PresenceThe company has manufacturing facilities at Jalna, Waluj, Hyderabad, Aurangabad, Thane, Pantnagar, Ranchi and Thailand.
NRB’s after market business is catered to through its ~250 dealers and distributors
Corporate StructureThe promoters stake in NRB is 60.1% as of June 2014. The company has two subsidiaries – NRB Bearings (Thailand) ltd, a
100% subsidiary and SNL Bearings, 73.45% owned
Revenue ModelNeedle roller bearings comprise of 50% of the company’s revenue. Domestic (77% in FY14) could broadly be broken up into
2W: 24%, CV: 20%, PV: 20%, Farm & Off Highway: 16% and Aftermarket: 20%. Exports account for 23% of revenues.
Key Success Factors
Domestically NRB is the market leader in needle roller bearings. Needle roller bearings typically find application when space
is a constraint and load bearing capability is needed. Hence in most areas where automation is required and there is a
requirement for lighter parts needle roller bearing is applied. Simple example is when cars move from manual windows to
power windows. NRB’s USP comes from its ability to maintain large number of SKUs as its bearings are customised to a
large extent. Also the batch sizes could be significantly lower given the niche segment.
Credit Rating CRISIL: Long term AA-, Short Term A1+
Corporate Bankers BNP Paribas, Citibank N.A and DBS Bank
Auditors Deloitte Haskins & Sells

NRB Bearings CMP
Rs. 122
Target
Rs. 155
Rating
BuyManufacturing facilities strategically located near auto OEM hubs
NRB also has a facility in Thailand.
Currently 31% of revenues in Thailand is
from manufactured products and the
remainder are from trading revenues
(manufactured in India)
Location: Waluj, Maharashtra
Commenced: 1991
Location: Aurangabad, Maharashtra
Commenced: 1978
Products: Needle Rollers
Location: Pantnagar, Uttarakhand
Commenced: 2008
Products: Ball bearings, NF Cages, SL
Bushes, DB Bushes, CRB, NRB
Location: Ranchi, Jharkhand
Commenced: 1983
Products: Needle rollers, Needle
cages, Needle bearings,
3
Location: Hyderabad, Telangana
Commenced: 1992
Products: drawn cup cages, non
ferrous cages, turned cages, welded
cages, FS cages, thrust bearings, con
rod kits
Location: Jalna, Maharashtra
Commenced: 1982
Products: CRB, SRB, BB, NRB, TRB,
Textile bearings, wide inner ring bearing,
rings & sleeves, rocker arm bearings, ball
thrust cages
Commenced: 1991
Products: Bushes, crank pin, Big end
bearing, small end bearing, polymide
cage bearings, hub pin kits
Location: Thane, Maharashtra
Commenced: 1966
Products: Needle Bushes, Needle Cages
and Needle Bearings

NRB Bearings CMP
Rs. 122
Target
Rs. 155
Rating
Buy
NRB Bearings Revenue break-up
Source: Company, Spark Capital Research
2W30%
CV25%
PV25%
Farm/Off highway/Others
20%
Needle roller bearings form 50% of revenues
Source: Company, Spark Capital Research; CRB: Cylindrical roller bearing, SRB: Spherical,
TRP: Taper, BB: Ball bearing
CRB16%
BB8% SRB
1%
TRB3%
Needle Roller Bearings
50%
Others22%
OEM62%
After Market15%
Exports23%
NRB supplies to all segments within autos
4
Source: Company, Spark Capital Research TRP: Taper, BB: Ball bearing
Domestic revenues historically have mirrored 2W volumes
Source: Company, Spark Capital Research, SIAM
-20%
-10%
0%
10%
20%
30%
40%
FY
03
FY
04
FY
05
FY
06
FY
07
FY
08
FY
09
FY
10
FY
11
FY
12
FY
13
FY
14
Domestic Revenue YoY % 2 & 3 Wheeler industry YoY growth %
Export revenues have recorded steep revenue growth in recent past
Source: Company, Spark Capital Research
0
200
400
600
800
1000
1200
1400
1600
FY
02
FY
03
FY
04
FY
05
FY
06
FY
07
FY
08
FY
09
FY
10
FY
11
FY
12
FY
13
FY
14

NRB Bearings CMP
Rs. 122
Target
Rs. 155
Rating
BuyBearings Industry in India
Indian Bearings Industry (Rs. 95bn in FY12, down to Rs. 75bn in FY14)
Source: Industry, Spark Capital Research * industry break-up as per FY12
Tapered42%
Cylindrical29%
Spherical17%
Needle9%
Thrust4%
Roller Bearing52%
Ball Bearing48%
After Market35%
OEM65%
Imports38%
Organised46%
Unorganised16%
Electrical equipment
5%
Heavy Industries
20%
General Engineering
27%
Automotive48%
5
ProductsProductsSource: Industry, Spark Capital Research * industry break-up as per FY12
Indigenous and Imported composition
Source: Industry, Spark Capital Research
Indegenous62%
Imported38%
•Unorganised bearings primarily represent small scale manufacturers and suppliers of spurious bearings.
These generally have strong regional presence and cater to the replacement markets for both industrial
and automotive segments
• Imported bearings account for ~40% of total Indian bearings industry. Imported bearings are primarily
used in the industrial markets, whereas automobile markets are catered to by manufactured bearings
• Industrial segment typically requires customisation, large sized bearings and maintaining large number
of SKUs. Volumes for a particular type of bearings wouldn’t be large (as in the case of automobiles),
while portfolio of products would be large. Hence the major players in this segment prefer to cater to the
demand via imports
•Most bearing manufacturers in India are MNCs having technology backing from the parent company or
have technology that has been acquired from MNCs.
•Each of the manufacturers have specialised in certain bearing types and maintain market shares in the
respective segments

NRB Bearings CMP
Rs. 122
Target
Rs. 155
Rating
Buy
Types of roller bearings, applications and major players
Type of
bearingApplication Major players
Major Market
Share
Tapered
roller bearings
Vehicle front wheels, differential & pinion configurations, conveyor rolls,
machine tool spindles, trailer wheels
SKF India, FAG Bearings Limited,
NEI, Timken India, ABC Bearings
TIMKEN: 45%
Cylindrical
roller bearings
Cement and coal pulverizers, pumps, compressors, gear boxes, centrifuges,
mining equipment, transmissions
NEI, SKF India, FAG Bearings, NRB
BearingsFAG: 45%
Spherical Gearboxes, casters, aggregates, heavy
Each of the top companies have a niche and technology is from MNC parent/collaboration
Market share of top 5 players
Source: Spark Capital Research
SKF30%
FAG18%
NEI (NBC)13%
NRB8%
Timken8%
Most manufacturers have a technical collaboration with MNCs
6
Spherical
roller bearings
Gearboxes, casters, aggregates, heavy stationary, industrial conveyor systems,
industrial fans
SKF India, FAG Bearings, NEI
FAG: 45%
Needle roller
bearings
Transmissions, transfer cases, engines and valve trains, steering and braking
systems, axle supports, outboard engines, power tools, copiers
INA Bearings, SKF India, NRB Bearings
NRB: 70%
Thrust roller
bearings
Classifiers, extruders, oil well swivels, pumps, pulp refiners, machine tools
SKF India, FAG Bearings, Timken
India
-
Ball Bearings
Wide applications in 2W, 3W and four wheelers. Used primarily in wheels and
axles
SKF India, FAG Bearings, Timken
India, ABC Bearings, NEI
SKF 65%
Source: Industry, Spark Capital Research
Company Technology Relationship Specialisation
SKF India SKF, Sweden Subsidiary Ball bearings
FAG India FAG, Germany SubsidiaryCylindrical & Spherical roller bearings
Timken India Timken, USA Subsidiary Taper roller bearings
NRB BearingsNadella (France) and INA (Germany)
Acquisition Needle roller bearings
ABC Bearing NSK JapanJV / Technical Collaboration
Ball bearings
NEI Bearings NTN JapanTechnical Collaboration
Ball and Taper roller bearings
Koyo India JTEKT Corp, Japan SubsidiarySingle ball bearing,Taper roller bearings
Bimetal Bearings
Clevite Inc, USATechnical Collaboration
Engine bearings
Source: Industry, Spark Capital Research
NRB Bearings CMP
Rs. 122
Target
Rs. 155
Rating
Buy
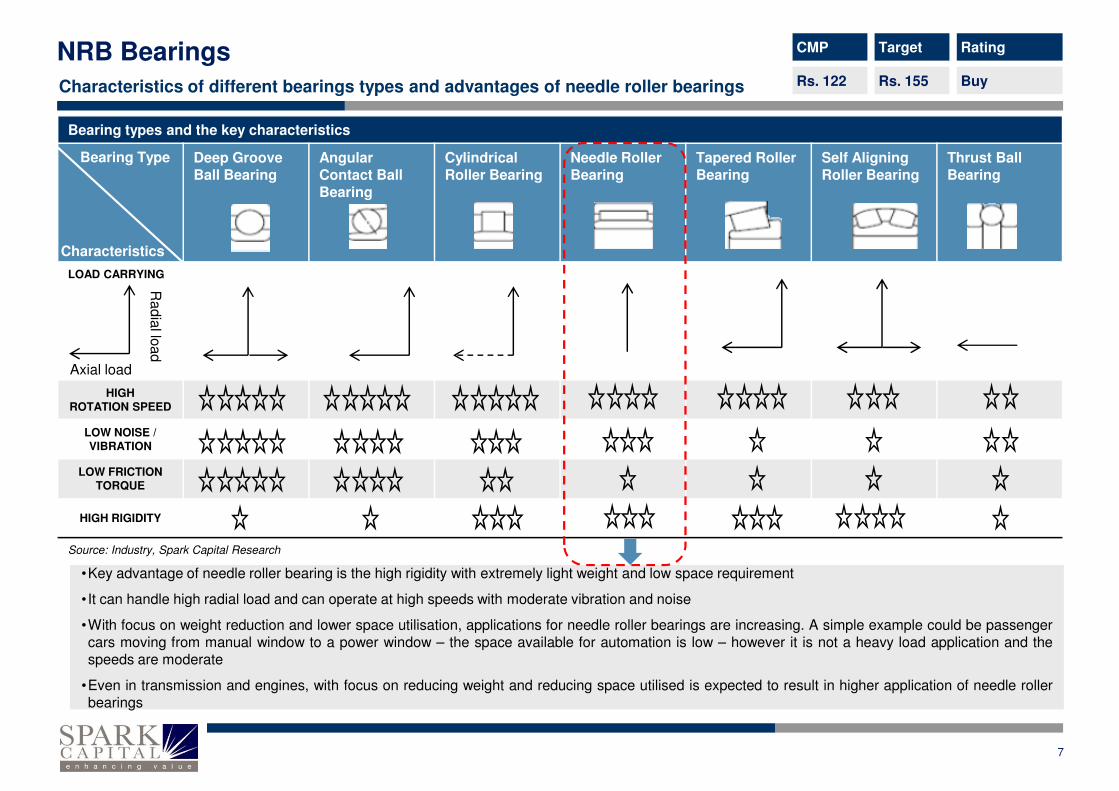
Bearing types and the key characteristics
Deep Groove Ball Bearing
Angular Contact Ball Bearing
Cylindrical Roller Bearing
Needle Roller Bearing
Tapered Roller Bearing
Self AligningRoller Bearing
Thrust Ball Bearing
LOAD CARRYING
HIGH
Bearing Type
Characteristics
Axial load
Radia
l load
Characteristics of different bearings types and advantages of needle roller bearings
HIGH ROTATION SPEED
LOW NOISE / VIBRATION
LOW FRICTIONTORQUE
HIGH RIGIDITY
Source: Industry, Spark Capital Research
7
•Key advantage of needle roller bearing is the high rigidity with extremely light weight and low space requirement
• It can handle high radial load and can operate at high speeds with moderate vibration and noise
•With focus on weight reduction and lower space utilisation, applications for needle roller bearings are increasing. A simple example could be passenger
cars moving from manual window to a power window – the space available for automation is low – however it is not a heavy load application and the
speeds are moderate
•Even in transmission and engines, with focus on reducing weight and reducing space utilised is expected to result in higher application of needle roller
bearings

NRB Bearings CMP
Rs. 122
Target
Rs. 155
Rating
BuyNRB leads in operating margins; has meaningful R&D spend and zero royalty payments
NRB has among the best gross margin for manufactured bearings
FY11/CY10 FY12/CY11 FY13/CY12 FY14/CY13
NRB 52.2% 55.1% 52.4% 51.1%
SKF 52.9% 51.9% 48.6% 51.6%
FAG 50.4% 49.9% 49.2% 47.6%
TIMKEN NA 42.8% 41.5% 44.7%
EBITDA margin differential reflects the impact of traded bearings
FY11/CY10 FY12/CY11 FY13/CY12 FY14/CY13
NRB 22.1% 19.6% 16.2% 16.9%
SKF 13.5% 12.3% 11.6% 11.5%
FAG 18.0% 19.6% 15.2% 12.8%
TIMKEN 15.2% 12.8% 10.7% 9.9%
• NRB Bearings gross margins are comparable to the margins
made by the other large (MNC) bearing makers for the
manufactured bearings. This we believe is from the fact that the
company enjoys 70% market share in the segment that it
specialises
• EBITDA margins are significantly higher than the other bearing
manufacturers given that the others trade in bearing catering to
the industrial segment
• While the improvement in end markets (auto and industrial) are
expected to drive margins up for all bearing manufacturers, we
expect NRB’s EBITDA margins to record a steep improvement
and go back towards its historical peak margin of 22%+
8
Only NRB has a meaningful R&D spend
FY11/CY10 FY12/CY11 FY13/CY12 FY14/CY13
NRB 0.8% 1.0% 1.2% 1.3%
SKF - - - -
FAG 0.4% 0.5% 0.7% 0.9%
TIMKEN - - - -
Other companies have royalty payments to the parent
FY11/CY10 FY12/CY11 FY13/CY12 FY14/CY13
NRB - - - -
SKF 3.4% 5.0% 4.0% 5.0%
FAG 2.5% 2.4% 2.5% 2.3%
TIMKEN NA 2.9% 3.0% 3.5%
Source: Company, Spark Capital; Royalty payments are as a % of revenues ex-trading
• NRB has absorbed the technology to manufacture needle roller
bearings by way of it buying out its JV partner (Nadella) and
acquisition (INA’s JV with)
• Apart from NRB, only FAG has spent on R&D. We believe this
could be a factor of FAG planning to increase manufacture of
Industrial bearings in India and make it an export hub
• Absence of R&D and dependence on the parent company also
reflects in the royalty that has been paid by SKF, FAG and
Timken. However, NRB has no royalty payments as all the
technology is internalised

NRB Bearings CMP
Rs. 122
Target
Rs. 155
Rating
Buy
Lower ROCE as working capital is high and asset turns is lower
FY11/CY10 FY12/CY11 FY13/CY12 FY14/CY13
NRB 17.9% 13.7% 11.4% 9.3%
SKF 20.9% 22.4% 17.5% 11.4%
FAG 21.6% 24.2% 16.0% 9.7%
TIMKEN 12.1% 18.8% 12.3% 10.4%
ROE is higher as NRB is the only company having leverage
FY11/CY10 FY12/CY11 FY13/CY12 FY14/CY13
NRB 25.9% 20.8% 20.6% 17.1%
SKF 22.6% 22.4% 17.5% 14.9%
FAG 23.5% 27.0% 19.8% 13.0%
TIMKEN 14.4% 23.3% 13.5% 12.4%
• NRB’s ROCE is on the lower end vs. peers despite better
operating margin as the company has lower asset turnover and
higher working capital requirement
• ROE is however higher than peers as NRB had a leveraged
balance sheet, while others are debt free
Return ratios are at the lower end as working capital is high and asset turns are low
9
Gross fixed asset turns lower due to absence of traded revenues
FY11/CY10 FY12/CY11 FY13/CY12 FY14/CY13
NRB 1.3 1.3 1.3 1.2
SKF 2.7 2.9 2.4 2.3
FAG 2.5 2.9 2.7 2.1
TIMKEN 2.3 3.7 2.8 2.7
Working capital days is highest among peers
FY11/CY10 FY12/CY11 FY13/CY12 FY14/CY13
NRB 118 131 144 154
SKF 30 47 49 54
FAG 28 42 55 56
TIMKEN 86 68 110 109
Source: Company, Spark Capital; Royalty payments are as a % of revenues ex-trading
• NRB’s gross fixed asset turnover is lower than peers due to the
absence of traded revenues for NRB
• Assuming only manufactured revenue for peers NRB’s fixed asset
turnover ratio is in-line with peers
• Working capital days for NRB is higher primarily driven by higher
inventory and debtors

NRB Bearings CMP
Rs. 122
Target
Rs. 155
Rating
Buy
Inventory days
FY11/CY10 FY12/CY11 FY13/CY12 FY14/CY13
NRB 83 85 86 82
SKF 65 63 63 65
FAG 44 45 36 44
TIMKEN 83 66 76 70
Debtor days
FY11/CY10 FY12/CY11 FY13/CY12 FY14/CY13
NRB 83 89 101 120
SKF 48 56 54 54
FAG 46 60 64 74
TIMKEN 65 48 70 76
• Inventory and debtor days for NRB is higher than peers driven by
• Lower sales from aftermarket business
• Company maintains a large number of SKUs – as high as
2.5x the nearest competitor. NRB has more customised
bearings and lower off the shelf bearings
• Exports business requires maintaining inventory at
warehouses situated in different geography’s
Working capital higher due to revenue mix, absence of trading revenue and higher SKUs
10
• Peers have trading revenues where the billing to the
customers is directly done by the parent companyCreditor days
FY11/CY10 FY12/CY11 FY13/CY12 FY14/CY13
NRB 48 43 43 48
SKF 84 72 68 64
FAG 62 63 45 61
TIMKEN 62 46 35 38
Imported content in raw material costs
FY11/CY10 FY12/CY11 FY13/CY12 FY14/CY13
NRB 28% 30% 28% 28%
SKF 45% 43% 21% 27%
FAG 28% 30% 34% 36%
TIMKEN 38% 36% 36% 27%
Source: Company, Spark Capital; Royalty payments are as a % of revenues ex-trading
• Imported content in the bearings is comparable across the board

NRB Bearings CMP
Rs. 122
Target
Rs. 155
Rating
BuyNRB’s operating margins are more predictable given exposure only to the auto segment
NRB has lower exposure to the aftermarket and no supplies in the industrial segment
NRB SKF FAG Timken
Auto -
Domestic77% 45% 35% 17%
OEM 62% 30% 23% NA
After
Market 15%15%
12%NA
Industrial -
Domestic -47% 51% 30%
OEM-
15%33%
NA
After
Market -32%
18%NA
Exports 23% 8% 14% 33%
Source: Company, Spark Capital Research; * Approx
NRB EBITDA margins are more predictable as they move in tandem with 2W & CV
Source: Company, Spark Capital Research
12.0%
14.0%
16.0%
18.0%
20.0%
22.0%
24.0%
-10%
-5%
0%
5%
10%
15%
20%
25%
30%
35%
FY
03
FY
04
FY
05
FY
06
FY
07
FY
08
FY
09
FY
10
FY
11
FY
12
FY
13
FY
14
2 & 3W YoY growth % NRB EBITDA margin % (RHS)
12.0%
14.0%
16.0%
18.0%
20.0%
22.0%
24.0%
-30%
-20%
-10%
0%
10%
20%
30%
40%
50%
FY
03
FY
04
FY
05
FY
06
FY
07
FY
08
FY
09
FY
10
FY
11
FY
12
FY
13
FY
14
Commercial Vehicles NRB EBITDA margin % (RHS)
11
Source: Company, Spark Capital Research; * Approx numbers
Source: Company, Spark Capital Research
SKF, FAG and TIMKEN margins are not so predictable and do not move in tandem with key end-market volumes due to traded bearings segment
Source: Spark Capital Research
10%
12%
14%
16%
18%
20%
22%
-10%
-5%
0%
5%
10%
15%
20%
25%
30%
35%
FY
03
FY
04
FY
05
FY
06
FY
07
FY
08
FY
09
FY
10
FY
11
FY
12
FY
13
FY
14
PV Industry growth YoY % SKF EBITDA margin %
10%
12%
14%
16%
18%
20%
22%
24%
-10%
-5%
0%
5%
10%
15%
20%
25%
30%
35%
FY
03
FY
04
FY
05
FY
06
FY
07
FY
08
FY
09
FY
10
FY
11
FY
12
FY
13
FY
14
PV Industry growth YoY % FAG EBITDA margin %
8%
10%
12%
14%
16%
18%
20%
-30%
-20%
-10%
0%
10%
20%
30%
40%
50%
FY
03
FY
04
FY
05
FY
06
FY
07
FY
08
FY
09
FY
10
FY
11
FY
12
FY
13
FY
14
CV Industry growth YoY % TIMKEN EBITDA margin %

NRB Bearings CMP
Rs. 122
Target
Rs. 155
Rating
BuyStrong visibility in OEM; exports & aftermarket driven by new orders and renewed focus
OEM revenue growth to be aided by 2W, PV & CV
Export growth expected on the back of new orders
-
1,000
2,000
3,000
4,000
5,000
6,000
FY10 FY11 FY12 FY13 FY14 FY15E FY16E FY17E
(Rs.
mn)
FY10-FY14: 13%
FY14-FY17: 15.5%
2,500
3,000 FY10-FY14: 71%
FY14-FY17: 25%
FY10-FY14: 71%
FY14-FY17: 25%
•FY14 – FY17 CAGR expectations - 2W: 14%, CV: 23%, PV: 15%, Others: 9%
•1) Technology is at par with MNCs 2) Maintains large SKUs (2.5x of the nearest
competitor) 3) Customisation of products as NRB works from design stage with
OEMs 4) Willingness to supply lower batch sizes 5) low turn around time
•Currently among the bearings used in a 2W, 65% are needle roller and in a 4W, 35%
are needle roller. With more electronics and automation in 4W and the requirement to
make the engines, transmission and steering lighter and more compact, we expect
the application of needle roller bearings to increase over time
•Key customers- 2W: HMCL, BJAUT, HMSI; 4W & CV: TAMO, MM, AL, MSIL. Key
competitors include INA (Schaeffler group), Koyo, SKF and NSK
•NRB is among the few manufacturers of needle roller bearings globally. Focus on
exports by way of working with the customer from the design stage is resulting in
bagging orders
•1) Most OEMs and Tier 1 suppliers looking to add vendor as currently very few
12
After market growth to be aided by renewed focus
-
500
1,000
1,500
2,000
FY10 FY11 FY12 FY13 FY14 FY15E FY16E FY17E
(Rs.
mn)
-
200
400
600
800
1,000
1,200
1,400
FY10 FY11 FY12 FY13 FY14 FY15E FY16E FY17E
(Rs.
mn)
FY10-FY14: 71%
FY14-FY17: 25%
FY10-FY14: 8.5%
FY14-FY17: 13%
•1) Most OEMs and Tier 1 suppliers looking to add vendor as currently very few
vendors for needle roller bearings 2) Cost advantage 3) Technology at par with
MNCs 4) High customisation and willingness to supply low batch sizes 5) low turn
around time
•Key customers include Getrag, ZF, John Deere, GKN. Key competitors: INA, Koyo,
Nadella, NSK among others
•Low growth in the last four years as focus was on OEM segment
•Distribution network (~250) in place and the company plans to focus on the segment
by building the brand in the mechanic circles by showcasing the product range and
product quality
•NRB offers higher range of products than competitors. Replacement market for
needle roller bearing used in gear box etc is lower, however other applications such
as clutch, wheel and steering have a replacement market
•NRB is planning to supply aftermarket ‘kits’ which would include grease and other
related (complementary) products along with needle bearings
NRB Bearings CMP
Rs. 122
Target
Rs. 155
Rating
BuySubsidiaries do not move the needle
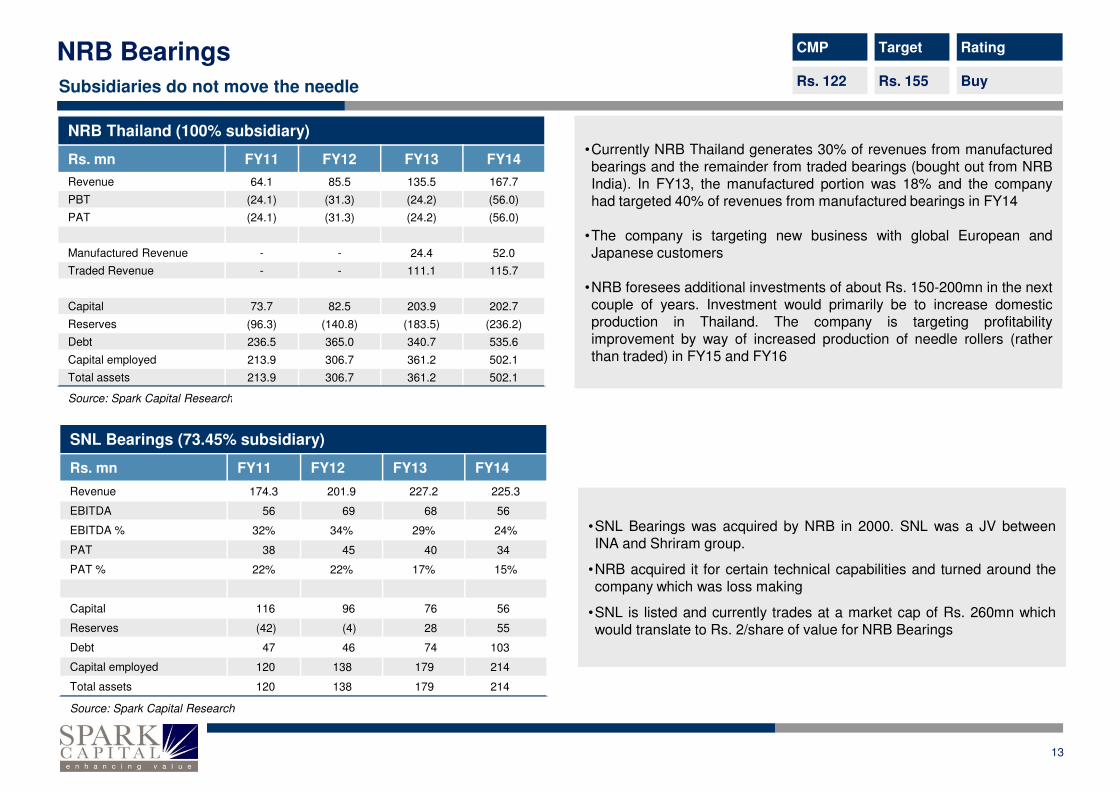
NRB Thailand (100% subsidiary)
Rs. mn FY11 FY12 FY13 FY14
Revenue 64.1 85.5 135.5 167.7
PBT (24.1) (31.3) (24.2) (56.0)
PAT (24.1) (31.3) (24.2) (56.0)
Manufactured Revenue - - 24.4 52.0
Traded Revenue - - 111.1 115.7
Capital 73.7 82.5 203.9 202.7
Reserves (96.3) (140.8) (183.5) (236.2)
Debt 236.5 365.0 340.7 535.6
Capital employed 213.9 306.7 361.2 502.1
Total assets 213.9 306.7 361.2 502.1
Source: Spark Capital Research
•Currently NRB Thailand generates 30% of revenues from manufactured
bearings and the remainder from traded bearings (bought out from NRB
India). In FY13, the manufactured portion was 18% and the company
had targeted 40% of revenues from manufactured bearings in FY14
•The company is targeting new business with global European and
Japanese customers
•NRB foresees additional investments of about Rs. 150-200mn in the next
couple of years. Investment would primarily be to increase domestic
production in Thailand. The company is targeting profitability
improvement by way of increased production of needle rollers (rather
than traded) in FY15 and FY16
13
Source: Spark Capital Research
SNL Bearings (73.45% subsidiary)
Rs. mn FY11 FY12 FY13 FY14
Revenue 174.3 201.9 227.2 225.3
EBITDA 56 69 68 56
EBITDA % 32% 34% 29% 24%
PAT 38 45 40 34
PAT % 22% 22% 17% 15%
Capital 116 96 76 56
Reserves (42) (4) 28 55
Debt 47 46 74 103
Capital employed 120 138 179 214
Total assets 120 138 179 214
Source: Spark Capital Research
•SNL Bearings was acquired by NRB in 2000. SNL was a JV between
INA and Shriram group.
•NRB acquired it for certain technical capabilities and turned around the
company which was loss making
•SNL is listed and currently trades at a market cap of Rs. 260mn which
would translate to Rs. 2/share of value for NRB Bearings

NRB Bearings CMP
Rs. 122
Target
Rs. 155
Rating
BuyCorporate guarantees to group companies is a risk
Related party transactions
Rs. mn SNL Bearings NRB Thailand NRB Industrial Bearings Ltd
TransactionPayables as at
March'14Transaction
Receivables as on
March'14Transaction
Receivables as on
March'14
Sale of raw materials / fixed assets 12.4 - 85.2 - 36.6 172.7
Purchase of raw materials / fixed assets 125.3 33.1 46.4 - 52.2 -
Proceeds from redemption of cumulative pref. shares 20.0 - - - - -
Inter corporate deposit given - - 24.9 - 61.7 -
Interest received on Inter Corporate deposit - - 1.9 - 1.0 -
Stand by letter of credit given by NRB Bearings Ltd - - - 60.7 - -
Guarantee given by NRB Bearings Ltd - - - 112.6 - 635.6
Source: Spark Capital Research
14
Source: Spark Capital Research
•NRB Industrial bearings ltd (NIBLB) was demerged from NRB Bearings in October 2012.
NRBIB is ~73% promoter owned entity and is in the business of manufacturing needle roller
bearings for process industries.
•NRB bearings and NIBL have a non-compete agreement wherein NRB bearings can only
cater to motion industries. We are given to understand that the non-compete agreement is
valid until 2016.
•Related part transactions suggest that NRB Bearings has provided guarantees to NRBL for
Rs. 635.6mn and also an inter corporate deposit of Rs. 61.7mn. Recently, NRB also sought
shareholders approval to increase the amount of corporate guarantee to Rs. 900mn till 30th
September 2018. It also proposed to increase the limit of inter corporate deposits to Rs.
200mn to meet the loan obligations under the corporate guarantee already given by NRB.
•While this means that the total outstanding for NIBL would not exceed Rs. 900mn, we believe
this is a risk for NRB.
NRB Industrial Bearings Ltd.
Rs. mn Dec’2013 (15 months)
Revenue 300.2
EBITDA (129.4)
EBITDA % -43%
PAT (242.3)
PAT % -81%
Capital 48
Reserves 338
Debt 1,101
Capital employed 1,488
Total assets 1,488
Source: Spark Capital Research

NRB Bearings CMP
Rs. 122
Target
Rs. 155
Rating
Buy
NRB 12 months forward PE band
Source: Bloomberg, Spark Capital Research
SKF 12 months forward PE band
Source: Bloomberg, Spark Capital Research
16.0x
11.0x
6.0x
26.0x
21.0x
0
200
400
600
800
1000
1200
1400
Mar-
06
Jul-
06
No
v-0
6
Mar-
07
Jul-
07
No
v-0
7
Mar-
08
Jul-
08
No
v-0
8
Mar-
09
Jul-
09
No
v-0
9
Mar-
10
Jul-
10
No
v-1
0
Mar-
11
Jul-
11
No
v-1
1
Mar-
12
Jul-
12
No
v-1
2
Mar-
13
Jul-
13
No
v-1
3
Mar-
14
Jul-
14
11.0x
8.0x
5.0x
17.0x
14.0x
0
20
40
60
80
100
120
140
Mar-
06
Jul-
06
No
v-0
6
Mar-
07
Jul-
07
No
v-0
7
Mar-
08
Jul-
08
No
v-0
8
Mar-
09
Jul-
09
No
v-0
9
Mar-
10
Jul-
10
No
v-1
0
Mar-
11
Jul-
11
No
v-1
1
Mar-
12
Jul-
12
No
v-1
2
Mar-
13
Jul-
13
No
v-1
3
Mar-
14
Jul-
14
NRB trades at a steep discount to its peers
15
Source: Bloomberg, Spark Capital Research Source: Bloomberg, Spark Capital Research
FAG 12 months forward PE band
Source: Bloomberg, Spark Capital Research
TIMKEN 12 months forward PE band
Source: Bloomberg, Spark Capital Research
22.0x
17.0x
12.0x
32.0x
27.0x
0
100
200
300
400
500
600
Feb-0
7
Jun
-07
Oct-
07
Feb-0
8
Jun
-08
Oct-
08
Feb-0
9
Jun
-09
Oct-
09
Feb-1
0
Jun
-10
Oct-
10
Feb-1
1
Jun
-11
Oct-
11
Feb-1
2
Jun
-12
Oct-
12
Feb-1
3
Jun
-13
Oct-
13
Feb-1
4
Jun
-14
17.0x
12.0x
7.0x
27.0x
22.0x
0
500
1000
1500
2000
2500
3000
3500
Mar-
06
Jul-
06
No
v-0
6
Mar-
07
Jul-
07
No
v-0
7
Mar-
08
Jul-
08
No
v-0
8
Mar-
09
Jul-
09
No
v-0
9
Mar-
10
Jul-
10
No
v-1
0
Mar-
11
Jul-
11
No
v-1
1
Mar-
12
Jul-
12
No
v-1
2
Mar-
13
Jul-
13
No
v-1
3
Mar-
14
Jul-
14

NRB Bearings CMP
Rs. 122
Target
Rs. 155
Rating
BuyPeer comparison
CMP MCAP Revenue (Rs. mn) EBITDA (Rs. mn) EBITDA Margin %
Rs. Rs. mn FY14 FY15E FY16E FY17E FY14 FY15E FY16E FY17E FY14 FY15E FY16E FY17E
NRB 122 11,728 5,945 6,792 8,186 9,716 1,006 1,324 1,760 2,138 16.9% 19.5% 21.5% 22.0%
SKF India 1,109 58,480 22,750 24,961 30,593 36,553 2,614 3,219 4,130 5,008 11.5% 12.9% 13.5% 13.7%
Timken India 418 28,389 7,201 9,277 11,386 13,094 716 1,438 1,879 2,226 9.9% 15.5% 16.5% 17.0%
FAG India 2,920 48,530 14,300 16,800 20,604 - 1,836 2,482 3,223 - 12.8% 14.8% 15.6% -
SKF and FAG : CY13, CY14, CY15, CY16; FAG and Timken based on Consensus
16
PAT EPS P/E EV/EBITDA
FY14 FY15E FY16E FY17E FY14 FY15E FY16E FY17E FY14 FY15E FY16E FY17E FY14 FY15E FY16E FY17E
NRB 382 568 864 1,1323.9 5.9 8.9 11.7
30.7 x 20.7 x 13.6 x 10.4 x 14.2 x 10.8 x 8.1 x 6.7 x
SKF India 1,809 2,252 2,918 3,63034.3 42.7 55.3 68.8
32.3 x 26.0 x 20.0 x 16.1 x 20.3 x 16.5 x 12.9 x 10.6 x
Timken India 447 888 1,175 2,0556.6 13.1 17.3 30.2
63.4 x 32.0 x 24.2 x 13.8 x 39.6 x 19.7 x 15.1 x 12.7 x
FAG India 1,218 1,730 2,245 -73.3 106.6 143.0
- 39.8 x 27.4 x 20.4 x - 23.8 x 17.6 x 13.6 x -
SKF and FAG : CY13, CY14, CY15, CY16; FAG and Timken based on Consensus
SKF and FAG : CY13, CY14, CY15, CY16; FAG and Timken based on Consensus

NRB Bearings CMP
Rs. 122
Target
Rs. 155
Rating
BuyAbridged standalone financials
Abridged Financial Statements Key metrics
Rs. mn FY14 FY15E FY16E FY17E FY14 FY15E FY16E FY17E
Profit & Loss Growth ratios
Revenues 5,945 6,792 8,186 9,716 Revenues 2.6% 14.3% 20.5% 18.7%
Manufacturing & Other Expenses 4,939 5,468 6,426 7,579 EBITDA 7.4% 31.6% 32.9% 21.5%
EBITDA 1,006 1,324 1,760 2,138 PAT -18.8% 48.7% 52.2% 31.0%
Depreciation 333 355 388 415 Margins
EBIT 673 970 1,372 1,722 EBITDA 16.9% 19.5% 21.5% 22.0%
Net Interest Exp / (inc) 172 190 172 142 EBIT 11.3% 14.3% 16.8% 17.7%
Profit Before Tax 547 811 1,235 1,618 PAT 6.4% 8.4% 10.6% 11.7%
Tax 165 243 370 485 Leverage & WC ratios
Adj. Net Profit 382 568 864 1,132 Debt to equity (x) 1.2 1.1 0.7 0.5
Balance Sheet (Rs. mn) Current ratio (x) 0.6 0.6 0.5 0.4
Shareholders Equity 2,367 2,737 3,310 4,094 Debtor days (Sales) 120 110 100 90
17
Loan funds 2,930 2,930 2,367 2,017 Inventory days (COGS) 82 82 83 85
Sources of funds 5,412 5,782 5,792 6,226 Creditor Days (COGS) 48 47 45 43
Net block 2,026 2,301 2,263 2,298 Performance & turnover ratios
Investments 209 209 209 209 RoACE 9.3% 12.1% 16.6% 20.1%
Capital WIP 330 0 0 0 RoAE 17.1% 22.3% 28.6% 30.6%
Current assets, loans & advances 773 773 773 773 Total asset turnover (x) 0.8 0.8 0.9 1.0
Current liabilities & provisions 1,203 1,406 1,680 1,924 Fixed asset turnover (x) 1.2 1.3 1.4 1.6
Net Current Assets 2,847 3,272 3,320 3,719 Valuation metrics
Application of funds 5,412 5,782 5,792 6,226 Current price (Rs.)
Cash Flows (Rs. mn) Shares outstanding (mn) 97 97 97 97
Cash flows from operations 607 735 916 1,185 Market capitalisation (Rs. mn) 11,825 11,825 11,825 11,825
Capex 546 300 350 450 Enterprise value (Rs. mn) 14,704 14,392 14,024 13,580
Free Cash Flow 61 435 566 735 EV/EBIDTA (x) 14.6 10.9 8.0 6.4
Cash flows from investments (588) (300) (350) (450) Adj. Per-share earnings (Rs.) 3.9 5.9 8.9 11.7
Cash flows from financing (3) (124) (761) (641) Price-earnings multiple (x) 31.0 20.8 13.7 10.4
Cash & Cash equivalents 51 363 167 262 Dividend yield (%) 0.9% 1.4% 2.0% 2.5%
122

NRB Bearings CMP
Rs. 122
Target
Rs. 155
Rating
Buy
Absolute Rating Interpretation
Buy Stock expected to provide positive returns of >15% over a 1-year horizon
Add Stock expected to provide positive returns of >5% – <15% over a 1-year horizon
Reduce Stock expected to provide returns of <5% – -10% over a 1-year horizon
Sell Stock expected to fall >10% over a 1-year horizon
Spark Disclaimer
Spark Capital Advisors (India) Private Limited (Spark Capital) and its affiliates are engaged in investment banking, investment advisory and institutional equities. Spark Capital is registered with
SEBI as a Stock Broker and Category 1 Merchant Banker.
This document does not constitute or form part of any offer or solicitation for the purchase or sale of any financial instrument or as an official confirmation of any transaction. This document is
provided for assistance only and is not intended to be and must not alone be taken as the basis for an investment decision. Nothing in this document should be construed as investment or financialadvice, and nothing in this document should be construed as an advice to buy or sell or solicitation to buy or sell the securities of companies referred to in this document.
Each recipient of this document should make such investigations as it deems necessary to arrive at an independent evaluation of an investment in the securities of companies referred to in this
document (including the merits and risks involved), and should consult its own advisors to determine the merits and risks of such an investment. This document is being supplied to you solely fordocument (including the merits and risks involved), and should consult its own advisors to determine the merits and risks of such an investment. This document is being supplied to you solely foryour information and may not be reproduced, redistributed or passed on, directly or indirectly, to any other person or published, copied, in whole or in part, for any purpose. This report is not
directed or intended for distribution to or use by any person or entity who is a citizen or resident of or located in any locality, state, country or other jurisdiction, where such distribution, publication,availability or use would be contrary to law, regulation or which would subject Spark Capital and/or its affiliates to any registration or licensing requirement within such jurisdiction. The securitiesdescribed herein may or may not be eligible for sale in all jurisdictions or to a certain category of investors. Persons in whose possession this document may come are required to inform
themselves of and to observe such applicable restrictions. This material should not be construed as an offer to sell or the solicitation of an offer to buy any security in any jurisdiction where such anoffer or solicitation would be illegal.
Spark Capital makes no representation or warranty, express or implied, as to the accuracy, completeness or fairness of the information and opinions contained in this document. Spark Capital , itsaffiliates, and the employees of Spark Capital and its affiliates may, from time to time, effect or have effected an own account transaction in, or deal as principal or agent in or for the securitiesmentioned in this document. They may perform or seek to perform investment banking or other services for, or solicit investment banking or other business from, any company referred to in this
report.
This report has been prepared on the basis of information, which is already available in publicly accessible media or developed through an independent analysis by Spark Capital. While we would
endeavour to update the information herein on a reasonable basis, Spark Capital and its affiliates are under no obligation to update the information. Also, there may be regulatory, compliance orother reasons that prevent Spark Capital and its affiliates from doing so. Neither Spark Capital nor its affiliates or their respective directors, employees, agents or representatives shall beresponsible or liable in any manner, directly or indirectly, for views or opinions expressed in this report or the contents or any errors or discrepancies herein or for any decisions or actions taken in
reliance on the report or the inability to use or access our service in this report or for any loss or damages whether direct or indirect, incidental, special or consequential including without limitationloss of revenue or profits that may arise from or in connection with the use of or reliance on this report.
Spark Capital and/or its affiliates and/or employees may have interests/positions, financial or otherwise in the securities mentioned in this report. To enhance transparency, Spark Capital has incorporated a disclosure of interest statement in this document. This should however not be treated as endorsement of views expressed in this report:

NRB Bearings CMP
Rs. 122
Target
Rs. 155
Rating
Buy
Analyst Certification of Independence
The views expressed in this research report accurately reflect the analyst’s personal views about any and all of the subject securities or issuers; and no part of the researchanalyst’s compensations was, is or will be, directly or indirectly, related to the specific recommendation or views expressed in the report.
Additional Disclaimer for US Institutional Investors
This research report prepared by Spark Capital Advisors (India) Private Limited is distributed in the United States to US Institutional Investors (as defined in Rule 15a-6 under the SecuritiesExchange Act of 1934, as amended) only by Decker & Co, LLC, a broker-dealer registered in the US (registered under Section 15 of Securities Exchange Act of 1934, as amended). Decker &
Co accepts responsibility on the research reports and US Institutional Investors wishing to effect transaction in the securities discussed in the research material may do so through Decker & Co.All responsibility for the distribution of this report by Decker & Co, LLC in the US shall be borne by Decker & Co, LLC. All resulting transactions by a US person or entity should be effectedthrough a registered broker-dealer in the US. This report is not directed at you if Spark Capital Advisors (India) Private Limited or Decker & Co, LLC is prohibited or restricted by any legislation
or regulation in any jurisdiction from making it available to you. You should satisfy yourself before reading it that Decker & Co, LLC and Spark Capital Advisors (India) Private Limited arepermitted to provide research material concerning investment to you under relevant legislation and regulations;
Disclosure of interest statement Yes/No
Analyst ownership of the stock No
Group/directors ownership of the stock No
19
Group/directors ownership of the stock No
Broking relationship with the company covered No
Investment banking relationship with the company covered No