NRB Bearings (NRBBEA) | 170content.icicidirect.com/mailimages/IDirect_NRBBearings_Q3FY18.pdf ·...
13
February 14, 2018 ICICI Securities Ltd | Retail Equity Research Result Update Stellar performance… NRB Bearings reported stellar Q3FY18 numbers. The company reported topline, EBITDA, PAT numbers above our estimates Revenues came in at | 207.9 crore, up 25.4% YoY. We estimated revenues of | 192.1 crore (15.9% YoY growth) for the quarter EBITDA increased 103.4% YoY to | 40.5 crore. The company reported strong EBITDA on account of a sharp increase in gross margins (up 830 bps YoY). Accordingly, EBITDA margins came in at 19.5% vs. 12% in Q3FY17. We estimated margins of 13.4% for the quarter. Employee expenses as a percentage of sales also reduced from 18.9% to 15.7% YoY Non-operating expenses like depreciation and interest expenses declined 17% and 16.7% YoY, respectively. Accordingly, PAT increased strong 178.5% YoY to | 21.3 crore Leading bearings manufacturer with focus on cylindrical & needle bearing NRB is the leader in the needle bearing segment in India with ~70% market share. Needle roller bearings comprised ~41% of NRB’s topline in FY17. A needle roller bearing, as a customised product, requires NRB to work with OEMs from the conceptualisation stage. This enables it to build sticky clientele relationships with almost all major OEM players. Apart from needle bearings, the other key product that the company manufactures is ball & roller bearings, together contributing 78% to the topline of the company. Performance from export business to drive growth over FY17-20E To expand its geographical footprints and foray into newer platforms, NRB has forayed into exports wherein it caters to global players such as Daimler, Renault, Volvo and Getrag. NRB’s exports, which grew at 11% CAGR in FY13-17, have also provided a natural hedge for its import of raw materials. Exports contributed ~18% to revenues in FY17. Going forward, we expect export revenues to grow at 13.8% CAGR in FY17-20E to | 196 crore. Topline growth likely to accelerate due to recovery in auto, after-markets While FY17 witnessed a slight recovery in auto volumes, we believe the same will gain traction in FY17-20E. We estimate the auto industry to grow at 6-8% CAGR over FY17-20E. Accordingly, we expect bearings demand from the OEM segment to grow at CAGR of 12.7% over FY17- 20E. Similarly, we expect business from after-market segment to grow at a CAGR of 13.2% over FY17-20E. Thus, we expect NRB’s OEM segment and after-market segment to clock revenues of | 689.5 crore and | 135.6 crore respectively. Reasonable valuation, maintain BUY We maintain our BUY recommendation on reasonable valuations (16.5x FY20E earnings) and an improving growth outlook from its key segment – automotive and the after-market segment. We now estimate topline and bottomline growth of 13% and 22.8% CAGR over FY17-20E. With moderate capex of ~| 50 crore over FY18E-20E, we believe NRB is well placed to capitalise on the next phase of growth. We continue to value the company at 21x FY20E EPS of | 10.3 to arrive at a target price to | 215 per share. We recommend BUY on the company. NRB Bearings (NRBBEA) | 170 Rating matrix Rating : Buy Target : | 215 Target Period : 12 months Potential Upside : 26% What’s changed? Target Changed from | 170 to | 215 EPS FY19E Changed from | 7.1 to | 8.9 EPS FY20E Changed from | 8.1 to | 10.3 Rating Unchanged Quarterly performance Q3FY18 Q3FY17 YoY (%) Q2FY18 QoQ (%) Revenue 207.9 165.7 25.4 208.2 (0.2) EBITDA 40.5 19.9 103.4 38.3 5.9 EBITDA (%) 19.5 12.0 747 bps 18.4 111 bps PAT 21.3 7.6 178.5 21.1 0.7 Key financials | Crore FY17 FY18E FY19E FY20E Revenue 727.6 806.2 921.5 1,051.2 EBITDA 119.4 145.9 165.9 188.2 Net Profit 54.0 73.3 85.9 100.0 EPS (|) 5.6 7.6 8.9 10.3 Valuation summary FY17 FY18E FY19E FY20E P/E (x) 30.5 22.5 19.2 16.5 Target P/E 38.6 28.4 24.3 20.8 EV/EBITDA 15.8 12.7 11.1 9.6 P/BV 5.2 4.5 3.8 3.3 RoE (%) 17.0 20.0 20.0 19.8 RoCE (%) 16.1 20.9 21.8 22.5 Stock data Particular Amount Market Capitalization 1,648 Total Debt (FY17) 265 Cash and Investments (FY17) 23 EV (FY17) 1,853 52 week H/L (|) 182 / 103 Equity capital 19.4 Face value (|) 2.0 Price performance 1M 3M 6M 12M NRB Bearings (6.4) 14.6 47.0 44.3 Schaeffler India (7.2) 3.5 24.5 28.9 SKF India (0.9) 8.0 20.4 28.9 Timken India (16.6) 4.5 21.2 30.2 Research Analyst Chirag J Shah [email protected] Sagar K Gandhi [email protected]
Transcript of NRB Bearings (NRBBEA) | 170content.icicidirect.com/mailimages/IDirect_NRBBearings_Q3FY18.pdf ·...
February 14, 2018
ICICI Securities Ltd | Retail Equity Research
Result Update
Stellar performance…
NRB Bearings reported stellar Q3FY18 numbers. The company
reported topline, EBITDA, PAT numbers above our estimates
Revenues came in at | 207.9 crore, up 25.4% YoY. We estimated
revenues of | 192.1 crore (15.9% YoY growth) for the quarter
EBITDA increased 103.4% YoY to | 40.5 crore. The company
reported strong EBITDA on account of a sharp increase in gross
margins (up 830 bps YoY). Accordingly, EBITDA margins came in at
19.5% vs. 12% in Q3FY17. We estimated margins of 13.4% for the
quarter. Employee expenses as a percentage of sales also reduced
from 18.9% to 15.7% YoY
Non-operating expenses like depreciation and interest expenses
declined 17% and 16.7% YoY, respectively. Accordingly, PAT
increased strong 178.5% YoY to | 21.3 crore
Leading bearings manufacturer with focus on cylindrical & needle bearing
NRB is the leader in the needle bearing segment in India with ~70%
market share. Needle roller bearings comprised ~41% of NRB’s topline in
FY17. A needle roller bearing, as a customised product, requires NRB to
work with OEMs from the conceptualisation stage. This enables it to build
sticky clientele relationships with almost all major OEM players. Apart
from needle bearings, the other key product that the company
manufactures is ball & roller bearings, together contributing 78% to the
topline of the company.
Performance from export business to drive growth over FY17-20E
To expand its geographical footprints and foray into newer platforms,
NRB has forayed into exports wherein it caters to global players such as
Daimler, Renault, Volvo and Getrag. NRB’s exports, which grew at 11%
CAGR in FY13-17, have also provided a natural hedge for its import of raw
materials. Exports contributed ~18% to revenues in FY17. Going forward,
we expect export revenues to grow at 13.8% CAGR in FY17-20E to | 196
crore.
Topline growth likely to accelerate due to recovery in auto, after-markets
While FY17 witnessed a slight recovery in auto volumes, we believe the
same will gain traction in FY17-20E. We estimate the auto industry to
grow at 6-8% CAGR over FY17-20E. Accordingly, we expect bearings
demand from the OEM segment to grow at CAGR of 12.7% over FY17-
20E. Similarly, we expect business from after-market segment to grow at
a CAGR of 13.2% over FY17-20E. Thus, we expect NRB’s OEM segment
and after-market segment to clock revenues of | 689.5 crore and | 135.6
crore respectively.
Reasonable valuation, maintain BUY
We maintain our BUY recommendation on reasonable valuations (16.5x
FY20E earnings) and an improving growth outlook from its key segment –
automotive and the after-market segment. We now estimate topline and
bottomline growth of 13% and 22.8% CAGR over FY17-20E. With
moderate capex of ~| 50 crore over FY18E-20E, we believe NRB is well
placed to capitalise on the next phase of growth. We continue to value
the company at 21x FY20E EPS of | 10.3 to arrive at a target price to | 215
per share. We recommend BUY on the company.
NRB Bearings (NRBBEA) | 170
Rating matrix
Rating : Buy
Target : | 215
Target Period : 12 months
Potential Upside : 26%
What’s changed?
Target Changed from | 170 to | 215
EPS FY19E Changed from | 7.1 to | 8.9
EPS FY20E Changed from | 8.1 to | 10.3
Rating Unchanged
Quarterly performance
Q3FY18 Q3FY17 YoY (%) Q2FY18 QoQ (%)
Revenue 207.9 165.7 25.4 208.2 (0.2)
EBITDA 40.5 19.9 103.4 38.3 5.9
EBITDA (%) 19.5 12.0 747 bps 18.4 111 bps
PAT 21.3 7.6 178.5 21.1 0.7
Key financials
| Crore FY17 FY18E FY19E FY20E
Revenue 727.6 806.2 921.5 1,051.2
EBITDA 119.4 145.9 165.9 188.2
Net Profit 54.0 73.3 85.9 100.0
EPS (|) 5.6 7.6 8.9 10.3
Valuation summary
FY17 FY18E FY19E FY20E
P/E (x) 30.5 22.5 19.2 16.5
Target P/E 38.6 28.4 24.3 20.8
EV/EBITDA 15.8 12.7 11.1 9.6
P/BV 5.2 4.5 3.8 3.3
RoE (%) 17.0 20.0 20.0 19.8
RoCE (%) 16.1 20.9 21.8 22.5
Stock data
Particular Amount
Market Capitalization 1,648
Total Debt (FY17) 265
Cash and Investments (FY17) 23
EV (FY17) 1,853
52 week H/L (|) 182 / 103
Equity capital 19.4
Face value (|) 2.0
Price performance
1M 3M 6M 12M
NRB Bearings (6.4) 14.6 47.0 44.3
Schaeffler India (7.2) 3.5 24.5 28.9
SKF India (0.9) 8.0 20.4 28.9
Timken India (16.6) 4.5 21.2 30.2
Research Analyst
Chirag J Shah
Sagar K Gandhi
ICICI Securities Ltd | Retail Equity Research Page 2
Variance analysis
Year Q3FY18 Q3FY18E Q3FY17 YoY (%) Q2FY18 QoQ(%) Comments
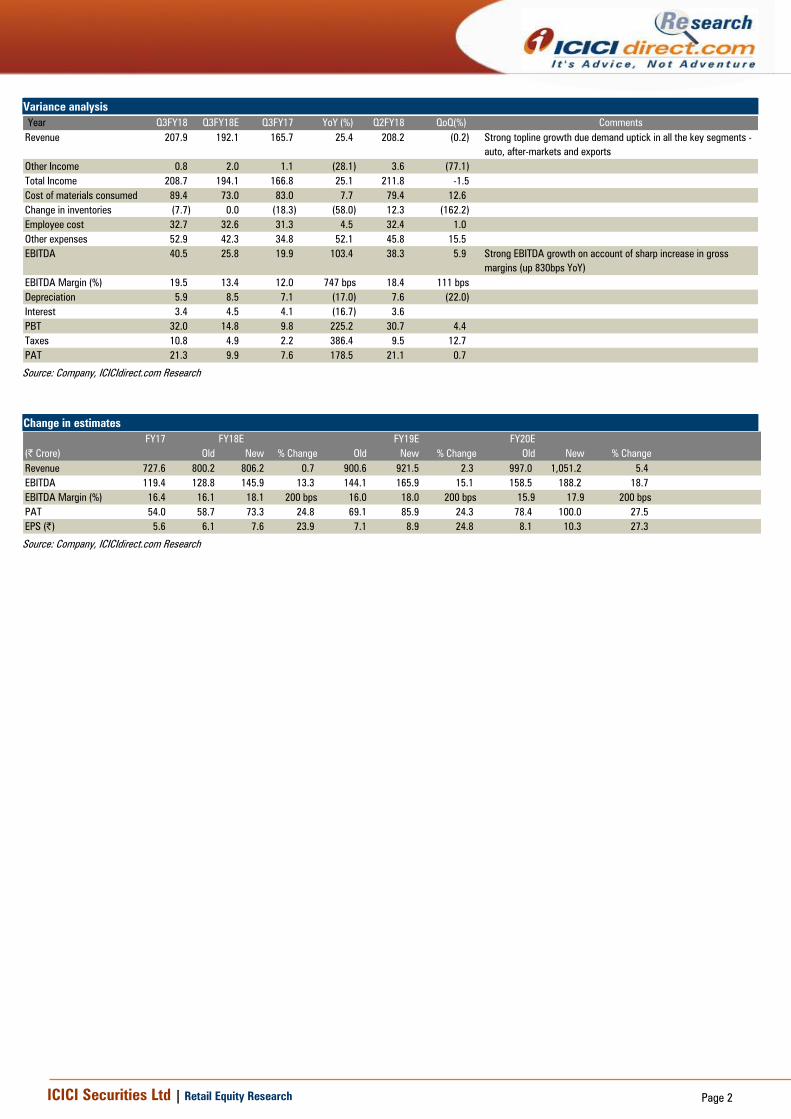
Revenue 207.9 192.1 165.7 25.4 208.2 (0.2) Strong topline growth due demand uptick in all the key segments -
auto, after-markets and exports
Other Income 0.8 2.0 1.1 (28.1) 3.6 (77.1)
Total Income 208.7 194.1 166.8 25.1 211.8 -1.5
Cost of materials consumed 89.4 73.0 83.0 7.7 79.4 12.6
Change in inventories (7.7) 0.0 (18.3) (58.0) 12.3 (162.2)
Employee cost 32.7 32.6 31.3 4.5 32.4 1.0
Other expenses 52.9 42.3 34.8 52.1 45.8 15.5
EBITDA 40.5 25.8 19.9 103.4 38.3 5.9 Strong EBITDA growth on account of sharp increase in gross
margins (up 830bps YoY)
EBITDA Margin (%) 19.5 13.4 12.0 747 bps 18.4 111 bps
Depreciation 5.9 8.5 7.1 (17.0) 7.6 (22.0)
Interest 3.4 4.5 4.1 (16.7) 3.6
PBT 32.0 14.8 9.8 225.2 30.7 4.4
Taxes 10.8 4.9 2.2 386.4 9.5 12.7
PAT 21.3 9.9 7.6 178.5 21.1 0.7
Source: Company, ICICIdirect.com Research
Change in estimates
FY17 FY18E FY19E FY20E
(| Crore) Old New % Change Old New % Change Old New % Change
Revenue 727.6 800.2 806.2 0.7 900.6 921.5 2.3 997.0 1,051.2 5.4
EBITDA 119.4 128.8 145.9 13.3 144.1 165.9 15.1 158.5 188.2 18.7
EBITDA Margin (%) 16.4 16.1 18.1 200 bps 16.0 18.0 200 bps 15.9 17.9 200 bps
PAT 54.0 58.7 73.3 24.8 69.1 85.9 24.3 78.4 100.0 27.5
EPS (|) 5.6 6.1 7.6 23.9 7.1 8.9 24.8 8.1 10.3 27.3
Source: Company, ICICIdirect.com Research
ICICI Securities Ltd | Retail Equity Research Page 3
Company Analysis
Strong client relations to drive growth
Presence across major OEM players, new segments to open up opportunities
NRB is present across the auto OEM space through its exposure to the
two-wheelers, four-wheelers, commercial vehicles (CV), passenger
vehicles (PV) and off-highway segments. With a proven track record over
50 years, it is a preferred supplier to leading domestic OEMs such as Hero
MotoCorp, Bajaj Auto, Maruti Suzuki, Tata Motors, Ashok Leyland, etc.
which is clearly depicted in the staggering 70% market share commanded
by the company in the needle roller bearings space. A needle roller
bearing is a customised product. Hence, the company works with OEMs
from the conceptualisation stage to provide anti-friction solutions. This
enables NRB to build a sticky clientele relationship with major OEM
players.
Apart from the automotive segment, the company also enjoys a presence
in the race boats segment wherein Ingersoll Rand is one of the key
customers. Furthermore, NRB has also outlined growth opportunities in
other mobility segments such as defence in the form of gun carriers,
marine, Railways and MRTS wherein rising investment could open up
avenues for bearings demands.
NRB, whose domestic automotive segment, forms ~62% of the topline,
caters to almost all segment viz. two-wheelers (33% of revenues), CV
(19% of revenues), PV (20% of revenues) and farm/off highway (forming
10% of revenues). Domestic automotive OEM revenues of NRB have
grown at 6.6% CAGR during FY13-17 to | 482.2 crore.
Exhibit 1: Key customers of NRB
Category Key customers
Two-wheeler OEMs Hero MotoCorp, HMSI, Bajaj Auto, TVS Motor
PV Maruti Suzuki, Tata Motors
CV/Utility vehicle Mahindra & Mahindra, Ashok Leyland
Source: Company, ICICIdirect.com Research
Diversified client base helps diversify risk
NRB’s client portfolio is well diversified with the average share of the top
customer over FY13-17 at ~10% of revenues.
The contribution of NRB’s top 10 clients is at ~54% of the topline. The
company also indicated that the constituents of the top 10 keep on
changing based on the individual segmental growth.
Automotive segment recovery to boost demand…
NRB OEM segment moves in tandem with industry sales volumes…
Revenue growth of NRB’s auto segment has mimicked overall auto sales
volumes. It is noteworthy, for the year, wherein auto volumes jumped
sharply. NRB had shown a similar sharp uptick. For example, in FY10 and
FY11, when overall auto volumes grew ~25% and 26% YoY, respectively,
NRB’s auto segment grew ~34% and ~38% YoY, respectively. Similarly,
during the challenging times for the automotive segment (muted 2% and
4% YoY growth in FY13 and FY14, respectively), NRB’s auto segment
declined at 4.3% and 1.2% YoY in FY13 and FY14, respectively, exhibiting
a strong correlation. With the auto industry again showing signs of
traction in FY17, we believe the recovery will now be visible from FY18E-
20E. Accordingly, we now expect revenues to grow at 13% CAGR in
FY17-20E to | 1051.2crore.
A needle roller bearing is a customised product. Hence, the
company works with OEMs from the conceptualisation
stage to provide anti-friction solutions
ICICI Securities Ltd | Retail Equity Research Page 4
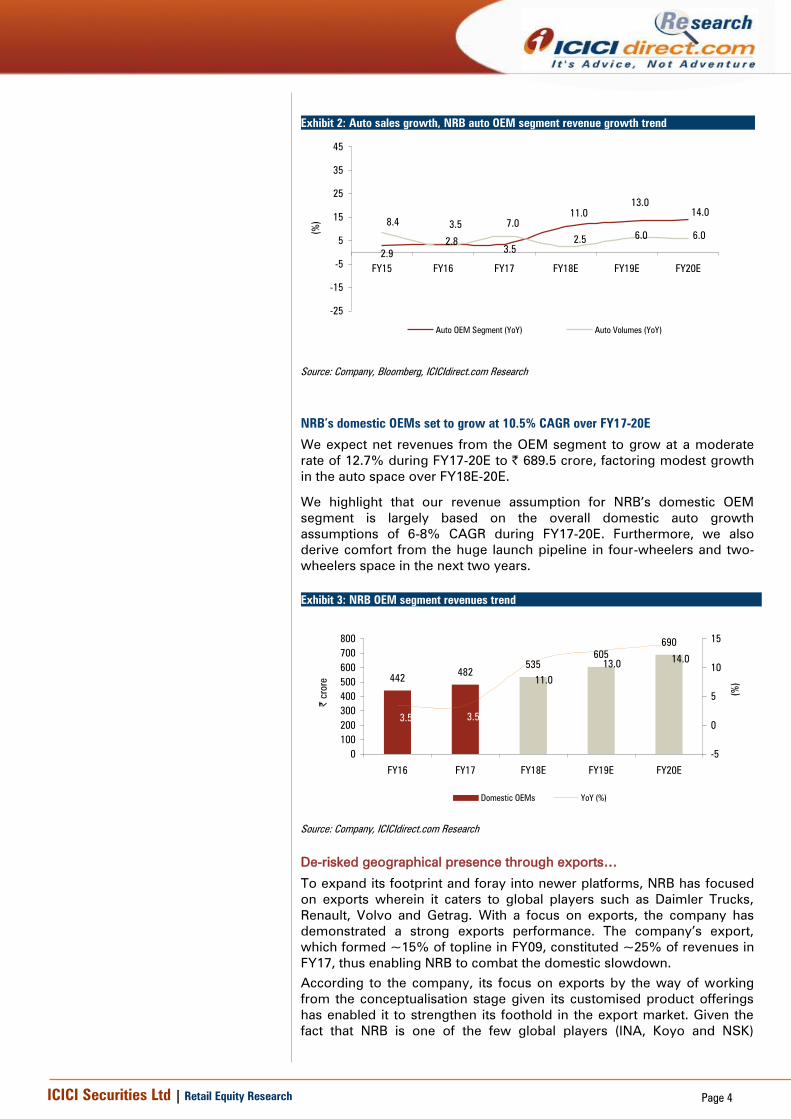
NRB’s domestic OEMs set to grow at 10.5% CAGR over FY17-20E
We expect net revenues from the OEM segment to grow at a moderate
rate of 12.7% during FY17-20E to | 689.5 crore, factoring modest growth
in the auto space over FY18E-20E.
We highlight that our revenue assumption for NRB’s domestic OEM
segment is largely based on the overall domestic auto growth
assumptions of 6-8% CAGR during FY17-20E. Furthermore, we also
derive comfort from the huge launch pipeline in four-wheelers and two-
wheelers space in the next two years.
Exhibit 3: NRB OEM segment revenues trend
442482
535
605
690
3.5 3.5
11.0
13.014.0
0
100
200
300
400
500
600
700
800
FY16 FY17 FY18E FY19E FY20E
| c
rore
-5
0
5
10
15
(%
)
Domestic OEMs YoY (%)
Source: Company, ICICIdirect.com Research
De-risked geographical presence through exports…
To expand its footprint and foray into newer platforms, NRB has focused
on exports wherein it caters to global players such as Daimler Trucks,
Renault, Volvo and Getrag. With a focus on exports, the company has
demonstrated a strong exports performance. The company’s export,
which formed ~15% of topline in FY09, constituted ~25% of revenues in
FY17, thus enabling NRB to combat the domestic slowdown.
According to the company, its focus on exports by the way of working
from the conceptualisation stage given its customised product offerings
has enabled it to strengthen its foothold in the export market. Given the
fact that NRB is one of the few global players (INA, Koyo and NSK)
Exhibit 2: Auto sales growth, NRB auto OEM segment revenue growth trend
2.9
3.5
3.5
11.0
13.0
14.0
8.4
2.8
7.0
2.56.0 6.0
-25
-15
-5
5
15
25
35
45
FY15 FY16 FY17 FY18E FY19E FY20E
(%
)
Auto OEM Segment (YoY) Auto Volumes (YoY)
Source: Company, Bloomberg, ICICIdirect.com Research

ICICI Securities Ltd | Retail Equity Research Page 5
producing needle roller bearings coupled with the technology at par with
MNCs, export earnings are expected to remain robust.
Going ahead, we expect NRB’s export revenues to grow at 13.5% CAGR
over FY17-20E. Consequently, the share of export revenues is expected to
contribute ~19% of revenues in FY20E.
Exhibit 4: NRB export revenue trend
132.9
148.2
170.4
196.0
2.3
11.5
15.0
15.0
0
50
100
150
200
250
FY17 FY18E FY19E FY20E
| c
rore
0
2
4
6
8
10
12
14
16
(%
)
Exports YoY (RHS)
Source: Company, ICICIdirect.com Research
Exhibit 5: Exports as % of topline
18.5 18.8 19.1 19.2
0
5
10
15
20
25
30
35
FY17 FY18E FY19E FY20E
(%
)
Exports
Source: Company, ICICIdirect.com Research
ICICI Securities Ltd | Retail Equity Research Page 6
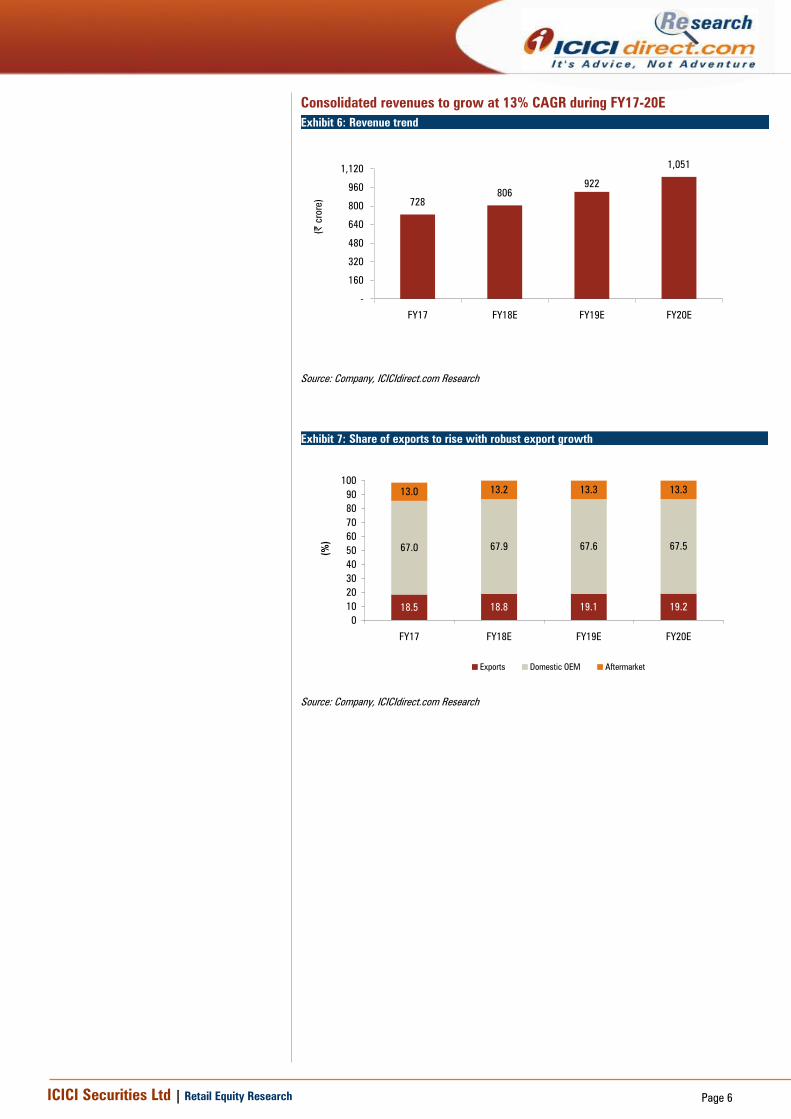
Consolidated revenues to grow at 13% CAGR during FY17-20E
Exhibit 6: Revenue trend
728
806
1,051
922
-
160
320
480
640
800
960
1,120
FY17 FY18E FY19E FY20E(|
crore)
Source: Company, ICICIdirect.com Research
Exhibit 7: Share of exports to rise with robust export growth
18.5 18.8 19.1 19.2
67.0 67.9 67.6 67.5
13.0 13.2 13.3 13.3
0
10
20
30
40
50
60
70
80
90
100
FY17 FY18E FY19E FY20E
(%
)
Exports Domestic OEM Aftermarket
Source: Company, ICICIdirect.com Research
ICICI Securities Ltd | Retail Equity Research Page 7
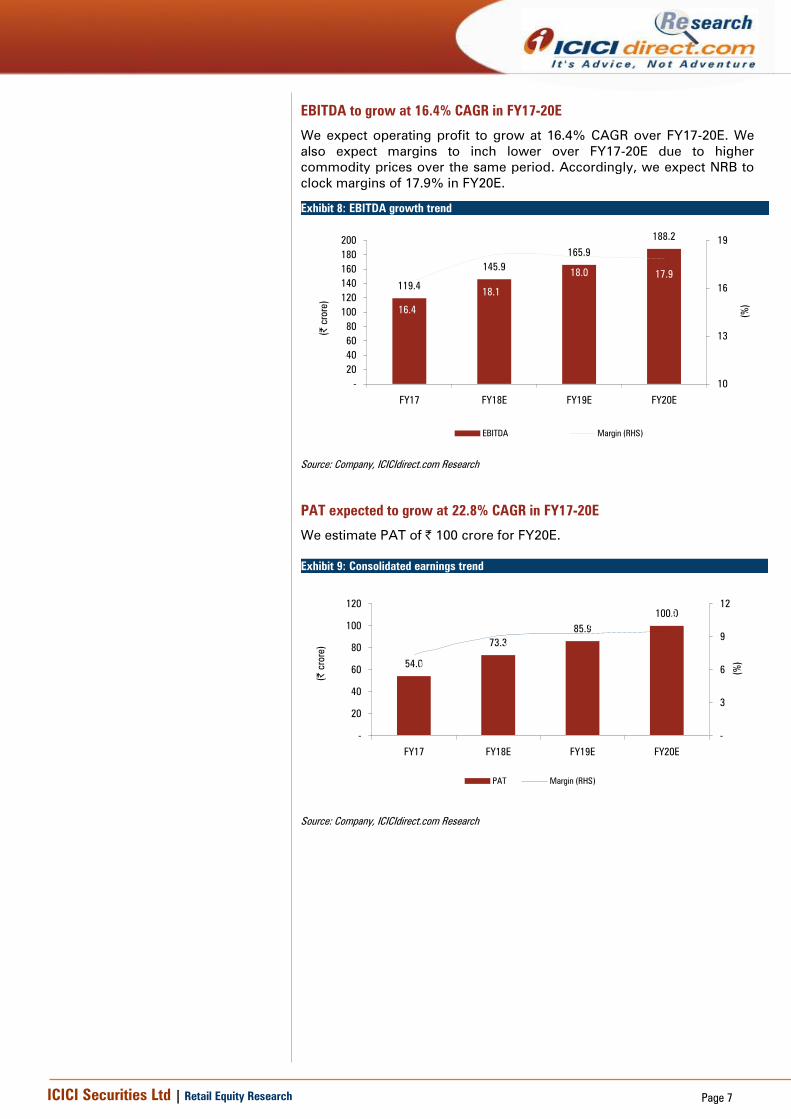
EBITDA to grow at 16.4% CAGR in FY17-20E
We expect operating profit to grow at 16.4% CAGR over FY17-20E. We
also expect margins to inch lower over FY17-20E due to higher
commodity prices over the same period. Accordingly, we expect NRB to
clock margins of 17.9% in FY20E.
Exhibit 8: EBITDA growth trend
119.4
165.9
188.2
145.9
16.4
18.1
18.0 17.9
-
20
40
60
80
100
120
140
160
180
200
FY17 FY18E FY19E FY20E
(|
crore)
10
13
16
19
(%
)
EBITDA Margin (RHS)
Source: Company, ICICIdirect.com Research
PAT expected to grow at 22.8% CAGR in FY17-20E
We estimate PAT of | 100 crore for FY20E.
Exhibit 9: Consolidated earnings trend
54.0
73.3
85.9
100.0
7.4
9.1
9.3
9.5
-
20
40
60
80
100
120
FY17 FY18E FY19E FY20E
(|
crore)
-
3
6
9
12
(%
)
PAT Margin (RHS)
Source: Company, ICICIdirect.com Research
ICICI Securities Ltd | Retail Equity Research Page 8
Outlook and valuation
NRB has been a key player in the domestic bearings industry considering
its leadership position in needle roller bearings. Being an automotive
centric supplier with customised product offerings, the company also
enjoys a sticky client relationship like its MNC peers such as SKF, FAG
and Timken and has a presence across all leading OEM players in India.
Going ahead, with the overall improvement in the economy and other
macro factors such as easing of inflation and lowering of interest rates,
automotive volumes are expected to bounce back. NRB, being an
important player in the automotive bearings space with a leadership
position in needle roller bearings, is expected to be a key beneficiary.
We continue with our BUY recommendation on reasonable valuations
(16.5x FY20E earnings) and an improving growth outlook from its key
segment – automotive and the after-market segment. We now estimate
topline and bottomline growth of 13% and 22.8% CAGR over FY17-20E.
With moderate capex of ~| 50 crore over FY18E-20E, we believe NRB is
well placed to capitalize on the next phase of growth. We continue to
value the company at 21x FY20E EPS of | 10.3 to arrive at a target price to
| 215 per share. We recommend BUY on the company.
ICICI Securities Ltd | Retail Equity Research Page 9
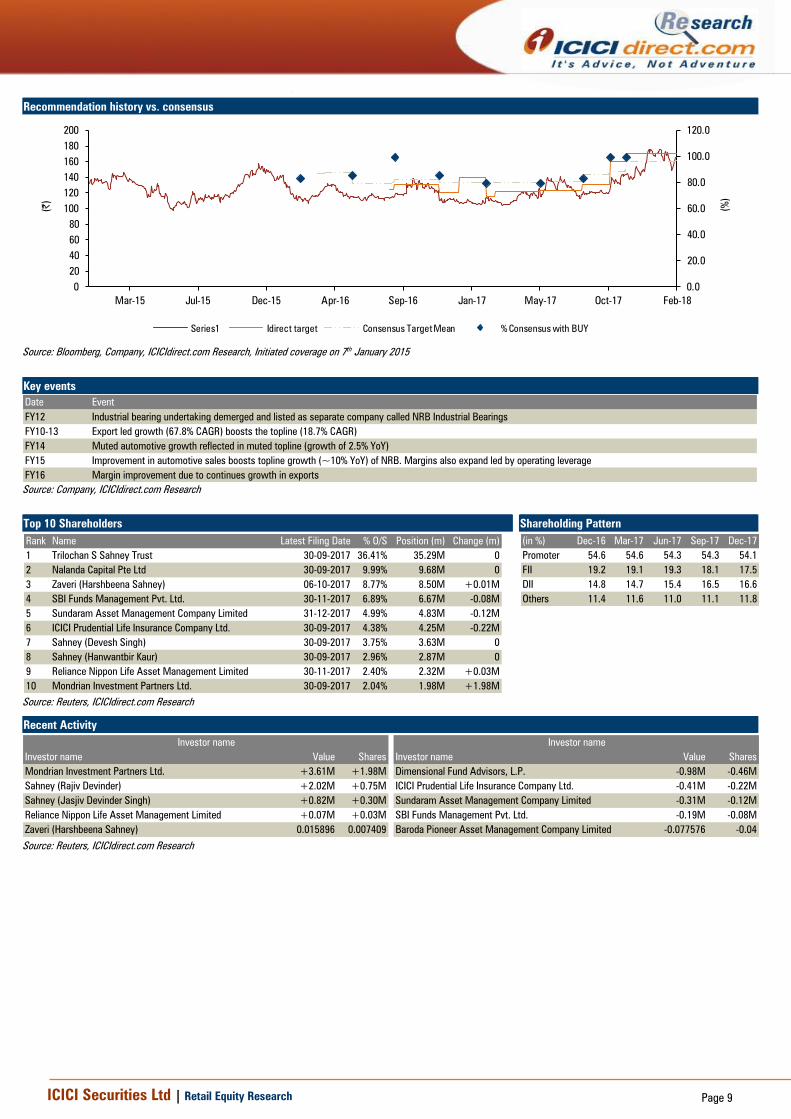
Recommendation history vs. consensus
0.0
20.0
40.0
60.0
80.0
100.0
120.0
0
20
40
60
80
100
120
140
160
180
200
Feb-18Oct-17May-17Jan-17Sep-16Apr-16Dec-15Jul-15Mar-15
(%
)
(|)
Series1 Idirect target Consensus Target Mean % Consensus with BUY
Source: Bloomberg, Company, ICICIdirect.com Research, Initiated coverage on 7th January 2015
Key events
Date Event
FY12 Industrial bearing undertaking demerged and listed as separate company called NRB Industrial Bearings
FY10-13 Export led growth (67.8% CAGR) boosts the topline (18.7% CAGR)
FY14 Muted automotive growth reflected in muted topline (growth of 2.5% YoY)
FY15 Improvement in automotive sales boosts topline growth (~10% YoY) of NRB. Margins also expand led by operating leverage
FY16 Margin improvement due to continues growth in exports
Source: Company, ICICIdirect.com Research
Top 10 Shareholders Shareholding Pattern
Rank Name Latest Filing Date % O/S Position (m) Change (m)
1 Trilochan S Sahney Trust 30-09-2017 36.41% 35.29M 0
2 Nalanda Capital Pte Ltd 30-09-2017 9.99% 9.68M 0
3 Zaveri (Harshbeena Sahney) 06-10-2017 8.77% 8.50M +0.01M
4 SBI Funds Management Pvt. Ltd. 30-11-2017 6.89% 6.67M -0.08M
5 Sundaram Asset Management Company Limited 31-12-2017 4.99% 4.83M -0.12M
6 ICICI Prudential Life Insurance Company Ltd. 30-09-2017 4.38% 4.25M -0.22M
7 Sahney (Devesh Singh) 30-09-2017 3.75% 3.63M 0
8 Sahney (Hanwantbir Kaur) 30-09-2017 2.96% 2.87M 0
9 Reliance Nippon Life Asset Management Limited 30-11-2017 2.40% 2.32M +0.03M
10 Mondrian Investment Partners Ltd. 30-09-2017 2.04% 1.98M +1.98M
(in %) Dec-16 Mar-17 Jun-17 Sep-17 Dec-17
Promoter 54.6 54.6 54.3 54.3 54.1
FII 19.2 19.1 19.3 18.1 17.5
DII 14.8 14.7 15.4 16.5 16.6
Others 11.4 11.6 11.0 11.1 11.8
Source: Reuters, ICICIdirect.com Research
Recent Activity
Investor name Value Shares Investor name Value Shares
Mondrian Investment Partners Ltd. +3.61M +1.98M Dimensional Fund Advisors, L.P. -0.98M -0.46M
Sahney (Rajiv Devinder) +2.02M +0.75M ICICI Prudential Life Insurance Company Ltd. -0.41M -0.22M
Sahney (Jasjiv Devinder Singh) +0.82M +0.30M Sundaram Asset Management Company Limited -0.31M -0.12M
Reliance Nippon Life Asset Management Limited +0.07M +0.03M SBI Funds Management Pvt. Ltd. -0.19M -0.08M
Zaveri (Harshbeena Sahney) 0.015896 0.007409 Baroda Pioneer Asset Management Company Limited -0.077576 -0.04
Investor name Investor name
Source: Reuters, ICICIdirect.com Research
ICICI Securities Ltd | Retail Equity Research Page 10
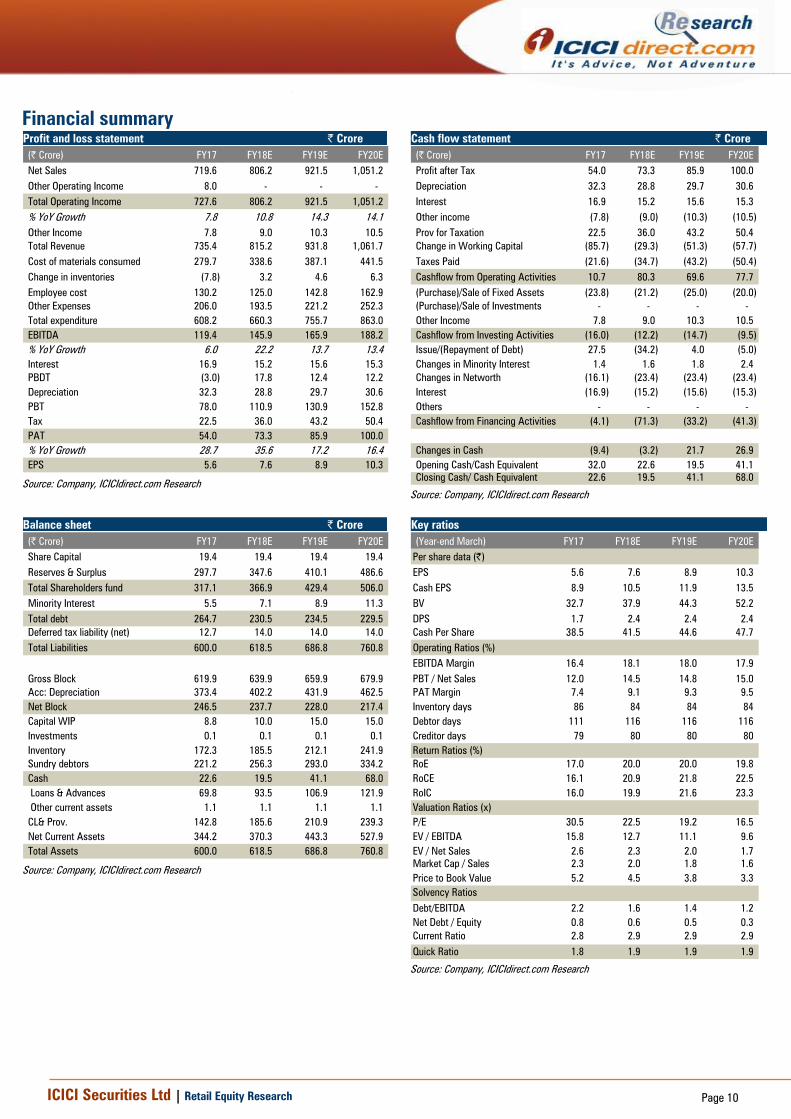
Financial summary
Profit and loss statement | Crore
(| Crore) FY17 FY18E FY19E FY20E
Net Sales 719.6 806.2 921.5 1,051.2
Other Operating Income 8.0 - - -
Total Operating Income 727.6 806.2 921.5 1,051.2
% YoY Growth 7.8 10.8 14.3 14.1
Other Income 7.8 9.0 10.3 10.5
Total Revenue 735.4 815.2 931.8 1,061.7
Cost of materials consumed 279.7 338.6 387.1 441.5
Change in inventories (7.8) 3.2 4.6 6.3
Employee cost 130.2 125.0 142.8 162.9
Other Expenses 206.0 193.5 221.2 252.3
Total expenditure 608.2 660.3 755.7 863.0
EBITDA 119.4 145.9 165.9 188.2
% YoY Growth 6.0 22.2 13.7 13.4
Interest 16.9 15.2 15.6 15.3
PBDT (3.0) 17.8 12.4 12.2
Depreciation 32.3 28.8 29.7 30.6
PBT 78.0 110.9 130.9 152.8
Tax 22.5 36.0 43.2 50.4
PAT 54.0 73.3 85.9 100.0
% YoY Growth 28.7 35.6 17.2 16.4
EPS 5.6 7.6 8.9 10.3
Source: Company, ICICIdirect.com Research
Cash flow statement | Crore
(| Crore) FY17 FY18E FY19E FY20E
Profit after Tax 54.0 73.3 85.9 100.0
Depreciation 32.3 28.8 29.7 30.6
Interest 16.9 15.2 15.6 15.3
Other income (7.8) (9.0) (10.3) (10.5)
Prov for Taxation 22.5 36.0 43.2 50.4
Change in Working Capital (85.7) (29.3) (51.3) (57.7)
Taxes Paid (21.6) (34.7) (43.2) (50.4)
Cashflow from Operating Activities 10.7 80.3 69.6 77.7
(Purchase)/Sale of Fixed Assets (23.8) (21.2) (25.0) (20.0)
(Purchase)/Sale of Investments - - - -
Other Income 7.8 9.0 10.3 10.5
Cashflow from Investing Activities (16.0) (12.2) (14.7) (9.5)
Issue/(Repayment of Debt) 27.5 (34.2) 4.0 (5.0)
Changes in Minority Interest 1.4 1.6 1.8 2.4
Changes in Networth (16.1) (23.4) (23.4) (23.4)
Interest (16.9) (15.2) (15.6) (15.3)
Others - - - -
Cashflow from Financing Activities (4.1) (71.3) (33.2) (41.3)
Changes in Cash (9.4) (3.2) 21.7 26.9
Opening Cash/Cash Equivalent 32.0 22.6 19.5 41.1
Closing Cash/ Cash Equivalent 22.6 19.5 41.1 68.0
Source: Company, ICICIdirect.com Research
Balance sheet | Crore
(| Crore) FY17 FY18E FY19E FY20E
Share Capital 19.4 19.4 19.4 19.4
Reserves & Surplus 297.7 347.6 410.1 486.6
Total Shareholders fund 317.1 366.9 429.4 506.0
Minority Interest 5.5 7.1 8.9 11.3
Total debt 264.7 230.5 234.5 229.5
Deferred tax liability (net) 12.7 14.0 14.0 14.0
Total Liabilities 600.0 618.5 686.8 760.8
Gross Block 619.9 639.9 659.9 679.9
Acc: Depreciation 373.4 402.2 431.9 462.5
Net Block 246.5 237.7 228.0 217.4
Capital WIP 8.8 10.0 15.0 15.0
Investments 0.1 0.1 0.1 0.1
Inventory 172.3 185.5 212.1 241.9
Sundry debtors 221.2 256.3 293.0 334.2
Cash 22.6 19.5 41.1 68.0
Loans & Advances 69.8 93.5 106.9 121.9
Other current assets 1.1 1.1 1.1 1.1
CL& Prov. 142.8 185.6 210.9 239.3
Net Current Assets 344.2 370.3 443.3 527.9
Total Assets 600.0 618.5 686.8 760.8
Source: Company, ICICIdirect.com Research
Key ratios
(Year-end March) FY17 FY18E FY19E FY20E
Per share data (|)
EPS 5.6 7.6 8.9 10.3
Cash EPS 8.9 10.5 11.9 13.5
BV 32.7 37.9 44.3 52.2
DPS 1.7 2.4 2.4 2.4
Cash Per Share 38.5 41.5 44.6 47.7
Operating Ratios (%)
EBITDA Margin 16.4 18.1 18.0 17.9
PBT / Net Sales 12.0 14.5 14.8 15.0
PAT Margin 7.4 9.1 9.3 9.5
Inventory days 86 84 84 84
Debtor days 111 116 116 116
Creditor days 79 80 80 80
Return Ratios (%)
RoE 17.0 20.0 20.0 19.8
RoCE 16.1 20.9 21.8 22.5
RoIC 16.0 19.9 21.6 23.3
Valuation Ratios (x)
P/E 30.5 22.5 19.2 16.5
EV / EBITDA 15.8 12.7 11.1 9.6
EV / Net Sales 2.6 2.3 2.0 1.7
Market Cap / Sales 2.3 2.0 1.8 1.6
Price to Book Value 5.2 4.5 3.8 3.3
Solvency Ratios
Debt/EBITDA 2.2 1.6 1.4 1.2
Net Debt / Equity 0.8 0.6 0.5 0.3
Current Ratio 2.8 2.9 2.9 2.9
Quick Ratio 1.8 1.9 1.9 1.9
Source: Company, ICICIdirect.com Research
ICICI Securities Ltd | Retail Equity Research Page 11
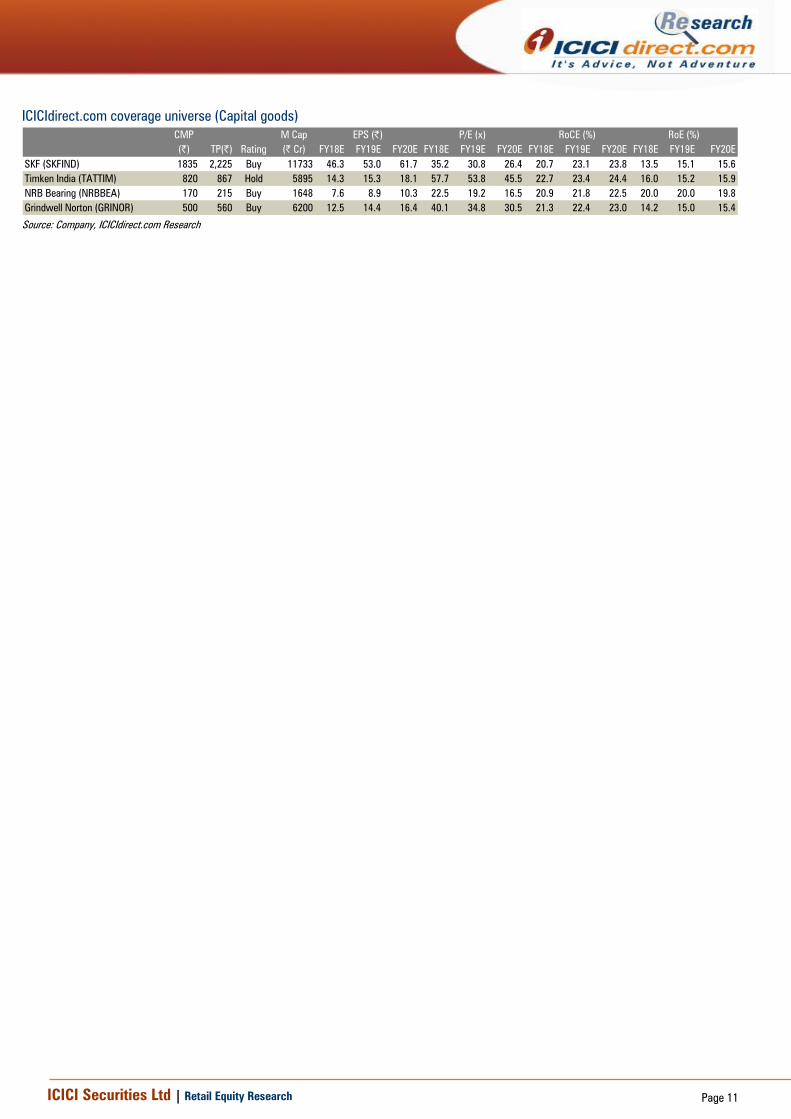
ICICIdirect.com coverage universe (Capital goods)
CMP M Cap
(|) TP(|) Rating (| Cr) FY18E FY19E FY20E FY18E FY19E FY20E FY18E FY19E FY20E FY18E FY19E FY20E
SKF (SKFIND) 1835 2,225 Buy 11733 46.3 53.0 61.7 35.2 30.8 26.4 20.7 23.1 23.8 13.5 15.1 15.6
Timken India (TATTIM) 820 867 Hold 5895 14.3 15.3 18.1 57.7 53.8 45.5 22.7 23.4 24.4 16.0 15.2 15.9
NRB Bearing (NRBBEA) 170 215 Buy 1648 7.6 8.9 10.3 22.5 19.2 16.5 20.9 21.8 22.5 20.0 20.0 19.8
Grindwell Norton (GRINOR) 500 560 Buy 6200 12.5 14.4 16.4 40.1 34.8 30.5 21.3 22.4 23.0 14.2 15.0 15.4
RoCE (%) RoE (%)EPS (|) P/E (x)
Source: Company, ICICIdirect.com Research
ICICI Securities Ltd | Retail Equity Research Page 12
RATING RATIONALE
ICICIdirect.com endeavours to provide objective opinions and recommendations. ICICIdirect.com assigns
ratings to its stocks according to their notional target price vs. current market price and then categorises them
as Strong Buy, Buy, Hold and Sell. The performance horizon is two years unless specified and the notional
target price is defined as the analysts' valuation for a stock.
Strong Buy: >15%/20% for large caps/midcaps, respectively, with high conviction;
Buy: >10%/15% for large caps/midcaps, respectively;
Hold: Up to +/-10%;
Sell: -10% or more;
Pankaj Pandey Head – Research [email protected]
ICICIdirect.com Research Desk,
ICICI Securities Limited,
1st Floor, Akruti Trade Centre,
Road No 7, MIDC,
Andheri (East)
Mumbai – 400 093
ICICI Securities Ltd | Retail Equity Research Page 13
Disclaimer
ANALYST CERTIFICATION
We /I, Chirag Shah PGDBM; Sagar Gandhi MBA (Finance), Research Analysts, authors and the names subscribed to this report, hereby certify that all of the views expressed in this research report accurately reflect our views about the subject
issuer(s) or securities. We also certify that no part of our compensation was, is, or will be directly or indirectly related to the specific recommendation(s) or view(s) in this report.
Terms & conditions and other disclosures:
ICICI Securities Limited (ICICI Securities) is a full-service, integrated investment banking and is, inter alia, engaged in the business of stock brokering and distribution of financial products. ICICI Securities Limited is a Sebi registered Research Analyst with Sebi Registration Number – INH000000990. ICICI Securities is a wholly-owned subsidiary of ICICI Bank which is India’s largest private sector bank and has its various subsidiaries engaged in businesses of housing finance, asset management, life insurance, general insurance, venture capital fund management, etc. (“associates”), the details in respect of which are available on www.icicibank.com.
ICICI Securities is one of the leading merchant bankers/ underwriters of securities and participate in virtually all securities trading markets in India. We and our associates might have investment banking and other business relationship with a significant percentage of companies covered by our Investment Research Department. ICICI Securities generally prohibits its analysts, persons reporting to analysts and their relatives from maintaining a financial interest in the securities or derivatives of any companies that the analysts cover.
The information and opinions in this report have been prepared by ICICI Securities and are subject to change without any notice. The report and information contained herein is strictly confidential and meant solely for the selected recipient and may not be altered in any way, transmitted to, copied or distributed, in part or in whole, to any other person or to the media or reproduced in any form, without prior written consent of ICICI Securities. While we would endeavour to update the information herein on a reasonable basis, ICICI Securities is under no obligation to update or keep the information current. Also, there may be regulatory, compliance or other reasons that may prevent ICICI Securities from doing so. Non-rated securities indicate that rating on a particular security has been suspended temporarily and such suspension is in compliance with applicable regulations and/or ICICI Securities policies, in circumstances where ICICI Securities might be acting in an advisory capacity to this company, or in certain other circumstances.
This report is based on information obtained from public sources and sources believed to be reliable, but no independent veri fication has been made nor is its accuracy or completeness guaranteed. This report and information herein is solely for informational purpose and shall not be used or considered as an offer document or solicitation of offer to buy or sell or subscribe for securities or other financial instruments. Though disseminated to all the customers simultaneously, not all customers may receive this report at the same time. ICICI Securities will not treat recipients as customers by virtue of their receiving this report. Nothing in this report constitutes investment, legal, accounting and tax advice or a representation that any investment or strategy is suitable or appropriate to your specific circumstances. The securities discussed and opinions expressed in this report may not be suitable for all investors, who must make their own investment decisions, based on their own investment objectives, financial positions and needs of specific recipient. This may not be taken in substitution for the exercise of independent judgment by any recipient. The recipient should independently evaluate the investment risks. The value and return on investment may vary because of changes in interest rates, foreign exchange rates or any other reason. ICICI Securities accepts no liabilities whatsoever for any loss or damage of any kind arising out of the use of this report. Past performance is not necessarily a guide to future performance. Investors are advised to see Risk Disclosure Document to understand the risks associated before investing in the securities markets. Actual results may differ materially from those set forth in projections. Forward-looking statements are not predictions and may be subject to change without notice.
ICICI Securities or its associates might have managed or co-managed public offering of securities for the subject company or might have been mandated by the subject company for any other assignment in the past twelve months.
ICICI Securities or its associates might have received any compensation from the companies mentioned in the report during the period preceding twelve months from the date of this report for services in respect of managing or co-managing public offerings, corporate finance, investment banking or merchant banking, brokerage services or other advisory service in a merger or specific transaction.
ICICI Securities or its associates might have received any compensation for products or services other than investment banking or merchant banking or brokerage services from the companies mentioned in the report in the past twelve months.
ICICI Securities encourages independence in research report preparation and strives to minimize conflict in preparation of research report. ICICI Securities or its associates or its analysts did not receive any compensation or other benefits from the companies mentioned in the report or third party in connection with preparation of the research report. Accordingly, neither ICICI Securities nor Research Analysts and their relatives have any material conflict of interest at the time of publication of this report.
It is confirmed that Chirag Shah PGDBM; Sagar Gandhi MBA (Finance), Research Analysts of this report have not received any compensation from the companies mentioned in the report in the preceding twelve months.
Compensation of our Research Analysts is not based on any specific merchant banking, investment banking or brokerage service transactions.
ICICI Securities or its subsidiaries collectively or Research Analysts or their relatives do not own 1% or more of the equity securities of the Company mentioned in the report as of the last day of the month preceding the publication of the research report.
Since associates of ICICI Securities are engaged in various financial service businesses, they might have financial interests or beneficial ownership in various companies including the subject company/companies mentioned in this report.
It is confirmed that Chirag Shah PGDBM; Sagar Gandhi MBA (Finance), Research Analysts do not serve as an officer, director or employee of the companies mentioned in the report.
ICICI Securities may have issued other reports that are inconsistent with and reach different conclusion from the information presented in this report.
Neither the Research Analysts nor ICICI Securities have been engaged in market making activity for the companies mentioned in the report.
We submit that no material disciplinary action has been taken on ICICI Securities by any Regulatory Authority impacting Equity Research Analysis activities.
This report is not directed or intended for distribution to, or use by, any person or entity who is a citizen or resident of or located in any locality, state, country or other jurisdiction, where such distribution, publication, availability or use would be contrary to law, regulation or which would subject ICICI Securities and affiliates to any registration or licensing requirement within such jurisdiction. The securities described herein may or may not be eligible for sale in all jurisdictions or to certain category of investors. Persons in whose possession this document may come are required to inform themselves of and to observe such restriction.