NRB Bearing Ltd. BUY A niche player in domestic bearing ... · NRB Bearings Ltd. (NRB) is a pioneer...
13
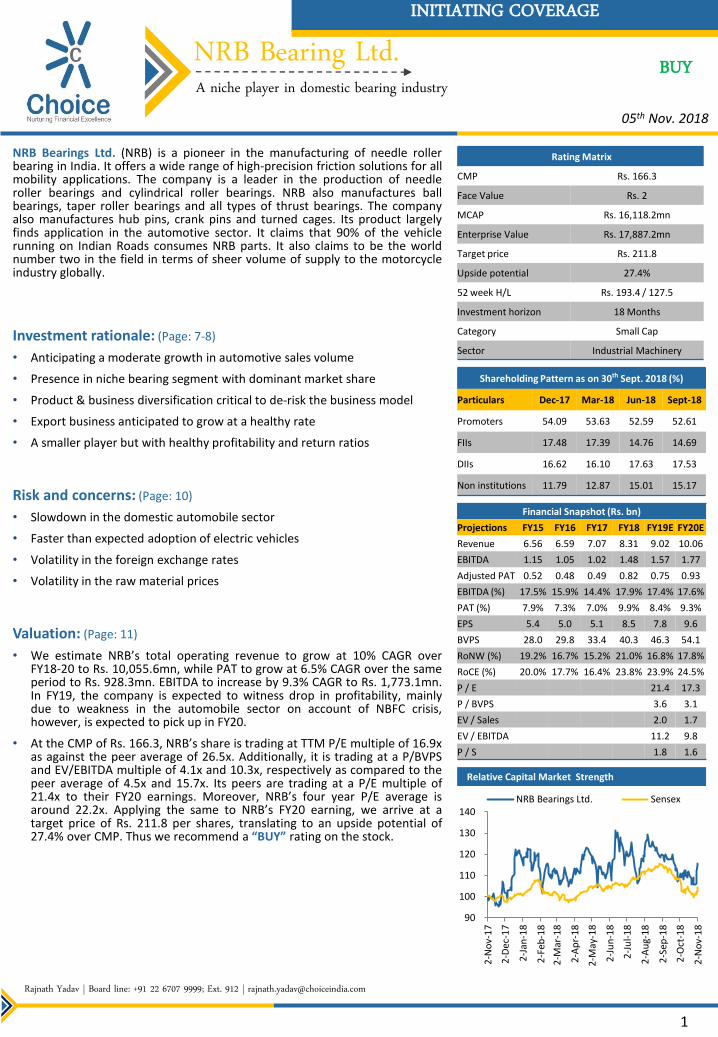
© CHOICE INSTITUTIONAL RESEARCH NRB Bearing Ltd. A niche player in domestic bearing industry INITIATING COVERAGE Relative Capital Market Strength NRB Bearings Ltd. (NRB) is a pioneer in the manufacturing of needle roller bearing in India. It offers a wide range of high-precision friction solutions for all mobility applications. The company is a leader in the production of needle roller bearings and cylindrical roller bearings. NRB also manufactures ball bearings, taper roller bearings and all types of thrust bearings. The company also manufactures hub pins, crank pins and turned cages. Its product largely finds application in the automotive sector. It claims that 90% of the vehicle running on Indian Roads consumes NRB parts. It also claims to be the world number two in the field in terms of sheer volume of supply to the motorcycle industry globally. Investment rationale: (Page: 7-8) • Anticipating a moderate growth in automotive sales volume • Presence in niche bearing segment with dominant market share • Product & business diversification critical to de-risk the business model • Export business anticipated to grow at a healthy rate • A smaller player but with healthy profitability and return ratios Risk and concerns: (Page: 10) • Slowdown in the domestic automobile sector • Faster than expected adoption of electric vehicles • Volatility in the foreign exchange rates • Volatility in the raw material prices Valuation: (Page: 11) • We estimate NRB’s total operating revenue to grow at 10% CAGR over FY18-20 to Rs. 10,055.6mn, while PAT to grow at 6.5% CAGR over the same period to Rs. 928.3mn. EBITDA to increase by 9.3% CAGR to Rs. 1,773.1mn. In FY19, the company is expected to witness drop in profitability, mainly due to weakness in the automobile sector on account of NBFC crisis, however, is expected to pick up in FY20. • At the CMP of Rs. 166.3, NRB’s share is trading at TTM P/E multiple of 16.9x as against the peer average of 26.5x. Additionally, it is trading at a P/BVPS and EV/EBITDA multiple of 4.1x and 10.3x, respectively as compared to the peer average of 4.5x and 15.7x. Its peers are trading at a P/E multiple of 21.4x to their FY20 earnings. Moreover, NRB’s four year P/E average is around 22.2x. Applying the same to NRB’s FY20 earning, we arrive at a target price of Rs. 211.8 per shares, translating to an upside potential of 27.4% over CMP. Thus we recommend a “BUY” rating on the stock. Rajnath Yadav | Board line: +91 22 6707 9999; Ext. 912 | [email protected] 1 05 th Nov. 2018 Rating Matrix CMP Rs. 166.3 Face Value Rs. 2 MCAP Rs. 16,118.2mn Enterprise Value Rs. 17,887.2mn Target price Rs. 211.8 Upside potential 27.4% 52 week H/L Rs. 193.4 / 127.5 Investment horizon 18 Months Category Small Cap Sector Industrial Machinery Shareholding Pattern as on 30 th Sept. 2018 (%) Particulars Dec-17 Mar-18 Jun-18 Sept-18 Promoters 54.09 53.63 52.59 52.61 FIIs 17.48 17.39 14.76 14.69 DIIs 16.62 16.10 17.63 17.53 Non institutions 11.79 12.87 15.01 15.17 Financial Snapshot (Rs. bn) Projections FY15 FY16 FY17 FY18 FY19E FY20E Revenue 6.56 6.59 7.07 8.31 9.02 10.06 EBITDA 1.15 1.05 1.02 1.48 1.57 1.77 Adjusted PAT 0.52 0.48 0.49 0.82 0.75 0.93 EBITDA (%) 17.5% 15.9% 14.4% 17.9% 17.4% 17.6% PAT (%) 7.9% 7.3% 7.0% 9.9% 8.4% 9.3% EPS 5.4 5.0 5.1 8.5 7.8 9.6 BVPS 28.0 29.8 33.4 40.3 46.3 54.1 RoNW (%) 19.2% 16.7% 15.2% 21.0% 16.8% 17.8% RoCE (%) 20.0% 17.7% 16.4% 23.8% 23.9% 24.5% P / E 21.4 17.3 P / BVPS 3.6 3.1 EV / Sales 2.0 1.7 EV / EBITDA 11.2 9.8 P / S 1.8 1.6 BUY 90 100 110 120 130 140 2-Nov-17 2-Dec-17 2-Jan-18 2-Feb-18 2-Mar-18 2-Apr-18 2-May-18 2-Jun-18 2-Jul-18 2-Aug-18 2-Sep-18 2-Oct-18 2-Nov-18 NRB Bearings Ltd. Sensex
Transcript of NRB Bearing Ltd. BUY A niche player in domestic bearing ... · NRB Bearings Ltd. (NRB) is a pioneer...
© CHOICE INSTITUTIONAL RESEARCH
NRB Bearing Ltd. A niche player in domestic bearing industry
INITIATING COVERAGE
Relative Capital Market Strength
NRB Bearings Ltd. (NRB) is a pioneer in the manufacturing of needle roller bearing in India. It offers a wide range of high-precision friction solutions for all mobility applications. The company is a leader in the production of needle roller bearings and cylindrical roller bearings. NRB also manufactures ball bearings, taper roller bearings and all types of thrust bearings. The company also manufactures hub pins, crank pins and turned cages. Its product largely finds application in the automotive sector. It claims that 90% of the vehicle running on Indian Roads consumes NRB parts. It also claims to be the world number two in the field in terms of sheer volume of supply to the motorcycle industry globally.
Investment rationale: (Page: 7-8)
• Anticipating a moderate growth in automotive sales volume
• Presence in niche bearing segment with dominant market share
• Product & business diversification critical to de-risk the business model
• Export business anticipated to grow at a healthy rate
• A smaller player but with healthy profitability and return ratios
Risk and concerns: (Page: 10)
• Slowdown in the domestic automobile sector
• Faster than expected adoption of electric vehicles
• Volatility in the foreign exchange rates
• Volatility in the raw material prices
Valuation: (Page: 11)
• We estimate NRB’s total operating revenue to grow at 10% CAGR over FY18-20 to Rs. 10,055.6mn, while PAT to grow at 6.5% CAGR over the same period to Rs. 928.3mn. EBITDA to increase by 9.3% CAGR to Rs. 1,773.1mn. In FY19, the company is expected to witness drop in profitability, mainly due to weakness in the automobile sector on account of NBFC crisis, however, is expected to pick up in FY20.
• At the CMP of Rs. 166.3, NRB’s share is trading at TTM P/E multiple of 16.9x as against the peer average of 26.5x. Additionally, it is trading at a P/BVPS and EV/EBITDA multiple of 4.1x and 10.3x, respectively as compared to the peer average of 4.5x and 15.7x. Its peers are trading at a P/E multiple of 21.4x to their FY20 earnings. Moreover, NRB’s four year P/E average is around 22.2x. Applying the same to NRB’s FY20 earning, we arrive at a target price of Rs. 211.8 per shares, translating to an upside potential of 27.4% over CMP. Thus we recommend a “BUY” rating on the stock.
Rajnath Yadav | Board line: +91 22 6707 9999; Ext. 912 | [email protected]
1
05th Nov. 2018
Rating Matrix
CMP Rs. 166.3
Face Value Rs. 2
MCAP Rs. 16,118.2mn
Enterprise Value Rs. 17,887.2mn
Target price Rs. 211.8
Upside potential 27.4%
52 week H/L Rs. 193.4 / 127.5
Investment horizon 18 Months
Category Small Cap
Sector Industrial Machinery
Shareholding Pattern as on 30th Sept. 2018 (%)
Particulars Dec-17 Mar-18 Jun-18 Sept-18
Promoters 54.09 53.63 52.59 52.61
FIIs 17.48 17.39 14.76 14.69
DIIs 16.62 16.10 17.63 17.53
Non institutions 11.79 12.87 15.01 15.17
Financial Snapshot (Rs. bn)
Projections FY15 FY16 FY17 FY18 FY19E FY20E
Revenue 6.56 6.59 7.07 8.31 9.02 10.06
EBITDA 1.15 1.05 1.02 1.48 1.57 1.77
Adjusted PAT 0.52 0.48 0.49 0.82 0.75 0.93
EBITDA (%) 17.5% 15.9% 14.4% 17.9% 17.4% 17.6%
PAT (%) 7.9% 7.3% 7.0% 9.9% 8.4% 9.3%
EPS 5.4 5.0 5.1 8.5 7.8 9.6
BVPS 28.0 29.8 33.4 40.3 46.3 54.1
RoNW (%) 19.2% 16.7% 15.2% 21.0% 16.8% 17.8%
RoCE (%) 20.0% 17.7% 16.4% 23.8% 23.9% 24.5%
P / E 21.4 17.3
P / BVPS 3.6 3.1
EV / Sales 2.0 1.7
EV / EBITDA 11.2 9.8
P / S 1.8 1.6
BUY
90
100
110
120
130
140
2-N
ov-
17
2-D
ec-1
7
2-J
an-1
8
2-F
eb-1
8
2-M
ar-1
8
2-A
pr-
18
2-M
ay-1
8
2-J
un
-18
2-J
ul-
18
2-A
ug-
18
2-S
ep-1
8
2-O
ct-1
8
2-N
ov-
18
NRB Bearings Ltd. Sensex

© CHOICE INSTITUTIONAL RESEARCH 2
Management team
Name Designation Mr. T S Sahney Chairman and Non-Executive, Non-Independent Director
Mrs. H S Zaveri Executive, Non-Independent Director
Mr. D S Sahney Non-Executive, Non-Independent Director
Mr. S C Rangani Executive, Non-Independent Director and Company Secretary
Mr. Tashwinder Singh Independent Director
Ms. Vishakha R. M. Independent Director
Mr. Ashank Desai Independent Director
Mr. Rustom Desai Independent Director
Mrs. Tanushree Bagrodia CFO & VP-IT
Shareholding pattern (as on 30th Sept. 2018)
Source: Choice Broking Research
Source: Choice Broking Research
Shareholders more than 1% (as on 30th Sept. 2018)
Share Holder Name Stake (%) Sahney Trilochan Singh 34.88% Nalanda India Equity Fund 9.99% Zaveri Harshbeena Sahney 8.79% Sundaram Asset Management Co. Ltd. 4.73% SBI Funds Management Pvt. Ltd. 4.37% ICICI Prudential Life Insurance Co. Ltd. 3.93% Sahney Devesh Singh 3.75% HDFC Asset Management Co. Ltd. 3.11% Sahney Hanwantbir Kaur 2.96% Mondrian Emerging Market Small Cap Equity Fund 2.52% Reliance Capital Trustee Co. Ltd. 2.41% Ontario Pension Mondrian Investment 1.18% Acacia Partners LP 1.11%
Source: Choice Broking Research
52.61%
14.69%
17.53%
15.17%
Promoters FII DII Non Institutions
© CHOICE INSTITUTIONAL RESEARCH 3
Bearing sector overview:
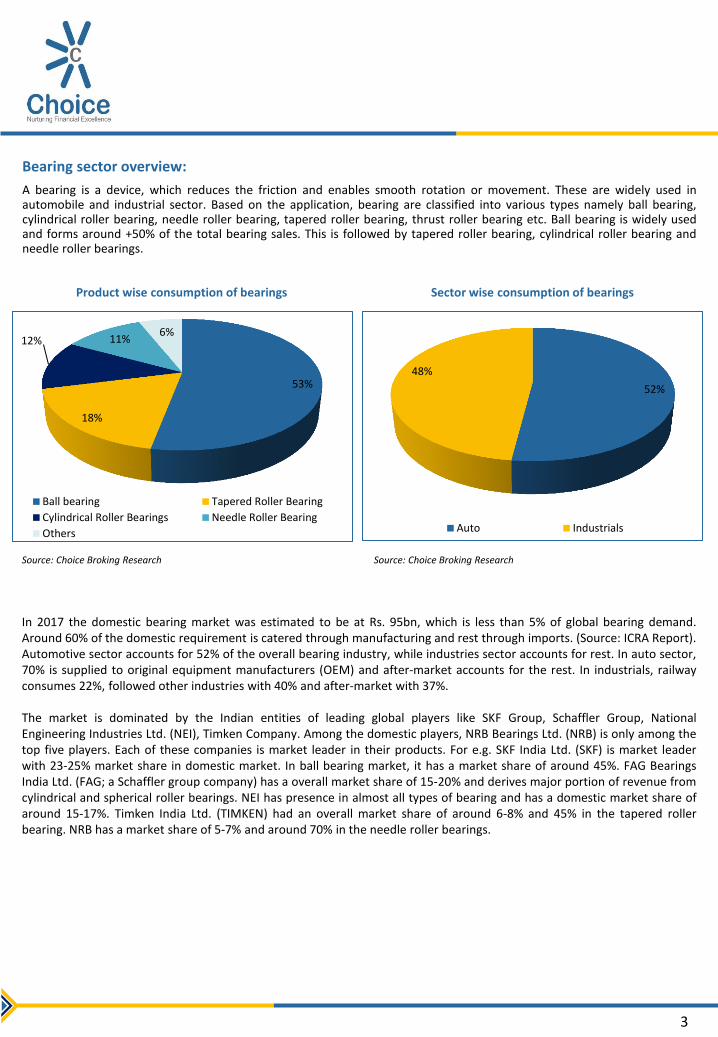
A bearing is a device, which reduces the friction and enables smooth rotation or movement. These are widely used in automobile and industrial sector. Based on the application, bearing are classified into various types namely ball bearing, cylindrical roller bearing, needle roller bearing, tapered roller bearing, thrust roller bearing etc. Ball bearing is widely used and forms around +50% of the total bearing sales. This is followed by tapered roller bearing, cylindrical roller bearing and needle roller bearings.
In 2017 the domestic bearing market was estimated to be at Rs. 95bn, which is less than 5% of global bearing demand. Around 60% of the domestic requirement is catered through manufacturing and rest through imports. (Source: ICRA Report). Automotive sector accounts for 52% of the overall bearing industry, while industries sector accounts for rest. In auto sector, 70% is supplied to original equipment manufacturers (OEM) and after-market accounts for the rest. In industrials, railway consumes 22%, followed other industries with 40% and after-market with 37%. The market is dominated by the Indian entities of leading global players like SKF Group, Schaffler Group, National Engineering Industries Ltd. (NEI), Timken Company. Among the domestic players, NRB Bearings Ltd. (NRB) is only among the top five players. Each of these companies is market leader in their products. For e.g. SKF India Ltd. (SKF) is market leader with 23-25% market share in domestic market. In ball bearing market, it has a market share of around 45%. FAG Bearings India Ltd. (FAG; a Schaffler group company) has a overall market share of 15-20% and derives major portion of revenue from cylindrical and spherical roller bearings. NEI has presence in almost all types of bearing and has a domestic market share of around 15-17%. Timken India Ltd. (TIMKEN) had an overall market share of around 6-8% and 45% in the tapered roller bearing. NRB has a market share of 5-7% and around 70% in the needle roller bearings.
Source: Choice Broking Research Source: Choice Broking Research
Product wise consumption of bearings Sector wise consumption of bearings
53%
18%
12% 11% 6%
Ball bearing Tapered Roller Bearing
Cylindrical Roller Bearings Needle Roller Bearing
Others
52%
48%
Auto Industrials

© CHOICE INSTITUTIONAL RESEARCH 4
Bearing sector overview (Contd…):
Key domestic players with overall market share
Source: Choice Broking Research
SKF FAG NEI TIMKEN NRB Others
23-25%
15-20%
15-17%
6-8%
5-7%
24-30%
Product wise market share
Bearing Type Player Market Share (%) Nearest Competitor
Ball Bearing SKF 45% FAG, NEI
Cylindrical and Spherical Bearing FAG 40% SKF, TIMKEN, NEI, NRB
Tapered Roller Bearing TIMKEN 45% SKF, NEI, FAG
Needle Roller Bearing NRB 70% INA Bearings
Source: Choice Broking Research

© CHOICE INSTITUTIONAL RESEARCH 5
Company description:
NRB is a pioneer in the manufacturing of needle roller bearing in India. Incorporated in 1965 as Needle Roller Bearing Company, in collaboration between French needle bearing manufacturer Nadella SA (known as Timken France SAS) and Sahney family. Later in Nov. 2005, the Sahney family brought 26% stake of Nadella SA. Currently, it has three subsidiaries, of which two are overseas subsidiaries.
In 2000, NRB acquired a controlling stake in SNL Bearings Ltd. (SNL; a company promoted by the Shriram group of Industries in technical collaboration with INA, Germany) engaged into the manufacturing of needle roller bearing. Through this acquisition, the company got access to INA’s technology. Currently, NRB has 73.5% stake in SNL. In FY18, SNL reported 24% increase in earnings to Rs. 82.2mn on 14% rise in net sales, which stood at Rs. 383.1mn.
NRB’s wholly owned subsidiary i.e. NRB Bearings (Thailand) Ltd. was initially involved into trading of goods and brand building exercise. However, over the period this subsidiary graduated into a manufacturing unit and started production of needle roller bearing and other types of bearing. In FY18, NRB finalized new business with Japanese customers to manufacture new products in future. This subsidiary reported earnings of Rs. 33mn (as compared to Rs. 8.7mn in FY17) in FY18. Net sales increased by 22% over FY17 and stood at Rs. 403.3mn. Manufacturing activities contributed 67% to net sales in FY18.
Another fully owned subsidiary NRB Bearing Europe Gmbh is engaged into providing support services to increase exports to Europe. Currently, it provides marketing and customer support services.
Currently it has eight manufacturing facility i.e. two manufacturing facilities in Aurangabad (Maharashtra), one each at Thane (Maharashtra), Jalna (Maharashtra), Hyderabad and Uttarakhand. Through its subsidiaries it has manufacturing plants in Ranchi (Jharkhand) and Thailand.
Source: Choice Broking Research
NRB Bearing Ltd.
SNL Bearings Ltd. NRB Bearings (Thailand)
Ltd. NRB Bearing Europe
Gmbh
73.5% 100% 100%
Corporate structure
Product profile: NRB offers a wide range of high-precision friction solutions for all mobility applications. The company is a leader in the production of needle rolled bearings and cylindrical roller bearings. NRB also manufactures ball bearings, taper roller bearings and all types of thrust bearings. The company also manufactures hub pins, crank pins and turned cages. Its product largely finds application in the automotive sector. It claims that 90% of the vehicle running on Indian Roads consumes NRB parts. It also claims to be the world number two in the field in terms of sheer volume of supply to the motorcycle industry globally.

© CHOICE INSTITUTIONAL RESEARCH 6
Company description (contd…):
Clientele: NRB is largely into B2B sales and derives around 80% of the revenue from this channel. It mainly caters to two wheeler (2W) & three wheeler (3W) OEMs customers. It also caters to passenger (PV) & commercial vehicle (CV) and tractors & other off highway automotive. Domestic clientele includes HeroMoto Corp Ltd., Bajaj Auto Ltd., Tata Motors Ltd., Mahindra & Mahindra Ltd. etc. Overseas clientele includes, Volvo, ZF Friedrichshafen AG, Getrag, Audi for engines, Daimler for trucks and Mercedes Cars, Honda & Mazda for cars and every single Japanese two wheeler manufacturer.
Geographical revenue-mix Sales channel-mix
Source: Choice Broking Research Source: Choice Broking Research
Vehicle based revenue-mix Product wise revenue-mix
79.3%
20.7%
Domestic Business Export Business
67.3%
20.5%
12.2%
OEM Export Aftermarket
28%
25%
18%
10%
19%
2W CV PV Farm & Other Off Highway Others
40.4%
37.0%
17.3%
5.3%
Needle Roller Bushes & Cages Ball & Roller Bearings
Automobile Components Others

© CHOICE INSTITUTIONAL RESEARCH 7
Investment rationale:
1) Anticipating a moderate growth in automotive sales volume: In FY18, automotive sales volume increased by 14.5% to 29mn units. 2W sales volume increased by 14.8% in FY18. For FY19, the industry association SIAM is anticipating a growth of 8-10%. The key triggers would be the improving rural economy and further revival in the economics activities, which together would boost the demand of PVs, CV and off-highway automobiles. However, the growth across the sub-segments was hit by a slowdown in sector, resulting into a moderate growth of around 7-8% in H1 FY19. Anticipating the sales trend, SIAM has lowered its sales forecast for FY19. With ongoing liquidity crisis and increased cost of purchase arising from the change in the third party insurance structure, we are expecting a conservative sales growth of 6-7%. Notwithstanding, the expected 2W sales volume growth of 8-10% would be higher than overall industry growth rate.
NRB derives majority of its revenue from automotive sector. Over FY13-18, automobile production has increased by 7.1% CAGR, while NRB’s business grew by 7.5% during the same period. Thus the automotive sector growth can be considered as a proxy growth rate for the company. Going forward, the domestic automotive growth is anticipated at 8%, while NRB’s business in forecasted to grow at 10% CAGR over FY18-20.
2) Presence in niche bearing segment with dominant market share: In overall domestic bearing market, NRB has a market share of around 5-7%. It derives around 40% of the business from the needle roller bearing, in which it has a 70% market share. Needle roller bearing is a niche product and finds application in areas where space is a constraints and a large load bearing capability is needed. This product is the preferred choice in applications like steering columns or assembly, gear box, front axle, power trains and drive etc. In another product i.e. cylindrical roller bearing, NRB has a market share of +30% and finds application in pumps, compressors, wheel sets of railways, centrifuges, mining equipment etc. These products being customized products are largely supplied to the OEMs. It also has a global market share of 10% in the manual & dual clutch transmission market.
Source: Choice Broking Research
Product wise application and market share
Product Application Domestic / Global Market Share
Needle Roller Bearing Steering columns or assembly, gear box, front axle, power trains and drive etc.
70%
Cylindrical Roller Bearings Pumps, compressors, wheel sets of railways, centrifuges, mining equipment etc.
30%
Crank Pins Largely into automotive sector Among the top player in the 2W and 3W industry
With respect to vehicle type, NRB virtually supplies bearings for the entire range of tractors in India and some multinationals. Apart from Mahindra and TAFE, it fully meets the requirement of needle and cylindrical bearings of emerging tractor companies like Sonalika and John Deeree. In PVs, NRB is the most critical suppliers of custom designed bearings, especially the transmission bearings. It is considered among the largest supplier of crank pins globally to the 2W and 3W industry. 3) Product & business diversification critical to de-risk the business model: NRB generates majority of the revenue from
automobile industry. So as to de-risk its business model, the company is planning to increase its focus on other emerging high margin industries like railways, aerospace, defence, construction etc. Currently, these industries together contribute around 20% of the top-line. It also plans to gear itself to meet the challenges arising from the shift towards hybrid and electric vehicle in future. With its dedicated R&D, the company has developed a prototype light weight bearing for electric vehicles (EV) for which patent has already being received. Such initiatives are expected to further diversify its revenue stream and lower the reliance from automotive sector.

© CHOICE INSTITUTIONAL RESEARCH 8
Investment rationale (Contd…):
4) Export business anticipated to grow at a healthy rate: NRB exports its customized friction solutions to around 26 countries across five continents, including Germany, Sweden, France, Italy, The Czech Republic, Russia, China, Brazil, Mexico and the USA. Overseas clientele includes, Volvo, ZF Friedrichshafen AG, Getrag, Audi for engines, Daimler for trucks and Mercedes Cars, Honda & Mazda for cars and every single Japanese 2W manufacturer. In the export market, NRB competes with the respective domestic players in the home ground. Through its advanced technology and R&D, the company in 2017 was awarded business for the future product launches of Mercedes, Audi, ZF, Volvo, Electrolux, Mazda, Honda, John Deere, Bosch, and Getrag, amongst others. In future, the company intends to strengthen its position in Japan and tap new market like Russia and Korea. Historically over FY11-18, the export business has grown by 22.7% CAGR to Rs. 1.7bn in FY18. It constituted around 20% of the total revenue in FY18. Going forward, we are estimating a 21.4% CAGR rise in the export business to Rs. 2.5bn.
5) A smaller player but with healthy profitability and return ratios: Top five players in the industry represents around 65-75% of the domestic market. NRB is the fifth largest player with a market share of 5-7%. It has large presence in the automotive sector as compared to other players in the peer set, which have presence in both - automotive and industrial sectors. NRB is purely into the sales of manufacturing goods, while other peers have both manufacturing and trading sales. This is the reason, why NRB has better operating margins and RoE as compared to the average of the peer set. Since the company is fully involved into manufacturing, it has lower asset turnover and elongated working capital cycle of 73 days as compared to peer set average of 60 days. Overall, through its innovation & product profile, it can be presumed that NRB would able to maintain its position in the niche domestic bearing market in the near to mid-term.
Five Years Top-line Growth Rate (%) NRB Bearings Ltd. 8.7% SKF India Ltd. 4.9% Schaeffler India Ltd. 8.2% Timken India Ltd. 14.4% Menon Bearings Ltd. 13.8% Bimetal Bearings Ltd. 5.4%
Five Years Average Gross Margin (%) NRB Bearings Ltd. 58.2% SKF India Ltd. 38.5% Schaeffler India Ltd. 39.9% Timken India Ltd. 40.0% Menon Bearings Ltd. 63.8% Bimetal Bearings Ltd. 50.7%
Five Years EBITDA Growth Rate (%) NRB Bearings Ltd. 9.7% SKF India Ltd. 13.6% Schaeffler India Ltd. 18.9% Timken India Ltd. 23.0% Menon Bearings Ltd. 25.0% Bimetal Bearings Ltd. 29.0%
Five Years Average EBITDA Margin (%) NRB Bearings Ltd. 16.6% SKF India Ltd. 12.8% Schaeffler India Ltd. 16.3% Timken India Ltd. 13.6% Menon Bearings Ltd. 23.7% Bimetal Bearings Ltd. 5.0%
Five Years PAT Growth Rate (%) NRB Bearings Ltd. 21.0% SKF India Ltd. 15.4% Schaeffler India Ltd. 18.2% Timken India Ltd. 19.7% Menon Bearings Ltd. 36.4% Bimetal Bearings Ltd. 27.4%
Five Years Average PAT Margin (%) NRB Bearings Ltd. 7.7% SKF India Ltd. 8.9% Schaeffler India Ltd. 10.6% Timken India Ltd. 8.1% Menon Bearings Ltd. 12.4% Bimetal Bearings Ltd. 3.7%
Five Years Average Fixed Asset Turnover NRB Bearings Ltd. 3.0 SKF India Ltd. 4.7 Schaeffler India Ltd. 2.9 Timken India Ltd. 4.0 Menon Bearings Ltd. 1.5 Bimetal Bearings Ltd. 2.5
Five Years Average Total Asset Turnover NRB Bearings Ltd. 1.0 SKF India Ltd. 1.4 Schaeffler India Ltd. 1.2 Timken India Ltd. 1.2 Menon Bearings Ltd. 1.4 Bimetal Bearings Ltd. 0.7
Five Years Average RoE (%) NRB Bearings Ltd. 17.6% SKF India Ltd. 15.1% Schaeffler India Ltd. 14.7% Timken India Ltd. 16.4% Menon Bearings Ltd. 15.1% Bimetal Bearings Ltd. 3.9%
Five Years Average RoCE (%) NRB Bearings Ltd. 19.1% SKF India Ltd. 22.8% Schaeffler India Ltd. 22.4% Timken India Ltd. 24.4% Menon Bearings Ltd. 22.8% Bimetal Bearings Ltd. 5.5%
© CHOICE INSTITUTIONAL RESEARCH 9
Recent quarter and annual performance analysis:
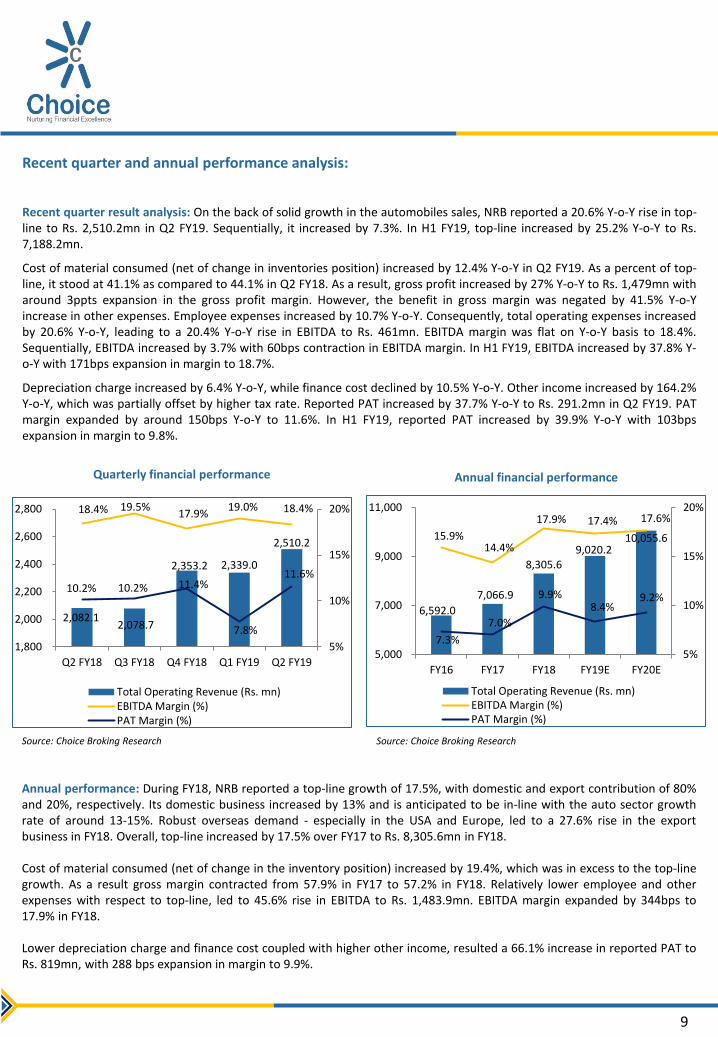
Recent quarter result analysis: On the back of solid growth in the automobiles sales, NRB reported a 20.6% Y-o-Y rise in top-line to Rs. 2,510.2mn in Q2 FY19. Sequentially, it increased by 7.3%. In H1 FY19, top-line increased by 25.2% Y-o-Y to Rs. 7,188.2mn.
Cost of material consumed (net of change in inventories position) increased by 12.4% Y-o-Y in Q2 FY19. As a percent of top-line, it stood at 41.1% as compared to 44.1% in Q2 FY18. As a result, gross profit increased by 27% Y-o-Y to Rs. 1,479mn with around 3ppts expansion in the gross profit margin. However, the benefit in gross margin was negated by 41.5% Y-o-Y increase in other expenses. Employee expenses increased by 10.7% Y-o-Y. Consequently, total operating expenses increased by 20.6% Y-o-Y, leading to a 20.4% Y-o-Y rise in EBITDA to Rs. 461mn. EBITDA margin was flat on Y-o-Y basis to 18.4%. Sequentially, EBITDA increased by 3.7% with 60bps contraction in EBITDA margin. In H1 FY19, EBITDA increased by 37.8% Y-o-Y with 171bps expansion in margin to 18.7%.
Depreciation charge increased by 6.4% Y-o-Y, while finance cost declined by 10.5% Y-o-Y. Other income increased by 164.2% Y-o-Y, which was partially offset by higher tax rate. Reported PAT increased by 37.7% Y-o-Y to Rs. 291.2mn in Q2 FY19. PAT margin expanded by around 150bps Y-o-Y to 11.6%. In H1 FY19, reported PAT increased by 39.9% Y-o-Y with 103bps expansion in margin to 9.8%.
Source: Choice Broking Research Source: Choice Broking Research
Quarterly financial performance Annual financial performance
Annual performance: During FY18, NRB reported a top-line growth of 17.5%, with domestic and export contribution of 80% and 20%, respectively. Its domestic business increased by 13% and is anticipated to be in-line with the auto sector growth rate of around 13-15%. Robust overseas demand - especially in the USA and Europe, led to a 27.6% rise in the export business in FY18. Overall, top-line increased by 17.5% over FY17 to Rs. 8,305.6mn in FY18. Cost of material consumed (net of change in the inventory position) increased by 19.4%, which was in excess to the top-line growth. As a result gross margin contracted from 57.9% in FY17 to 57.2% in FY18. Relatively lower employee and other expenses with respect to top-line, led to 45.6% rise in EBITDA to Rs. 1,483.9mn. EBITDA margin expanded by 344bps to 17.9% in FY18. Lower depreciation charge and finance cost coupled with higher other income, resulted a 66.1% increase in reported PAT to Rs. 819mn, with 288 bps expansion in margin to 9.9%.
2,082.1 2,078.7
2,353.2 2,339.0
2,510.2
18.4% 19.5% 17.9%
19.0% 18.4%
10.2% 10.2% 11.4%
7.8%
11.6%
5%
10%
15%
20%
1,800
2,000
2,200
2,400
2,600
2,800
Q2 FY18 Q3 FY18 Q4 FY18 Q1 FY19 Q2 FY19
Total Operating Revenue (Rs. mn)EBITDA Margin (%)PAT Margin (%)
6,592.0
7,066.9
8,305.6 9,020.2
10,055.6 15.9% 14.4%
17.9% 17.4% 17.6%
7.3%
7.0%
9.9% 8.4%
9.2%
5%
10%
15%
20%
5,000
7,000
9,000
11,000
FY16 FY17 FY18 FY19E FY20E
Total Operating Revenue (Rs. mn)EBITDA Margin (%)PAT Margin (%)

© CHOICE INSTITUTIONAL RESEARCH 10
Expectations for FY19 and FY20:
Automobile sector witnessed a moderate growth in H1 FY19, however, the industry witnessed some weakness in Q3 FY19, mainly on account of the issue related to the NBFC liquidity. This can be witnessed from the lower sales figure from the automobiles companies during the festive season, which normally generates one fifth of the annual sales. We believe that, it will have an impact on the performance of the automobile sector, as most of the vehicle sales are financed by the NBFCs. Nevertheless, this liquidity crunch is not expected to stay for long and is anticipated to normalize in next 2-3 months.
For FY19, we are forecasting a top-line growth of 8.6% Y-o-Y to Rs. 9,020.2mn. Domestic and export business are likely to report a growth of 7.9% and 17.9% Y-o-Y, respectively. With rising raw material prices and depreciating currency, we are anticipating a 50bps Y-o-Y contraction in the EBITDA margin to 17.4% in FY19. EBITDA is projected to increase by 5.6% Y-o-Y to Rs. 1,567.2mn. Depreciation charge is likely to increase by 14.1% Y-o-Y, while finance cost to decline by 4.6% Y-o-Y. During FY19, we are estimating a debt repayment of Rs. 423.5mn. Adjusted PAT (net of extraordinary items) to decline by 7.9% Y-o-Y to Rs. 754.1mn in FY19. PAT margin to contract by 150bps Y-o-Y to 8.4% in FY19.
For FY20, we are anticipating a top-line growth of 11.5% to Rs. 10,055.6mn. EBITDA is projected to rise by 13.1% to Rs. 1,773.1mn, with 20bps expansion in the margin to 17.6%. Adjusted PAT is likely to increase by 23.1% to Rs. 928.3mn in FY20. PAT margin to expand by 87bps to 9.2% in FY20.
Risk & concern:
• Slowdown in the domestic automobile sector: NRB derives major portion of the revenue from automobile sector. Any slowdown in the sector either caused by the ongoing NBFC crisis or high cost of ownership caused due to change in the third party insurance; or broader slowdown in the urban/rural economy would severely impact the performance of the company. However, over the period of operations the company has significantly diversified its exposure within the automobiles sector. In FY18, it derived 28%, 25%, 18% and 10% of the revenue from 2Ws, CVs, PVs and farm & other off highway vehicles, respectively.
• Faster than expected adoption of EVs: Increased adoption of the EV or hybrid vehicles would pose a challenge to overcome the disruption caused to the auto & auto ancillary industry. For the bearing industry, it is anticipated there will less requirement of bearings in EVs as compared to the requirement in the conventional automobile. It is estimated that there would be lesser moving parts i.e. around 18 parts as compared to 2000 moving parts in conventional automobiles. Nevertheless, we believe the adoption of EVs would be faster in developed economies as compared to developing countries like India, thereby putting lesser pressure in near term in domestic market. NRB has developed a prototype light weight bearing for electric vehicles for which patent has already being received. Such initiatives would keep the company ahead of its competition.
• Volatility in the foreign exchange rates: In FY18, NRB derived around 20% of the revenue from overseas market, while 28-30% of the raw material consumed is imported. Thus volatility in the foreign exchange rates would impact the profitability of the company.
• Volatility in the raw material prices: Raw material formed around 40% of the revenue and 50% of the cost of production. Historically, the company has maintained this level in the last 5-7 years, mainly due its strategy not to aggressively follow volume growth. This coupled with higher proportion of manufacturing of customized bearings has helped the company in passing on the volatility in the raw material prices, thereby maintaining its gross margin. Thus inability in passing on the volatility of raw material prices in future would impact the profitability of the company.

© CHOICE INSTITUTIONAL RESEARCH 11
Peer comparison:
Company Name Face
Value (Rs.)
CMP (Rs.)
MCAP (Rs. mn)
EV (Rs. mn)
Stock Return (%) TTM Total Operating Revenue (Rs. mn)
TTM EBITDA (Rs. mn)
TTM PAT (Rs. mn)
TTM EBITDA
Margin (%)
TTM PAT
Margin (%) 1 M 3 M 6 M 1 Y
NRB Bearings Ltd. 2.0 166.3 16,118.2 17,887.2 5.8% -4.9% -3.5% 15.4% 9,281.1 1,732.2 954.0 18.7% 10.3% SKF India Ltd. 10.0 1,786.1 91,692.2 83,580.6 5.6% 4.9% -3.4% 8.7% 29,251.2 4,678.6 3,228.7 16.0% 11.0% Schaeffler India Ltd. 10.0 5,063.7 84,144.9 75,838.5 -3.2% -3.7% -5.0% -1.3% 27,336.8 4,784.0 2,858.9 17.5% 10.5% Timken India Ltd. 10.0 531.5 39,975.0 39,314.9 -8.6% -29.1% -23.6% -31.4% 13,175.1 1,798.3 1,017.5 13.6% 7.7% Menon Bearings Ltd. 1.0 80.0 4,483.2 4,550.6 -0.3% -14.1% -30.0% -10.5% 1,680.6 413.5 251.3 24.6% 15.0% Bimetal Bearings Ltd. 10.0 545.5 2,086.3 2,023.7 3.7% -2.3% -4.6% -0.9% 2,041.6 170.4 120.4 8.3% 5.9% Average 16.0% 10.0%
Company Name EPS (Rs.)
BVPS (Rs.)
DPS (Rs.)
Debt Equity Ratio
Fixed Asset Turnover
Ratio
RoE (%)
RoCE (%)
P / E (x)
P / B (x)
EV / Sales (x)
EV / EBITDA (x)
MCAP / Sales (x)
Earning Yield (%)
NRB Bearings Ltd. 9.8 40.3 2.6 0.5 3.9 24.4% 28.5% 16.9 4.1 1.9 10.3 1.7 5.9% SKF India Ltd. 62.9 357.9 12.0 0.0 9.4 17.6% 21.6% 28.4 5.0 2.9 17.9 3.1 3.5% Schaeffler India Ltd. 172.0 1,020.2 17.0 0.0 6.6 16.9% 22.3% 29.4 5.0 2.8 15.9 3.1 3.4% Timken India Ltd. 13.5 93.4 1.0 0.0 4.3 14.5% 18.3% 39.3 5.7 3.0 21.9 3.0 2.5% Menon Bearings Ltd. 4.5 13.8 1.5 0.3 3.2 32.6% 36.5% 17.8 5.8 2.7 11.0 2.7 5.6% Bimetal Bearings Ltd. 31.5 456.2 9.0 0.0 4.8 6.9% 5.4% 17.3 1.2 1.0 11.9 1.0 5.8% Average 0.1 5.7 17.7% 20.8% 26.5 4.5 2.5 15.7 2.6 4.2%
Source: Choice Broking Research; Ace Equity
The above peers are selected based on the product profile and industry to which they are serving. Just like NRB, the above peers are market leader in their major end products. For example, SKF is the market leader in ball bearings; Schaeffler (FAG) is market leader in cylindrical & spherical roller bearings, while Timken is a dominant player in tapered roller bearings. Profitability margin and return ratios of the peer set depended on their presence in trading business and manufacturing activities. Based on above criteria, below are the pros and cons of NRB over its peer set. • NRB derives major portion of revenue from automobile sector, while its peers have a diversified sources like automobiles,
industries, railways etc.
• NRB has higher EBITDA margin, mainly on account of higher proportion of manufactured goods, thereby having control on the cost of production.
• Absence of trading revenue - a reason for lower asset turnover of NRB.
• Leverage in the book - a reason behind higher RoE.
• Lower RoCE mainly due to lower asset turnover and elongated working capital cycle.
Valuation: We estimate NRB’s total operating revenue to grow at 10% CAGR over FY18-20 to Rs. 10,055.6mn, while PAT to
grow at 6.5% CAGR over the same period to Rs. 928.3mn. EBITDA to increase by 9.3% CAGR to Rs. 1,773.1mn. In FY19, the company is expected to witness drop in profitability, mainly due to weakness in the automobile sector on account of NBFC crisis, however, is expected to pick up in FY20. At the CMP of Rs. 166.3, NRB’s share is trading at TTM P/E multiple of 16.9x as against the peer average of 26.5x. Additionally, it is trading at a P/BVPS and EV/EBITDA multiple of 4.1x and 10.3x, respectively as compared to the peer average of 4.5x and 15.7x. Its peers are trading at a P/E multiple of 21.4x to their FY20 earnings. Moreover, NRB’s four year P/E average is around 22.2x. Applying the same to NRB’s FY20 earning, we arrive at a target price of Rs. 211.8 per shares, translating to an upside potential of 27.4% over CMP. Thus we recommend a “BUY” rating on the stock.
© CHOICE INSTITUTIONAL RESEARCH 12
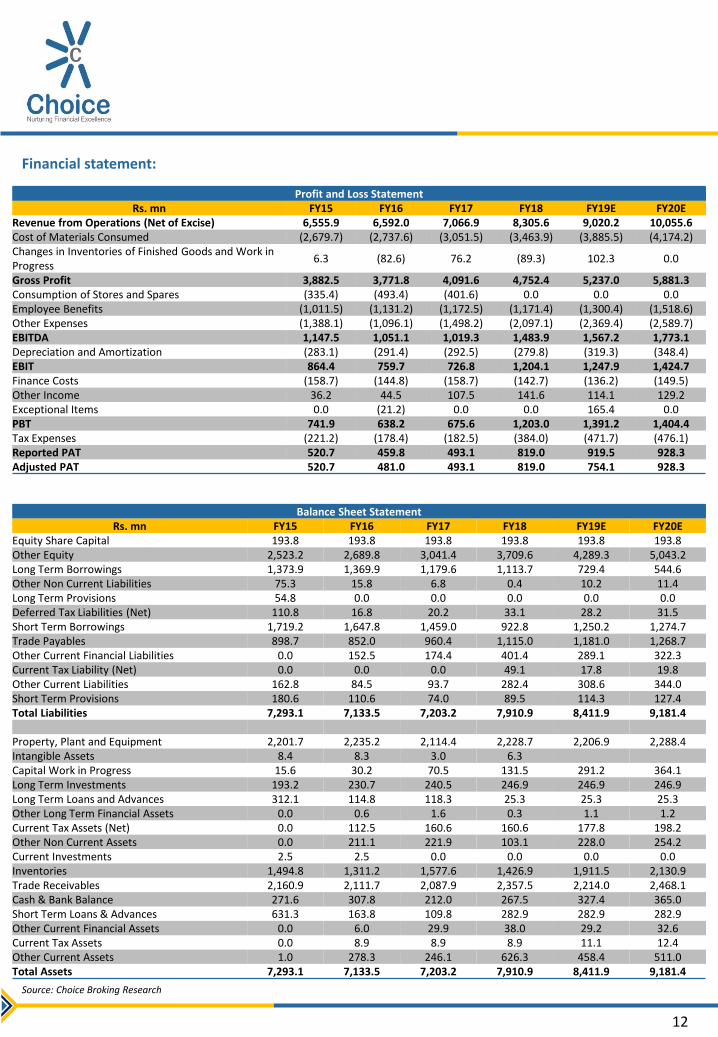
Financial statement:
Source: Choice Broking Research
Profit and Loss Statement Rs. mn FY15 FY16 FY17 FY18 FY19E FY20E
Revenue from Operations (Net of Excise) 6,555.9 6,592.0 7,066.9 8,305.6 9,020.2 10,055.6 Cost of Materials Consumed (2,679.7) (2,737.6) (3,051.5) (3,463.9) (3,885.5) (4,174.2) Changes in Inventories of Finished Goods and Work in Progress
6.3 (82.6) 76.2 (89.3) 102.3 0.0
Gross Profit 3,882.5 3,771.8 4,091.6 4,752.4 5,237.0 5,881.3 Consumption of Stores and Spares (335.4) (493.4) (401.6) 0.0 0.0 0.0 Employee Benefits (1,011.5) (1,131.2) (1,172.5) (1,171.4) (1,300.4) (1,518.6) Other Expenses (1,388.1) (1,096.1) (1,498.2) (2,097.1) (2,369.4) (2,589.7) EBITDA 1,147.5 1,051.1 1,019.3 1,483.9 1,567.2 1,773.1 Depreciation and Amortization (283.1) (291.4) (292.5) (279.8) (319.3) (348.4) EBIT 864.4 759.7 726.8 1,204.1 1,247.9 1,424.7 Finance Costs (158.7) (144.8) (158.7) (142.7) (136.2) (149.5) Other Income 36.2 44.5 107.5 141.6 114.1 129.2 Exceptional Items 0.0 (21.2) 0.0 0.0 165.4 0.0 PBT 741.9 638.2 675.6 1,203.0 1,391.2 1,404.4 Tax Expenses (221.2) (178.4) (182.5) (384.0) (471.7) (476.1) Reported PAT 520.7 459.8 493.1 819.0 919.5 928.3 Adjusted PAT 520.7 481.0 493.1 819.0 754.1 928.3
Balance Sheet Statement Rs. mn FY15 FY16 FY17 FY18 FY19E FY20E
Equity Share Capital 193.8 193.8 193.8 193.8 193.8 193.8 Other Equity 2,523.2 2,689.8 3,041.4 3,709.6 4,289.3 5,043.2 Long Term Borrowings 1,373.9 1,369.9 1,179.6 1,113.7 729.4 544.6 Other Non Current Liabilities 75.3 15.8 6.8 0.4 10.2 11.4 Long Term Provisions 54.8 0.0 0.0 0.0 0.0 0.0 Deferred Tax Liabilities (Net) 110.8 16.8 20.2 33.1 28.2 31.5 Short Term Borrowings 1,719.2 1,647.8 1,459.0 922.8 1,250.2 1,274.7 Trade Payables 898.7 852.0 960.4 1,115.0 1,181.0 1,268.7 Other Current Financial Liabilities 0.0 152.5 174.4 401.4 289.1 322.3 Current Tax Liability (Net) 0.0 0.0 0.0 49.1 17.8 19.8 Other Current Liabilities 162.8 84.5 93.7 282.4 308.6 344.0 Short Term Provisions 180.6 110.6 74.0 89.5 114.3 127.4 Total Liabilities 7,293.1 7,133.5 7,203.2 7,910.9 8,411.9 9,181.4
Property, Plant and Equipment 2,201.7 2,235.2 2,114.4 2,228.7 2,206.9 2,288.4 Intangible Assets 8.4 8.3 3.0 6.3 Capital Work in Progress 15.6 30.2 70.5 131.5 291.2 364.1 Long Term Investments 193.2 230.7 240.5 246.9 246.9 246.9 Long Term Loans and Advances 312.1 114.8 118.3 25.3 25.3 25.3 Other Long Term Financial Assets 0.0 0.6 1.6 0.3 1.1 1.2 Current Tax Assets (Net) 0.0 112.5 160.6 160.6 177.8 198.2 Other Non Current Assets 0.0 211.1 221.9 103.1 228.0 254.2 Current Investments 2.5 2.5 0.0 0.0 0.0 0.0 Inventories 1,494.8 1,311.2 1,577.6 1,426.9 1,911.5 2,130.9 Trade Receivables 2,160.9 2,111.7 2,087.9 2,357.5 2,214.0 2,468.1 Cash & Bank Balance 271.6 307.8 212.0 267.5 327.4 365.0 Short Term Loans & Advances 631.3 163.8 109.8 282.9 282.9 282.9 Other Current Financial Assets 0.0 6.0 29.9 38.0 29.2 32.6 Current Tax Assets 0.0 8.9 8.9 8.9 11.1 12.4 Other Current Assets 1.0 278.3 246.1 626.3 458.4 511.0 Total Assets 7,293.1 7,133.5 7,203.2 7,910.9 8,411.9 9,181.4

© CHOICE INSTITUTIONAL RESEARCH 13
Financial statement (Contd…)
Source: Choice Broking Research
Financial Ratios FY15 FY16 FY17 FY18 FY19E FY20E
Profitability & Return Ratios EBITDA Margin (%) 17.5% 15.9% 14.4% 17.9% 17.4% 17.6% Adjusted PAT Margin (%) 7.9% 7.3% 7.0% 9.9% 8.4% 9.2% RoNW (%) 19.2% 16.7% 15.2% 21.0% 16.8% 17.7% RoCE (%) 20.0% 17.7% 16.4% 23.8% 23.8% 24.5%
Working Capital & Liquidity Ratios Current Ratio (x) 1.5 1.5 1.5 1.8 1.7 1.7 Quick Ratio (x) 1.0 1.0 1.0 1.3 1.1 1.1 Net Debt to EBITDA (x) 2.5 2.6 2.4 1.2 1.1 0.8
Turnover & Leverage Ratios Fixed Asset Turnover (x) 2.9 2.9 3.2 3.5 3.6 3.8 Total Asset Turnover (x) 0.9 0.9 1.0 1.0 1.1 1.1 Debt Equity Ratio (X) 1.1 1.0 0.8 0.5 0.4 0.3 Dividend Pay Out Ratio 20.5% 61.1% 27.4% 0.0% 15.8% 15.7%
Valuation Ratios EPS (Rs.) 5.4 5.0 5.1 8.5 7.8 9.6 DPS (Rs.) 1.1 2.9 1.4 0.0 1.5 1.5 BVPS (Rs. Cr) 28.0 29.8 33.4 40.3 46.3 54.0 P / E (X) 21.4 17.4 P / BVPS (x) 3.6 3.1 EV / Sales (x) 2.0 1.7 EV / EBITDA (x) 11.3 9.9 P / S (x) 1.8 1.6
Cash Flow Statement Particulars (Rs. mn) FY15 FY16 FY17 FY18 FY19E FY20E Profit before Tax 741.9 638.2 675.6 1,203.0 1,391.2 1,404.4 Depreciation and Amortization 283.1 291.4 292.5 279.8 319.3 348.4 Finance Costs 158.7 144.8 158.7 142.7 136.2 149.5 Interest Income (14.2) (25.9) (15.9) (24.8) (21.4) (26.2) Dividend Income (7.0) (23.6) (23.2) (1.4) (2.5) (2.5) Others 39.7 11.0 39.7 9.5 (255.6) (100.6) Operating Cash Flow before Working Capital Changes
1,202.2 1,035.8 1,127.5 1,608.8 1,567.2 1,773.1
Change in Working Capital (371.8) 112.6 (173.2) (9.5) (331.2) (401.6) Direct Taxes Paid (Net of Refunds) (262.4) (183.4) (232.3) (324.9) (471.7) (476.1) Cash Flow from Operating Activities 568.0 965.1 722.0 1,274.4 764.3 895.4
Purchase of Fixed Assets (187.0) (177.3) (244.7) (346.8) (451.0) (502.8) Change in Investments 0.0 0.0 0.0 0.0 0.0 0.0 Change in Loans & Advances 0.0 0.0 0.0 0.0 0.0 0.0 Dividend Income 7.0 23.6 23.2 1.4 2.5 2.5 Interest Income 14.2 25.9 15.9 24.8 21.4 26.2 Others (6.7) (94.9) 66.0 (68.8) 90.2 100.6 Cash Flow from Investing Activities (172.4) (222.7) (139.7) (389.4) (336.9) (373.6)
Borrowings (Net) 108.0 (238.4) (354.4) (664.3) (56.8) (160.3) Finance Costs (158.7) (144.8) (158.7) (142.7) (136.2) (149.5) Dividend Paid (106.6) (281.1) (135.1) (0.4) (145.4) (145.4) Others (19.6) (45.5) (30.6) (162.9) (29.1) (29.1) Cash Flow from Financing Activities (177.0) (709.8) (678.9) (970.3) (367.5) (484.3)
Net Cash Flow 218.6 32.5 (96.6) (85.2) 59.9 37.6 Opening Balance of Cash & Cash Balance 49.6 268.2 300.1 203.5 267.5 327.4 Closing Balance of Cash & Cash Balance 268.2 300.7 203.5 118.2 327.4 365.0