Non-destructive 3D Quantification of Fiber Reinforced ... · PDF fileApplication Note...
4
Application Note Non-destructive 3D Quantification of Fiber Reinforced Polymer Composite Materials ZEISS Xradia Versa X-ray Microscopes
Transcript of Non-destructive 3D Quantification of Fiber Reinforced ... · PDF fileApplication Note...
Application Note
Non-destructive 3D Quantification ofFiber Reinforced Polymer Composite MaterialsZEISS Xradia Versa X-ray Microscopes

2
Application Note
Non-destructive 3D Quantification ofFiber Reinforced Polymer Composite MaterialsZEISS Xradia Versa X-ray Microscopes
Author: Carl Zeiss X-ray MicroscopyPleasanton, California
Date: February 2015
Fiber-reinforced composite materials of a polymer matrix reinforced with fiberglass, carbon, or synthetic fibers are
increasingly used in the construction of materials for the aerospace, automotive, marine, and construction industries
due to their high performance, strength and light weight. The internal structure of fiber-reinforced composite material
greatly affects the strength and function of constructed materials, and it is critical for engi neers to be able to visualize
and measure key features. ZEISS X-ray microscopes (XRM) can provide quantitative, high resolution, three-dimensional
microstructural analysis of relatively large samples in situ to understand reliability and failure mechanisms. In addition,
the non-destructive nature of X-rays provides the opportunity to image a sample before and after the application of
tension or shear to observe resulting changes in the microstructure of these materials.
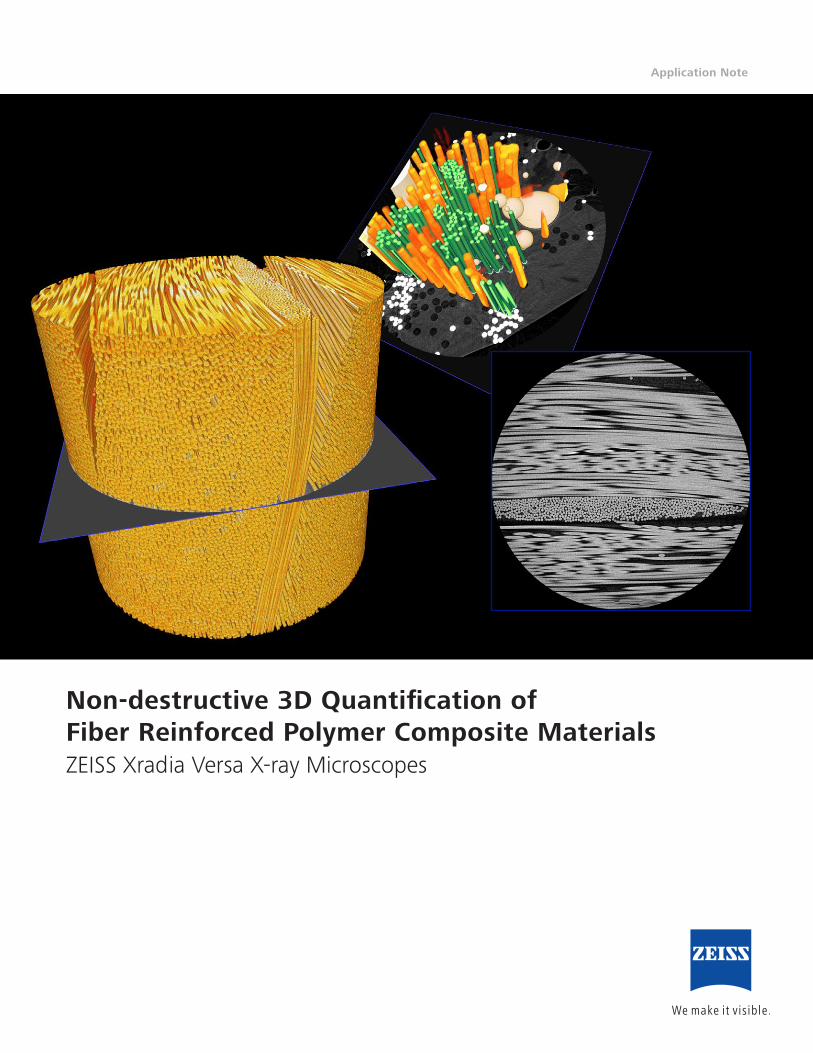
In this use case, we present the application of Xradia Versa for
detailed non-destructive imaging of fiber composite samples.
Xradia Versa instruments provide submicron spatial resolution,
high contrast and the unique ability to maintain high resolution
at large working distances for detailed imaging of large intact
samples. Figure 1 and 2 show the analysis of the resulting
3D datasets.
Methodology and Results
This study analyzed two fiber composite materials: one sample
composed of carbon fibers in epoxy resin and the other, a
commercial product known as Twintex®, a composite of
polypropylene and E-glass fibers in a polymer matrix. The carbon
fiber sample shown in Figures 3 and 4 was a 10 cm x 15 cm x
2 mm sample imaged at 1.46 μm voxel. The novel use of
scintillators optimized by objective make the detectors of
Figure 1: Carbon fiber composite, courtesy of ICMCB Figure 2: Quantification of fiber mean radius
5 6 7 8 9
Num
ber
of O
ccur
ance
s
70
60
50
40
30
20
10
0
Mean Radius (µm)
Fiber Mean Radius Frequency
200 µm

3
Application Note
Xradia Versa 3D X-ray microscopes uniquely suited to imaging
these low Z materials with good contrast. For this scan, the
system operated at 60 kV and used high absorption contrast
imaging to visualize voids in the epoxy and clearly differentiate
carbon fibers from the surrounding matrix for segmentation
analysis.
The Twintex® sample, a four-layer thermoplastic composite
measuring 85mm x 17mm x 2 mm, was imaged at 1 µm
voxel at 40 kV. The material is a continuous fiber composite
composed of a polymer matrix and E-glass with polypropylene
fiber reinforcements (Figures 5 and 6). Imaging and subsequent
analysis provided information including void content, fiber
orientation, and the interface between composite layers.
Conclusion
This case study demonstrates that Xradia Versa can be
effectively used for 3D structural analysis of fiber reinforced
composite materials, which is often limited by traditional
microscopic techniques. Due to their non-destructive nature
and unique architectural design, Xradia Versa can acquire
high contrast and high resolution images of polymer fiber
composites, preserving the sample so that it may then
be studied with additional methods such as dynamic
mechanical analysis and mechanicalshear tests.
Figure 3: Virtual orthogonal slice of the composite, showing carbon fiber and epoxy.
Figure 5: Virtual cross-section of Twintex composite, showing polypropylene (dark) fibers and E-glass (bright) fibers. Voids in the composite can clearly be seen as dark spherical shapes. Courtesy of Professor Milani, University of British Columbia
Figure 4: 3D rendering image of the composite, showing carbon fiber. Courtesy of ICMCB
Figure 6: Segmented 3D image of the composite, showing green fibers (E-glass), orange fibers (polypropylene), and white spheres (voids). The analysis indicated that E-glass fibers are clustered together and randomly distributed, which may influence the strength of the material, and that there are many unconsolidated polypropylene fibers left in the sample. Courtesy of Professor Milani, University of British Columbia
250 µm
250 µm
250 µm

EN_4
2_01
1_06
8 C
Z 02
-201
5 | D
esig
n, s
cope
of
deliv
ery
and
tech
nica
l pro
gres
s su
bjec
t to
cha
nge
with
out
notic
e. |
© C
arl Z
eiss
Mic
rosc
opy
Gm
bH
Carl Zeiss Microscopy GmbH 07745 Jena, Germany [email protected] www.zeiss.com/microscopy