
NOAA Technical Memorandum NWS WR-171 Technical Memorandum NWS WR-171 ... to describe techni ca 1...
29
. "' NOAA Technical Memorandum NWS WR-171 VERIFICATION OF 72-HOUR 500-MB MAP-TYPE PREDICTIONS Salt Lake City, Utah November 1981 u.s. DEPARTMENT OF I COMMERCE National Oceanic and Atmospheric Administration I National Weather Service
Transcript of NOAA Technical Memorandum NWS WR-171 Technical Memorandum NWS WR-171 ... to describe techni ca 1...
. "'
NOAA Technical Memorandum NWS WR-171
VERIFICATION OF 72-HOUR 500-MB MAP-TYPE PREDICTIONS
Salt Lake City, Utah November 1981
u.s. DEPARTMENT OF I COMMERCE
National Oceanic and
Atmospheric Administration I National Weather
Service

NOM'TECIIN!CAI. MEMORANDA. , , ; ;.- NlltiOI~il], Wc,1t.~nr.(~et•Vf~(:I·~··:.·~.~S.~HY:fl.'Rc~·r~n. ,·~:ub·st!rjes ,
The Nationiil Weather Ser~fce (NWS) Westem Region. (I~R) Subs:e,ries provides an inforillal med.ium .for the documentatiori and quick ~isse)nination of t•esults, not a'ppropri ate.,or not yet ready. for •'fohna 1 publication. fhe series j s, used to 'report air work. in' progress. to describe techni ca 1 procedure's and praCfices. or· to. relate progress'to· a·limited audience.: These Technical Memoranda.wili ,report.on. ·investigations -devoted'·primaril,Y.to regional' and local probiems of interest mainly to personnel, and hence'will not be widely distributed: · ·
~~jl~rs i· to ~5 a~~ in::.theJormer s~ri.es ;' ESSA ,'fechnicai Memoranda •' We~ter~ R~gipQ ,w:hni~~i ,Memoranda ,(WR\M); pape~s 24 0 ~0 sg,: are Jry t,h~ form~)' sedes' ESSA :rechni·cal, Memora~da~ Weather Bureau Technical, Memoranda (WBTM), Beg1 nn1 ng 'With :so,, :the: papers are: pa~t.of the :ser1 es,. NOAA .Technical ·Memo·rada NWS. OU~•oi'-print memoranda are' ~o~ listed. . . . . · · . , Y:· ·· · .· ·· · ' ' , , , · .• ', · . '
l>'a~ers 2 tei 22, excep{ 'tbr f (revised editio~); are a~ailatilefrom th~ National Weather Ser~ice Western Region: ~cientif'ic s~r~ices Di~{siorl ~ P. 0. Box 1118B, Federal Building,l25South state Street,·salt Lake Gity,:utah 84147. Paper~5 (re'vised edition.), :and.all .ot.hersbeginning with 25.are available .from the National. Tec~ni.cal Information Service, · U. S. Department of Commerce, Sills Building, 5285 Port Ri;>ya1 Road, Springfield, Virginia 22151. Prices :vary for all paper copy;·. $3·.-,50· m.icrofiche. Order by ascession number·, shown _in parentheses at end of.each entry;." · ·
· ' · ESSA Tec~nica] Memoranda. (WRTM)·
2 ·. Cl.imatological Prec.ipitation Probabilities. Compiled. by Lucianna Mil]er,, December 19fi5., . . , . , '• :j , Westerr·:gegion Pre- and Post-FP73 Program; Decem~er 1,-!965, to February 20, 1966. Edward D. Diemer, March 1~6~·.
5 ·Station 'Descriptions· of .Local Effects on Synoptic Weather Patterns. PhiliP Williams, Jr.,' April !966 (revised Noyember 1967 ;october i969). (PB-17800)
8 Interpreting the RAREP •. Herbert P. ~enner, May 1966 (revised January 1967). · . , · · U -Some Electrical Processe.s .in the·Atmosphere. 'J. Latham, June lg.66. . .
17 ·A. Digi,ta]·iz~d' Summary of. Rad~r}choes ·w.ithin !DO .·Mi·les ,of Sacrameit.~o. california. ·J .. ::,A. Youngbe\g, an~ L .. 8• Qveraas, December .1966,: 21 An ObJective Aid for Foreca~ting the End 'of East' WiQ,ds1 .. in the.Columbia .. Go~ge, July t~rougn Octobe~. D.,John Coparanis>,;.A~df !967.·, ,22 O~riv~j;ji>nofRadar'~qrizons:iriMou'ntain6usTerrain.: RogerG .. Pappas,April1967-.' · ,,·,,, .... i .. , '•::.::···
E'SsA ··Techni ~·a,·. ··M~~a·rarlda'' we·~th'ei.''·Bureau ·.te~h~J ca 1" Meindran·da (WBTM.) I •• '::···.:
25' Verification of Operational ,Probability of. Preci~itation Forecast~, Apri1!9~6-Mar~n :1967. W~ W,, Dickey, Octobe'r !967., '(P8-1l624'bl · '26 A Study"of•Winds in' the Lake.-Mead Recreation 'Area. R. :p. ~ugulis, Januarr.J96B. (PB"l77830) · ::.;: .· ·'
28; Weatner Extremes.\. R .. J. Schmid]i, Apri1!968 (revisedJebruary 19B1)., .. · .·:. . · ·' '29, ''srnallc~tale'Analysis and Prediction. Phi.lip Williams, 'Jr.:, May !968.: (P£i;17!i425) ·' : . . :.
/
30 Numeri.cal Weiatner ;prediction and' Synoptic: Meteorology., Capt .. 1hpmas D, Myrphy, u.s.A,.F., MaY.J96B. (1\D-67,3~,6,5)> · : · ·. · Ji Preci pi tatj on Detection Probabil i.ti es by salt Lake ARTC Ro~ars. Robert K• Bel esky; 'JulY )96~ • . · · (PBcl7~084)' ':':'. :: ·'. · :· : ':: ': · ' · :. " ' 32. ProbabHitY Forecasting-~A Problem Analysis with Reference to the Portlim·d Fi"e Weath'er District; .·Harpld S·. Ayer; _jl)l'y\968. (PB~17Q289'('. 35' Joint· .ESSA/FAA :ARTC Radar Weather Survei ll a nee Program .. H~rbert P. Benner and DeVon B. Smith> Dec~mber 1968 ·(revised .Jun~ 1970 )': AD 0 68'1857)
. 36 Temperatu,re Trends in Sacramento-"Another: Heat Island. Anthony D .. Lentini , .• February 1969.. (PB"l83055') ·" ·: · :37 · bi sppsal of ~ogging: Residues 'without Dama~e to Air Qua:l ity·; .. Owen .p, Ctarner;' Marcb ,1969. ( PBd8305'l)
· 39. Upper"Ai~ Lows over Northwestern United' States.' A, ·L, Jacobson, Apdl.l969,. (P.Bc!B42g6) ·, . : ,40 ·The Man-M.achiile Mi.x in Applied Weather Forecasting ·in the 1970's. L. W. Snellman, August 1969. (PB-185068) 42: Analysjs ,of the Sd,uthern Calif9rnia Santa:: Ana of January 15~17 • 1966.. Barry. B. Aronovitch, 1\ugust 1969. (PB-185670) 43· Forecasting Maximu)ll Temperatures at H~len·a·, Montana .. David E. Olser, Dctqb~r )969 • . (PB-185(62) .. : 44 Estimated Return. Periods for Short-Duration -Precipitation ,in Arizona. Paul: c·. Kangieser, Octo,ber 1969. 46 Appl i c~t.ions of th'e Net Radi omete.r to Shor.t~Range Fog and .stratus Forecas~i ng at Eugene, ·Oregon .. · L. Vee 47 •Statistical Analy,sis as a Flood Routin·g Tool' Robert J ... c .. Burnash, December 1969. ·· (PB"188744) 4B Tsunami. Ricl)ard P. Augul is; February 1970. (PB-!90157) . ·
(PBciB71G3) and E. Bat~s, qece~n~er 1969 ..
·49 Predicting Precipitation Type.' Robert J. C. Burnash arid Floyd L Hug, March 1970. (PB~J90962) 50 ),Statistical. Repor.t.
1 on Aeroalle.rgens (Pollens ,and Molds) Fort ·Huacl)uca, :Ariz,ona·; .1969.· Wayne.·S: Johnson, April 1970. ' (PB-191743)
: ·::,-:.'. 5s
2i. YWe~tern Region Sea,: State .and .Surf, Forecaster's Manual, ' Gci.rdon c. :shi eT.~.s :and Gerald B·.· Burdwe11, July 1g7o. (PB-'193102) \
, 5.4
.Sacrame~tp Weath~,r,',Radar Pimatology.' · R·.;.G .. Pappas .and C .. M.' Veliquette·, July'l970:,.· (PB~l93347) , . ,. , .. •., . , .;···. A Refineniert. of th,e:,Vorticity ~ield to De)ineat~ Areas of Si'gnifjcimt Precipit~tion'. :.Barry B.<;Ar''orioilitch, Aug~st)910: :. ,, , .·· ', .· > .
(P8-190476)
· 55· .. Appl t~a~i,on .. of the, SSARR .. Mqdel to. a·. Basin·! wit~out, Df:s,cba~ge Record. · VaiJ ·.Schermerhorn" and, Dona,l. W·,: ·.KuehJ; August>l97D·.'C·CPBcl94394 );t , 56 Ar,eia~ ~~verage of Pre;cipi~~tj or' in N~rthwest~~Q Utah: :, Phi:l_ip ~ill~ a,Ts! ~~:\. ah<;l4er~e~ ~· :·fi~i;k~;;~~p~e!Jifie~',' i9~D';i :;(pB~lg43B9:j >•J\.!;'':~t: ·.. , . ·· .. ·. .·
.·.57. P{e.l1m1,n~,ry Report,, on Agr1 cultural F1 el d' Burm ng .vs. Atm9.SPh~r1.c: VlSl bllJ tY·','i n, th~ ,W1J1 amette ·Vall~y.,of Oregon, ·:E~rl'·M:· ~ates ·and 'Dav:i d; 0. 'chi·id~te; , ·september 1970. ·(PB-194710) · . ' ', ' · . '. ·· · · •'·. . .,. ' ,, Li;.'· ·
58 Air Pollution by.Jet Afri:raft at Seattle-nicoma Airport. Wa.llace R. Donaldson, bi:tober 1970 .. · (COM-71~oooi7f·: ·: .· , . · 59 ·,Application of PE Model Forecast Parameters to Local--Area Forecasting. Leonard W. Snellmari, October: 1970. (COM-71-0_9016)
NOAA 'fei:hnjcal Memoranda (NWS WR)
(COM"i1-00120) February 1971. (COM" 71-00349)
60 An, Aid lor Forecasti.ng the. Minimum Temperature at Medford, Oregon. Arthur w.' .Fritz, October 1970. 63 '700-nib Wa'rm Air Advection a·s a Forecasting Tool for Montana and 'Northern Idaho. Norris E. Woerner; 64 Wind and Weather Regimes at Great Falls, Montana.- Warren 8. Price, March 1971. 66. A Preliminary Report on Correlation of ARTCC .Radar Echoe.s and Precipitation. Wilbur .K. Hall,' June 1971..· (COM"71-00829). 69 :National Weather Se"vice Support .to Soaring Ac1;i.vities:· Ellis Burton, August 1971. .. (tOM"7.h0095p) . 7.1 . Wester~ Region Synqptic Analysis-Problems :and Methods; Philip Williams, Jr.', February ,1972 ... (COM~72-!043:i) ·, · · , : 74 Thunderstorms and flail Days Probobi1ities in Nevada. Clarence M. Sakamoto, Aprill!l72'. (COM-72-10554) -:.:' , is: .:A Study of the. Low· Level Jet Stream of: the San Joaquin Valley. Rona·ld A. Willis and Philip Wi.lli'ams; Jr., May 197.2. (COM~72.-1070(): , 76' ·MonthlY tlimatolog.ical Charts of the Behavior o(Fog .and Low Strat.us at LosMtQeles r'nternati 0na(A'i,rport. Dpna,ld'M. Gales;',July,l972~' 77 ·A Study of Radar Echo Distribution in A.rizona During July and August. John Eo Hales, Jr.·, July 1972. (COM-72~!1136) ·· · ·
(COM-72~11140) ,
78 Forecasting Precipitapon at Bakersfield, California, Using Pressure Gradient Vectors. Ea..rl T. Riddiough, July 1972. (COM~(2~1114s') ·jg .Climate of Stockton,, California. Robert ·C. Nelson, July 1972. · (C0Mc.72-10920.)' .. · · ' 80 Estimation of Number Of Days Above or Below .Selected Temperatures.· ·Clarence . .M. Sakamoto, October. 1972. (COM 7 72'"10021) Bl An· Aid for For'ecastfng Summer Maximum Temperatures at Sea.ttle, Washington •. Edgar G~ Johnson, November ·1972.. (COM-73-10150) 82 Flash Flood Forecasting and Warning Program in the Western Region .. Philip Williams, Jr., Chester L. Glenn, and .Roland L. Raetz; December 1972,
(revised March· 1978) .. (COM"73-10251) · . . · . .. . · · 83.· A Comparison .of Manual and Semiautomatic Methods of Digitizing Analog Wind Records. Glenn E. -Rasch, March 1973. (COM-73-'10669)
86 Conditional Probabilities for Sequences of Wet Days at Phoenix, Arizona.. Paul c. Kangieser, June 1973. (COM-73-11264) 87 A Refinement .of the Use of K-Values in Forecasting Thunderstorms in Washington and Oregon. Robert Y. G. Lee, ·Jurie 1973. ·(COM-73-11276) 89 Objective Forecast Precipitation over the Western Region of the United States •. Julia N. Paegle and Larry P. Kierulff, Sept. !973. (COM-73-11946/3AS) 91 A,rizona "Eddy" Tornadoes. ~obert S. Ingram, October 1973. (COM-73-10465) g2 Smoke Management in the Willamette Valley. Earl M. Bates, May 1974. (COM-74-11277/AS) 93 An Operational Evaluation of 500-mb Type Regression Equations. Alexander E. MacDonald, June 1974. (COM-74-11407/AS) 94 Conditional Probability of Visibility Less than One-Half Mile .in Rac!ia.tion Fog at Fresno, California. John D. Thomas, August '1974. (COM-74-11555/AS) 96 Map Type Precipitation Probabilities for the Western Region. Glenn E. Rasch and Alexander E. MacDonald, Febt·uary 1975. (COM-75-10428/AS) 97 Eastern Pacific Cut-Off Low of April 21-28, 1974. Will.iam J. Alder and George R. Miller, January 1976. (P8-250-711/AS) 98 Study on a Significant Precipitation Episode in Western United States. Ira S. Brenner, April 1976. (COM-75-10719/AS) 99 A Study of Flash Flood Susceptibility--A Basin in Southern Arizona. Gerald Williams, August 1975. (COM-75-11360/AS) 102 A Set of Rules for Forecasting Temperatures in Napa and Sonoma Counties. Wesley L. Tuft, October 1975. (PB-246-902/AS) 103 Application of the National Weather Service Flash-Flood Program in the Western Region. Gerald 'lilliams, January 1976. (PB-253-053/AS) 104 Objective Aids for 'Forecasting·Minimum Temperatures at Reno, Nevada, During .the Summer Months.· Christopher D. Hi'll, January 1976.- (PB-.252-866/AS) 105 Forecasting the Mono Wind. Charles P. Ruscha, Jr., February 1976. (PB-254-650) · ·
· 106 Use of MOS Forecast Parameters in Temperature Forecasting. John C. Plankinton, Jr., March 1976. (PB-254-649) 107 Map Types as Aids in Using MOS PoPs in Western United States. Ira S. Brenner, August 1976. (PB-259-594) 108 Other Kinds of Wind Shear. Christopher D. Hill, August 1976. (PB-260-437/AS) 109 Forecasting North Winds in the Upper Sacramento Va 11 ey and Adjoining Forests. Christopher E. Fontana, September 1976. ( PB-273-677 /AS) JlO Cool Inflow as a Weakening Influence on Eastern Pacific Tropi ca 1 Cyclones. Willi am J. Denney, November 1976. ( PB-264-655/AS) 112 The MAN/MOS Program. A 1 exan.der E.. MacDona 1 d, February 1977. ( PB-265-941/AS) · 113 Winter Season·Minim.um·Temperatu're·Formula for--Bakersfield, California, Using.Multiple Regression.· Michael J. ·oard, FebruarY' !977. (·PB-2'73-694/AS) 114 Tropical Cyclone Kathleen. James R. Fors, February 1977. (PB-273-676/AS) Jl6 A Study of Wind Gusts on Lake Mead. Bradley Colman, April 1977. (PB-268-847) 117 The Relative Frequency. ofCumulonimbus Clouds a.t the Nevada. Test Site as a Function of k-Value. R .. F. Quiring, April 1977. (PB-272-831) 118 Moist~re. Distribution Modification by Upward Vertical Motion. Ira S. Brenner, April 1977. (PB-268~740) 119 Relative Frequency of Occurrence of Warm Season Echo Activity a.s a. Function of Stability Indices Computed from the Yucca Flat, Nevada, Rawinsonde.
Darryl Randerson, June !977. (PB-271-290/AS)
·',

NOAA Technical Memorandum NWS WR-171.
VERIFICATION OF 72-HOUR 500-MB MAP-TYPE PREDICTIONS
R. F. Quiring
National Weather Service Nuclear Support Office Las Vegas, Nevada November 1981
UNITED STATES I National Oceanic and I Nat1onal Weather DEPARTMENT OF COMMERCE Atmospheric Administration Service Malcolm Baldrige, Secretary John V. Byrne. Admmistrator Richard E. Hallgren. 01tector
I consider this a useful study to assist Western Region forecasters in the use of the map type correlation bulletins issued twice daily by NMC (AFOS call sign: 5TCNMC). My subjective opinion is that since NMC replaced the 7-layer PE model with the spectral model in August 1980 the quality of 72-hour 500-mb prognoses have improved. Thus, we can expect even better verification of the types than indicated here.
This Technical Memorandum has been reviewed and is approved for publication by Scientific Services Division, Western Region.
ii
L. W. Snellman, Chief Scientific Services Division Western Region Headquarters Salt Lake City, Utah
CONTENTS Page
I. Introduction . 1
II. The Data Base 1
I I I. Verification 2
IV. Discussion . 3
v. Conclusions 6
VI. References 8
VI I. Addendum . 9
i i;

FIGURES AND TABLES
Page
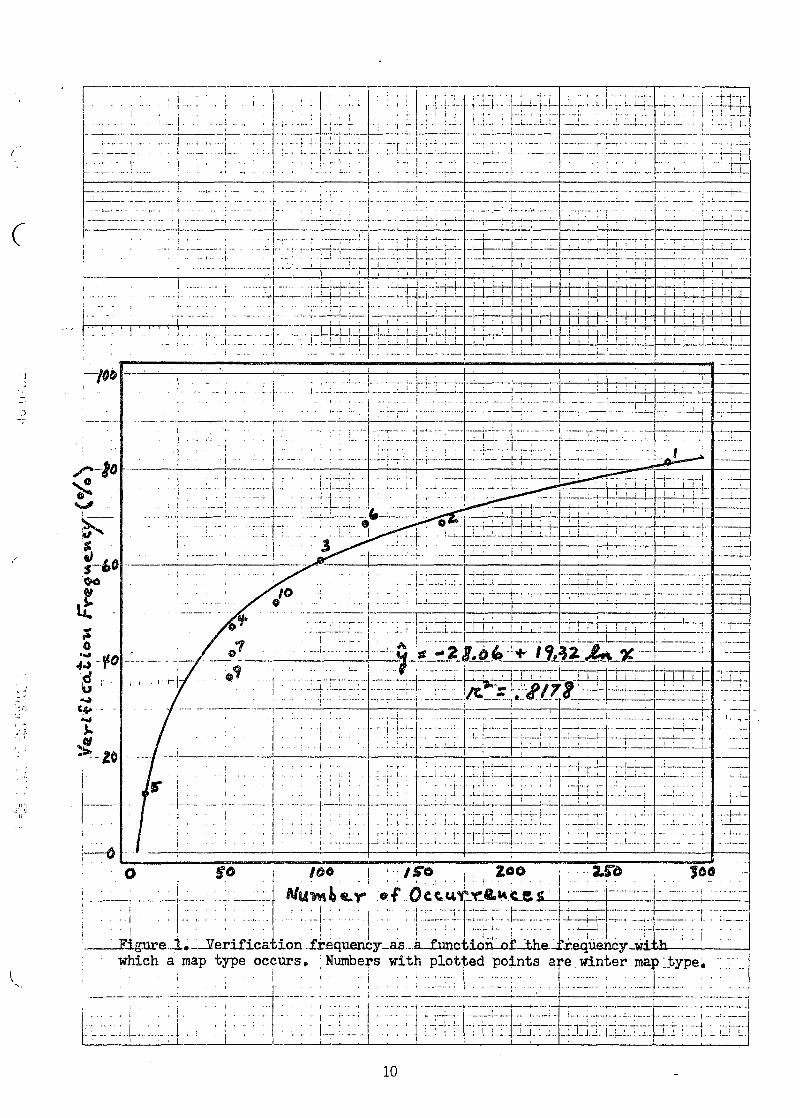
Figure 1. Verification frequency as a function of .... 10 the frequency with which a map type occurs.
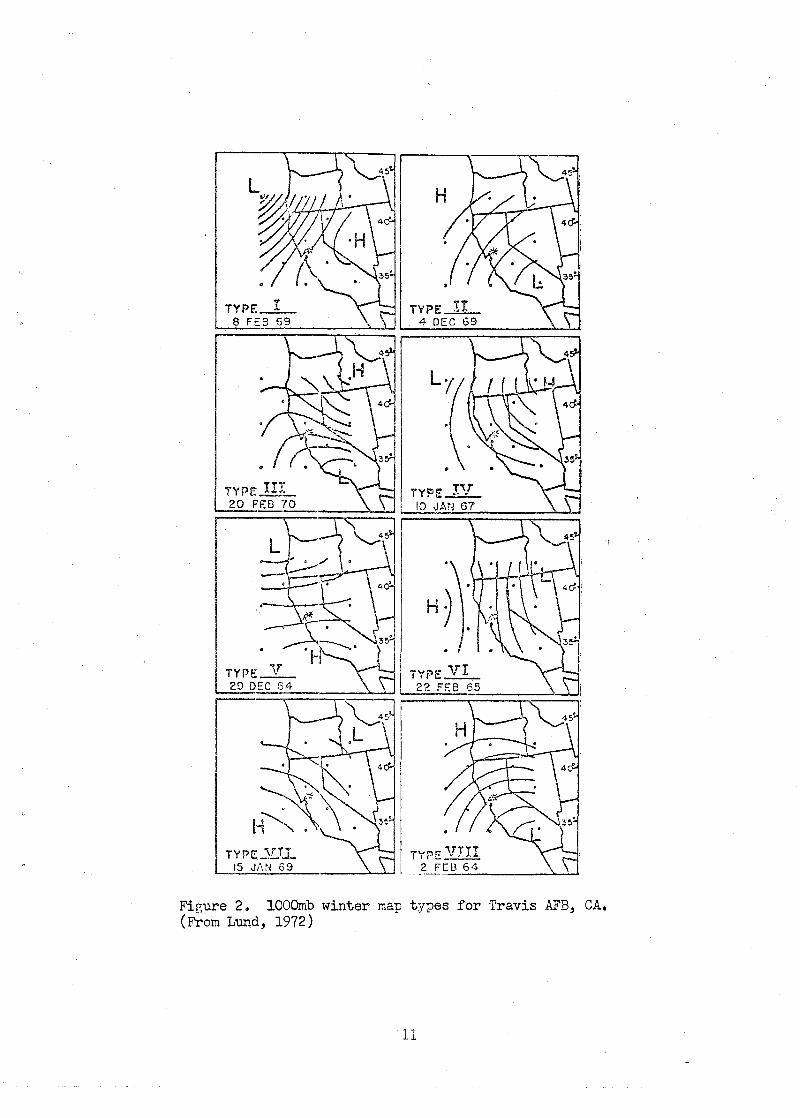
Figure 2. 1000-mb winter map types for Travis AFB, 11 CA.
Figure 3. Grids 1 (A) , 2 (1j , and 3 (0) 12 Figure 4. Paegle and Kierulff winter map types . 13 Figure 5. Precipitation frequency for Paegle 13
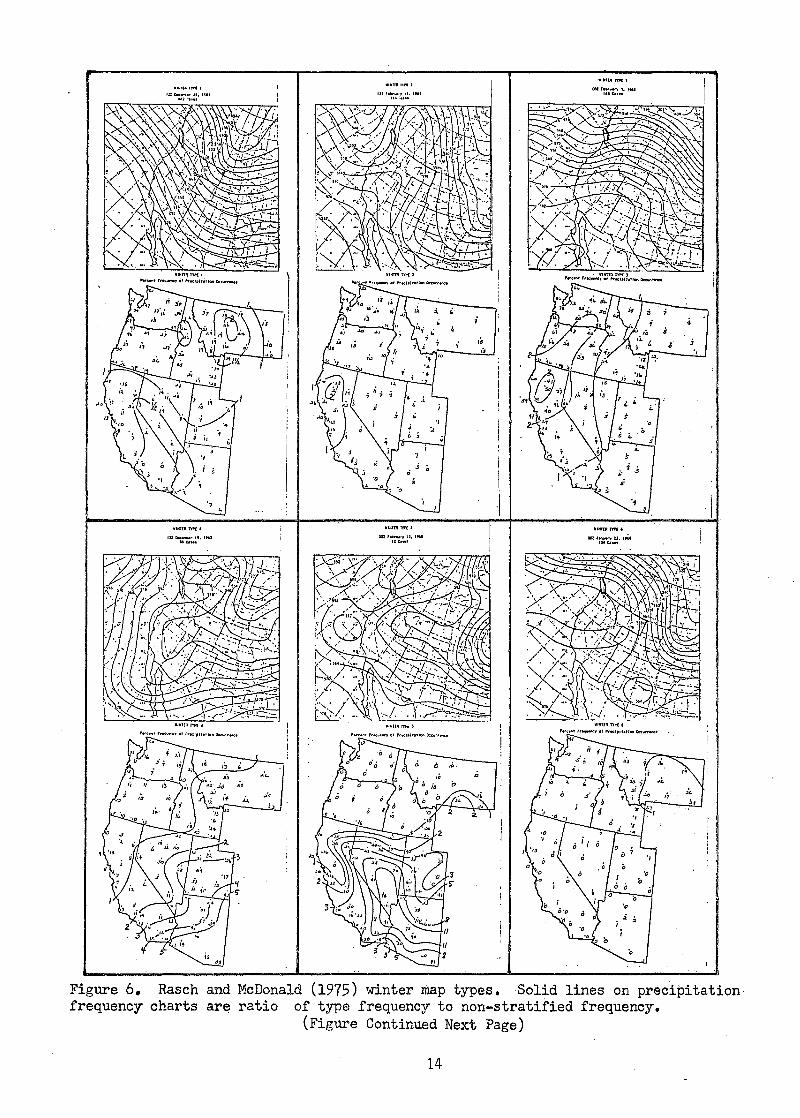
and Kierulff winter map types Figure 6. Rasch and MacDonald (1975) winter map . 14
types.
Table 1. Frequency with which each map type . . . 16 appeared in the first position of
. the bulletin and the expected fre-quency based on the relative fre-quency in the sample used to develop the map types.
Table 2. Proportion of the 72-hour 500-mb map . . . 17 types which verified at, or better than, the specified levels.
Table 3. Joint distribution of forecast and . . . . 18 verification map-type correlations tabulated as the proportion of the times the map type appeares in the bulletin during the winter season.
Table 4. Proportion of the forecast map types . 20 which verify above the threshold value of 800 in relation to the forecast correlation.
Table 5. Map-type verification for the winter . . 20 season 1876/77 given as the pro-portion of the forecasts which verified above the threshold correlation value.
Table 6. Representative map of the Paegle and . . . . 21 Kierulff (1974) map types and the corresponding Rasch and MacDonald (1975) map type with which the map is included.
iv
VERIFICATION OF 72-HOUR 500-MB MAP-TYPE PREDICTIONS
R. F. Quiring Nuclear Support Office
Las Vegas, Nevada
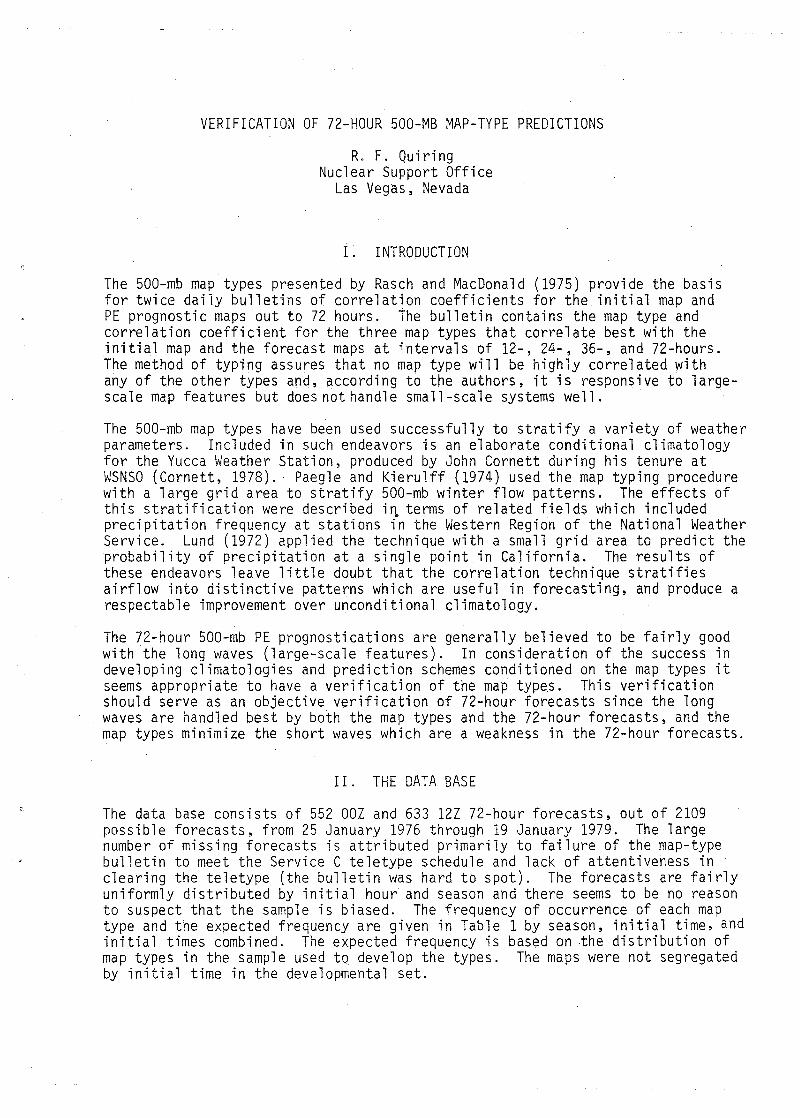
I. INTRODUCTION
The 500-mb map types presented by Rasch and MacDonald (1975) provide the basis for twice daily bulletins of correlation coefficients for the initial map and PE prognostic maps out to 72 hours. The bulletin contains the map type and correlation coefficient for the three map types that correlate best with the initial map and the forecast maps at intervals of 12-, 24-, 36-, and 72-hours. The method of typing assures that no map type will be highly correlated with any of the other types and, according to the authors, it is responsive to largescale map features but does not handle small-scale systems well.
The 500-mb map types have been used successfully to stratify a variety of weather parameters. Included in such endeavors is an elaborate conditional climatology for the Yucca Weather Station, produced by John Cornett during his tenure at WSNSO (Cornett, 1978). Paegle and Kierulff (1974) used the map typing procedure with a large grid area to stratify 500-mb winter flow patterns. The effects of this stratification were described i~ terms of related fields which included precipitation frequency at stations in the Western Region of the National Weather Service. Lund (1972) applied the technique with a small grid area to predict the probability of precipitation at a single point in California. The results of these endeavors leave little doubt that the correlation technique stratifies airflow into distinctive patterns which are useful in forecasting, and produce a respectable improvement over unconditional climatology.
The 72-hour 500-mb PE prognostications are generally believed to be fairly good with the long waves (large-scale features). In consideration of the success in developing climatologies and prediction schemes conditioned on the map types it seems appropriate to have a verification of the map types. This verification should serve as an objective verification of 72-hour forecasts since the long waves are handled best by both the map types and the 72-hour forecasts, and the map types minimize the short waves which are a weakness in the 72-hour forecasts.
II. THE DATA BASE
The data base consists of 552 OOZ and 633 12Z 72-hour forecasts, out of 2109 possible forecasts, from 25 January 1976 through 19 January 1979. The large number of missing forecasts is attributed primarily to failure of the map-type bulletin to meet the Service C teletype schedule and lack of attentiveness in clearing the teletype (the bulletin was hard to spot). The forecasts are fairly uniformly distributed by initial hour and season and there seems to be no reason to suspect that the sample is biased. The frequency of occurrence of each map type and the expected frequency are given in Table 1 by season, initial time, and initial times combined. The expected frequency is based on the distribution of map types in the sample used to develop the types. The maps were not segregated by initial time in the developmental set.

The map-type bulletins were rearranged in rows consisting of the initial map and the 12-, 24-, 36-, 48-, and 72-hour forecasts verifying on that map. The rearranged bulletins were punched on cards in preparation for computer processing. The verification presented in this report is based on a hand tabulation from a listing of the punched data. There were some counting errors but these are very likely few enough in number to be insignificant.
III. VERIFICATION
The verification tabulation was keyed to the threshold correlation coefficient of 800 (decimal omitted for convenience) used in developing the map types and was designed to reveal the quality of the verification and differences in verification for the initial times of OOZ and 12Z. The levels for categorizing quality in terms of verifying correlation coefficient were arbitrarily set at 860 and 920. Selected statistics from this tabulation are presented in Table 2. Table entries are cumulative from the left and give the proportion of the forecasts that verified at, or better than, the indicated correlation coefficient andiposition in the bulletin. Forty-three forecasts (3.6 percent of the forecasts} for which the best correlation with a map type was less than 800, are included in the tabulation. In the developmental sample only 0.7 percent of the maps did not correlate at 800 or better with one of the map types. Perusal of Table 2 reveals that (1) there is very little qifference between theverification of forecasts made from the initial hour OOZ and those made from the initial hour 12Z, (2) the map type that appears in the first position of the bulletin (i.e., correlated best with the forecast map) verifies best, (3) verification of the spring forecasts is substantially poorer than for the other season, (4) on an annual basis 85.5 percent of the forecasts in the first position of the map-type bulletin verified at, or above, the thr~shold correlation value of 800, (5) a substantial proportion of the forecasts in the second (58.9 percent) and third (39.5 percent) position·s of the map-type bulletin verified at, or above, the threshold correlation val~e of 800 on an annual basis, and (6) there is a substantial amount of shifting of positions between forecast and verification; i.e., a map type may verify in a higher or lower position in the bulletin and/or at a higher or lower level of correlation than forecast.
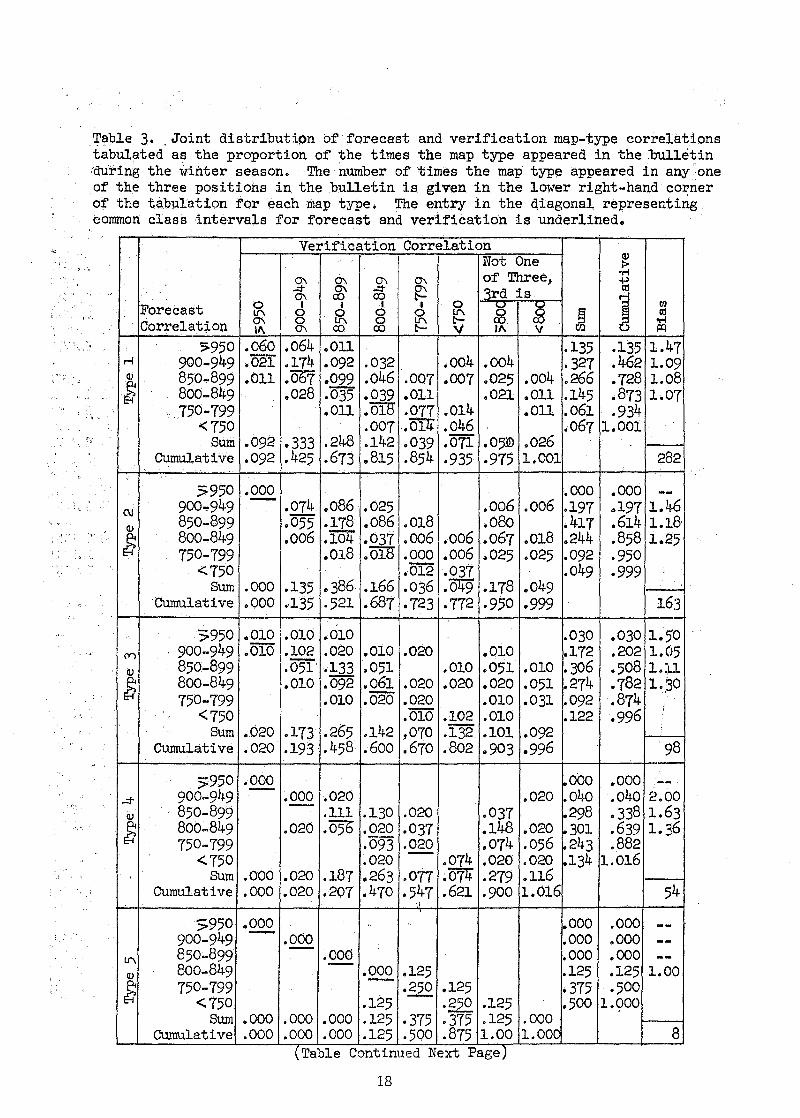
Variations in the verification correlation with respect to forecast correlation were examined for the winter season as a function of map type. All map types without regard to position in the 72-hour portion of the bulletin were incl~ded in this tabulation. The results are presented in Table 3 as joint distributions of forecast and verification correlation coefficients for each map type and all types combined. The diagonal representing common class intervals for forecast and verification is identified by underlining the entry. There were an appreciable number of tabulation errors but these are believed to be few enough in number so that the general conclusions which can be drawn from Table 3 are very likely valid.
The proportion of the 72-hour forecasts that verify at, or above, the threshold correlation of 8QQ. can be found in the cumulative row for each map type in Table 3. Verification is best for .type 1 which verifies on 81.5 percent of the occasions when it appears in the bulletin. Verification is poorest for type 5 at 12.5 percent. For all map types combined the verification is 65.0 percent. There is an indication that the quality of the verification varies directly with the frequency with which the map type occurs. This is shown in Figure 1 in which the
2
logarithmic curve provides a realistic fit to the data and clearly shows that the greater the frequency of occurrence of a map type the better the verification. Type 1 is the most common type and represents a very simple flow pattern. The less common types, like 5, represent very complex flow patterns. Furthermore, the representative map for each type contains all of the minor perturbations associated with the small-scale features present on a specified date. The suggestion is that the correlation coefficient is sensitive to the position and intensity of the short wave features moving within the long wave patterns. The more complex the flow pattern the more precisely the short wave features have to be positioned to correlate well with the map type.
It is also apparent in Table 3 that there is a substantial over-forecasting bias in the 72-hour map-type forecasts. This can be seen for each map type by comparing the proportion of the forecasts in the cumulative column which correlate above a given threshold value with the proportion of the verifications in the cumulative row which correlate above the same threshold value. All map types show a tendency toward over-forecasting with type 1 having the least bias. For all types combined the bias is on the order of 22 percent (.793 7 .650 = 1.22). One should note, however, that in a fairly substantial proportion of the verifications (14.1 percent for a·l1 types) the forecast type does not qualify as one of the best three when the 3rd best correlation is 800 or better. The bias would almost certainly be reduced if these correlations were known because some of these forecasts could be expected to verify above the threshold value.
The proportion of the forecast map types in each correlation class interval which verify above the threshold correlation value of 800 during the winter season for all map types combined is shown in Table 4. The verifying proportions are very likely low since on some occasions the verification correlation is not known because the map type does not verify as one of the three best when the correlation for the third best is 800 or greater. While it is quite clear that the proportion of the forecasts which verify decreases as the correlation decreases, the forecast also verifies above the threshold correlation on a rather substantial proportion of the occasions when the forecast correlation is less than 800.
Verification of 72-hour map-type forecasts is compared with shorter period forecasts in Table 5 for the winter season 1976/77. This table gives the proportion of the map-type forecasts verifying above the threshold correlation of 800 with respect to the forecast and verifying positions in the bulletin. The cumulative proportions from left to right are given in parenthesis. The tabulation for this single winter shows that (1) the quality of the forecasts deteriorates as the length of the forecast interval increases, (2) the forecast map type verifies most often in the same position of the bulletin as it was forecast, and (3) the lower the position of the forecast map type in the bulletin the poorer the verifi-cation. ·
IV. DISCUSSION
At first glance it appears that the 72-hour 500-mb map-type forecasts verify very well. The map type that appears in the first position of the bulletin verifies above the threshold correlation on 85.5 percent of the occasions on an annual basis. There are, however, rather frequent occasions when the forecaster
3

has to exercise judgment in interpreting the bulletin because the forecast map correlates almost equally well with two (or even three) map types; or, there are critical differences in a specific area of concern between the forecast map and the representative map for the map type. The forecaster may well be justified, on occasion, in choosing a map type other than the one in the first position of the bulletin as a basis for his forecast. There is a degree of risk with such Choices, however, because of the deterioration in the quality of the verification for map types in the second and third positions of the bulletin. There is also the possibility that the forecaster will be rewarded for his decision when a map type in the second or third position of the bulletin subsequently verifies better than the map type ih the first position. It is therefore desirable to gain some insight into what is achieved by the map typing technique and the relev~nce of the correlation coefficient.
It is enlightening to look at a few examples of map typing on different scales based on the method proposed by Lund (1963) and employed by Rasch and MacDonald (1975) to produce the operational 500-mb map types. In all of these the choice of a threshold correlation coefficient has been subjective with a major consideration being to minimize the number of maps not qualifying as one of the types. Lund (1972.) applied the technique with a 13-point grid to stratify 1000-mb flow as an aid in forecasting precipitation at Travis AFB, CA. The maps representing eight basic flow patterns in winter are shown in Figure 2. He experimented with smoothing flow patterns by averaging without any improvement in the probability of precipitation forecasts. His smoothed maps are almost identical to the representative maps and are not reproduced here. It is clear from Figure 2 that it is the direction in which the pressure surface slopes that is the key factor in stratifying the 1000-mb maps by type. The slope orientations represent directions of flow that approximate the 8-point compass with some apparent distinctions between cyclonic and anticyclonic curvature in the flow. It is important to note that the gradient of the slope has no effect on the correlation coefficient for parallel flows; i.e., a steep and a gentlY sloping surface having the same· orientation will have a correlation coefficient of 1. The technique assures that the map types are not well correlated with each other so that on this small scale the flow patterns are relatively simple and averaging of maps within a type can be expected to have little affect on the orientation of the contours.
Paegle and Kierulff (1974) used the map correlation technique to stratify 500-mb maps in winter relative to the NWS Western Region. They used the 52 points shown as grid 1 in Figure 3 to produce the map types presented in Figure 4. The flow patterns are shown by contours of the departure of the average height at grid points from 5572 meters. The large area covered by the grid brings the trough/ ridge configuration into play to a much greater extent than the small grid area used by Lund (1972) for Travis AFB. The smoothed flow patterns present rather straightforward variations on westerly flow which are fairly easy to interpret with respect to differences in precipitation frequency as seen in Figure 5. The standard deviation of height included in Figure 4 identifies the position of the grid in which the map type experiences the greatest variability. The contour pattern of type 1 is practically identical to that of the non-stratified maps but there is a significant difference between the two; i.e., there has been approximately a 60 percent reduction in the variance of the height of the 500-mb surface in the Eastern Gulf of Alaska. This does not have an appreciable affect on the precipitation frequencies since apparently equal numbers of precipitation and non-precipitation cases are removed from the sample by the other types. It
4
is the simplicity of the smoothed flow patterns and the resultant ease with which differences contained in a subsequent forecast map can be interpreted that is so appealing.
Rasch and MacDonald (1975) used the 182 points shown as grid 2 in Figure 3 to produce the map types used to generate the operational map-type bulletin. This grid introduces large areas in Central Canada and east of the Rockies and, according to the authors, does a better job of typing the large-scale features of this 500-mb flow than the 52-point grid (grid 1) but may not do well on smallscale features. The winter map types and associated precipitation frequencies are presented in Figure 6 for comparison with the Paegle and Kierulff (1974) map types. An analysis of the non-stratified set of Paegle and Kierulff has been added to facilitate the comparison. The 7 years of data used in the Paegle and Kierulff study are common to the 8 years used by Rasch and MacDonald so that variations in precipitation frequency due to sample differences should be minor. The obvious difference between the two sets of map types is the complexity of the flow patterns of Rasch and MacDonald. The main reason for this is that the flow patterns of Paegle and Kierulff have been averaged and the Rasch and MacDonald map types are represented by individual patterns in which the intensity of a short wave is often the dominant feature.
A feel for the diversity of the two sets of map types is given in Table 6 where the representative maps of the Paegle and Kierulff map types are identified with the Rasch and MacDonald map type with which they are included. Paegle and Kierulff map-types 6 and 7 distinguish between flow patterns in which short waves dig southeastward onshore (type 6) and off the coast (type 7). This is evident in the patterns of both standard deviation and precipitation frequency. Type 6'shows an elongated axis of maximum standard deviations on short with increased precipitati.on frequency in the eastern half of the region. Type 7 shows the axis of maximum standard deviations. off the coast with an area of greatly enhanced precipitation frequency oriented northeastward through central California. The representative maps for both of these types are included with Rasch and MacDonald maptype 4 for which the pattern of precipitation is a reasonable fit to Paegle and Kierulff type 6. Th~ area of increased precipitation frequency northeastward from central California characteristic of type 7 appears to be associated with Rasch and MacDonald type 7. Paegle and Kierulff map-types 1 and 2 make a significant distinction in precipitation frequency in the Pacific Northwest yet the representative maps for both of these types are included in Rasch and MacDonald type 1. Paegle and Kierulff type 4 is dry over the entire Western Region; i.e., well below average precipitation frequency at all stations. The representative map for this type is included with Rasch and MacDonald type 6 which is also dry over most of the Western Region except Montana and, in this respect, is very similar to type 9. The implication of these examples is that expanding the grid area does not really improve on the stratification of 500-mb flow patterns with respect to precipitation frequency; and, there is a fine line between which of two map types, with distinctly different precipitation patterns, a given map will be included.
It is clear from the preceding map typing projects on three substantially different scales that the complexity of the flow patterns increases as the size of the grid increases. The small area covered by the grid of Lund (1972) produces flow patterns approximating the 8-point compass. The larger area covered by the Paegle and Kierulff (1974) grid results in fairly straightforward variations on westerly
5
flow after the heights are averaged. The expanded grid used by Rasch and MacDonald (1975) introduces extensive areas in Central Canada and east of the Rockies and produces representative maps with complex flow patterns which often appear to be dominated by short wave features. Comparison of representative maps and precipitation frequency in relation to map types for the latter two studies indicates that (1) the typing procedure is rather crude, (2) the larger grid area does not appear to handle the long waves any better, (3) the averaging process smoothes out the short waves so that the resulting flow patterns can be more easily interpreted with respect to the long waves, and (4) useful information about the short waves relative to the long waves is contained in the standard deviations which are a convenient by-product of the averaging process.
V. CONCLUSIONS
The operational 500-mb map types do provide a degree of synoptic scale stratification of 500-mb maps. This is evident in the variations in precipitation frequencies over the Western Region which are presented as part of the map types, Rasch and MacDonald (1975). It is also evident in the Cornett (1978) Yucca Weather Station climatology conditioned on the map types that stratification is achieved for a point within the Western Region. The work of Lund (1972) suggests that in order to fine-tune the map typing technique to a single point it is desirab1e to reduce the grid area in order to better define the slope of the pressure surface relative to the point of interest. His winter map types pretty well stratify flow patterns representing the 8-point compass as one would sort of expect and hope for when dealing with a small area relative to a single point. The operational map types are rather crude in this respect because of the large grid area. Except for broad bands of westerly flow with low amplitude wave · structure, the Western Region is just too large to have really meaningful flow patterns common to the entire region. The complexities introduced by split flows and high amplitude wave structures make it rather difficult to recognize the long wave structure relative to the region.
It appears to be desirable to smooth the flow patterns by averaging rather than using a single map to represent the type. This eliminates the distortion in the flow pattern due to small-scale features contained in the representative map and allows for greater ease in interpreting a given synoptic pattern relative to the flow for the map type. Ah analysis of the variance of heights at grid points can be produced as a by-product during the averaging process and this enhances the understanding of variations in flow patterns identified with a map type.
This is the suggestion of the presence of the long waves in the map types and in this respect they provide a meaningful and objective approach to grading the quality of 72-hour 500-mb forecast maps. The goodness of the map-type forecasts does not necessarily carry over to a given weather element for a specific point within the Western Region even though the implication is that for a set of forecasts of a given map type that verify above the threshold value that weather element will occur with the relative frequency specified by a climatology conditioned on the map types. In other words, point forecasts should tend to be reliable over an extended period of time if the map types verify well.
6
The map type that appears in the first position of the bulletin (i.e., correlates highest with the forecast map) verifies above the threshold value on 85.5 percent of the occasions annually, 88.8 percent in winter, 75.3 percent in spring, 90.0 percent in summer and 88.5 percent in fall. The map types that appear in the second and third positions of the bulletin may also verify above the threshold value, but less frequently than the map type in the first position. They occasionally verify better than the map type in the first position.
Verification of winter map types only indicates that (1) the higher the correlation between the forecast map and the map type the higher the verification correlation, (2) there are appreciable differences in verification between map types with the types that occur most frequently verifying better than the less frequently occurring types, and (3) there is a substantial overforecasting bias; i.e., the map type correlates' with the forecast map above the threshold value more often than it verifies above the threshold value.
Verification for the winter of 1976/77 indicates that.the verification deteriorates as the length of the forecast interval increases.
7

VI. REFERENCES
C1J Cornett, J.S. The Yucca Flat Weather Associated with 500-mb Map Types, WSNSO 351-67, 7pp. Weather Service Nuclear Support Office, Las Vegas, Nevada, 1978. ·
C2J Lund, Iver A. Map-Pattern Classification by Statistical Methods. J. Appl. Meteor., 2, pp 56-65, 1963.
C3J Climatology as a Function of Map Type, Environmental Research Paper No. 391, AFCRL-72-0173, 15 pp., 1972.
C4J Paegla, Julia N. and Lawrence P. Kierulff. · Synoptic Climatology of 500-mb Winter Flow Types, J. Appl. Meteor., 13, pp. 205-212, 1974.
C5J Rasch, Glenn E. and Alexander E. MacDonald. Map Type Precipitation Probabilities for the Western Region, NOAA Technical Memorandum NWS WR-96, 138 pp, 1975.
8

VII. ADDENDUM
Example of map-type bulletin as currently transmitted over AFOS.
NMC5TCHMC FXUS3 KWBC 291200 500MB MAP TYPE CORRELATlONS OCT 29 INITL 12 HR 24 HR 36 HR 48 HR 72 HR 02898 02859 02817 02810 02813 05920 a 1777 04775 .·. a4755 a 1753 B1796 02839 08745 01761 01750 05656 05778 01832
First two numbers of each 5-digit set represent the map type published in C5J.
The last three numbers give the correlation of the current chart to the map type.
Example: The 24-hour 500-mb spectral prognosis valid 1200Z on October 30th correlates at 0.817 with map type two; 0.755 with map type four; and, 0.750 with map type one. The initial data time on which this bulletin was based is 1200Z October 29, 1981.
9
(
/
. "' I ....
J: :·
\ . ....
1-------!-------. i .. - ! . -- ·- ,_ __ --- !- ----·- ---1------ -·-- .. _______ j- -: ·-·---~-:--
--~:-·---~:~,-~~-~~~~~~ ! .. ;·· ...... ··j ,_ ··--r-·-···---:--;-;-,-;-H-!-7-+· --~~·:-:--+-+·r-~ ' • : , : · L • I • ·-
1-.. -
' --- ---· -------- ·--:------------' I
! . :-
j__ ;_ :. : .. ·-1 ' ..
l ·-·
! ... ·- ·-·
... : L~ .. ~- : ... :.
10
TY I' E -~.!: . .'1]_ IS JfiN 69
Fi~ure 2. 1000mb winter map types for Travis AFB, CA. (From Lund, 1972)
11

Figure 3. Grids 1 (.4), 2 fT) and 3 (0). (From Paegle and Kieru.lt"f', 1974)
12
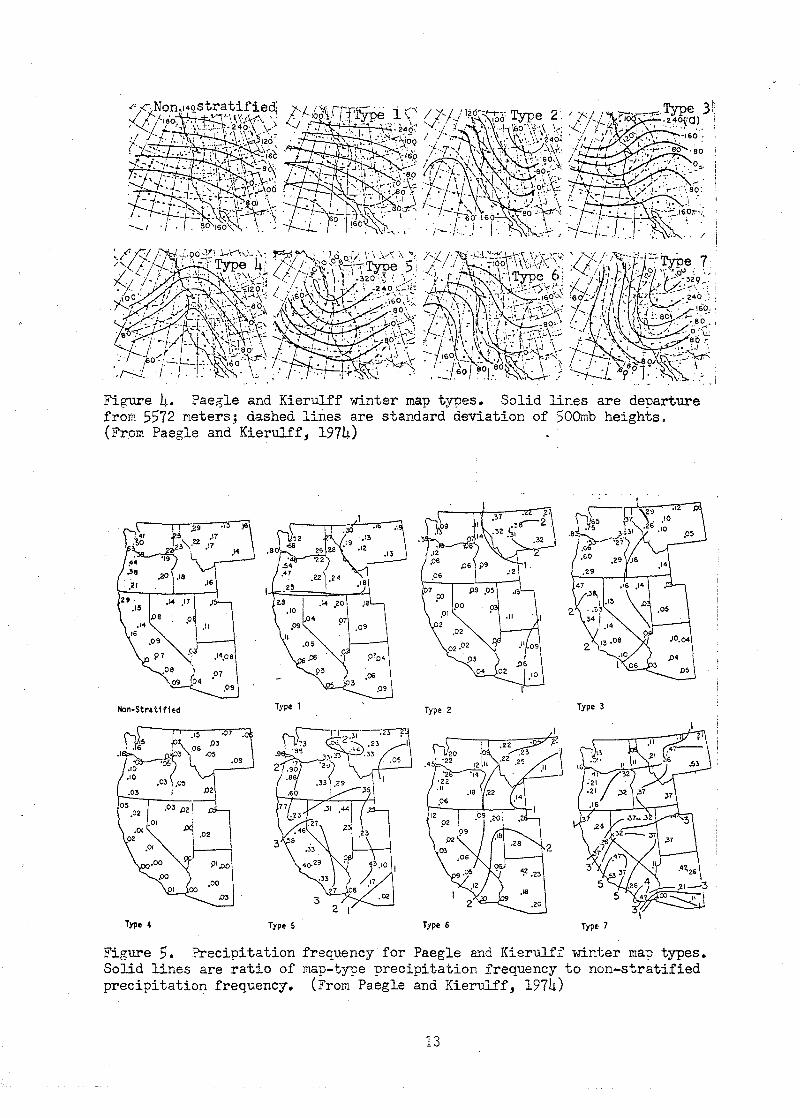
Figure 4. Paegle and Kierulff winter map types. Solid lines are departure fr;w 5572 meters; dashed lines are standard deviation of SOOr.1b heights. (From Paegle and Kierulff, 1974)
Hon-Stra t1f1 ed Type 1 Type 2 Type 3
Type 4 Type 5 Type 6 Typt 7
Figure 5. Precipitation frequency for Paegle and Kierulff winter map types. Solid lines are ratio of map-type precipitation frequency to non-stratified precipitation frequency. (From Paegle and Kierulff, 1974)
13
! '
Figure 6. Rasch and McDonald (1975) winter map types. Solid lines on precipitation frequency charts are ratio of type frequency to non-stratified frequency.
(Figure Continued Next Page)
14
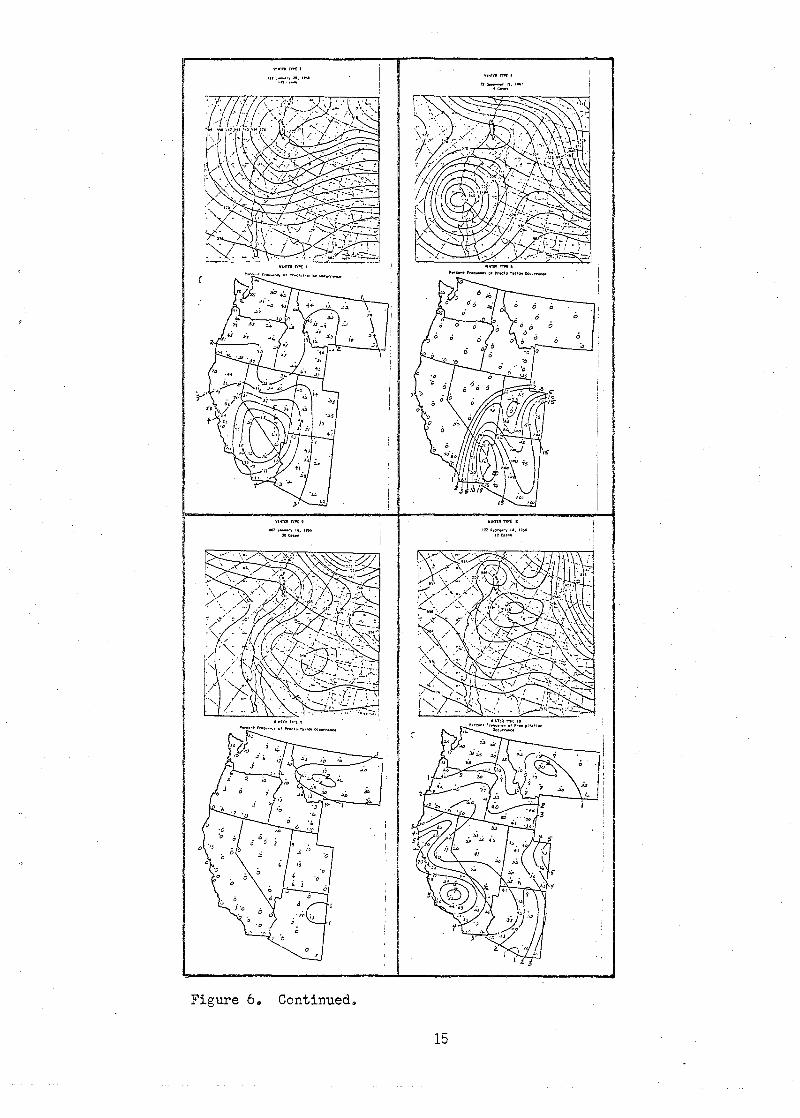
Figure 6. Continued.
15
I'UFotOr....,,v u, 1966 12Coon

f--' 0"'1
Table 1. Frequency with which each map type appeared in the first position of the bulletin and the expected frequency based on the relative frequency in the sample used to develop the map types. ,
Winter Spring Sunnner Fall Type ooz 12Z OOZ/12Z ooz 12Z OOZ/12Z ooz 12Z OOZjl2Z ooz 12Z OOZ/12Z
Obs Exn Obs Exu Obs~ Obs Exp Obs Exp Obs Exp Obs Exp Obs Exp Obs Exp Obs Exp Obs E.x:Q_ Obs EJci> 1 66 68 81 86 147 154 69 74 75 87 144 161 89 71 95 78 184 149 90 91 93 92 183 183 2 33 11 39 15 72 26 20 15 16 18 36 33 4 9 6 9 10 18 20 23 20 23 -40 46 3 15 17 20 21 35 38 7 21 15 24 22 45 16 15 10 15 26 30 22 14 14 14 36 28 4 2 9 4 12 6 21 16 10 18 12 34 22 9 9 12 10 21 19 5 3 6 3 11 5 5 0 1 2 2 2 3 12 12 17 14 29 26 0 4 0 5 0 9 4 8 6 8 10 16 6 6 10 9 14 15 24 10 4 14 4 24 8 1 6 2 7 3 13 2 6 6 7 8 13 7 5 13 9 17 14 30 2 3 3 3 5 6 1 6 2 6 3 12 2 * 3 * 5 1 8 0 * 0 1 0 1 4 1 6 2 10 3 10 8 14 9 24 17 3 3 2 3 5 6 9 1 3 2 4 3 7 0 1 0 1 0 2 0 1 0 1 0 2
10 5 1 8 2 13 3 1 * 2 1 3 1 0 1 0 ]: 0 2 N 133_ 174 307 141 166 307 130 141 27:1. - 148 150 298 -- -~~
* Indicates less than 0.5 occurrences expected.
Winter 1976/77 Obs _Exp
53 63 43 11 10 16
2 8 2 1
12 10 0 12 0 * 0 3 3 1 125
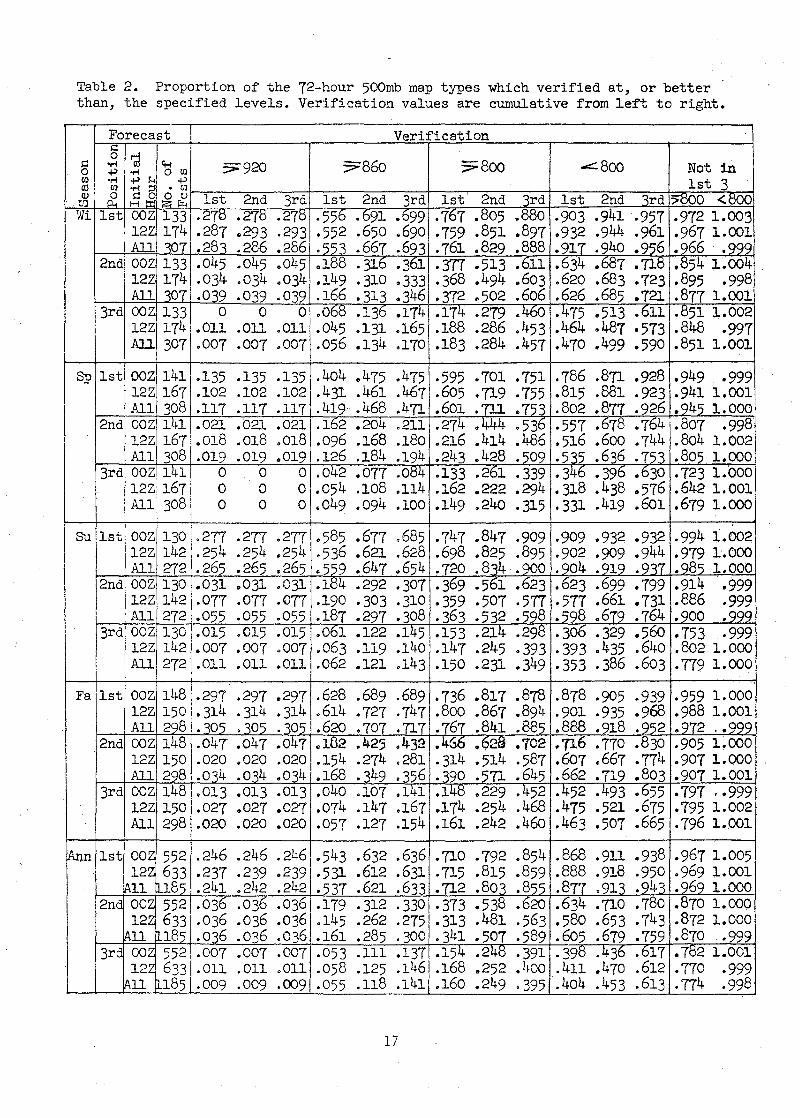
Table 2. Proportion of the 72-hour 500mb map types which verified at, or better than, the specified levels. Verification values are cumulative from left to right.
Forecast Verification 5 raJ ~ •r-1 G-l :>920 57860 s;soo ..::::Boo Not in 0 +> -r-1 0 Ul
Ul •r-1 +' H +> 1st 3 co Ul •r-1 ::s • Ul (]) ~ ~~ 0 C) lst 2nd 3rd lst 2nd 3rd lst 2nd 3rd 1st 2nd 3rd .X500 <BOO t!J ~Iii
Wi 1st ooz 133 .27Cl .27\:5 .27\:5 ·556 .691 .699 .767 .805 .880 -903 .941 -957 -972 1.003 12Z 174 .287 .. 293 .293 ·552 .650 .690 ·759 .851 .897 -932 .944 .961 .967 1.001 All 307 .283 .286 .286 ·553 .667 .693 .761 .829 .888 .917 .940 .956 .966 -999
2nd ooz 133 .045 .045 .045 .188 • 316 • 361 ·311 .513 .611 .634 .687 .718 .854 1.004 12.Z 174 .034 .034 .034 .149 .310 ·333 .)68 .494 .603 .620 .683 .723 .895 -998 All 307 .039 .039 .039 .166 .313 .346 ·372 .502 .606 .626 .685 .721 .877 1.001
3rd ooz 133 0 0 0 .068 .136 .174 .174 .279 .460 • 75 .513 .611 .851 ~.002 12Z 174 .011 .011 .011 .045 .131 .165 .188 .286 .453 .464 .487 ·573 .848 ·997 All 307 .007 .007 .007 .056 .134 .170 .183 .284 .457 .470 .499 .590 .851 1.001
Sp 1st ooz 141 .135 .135 .135 .404 .475 .475 ·595 .701 ·751 .786 .871 .928 .949 . ·999 12Z 167 .102 .102 .102 .431 .461 .467 .605 -719 -755 .815 .881 .923 .941 1.001 All 308 .117 .117 .117 .419 .468 .471 .601 ·Tll .753 .802 .877 .926 ._2_45_ 1. 000
2nd ooz 141 .021 .021 .021 .162 .204 .211 .274 .444 .536 -557 .678 .764 .807 .998 12Z 167 .018 .018 .018 .096 .168 .180 .216 .414 .486 .516 .600 .744 .804 1.002 All 308 .019 .019 .019 .126 .184 .194 .243 .428 .509 ·535 .636 • 753 .805 1.000
3rd OOZ, 141 0 0 0 .042 .077 .084 .133 .261 .339 • 346 • 396 • 6 30 • 723 1.000 12Zl67 0 0 0 .054 .108 .114 .162 .222 .294 .318 .438 .576 .642 1.001 All 308
! 0 0 0 .049 .094 .100 .149 • 24o . 315 ·331 .419 .6ol .679 1.000
Su 1st ooz 130 .277 .277 .277 .585 .677 .685 .747 .847 .909 .909 .932 .932 -994 1.002 12Z 142 .254 .254 .254 ·536 .621 .628 .698 .825 .895 .902 -909 .944 -979 1.000 All 272 .265 .265 ~265 ·559 .647 .654 .720 .834 .900 .904 .219 .937 .985 1.000
2nd ooz 130 .031 .031 .031 .154 .292 .307 .369 .561 .623 .623 .699 .799 .914 .999 12Z 142 .077 .077 .077 .190 .303 .310 ·359 .507 .577 .577 .661 .731 .886 ·999 All 272 .055 .055 .055 .187 .297 .308 .363 -532 -598 ._298 .679 • 764 .900 .999
3rd OOZ 130 .015 .015 .015 .061 .122 .145 .153 .214 .298 .306 .329 .56o • 753 -999 12Z 142 .007 .007 .007 .063 .119 .140 .147 .245 .393 . 393 .435 . 640 .802 1.000
I All 272 .011 .011 .011 .062 .121 .143 .150 .231 .349 • 353 • 386 .603 • 779 1.000
Fa 1st ooz 148 .297 .297 .297 .628 .689 .689 -736 .817 .878 .878 ·905 .939 -959 1.000 12Z 150 • 314 . 314 • 314 .614 .727 .747 .Boo .867 .894 .901 -935 .968 .988 1.001 All 298 • 305 • 305 .105_ • 620 • 707 •_71 7 .767 .841 .885_ • 888 ._218 ·252 .972 .• 999
2nd ooz 148 .047' .047 .047 clt32 .425 .432 .466 .628 .702 .716 .770 .830 .905 1,000 12Z 150 .020 .020 .020 .154 .274 .281 -314 .514 .587 .6o7 .667 • 774 .907 1.000 All 298 .034 .034 .034 .168 -349 ·356 -390 -571 .645 .662 .719 .803 .907 1.001
3rd ooz 148 .013 .013 .013 .040 .107 .141 .148 .229 .452 .452 .493 .655 • 797 '.999 12Z 150 .027 .027 .027 .074 .147 .167 .174 .254 .468 .475 .521 .675 • 795 1.002 All 298 .020 .020 .020 .057 .127 .154 .161 .242 .46o .463 .507 .665 . 796 1.001
~n 1st ooz 552 .246 .246 .246 .543 .632 .636 .no .792 .854 .868 .911 .938 .967 1.005 12Z 633 .237 .239 .239 • 5 31 • 612 • 6 31 .715 .815 .859 .888 .918 -950 .969 1.001
All 185 .241 .242 .242 -537 .621 .633 .712 .803 .855 .BTr .913 .943 .969 1.000 2nd ooz 552 .036 .036 .036 .1 79 • 312 . 330 ·373 .538 .620 .634 .710 .780 .870 1.000
12Z 633 .036 .036 .036 .145 .262 .275 .313 .481 .563 .580 .653 .743 .872 1.000 All 1185 .036 .036 .036 .161 .285 . 300 .341 .507 .589 .6o5 .679 .759 .870 -999
3rd ooz 552 .007 .007 .007 .053 .111 .137 .154 .248 .391 .398 .436 .617 • 752 1.001 122 633 .011 .011 .011 .058 .125 .146 .168 .252 .400 .411 .470 .612 .770 .999
1A11 ~185 .009 .009 .009 .055 .118 .141 .160 .249 ·395 .404 .453 .613 -774 .998
17
~ '.:,
Table 3. _Joint distribution of forecast and verification map-type correlations tabulated as the proportion of the times the map type appeared in the bulletin ·during the winter season. The number of times the map typ~ appeared in any' one of the three positions in. the bulletin is given in the lower right-hand corner of the ta.bulation for each map type. The entry in the d,iagonal representing common class intervals for forecast and verification is underlined.
Verification Correlation ' Not One ~
of Three, ..-I 0\ 0\ 0\ 0\ +'
..::t 0\ ..:t ~ 3rd is ctl 0\ co co j Forecast 0 a I I I 0 s ~
Cll l.f'\ 0 0 0 ~ l.f'\ : ctl
Correlation 0\ 0 l.f'\ 0 t- oro! II\ 0\ co co t- v II\ IX!
' 5950 .060 .064 .011 .135 .135 1.47 r-1 900-949 .021 .174 .092 .032 .oo4 .004 .327 .462 1.09 <li 850-899 .011 .067 .099 .046 .007 .007 .025 .oo4 .266 .728 1.08 ~ 800-849 .028 .035 .039 .011 .021 .011 .145 .873 1.07
.75.0-799 .on .018 .077 .014 .on .061 ' .934 <750 .007 .ollJ: .o46 .067 1.001
v ~· Sum .092 .333 .248 .142 .039 .071 .05ID .026 Cumulative .092 .425 .673 .815 .854 .935 ·975 1.001 Z82
:>950 .ooo .000 .ooo --900-949 - .074 .086 .025 .oo6 .006 1.46 C\1 .197 .197
(!) 850-899 .055 .178 .o86 .018 .cso .417 .614 1.18-
$ 800..,849 .oo6 .104 .037 .006 .oo6 .067 .018 .244 .858 1.25 750-799 .018 .018 .000 .oo6 .025 .025 .092 .950
<750 .012 .037 .049 -999 Sum .000 .135 .386 .166 .036 .049 .178 .049
'Cumulative .ooo .135 .521 .687 .723 .772 ·950 .999 163
>950 .010 .010 .010 .030 .030 1.50 cY) 900-949 .010 .102 .020 .010 .o2o .010 .172 .202 1.05 (!) 850-899 .051 .133 .051 .010 .051 .010 .306 .508 l.U
$ 800-849 .010 .092 .061 .020 .020 .020 .051 .274 .782 1.,30 750-799 .010 .020 .020 .010 .031 .092 .874 I
<750 .OIO .102 .010 .122 .996 Sum .020 .173 .265 .142 ,070 - .092 ' .132 .101
Cumulative .020 .19.3 .458 .600 .670 .802 .903 .996 '98
;>950 .000 1"000 .ooo --900-949 - .000 .020 .020 .040 .040 2.00 ..::t
. 850-899 - .111 .130 .020 .037 r-298 .338 1.63 (!)
$ 800-849 .020 .056 .020 .037 .148 .020 ~301 .639 1.36 750-799 .093 .020 .074 .056 ~243 .882
<. 750 .020 - .074 .020 .020 r-134 1.016 Sum .000 .020 .187 .263 .077 .074 .279 .116
Cumulative .ooo .020 .207 .470 .547 .621 .900 1.016 54 .. ~950 .ooo '· .ooo .000 --
900-949 - .000 .ooo .000 --l.f'\ 850-899 .ooo .ooo .ooo --
800-849 - .ooo .125 .125 .125 1.00 (!) -$ 750-799 .250 .125 .375 .500 <. 750 .125 .250 .125 .500 1.900
Sum .ooo .000 .000 .125 ·375 .375 .125 .000 Cumulative .000 .000 .000 .125 .500 .875 1.00 1.000 8
(Table Continued Next Page)
18

Table 3. Continued. Verification Correlation
Not One Ci)
> .. of Three, •r-1 0'\ 0'\ 0'\ 0'\ +> ~ 0'\ ~ 0'\ 3rd is co 0'\ co co t- r-l
0 I I I I 0 0 0 ~ tl.l Forecast LA 0 0 0 0 LA 0 0
~ (\1
0'\ 0 LA 0 LA t- co co 8 <r-1 Correlation 11\ 0'\ co co t- " II\ \{ ~
>950 .000 .000 .000 --\0 900-949 .016 .081 .024 .121 .121 3.03
Ci) 850-899 .024 .185 .105 .008 .008 .073 .008 .4ll ·532 1.37 p. 800-849 .081 .145 .024 .129 .024 .4o3 .935 1.36 8 750-799 .024 .008 .008 .016 .056 .991
<. 750 .oo8 .008 .999 Sum .ooo .o4o .347 .298 .o4o .016 .210 .048
Cumulative .ooo .040 .387 .685 .725 .741 ·951 .999 124
>950 .ooo .037 .037 .037 --900-949 - .ooo .037 .037 .074 0.96 t:-
Ci) 850-899 .020 .074 .037 .020 .037 .037 .225 .299 0.99
~ 8oo-849 .020 .os6 .056 .020 .056 .037 .245 .544 1.31 750-799 .020 .020 .037 .020 .020 .111 .228 .772
<750 .037 .'62C .167 .020 .244 1.016 Sum .000 .077 .224 .113 .077 .207 .113 .205
Cumulative .000 .077 .301 .414 .491 .698 .811 l.OlE 54
~Jpe 8 did not occur.
:>950 .000 .000 .000 --900-949 - .ooo .038 .038 .038 0'\ --850-899 - .077 .077 .058 .212 .250 1.62 Ci)
~ 800-849 .077 .os8 .038 .038 .077 .( 77 .365 .615 1.68 750-799 .038 .. 038 .038 .077 .173 • 364 .979
<750 .019 .000 .019 .998 Sum .000 .000 .154 .211 .095 .076 .212 .250
Cumulative .000 .ooo .154 .365 .460 .540 .748 -998 52
?950 .000 .000 .000 --900-949 - .013 .013 0.14 0 .013
r-l 850-899 .052 .130 .078 .026 .013 .299 .312 1.26 Ci) 8o0-849 .026 .026 .117 .013 .013 .117 .312 .624 1.20 ~ 750-799 .078 .013 .026 .065 .052 .234 .858
< 750 .104 .013 .026 .143 1.001 Sum .000 .091 .156 .273 .026 .143 .221 .091
Cumulative .000 .091 .247 .520 .546 /689 .910 1.001 77
>950 .020 .023 .004 .047 .047 1.52 tl.l 900-949 .oo8 .081 .060 .021 .002 .001 .003 .002 .178 .225 1.15 Ci)
~ 850-899 .003 .045 .128 .070 .008' .005 .047 .007 .313 .538 1.16 Soo-849 .015 .'Ob4 .063 .018 .007 .065 .023 .255 -793 1.22
r-l 750-799 .009 .030 .014 .012 .023 .037 .125 .918 r-l -< <. 750 .002 .oo4 .010 .058 .003 .004 .081 .999
Sum .031 .164 .267 .188 .052 .083 .lh1 .073 Cumulative .031 .195 .462 .650 . 702 • 785 .926 .999 912
19
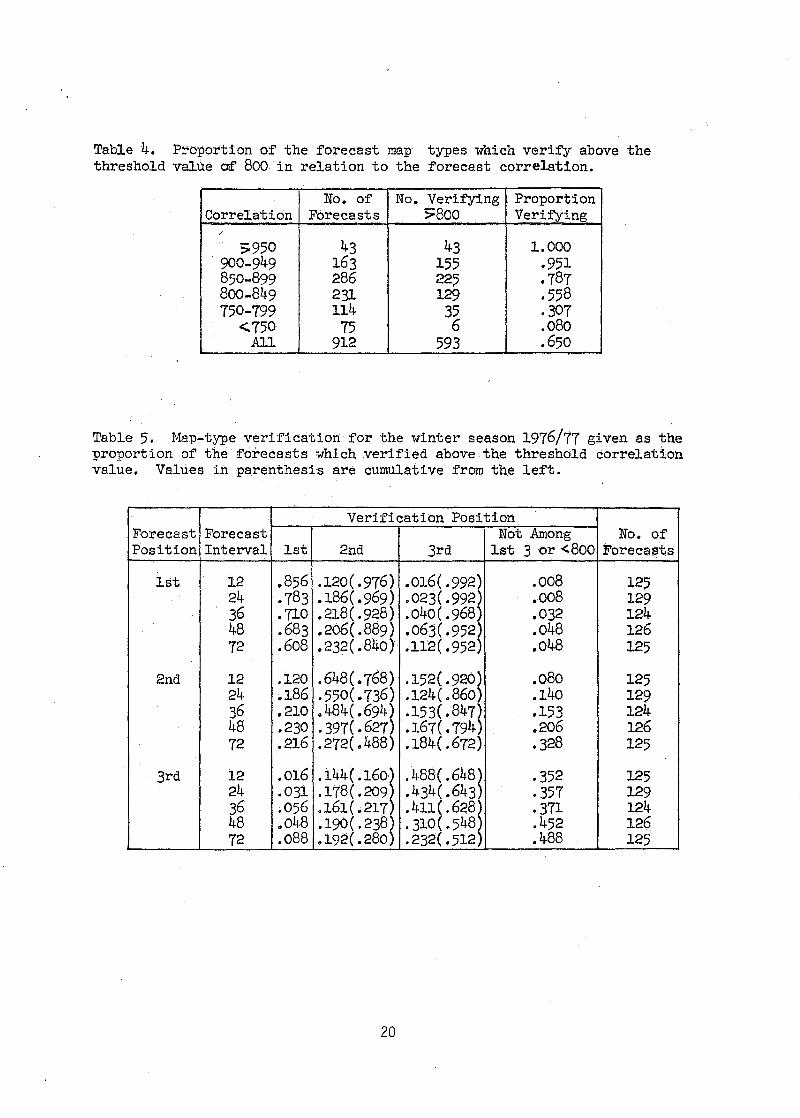
Table 4. Proportion of the forecast map· types which verif'y above the threshold value af 800 in relation to the forecast correlation.
No. of No. Verif'ying Proportion Correlation Forecasts >Boo Verif'ying
j
>950 43 43 1.000 900-949 163 155 .951 B50-B99 2B6 225 .787 Boo-849 231 129 .558 750-799 114 35 .307
<. 750 75 6 .080 All 912 593 .650
Table 5• Map-type verification for the winter season 1976/77 given as the proportion of the forecasts whlch verified above the threshold correlation value. Values in parenthesis are cumulative from the left.
Verification Position Forecast Forecast Not Among No. of Position Interval 1st 2nd 3rd 1st 3 or <.Boo Forecasts
1st 12 .856 .120( .976) .016(.992) .008 125 24 .7B3 .1B6(.969) .023(.992~ .oo8 129 36 .710 .218(.928) .040(. 968 .032 124 4B .683 .206(.8B9) .063(.952) .048 126 72 .6oB .232(.B4o) .112( .952) .o48 125
2nd 12 .120 .64B(.76B) .152(.920) .o8o 125 24 .1B6 -550(.736) .124(.860) .140 129 36 .210 .4B4(.694) .153(.847) .153 124 48 .230 -397(.627) .167(.794) .206 126 72 .216 .272(.4BB) .184(.672) .328 125
3rd 12 .016 .144( .160·~ .488(.648~ .352 125 24 .031 .17B( .209 .434(.643 • 357 129 36 .056 .161(.217) .4lll.628l • 371 124 48 .o048 .190(.23B~ . 310 .54B .452 126 72 .oBB .192(.280 .232 .512 .488 125
20

Table 6. Representative map of the Paegle and Kierulff (1974) map types and the corresponding Rasch and McDonald (1975) map type with which the map is included.
· Paeg1e & Kierulff Rasch & McDonald Map Type Map Date,Time Map ~.rpe
1 1/12/67,1200 1 2 2/l3/66,oooo 1 3 1/28/67,1200 3 4 12/31/61,1200 6 5 12/30/64,1200 7 6 12/16/65,1200 4 7 2/26/62,0000 4 8 1/31/63,0000 3
21
NOAA Technical Memoranda NWS WR: (Continued)
121 Climatological Prediction of Cumulonimbus Clouds in the Vicinity of the Yucca Flat Weather Station. R. F. Quirin9, June 1g77, (PB-271-704/AS) 122 A Method for Transforming Temperature Distribution to Normality. MorrisS. Webb, Jr.,. June 1g77, (PB-271-742/AS) 124 Statistical Guidance for Prediction of Eastern North Pacific Tropical Cyclone Motion- Part 1. Charles J. Neumann and Preston w. Leftwich, August 1977.
(PB-272-661) . 125 Statistical Guidance on the Prediction of Eastern North Pacific Tropical Cyclone Motion - Part 11. Preston w. Leftwich and Charles J. Neumann, August
1g77, (PB-273-155/AS) . 127 Development of a Probability Equation for Winter-Type Precipitation Patterns in Great Falls, Mo~tana. Kenneth B. Mfelke, February 1g78.(PB-281-387/AS) 128 Hand Calculator Program to Compute Parcel Thermal Dynamics. Dan Gudgel, April 1g78. (PB-283-080/AS) 12g Fire Whf~ls •. _David W. Goens, May 1g18. (PB-283-866/AS) 130 Flash-fli)oij Prbcedure. Ralph C. Hatch and Gerald Williams, May 1g79, (PB-286-014/AS) 131 Automated Fire-Weather Forecasts. Mark A. Mollner and David E. Olsen, September 1g79. (PB-289-916/AS) 132 Estimates of the Effects of Terrain Blocking on the Los Angeles WSR-74C Weather Radar. R. G. Pappas, R. Y. Lee, B. W. Finke, October 1g78.(PB289767/AS; 133 Spectral Techniques fn Ocean Wave Forecasting. John A. Jannuzzi, October 1978. (PB291317/AS) 134 Solar Radiation. John A. Jannuzzi, November 1978. (PB2gllg5/AS) J35 Application of a Spectrum Analyzer tn Forecasting Ocean Swell tn Southern California Coastal Waters. Lawrence P. Kierulff, January 1979. (PB2g2716/AS) 't36 Baste Hydrologic Principles. Thomas L. Dietrich, January 197g, (PB2g2247/AS) 137 LFM 24-Hour Prediction of Eastern Pacific Cyclones Refined by Satellite Images. John R. Zimmerman and Charles P. Ruscha, Jr., Jan. 1g79, (PB294324/AS) 138 A Simple Analysis/Diagnosis System for Real Time Evaluation of Vertical Motion. Scott Heflfck and James R. Fors, February 1g79, (PB2g4216/AS) 13g Aids for Forecasting Minimum Temperature in the Wenatchee Frost District. Robert S. Robinson, April 1g7g, (PB29833g/AS) 140 Influence of Cloudiness on Summertime Temperatures in the Eastern Washington Fire Weather District. James Holcomb, April 1979. (PB298674/AS) 141 Comparison of LFH and MFM Precipitation Guidance for Nevada During Doreen. Christopher Hill, April 1g79. (PB298613/AS) 142 The Usefulness of Data from Mountaintop Fire Lookout Stations in Determining Atmospheric Stability. Jonathan W. Corey, April 1979. {PB298899/AS) 143 The Depth of the Marine Layer at San Diego as Related to Subsequent Cool Season Precipitation Episodes in Arizona. Ira S. Brenner, May 1g79,
(PB2g8817/AS) 144 Arizona·Cool Season Climatological Surface Wind and Pressure Gradient Study. Ira S. Brenner, May 1g79, (PB298900/AS) 145 On the Use of Solar Radiation and Temperature Models to Estimate the Snap Bean Maturity Date in the Willamette Valley. Earl M. Bates, August 197g,
(PB80-160971) 146 The BART Experiment. Morris s. Webb, October 197g, (PB80-155112) 147 Occurrence and Distribution of Flash Floods in the Western Region. Thomas L. Dietrich, December 1g7g, (PBB0-160344) 14g Misinterpretations of Precipitation Probability Forecasts. Allan H. Murphy, Sarah lichtenstein, Baruch Ftschhoff, and Robert L. Winkler, February
. 1980. (PBB0-174576) · . 150 Annual Data and Veriftcatton Tabulation - Eastern and Central North Pacific Tropical Storms and Hurricanes 1g19. Emtl B. Gunther and Staff, EPHC,
April 1980. (PBS0-220486) 151 NMC Model Performance tn the Northeast Pacific. James E. Overland, PMEL-ERL, April 1g80. (PB80-196D33) 152 Climate of Salt lake City, Utah. Wilbur E. Figgins, June 1980. (PB80-2254g3) (Out of print.) _ 153 An Automatic lightning Detection System tn Northern Caltfornta. James E. Rea and Chrts E. Fontana, June 1980. (PB80-225592) 154 Regression Equation for the Peak Wind Gust 6 to 12 Hours tn Advance at Great Falls During Strong Downslope Wind Stor.s. Michael J, Oard, July 1g8Q,
(PB81-l08367) 155 A Ratniness Index for the Arizona Monsoon. John H. TenHarkel, July 1980. (PB81·1064g4) 156 The Effects of Terrain Distribution on Summer Thunderstorm Activity at Reno, Nevada. Christopher Dean Hill, July 1980. (PB81·102501) 157 An Operational Evaluation of the Scofteld/Oliver Technique for Estimating Precipitation Rates from Satellite Imagery. Richard Ochoa, August 1980.
( PB81-108227) 158 Hydrology Practicum. Thomas Dietrich, September 1g9o. (PB81-134033) 15g Tropical Cyclone Effects on California. Arnold Court, October 1980. (PB81-13377g) 160 Eastern North Pacific Tropical Cyclone Occurrences During lntraseasonal Periods. Preston W. Leftwich and Gatl M. Brown, February 1g81. 161 Solar Radiation as a Sole Source of Energy for Photovoltatcs in las Vegas, Nevada, for July and December. Darryl Randerson, April 1g81. 162 A Systems Approach to. Real-Time Runoff Analysis with a Deterministic Rainfall-Runoff Model. Robert J. C. Burnash and R. larry Ferral, April 1g81.
163 A Comparison of Two Methods for Forecasting Thunderstorms at luke Air Force Base, Arizona. Lt. Colonel Keith R. Cooley, April 1981. 164 An Objective Aid for Forecasting Afternoon Relative Humidity Along the Washington Cascade East Slopes. Robert s. Robinson, April 1g81. 165 Annual Data and Verification Tabulation, Eastern North Pacific Tropical Storms and Hurricanes }gao. Emil B. Gunther and Staff, May lg81. 166 Preliminary Estimates of Wind Power Potential at the Nevada Test Site. Howard G. Booth, June 1981. 167 ARAP User's Guide. Mark Mathewson, July 1981. (revised September 1981). 168 Forecasting the Onset of Coastal Gales Off Washington-Oregon. John R. Zimmerman and William D. Burton, August 1981. 169 A Statistical-Dynamical Model for Prediction of Tropical Cyclone Motion in the Eastern North Pacific Ocean. Preston W. Leftwich, Jr., October 1981. 170 An Enhanced Plotter for Surface Airways Observations. Andrew J. Spry and Jeffrey L. Anderson, October 1981 .
.. -
. !
NOAA SCIENTIFIC AND tECHNICAL PUBLICATIONS
The National Oceanic and Atmospheric Administration was established as part of the Department of · Commerce on October 3, 1970. The mission responsibilities of NOAA arc to assess the socioeconomic impact of natural and technological changes in the environment and to monitor and predict the state of the solid Earth; · the oceans and their living resources, the atmosphere, and the space environment of the Earth.
The major components of NOAA regularly produce various types of scientific and technical informa-. tion in the following kinds ofpublications: ·
PROFESSIONAL PAPERS-'- Important definitive research results, major techniques, and special inves~ tigations.
CONTRACT AND GRANT REPORTS- Reports prepared by contractors or grantees under NOAA sponsorship.
ATLAS - Presentation of analyzed data generally in the form of maps showing distribution of rainfall, chemical and physical conditions of oceans and atmosphere, distribution of fishes and marine mammals, ionospheric conditions, etc.
TECHNICAL SERVICE PUBLICATIONS- Reports containing data, observations, instructions, etc. A partial listing includes data serials; prediction and outlook periodicals; technical manuals, training papers, planning reports, and information serials; and miscellaneous technical publications.
TECHNICAL REPORTS- Journal quality with extensive details, mathematical developments, or data listings.
TECHNICAL MEMORANDUMS - Reports of preliminary, partial, or negative research or technology results, interim instructions, and the like.
Information on availability of NOAA publications can be obtained from:
ENVIRONMENTAL SCIENCE INFORMATION CENTER (0822) ENVIRONMENTAL DATA AND INFORMATION SERVICE
NATIONAL OCEANIC AND ATMOSPHERIC ADMINISTRATION U.S. DEPARTMENT OF COMMERCE
6009 Executive Boulevard Rockville, MD 20852