
' NOAA Technical Memorandum NWS WR-193 - National … · /' NOAA Technical Memorandum NWS WR-193...
57
/' NOAA Technical Memorandum NWS WR-193 THE MCC - AN OVERVIEW AND CASE STUDY ON IT'S IMPACT IN THE WESTERN UNITED STATES Salt Lake City, Utah March 1986 u.s. DEPARTMENT OF I COMMERCE National Oceanic and Atmospheric Administration I National Weather Service
Transcript of ' NOAA Technical Memorandum NWS WR-193 - National … · /' NOAA Technical Memorandum NWS WR-193...

/' NOAA Technical Memorandum NWS WR-193
THE MCC - AN OVERVIEW AND CASE STUDY ON IT'S IMPACT IN THE WESTERN UNITED STATES
Salt Lake City, Utah March 1986
u.s. DEPARTMENT OF I COMMERCE
National Oceanic and
Atmospheric Administration I National Weather
Service
NOAA TECHNICAL MEMORANDA National Weather Service, Western Region Subseries
The National Weather Service (NWS) Western Region (WR) Subseries provides an informal medium for the documentation and quick dissemination of results not appropriate, or not yet ready, for formal pub 1 i cation. The series is used to report on work in progress, to describe technical procedures and practices, or to relate progress to a limited audience. These Technical Memoranda will report on investigations devoted primarily to regional and local problem> of interest mainly to personnel, and hence will not be widely distributed.
Papers 1 to 25 are in the former series, ESSA Technical Memoranda, Western Region Technical Memoranda (WRTM); papers 24 to 59 are in the former series, ESSA Technical Memoranda, Weather Bureau Technical Memoranda (WBTM). Beginning with 60, the papers are part of the series, 'NOAA Technical Memorada NWS. Out-of-prii1t memoranda are not listed.
Papers 2 to 22, except for 5 (revised edition), are available from the National Weather Service Western Region, Scientific Services Division, P. 0. Box 11188, Federal Building, 125 South State Street, Salt Lake City, Utah 84147. Paper 5 (revised edition), and all others beginning with 25 ar_,;.iJ~ail~ble from the National Technical Information Service, U.S. Department of Commerce, Sills Building, 5285 Port Royal Road, Springfield, Virginia.J~'1·b 1Prices vary for all paper copy; $3.50 microfiche. Order by access·ion number shown in parentheses at end ·of each entry.
ESSA Technical Memoranda (WRTM)
2 Climatological Precipitation Probabilities. Compiled by Lucianne Miller, December 1965. 3 Western Region Pre- and Post-FP-3 Program, December 1, 1965, to February 20, 1966. Edward D. Diemer, March 1966. 5 Station Descriptions of Local Effects on Synoptic Weather Patterns. Philip Williams, Jr., April 1966 (revised Novembe1· 1967,0ctober 1969). (PB-17800) 8 Interpreting the RAREP. Herbert P. Benner, May 1966 (revised January 1967). 11 Some Electrical Processes in the Atmosphere. J. Latham, June 1966. 17 A Digitalized Summary of Radar Echoes within 100 Miles of Sacramento, California. J. A. Youngberg and L. B. Overaas, December 1966. 21 ·An Objective Aid for Forecasting the End of East Winds in the Columbia Gorge, July through October. D. John Coparanis, April 1967. 22 Derivation of Radar Horizons in Mountainous Terra in. Roger G. Pappas, Apri 1 1967. ·
ESSA Techni ca 1 Memoranda, Weather Bureau Techni ca 1 Memoranda (WBTM)
25 Verification of Operational Probability of Precipitation Forecasts, April 1966-March 1967. W. W. Dickey, October 1967. (PB-176240) 26 A study of Winds in the Lake Mead Recreation Arr· D D n,n,1io .1onuorv 1968. (PB-'77~30) 28 Weather Extremes. R. J. Schmi dl i, April 1968 29 Small-Scale Analysis and Prediction. Philip Wi111ams, "r., '''"Y ""uu. ''" ~·"·--• 30 Numerical Weather Prediction and Synoptic Meteorology. Capt. Thomas D. Murphy, U.S.A.F., May 1968. (AD-673365) 31 Precipitation Detection Probabilities by Salt Lake ARTC Radars. Robert K. Belesky, July 1968. (PB-1.79084) 32 Probabi 1 ity Forecasting--A Problem Analysis with Reference to the Portland Fire Weather Oi strict. Harold S. Ayer, July 1968. ( PB-179289) 35 Joint ESSA/FAA ARTC Radar Weather Surveillance Program. Herbert P. Benner and DeVon B. Smith, December 1968 (revised June 1970). AD-681857) 36 Temperature Trends in Sacramento--Another Heat Island. Anthony D. Lentini, February 1969. (PB-183055) 37 Disposal of Logging Residues without Damage to Air Quality. Owen P. Cramer, March 1969. (PB-183057) 39 Upper-Air Lows over Northwestern United States. A. L. Jacobson, April 1969. (PB-184296) 40 The Man-Machine Mix in Applied Weather Forecasting in the 1970's. L. W. Snellman, August 1969. (PB-185068) 42 Analysis of the Southern California Santa Ana of January 15-17, 1966. Barry B. Aronovi tch, August 1969. ( PB-185670) 43 Forecasting Maximum Temperatures at Helena, Montana. David E. 01 sen, October 1969. ( PB-185762) 44 Estimated Return Periods for Short-Duration Preci ?i tati on in Arizona. Paul C. Kangi eser, October 1969. ( PB- 187763) 46 Applications of the Net Radiometer to Short-Range Fog and Stratus Forecasting at Eugene, Oregon. L. Vee and E. Bates, December 1969. ( PB-190476) 47 Statistical Analysis as a Flood Routing Tool. Robert J. C. Burnash, December 1969. (PB-188744) · 48 Tsunami. Richard P. Augul is, February 1970. (PB-190157) 49 Predicting Precipitation Type. Robert J. C. Burnash and Floyd E. Hug, March 1970. (PB-190962) 50 Statistical Report on Aeroallergens (Pollens and Molds) Fort Huachuca, Arizona, 1969. Wayne S. Johnson, April 1970. (PB-191743) 51 Western Region Sea State and Surf Forecaster's Manual. Gordon C. Shields and Gerald B. Burdwell, July 1970. (PB-193102) 52 Sacramento Weather Radar Climatology. R. G. Pappas and. C. M. Vel iquette, July 1970. (PB-193347) 54 A Refinement of the Vorticity Field to Delineate Areas of Significant Precipitation. Barry B. Aronovitch, August 1970. 55 Appli~ation of the SSARR Model to a Basin without Discharge Record. Vail Schel'merhorn and Donal W. Kuehl, August 1970. (PB-194394) 56 Areal Coverage of Precipitation in Northwestern Utah. Philip Williams, Jr., and Werner J. Heck, September 1970. (PB-194389) 57 Preliminary Report on Agricultural Field Burning vs. Atmospheric Visibility in the Willamette Valley of Oregon. Earl M. Bates and David 0. Chilcote,
September 1970. (PB-194710) 58 Air Pollution by Jet Aircraft at Seattle-Tacoma Airport. Wallace R. Donaldson, October 1970. (COM-71-00017) 59 Application of PE Model Forecast Parameters to Local-Area Forecasting. Leonard W. Snellman, October 1970. (COM-71-00016)
NOAA Technical Memoranda (NWS WRi
60 An Aid for Forecasting the Minimum Temperature at Medford, Oregon. Arthur W. Fritz, October 1970. (COM-71-00120) 63 700-mb Warm Air Advection as a Forecasting Tool for Montana and Northern Idaho. Norris E. Woerner, February 1971. (COM-71-00349) 64 Wind and Weather Regimes at Great Falls, Montana. Warren B. Price, March 1971. 66 A Preliminary Report on Correlation of ARTCC Radar Echoes and Precipitation. Wilbur K. Hall, June 1971. (COM-71-00829) 69 National Weather Service Support to Soaring Activities. Ellis Burton, August 1971. (COM-71-00956) 71 Western Region Synoptic Analysis-Problems and Methods. Philip Williams, Jr., February 1972. (COM-72-10433) 74 Thunderstorms and Hail Days Probabilities in Nevada. Clarence M. Sakamoto, April 1972. (COM-72-10554) 75 A Study of the Low Level Jet Stream of the San Joaquin Valley. Ronald A. Willis and Philip Williams, Jr., May 1972. (COM-72-10707) 76 Monthly Climatological Charts of the Behavior of Fog and Low Stratus at Los Angeles International Airport. Donald M. Gales, July 1972. (COM-72-11140) 77 A Study of Radar Echo Distribution in Arizona During July and August. John E. Hales, Jr., July 1972. (COM-72-11136) 78 Forecasting Precipitation at Bakersfield, California, Using Pressure Gradient Vectors. Earl T. Riddiough, July 1972. (COM-72-11146) 79 Climate of Stockton, California. Robert C. Nelson, July 1972. (COM-72-10920) 80 Estimation of Number of Days Above or Below Selected Temperatures. Clarence M. Sakamoto, October 1972. (COM-72-10021) 81 An Aid for Forecasting Summer Maximum Temperatures at Seattle, Washington. Edgar G. Johnson, November 1972. (COM-73-10150) 82 Flash Flood Forecasting and Warning Program in the Western Region. Philip Williams, Jr., Chester L. Glenn, and Roland L. Raetz, December 1972,
(revised March 1978). (COM-73-10251) 83 A Comparison of Manual and Semiautomatic Methods of Digitizing Analog Wind Records. Glenn E. Rasch, March 1973. (COM-73-10669) 86 Conditional Probabilities for Sequences of Wet Days at Phoenix, Arizona. Paul C. Kangieser, June 1973. (COM-73-11264) 87 A Refinement of the Use of K-Va 1 ues in Forecasting Thunderstorms in Washington and Oregon. Robert Y. G. Lee, June 1973. (COM-73-11276) 89 Objective Forecast Precipitation over the Western Region of the United States. Julia N. Paegl e and Larry P. Ki erulff, Sept. 1973. (COM-73-11946/3AS) 91 Arizona "Eddy" Tornadoes. Robert s. Ingram, October 1973. (COM-73-10465) 92 Smoke Management in the Willamette Valley. Earl M. Bates, May 1974. (COM-74-11277/AS) 93 An Operational Evaluation of 500-mb Type Regression Equations. Alexander E. MacDonald, June 1974. (COM-74-11407/AS) 94 Conditional Probability of Visibility Less than One-Half Mile in Radiation Fog at Fresno, California. John D. Thomas, August 1974. (COM-74-11555/AS) 96 Map Type Precipitation Probabilities for the Western Region. Glenn E. Rasch and Alexander E. MacDonald, Feb•·uary 1975. (COM-75-10428/AS) 97 Eastern Pacific Cut-Off Low of April 21-28, 1974. William J. Alder and George R. Miller, January 1976. (PB-250-711/AS) 98 Study on a Significant Precipitation Episode in Western United States. Ira S. Brenner, April 1976. (COM-75-10719/AS) 99 A Study of Flash Flood Susceptibi 1 i ty--A Basin in Southern Arizona. Gera 1 d Williams, August 1975. ( COM-75-11360/AS) 102 A Set of Rules for Forecasting Temperatures in Napa and Sonoma Counties. Wesley L. Tuft, October 1975. (PB-246-902/AS) 103 Application of the National Weather Service Flash-Flood Program in the Western Region. Gerald Williams, January 1976. (PB-253-053/AS) 104 Objective Aids for Forecasting Minimum Temperatures at Reno, Nevada, During the Summer Months. Christopher D. Hill, January 1976. (PB-252-866/AS) 105 Forecasting the Mono iolind. Charles P. Ruscha, Jr., February 1976. (PB-254-650) 106 Use of MOS Forecast Parameters in Temperature Forecasting. John C. Plankinton, Jr., March 1976. (PB-254-649) 107 Map Types as Aids in Using MOS PoPs in Western United States. Ira S. Brenner, August 1976. (PB-259-594) 108 Other Kinds of Wind Shear. Christopher D. Hill, August 1976. (PB-260-437/AS) 109 Forecasting North Winds in the Upper Sacramento Valley and Adjoining Forests. Christopher E. Fontana, September 1976. (PB-273-677/AS) 110 Cool Inflow as a Weakening Influence on Eastern Pacific Tropical Cyclones. William J. Denney, November 1976. (PB-264-655/AS) 112 The MAN/MOS Program. Alexander E. MacDonald, February 1977. (PB-265-941/AS) 113 ~linter Season Minimum Temperature Formula for Bakersfield, California, Using Multiple Regression. Michael J. Oard, February. 1977. (PB-273-694/AS) 114 Tropical Cyclone Kathleen. James R. Fors, February 1977. (PB-273-676/AS) 116 A Study of Wind Gusts on Lake Mead. Bradley Colman, April 1977. (PB-268-847) 117 The Relative Frequency of Cumulonimbus Clouds at the Nevada Test Site as a Function of K-Va 1 ue. R. F. Quiring April 1977. (PB--272-831) 118 Moist~re Distribution Modification by Upward Vertical ~lotion. Ira S. Brenner, April 1977. (PB-268-740) ' 119 Relat1ve Frequency of Occurrence of Warm Season Echo Activity as a Function of Stability Indices Computed from the Yucca Flat, Nevada, Rawinsonde.
Darryl Randerson, June 1977. (PB-271-290/AS)

NOAA Technical Memorandum NWS WR-193
THE MCC - AN OVERVIEW AND CASE STUDY ON IT'S IMPACT IN THE WESTERN UNITED STATES
Glenn R. Luss ky
Scientific Services Division National Weather Service Western Region Salt Lake City, Utah March 1986
UNITED STATES I National Oceanic and I Nat1onal Weather DEPARTMENT OF COMMERCE Atmospheric Administration · Serv1ce Malcolm Baldrige, Secretary John V. Byrne. Administrator Richard E. Hallgren. D1rector

This publication has been reviewed
and is approved for publication by
Scientific Services Division,
Western Region.
i i
~Z.fkd Glenn E. Rasch, Chief Scientific Services Division Western Region Headquarters Salt Lake City, Utah

TABLE OF CONTENTS
I. General Overview A. The Western Region and the MCC B. MCC Characteristics
l. Defining the MCC 2. Typical MCC Life Cycle 3. Synoptic-scale Structure Associated with MCCs 4. MCC Climatology
a. Time of Year b. Regional Progression During the Year c. Time of Day
II. Case Study of 21 June 1984 Montana MCC A. Upper Air
1. 500 mb 2. 850 mb 3. Isentropic Analyses
B. Satellite and Surface Synoptic Sequence III. Differences Between 20 June 1984 and 21 June 1984 IV. MCC Forecasting Checklist
Acknowledgements References
iii
Page 1 1 2 2 3 4
10 10 ll 12 14 14 14 14 21 21 42 45
47 48

J /
The MCC - A Western Region Perspective
I. General Overview
A. The Western Region and the MCC
Severe weather- as defined by tornadoes, large hail and strong thunderstorm winds - is more uncommon in the Western Region than it is in the other National Weather Service regions. While thunderstorms do occur throughout much of the region from time to time, they are generally less intense in nature than many of those that occur over the central United States. This has recently been demonstrated by Schaefer, et al. (1985) using tornado statistics which show that the areal frequency of all tornadoes drops, in general, from one to three orders of magnitude from the central U.S. to the western U.S. The biggest difference in the tornado statistics, however, is in the magnitude of the storm (i.e.- it's width and path length). The areal frequency of severe weather over the West drops off sharply when only the "intense" storms are included; this dropoff is less dramatic over the central states. This suggests that not only are there more tornadic storms over the central U.S., but that they are also more intense.
There are, of course, problems in the tornado data base due to the much smaller population density over many portions of the West. It may be assumed that more tornadoes (and likewise severe weather in general) occur over the West than are reported. This is supported by Doswell (1980) who shows how many of the severe weather reports from Co 1 ora do to Montana
. occur near cities or major highways. Thus, we may wish to speculate that severe weather occurs more frequently over the West than the cl imatological data would indicate. Even so, evidence is very strong that the thunderstorms which produce tornadoes and other severe weather ares i gni fi cantly "weaker" in the Western Region - even east of the divide in Montana -than those over the central U.S. (Schaefer et al., 1985; McNulty, 1980; Flora, 1953).
Data presented in these publications suggest that the most 1 i kely locations for severe weather in the Western Region are in Montana (east of the divide) and in Arizona. This is not too surprising. Eastern Montana occassionally has very warm, moist and unstable air move in from the southeast, enhancing the possibility of intense thunderstorms. Arizona has it's wet monsoon season in July and August, at which time, these same ingredients enhance convective activity over the Southwest. The remainder of the region is generally less susceptible to intense thunderstorm activity.
It is quite possible that mesoscale convective complexes (MCCs) may be a significant source of severe thunderstorm activity in Arizona and eastern Montana. In an early study on MCCs, Maddox (1980) found that 3 out of the ~~ MCCs that occurred during 1978 affected Montana, two of which produced tornadoes. One MCC developed in NE Montana with only high winds reported. Another formed near Great Falls in the lee of the Rocky Mountains, producing a tornado. The third formed north of the Big Horn Mountains on 24 June 1978, with a very similar upper and lower tropospheric synoptic structure
-1-

to the case of 21 June 1984 which also formed an MCC north of the Big Horns. We wi 11 study in greater deta i 1 the 21 June 84 case in section II. Interestingly enough, both of these MCCs which formed north of the Big Horns produced numerous tornadoes, hail and heavy rains.
Met eo ro 1 ogi ca 1 1 i terature has not yet classified systems associ a ted with Arizona severe weather as MCCs. Maddox (1985), however, notes that "MCC-type systems probably occur most frequently in the Western Region over Arizona, southeastern California, southern Nevada and southern Utah during the summer (monsoon season)". Certainly, it would be a significant contribution to develop a good climatology of MCC-type systems in the southwestern U.S. Since this has not been done yet, this paper will concentrate mainly on discussion of the MCC as it has been documented for occurrances east of the continental divide.
B. MCC Characteristics
Forecasting an MCC can be a very difficult proposition, especially if the forecaster is unfamiliar with why they form. They normally develop in situations that are very different from those which we associate with large thunderstorms and squall lines (i.e.- along strong frontal boundaries or dry lines). The very non-classical synoptic situations which are often associated with the development of MCCs have undoubtedly caused many meteorologists to wonder how and why the heavy weather associated with a particular MCC ever developed. This section is designed to give the reader a better understanding of the MCC system and will be divided into four subsections: 1) defining the MCC, 2) describing a typical life cycle, 3) describing the conditions which tend to be favorable for MCC development and 4) examining the spatial and temporal climatology of MCCs.
1. Defining the MCC
The original definition of the MCC is based upon analysis of the physical characteristics of the cloud-top temperatures that are displayed in enhanced infra red satellite imagery1. Two infrared ( IR) temperature and size thresholds were specified as criteria to qualify:
i) a cloud shield must be present with continuous IR temperatures <-320C over an area~ 100,000 km2;
ii) an interior cold cloud shield must have IR temperatures <-52oc over an area,!:50,000 km2.
1 These original thresholds were set up during the first stages of research on MCCs to segregate the large MCC systems from smaller convective systems. In the original research, these thresholds were set very high so that the MCC climatology would include only large systems that could be studied utilizing synoptic upper-air data. The definition was a 1 so formu 1 a ted to preclude linear, squall line systems from infiltrating the climatology. The thresholds, however, do not indicate that the MCC is 1 imited to mesosystems of such large size. MCC-type systems can and do exist at scales smaller than those specified here.
-2-

The shape of the cloud cluster is also considered in order to prevent linear-type systems from being classified as MCCs. The general rule is that the eccentricity of the cloud cluster (minor axis/major axis) must be 0.7 or greater when the -320C IR contour is at its largest size.
The MCC is itself very different from the air mass, multicell and supercell thunderstorms. The scale of the MCC system is several orders of magnitude larger than the mature air mass thunderstorm, as well as the typical multicell thunderstorm (Reynolds and VonderHaar, 1979). However, both of these storm types are similar to the MCC in that they do not require strong dynamical lifting (e.g. -differential vorticity advection; Maddox and Doswell, 1982), but rather, are more thermally forced in nature. For example, the initiation of MCC-type systems generally occurs in regions of upward motion associated with pronounced lower-tropospheric warm advection rather than forced, frontal lifting. The supercell thunderstorms may have large areas of IR sensed tops <-32°C, but the satellite-viewed anvil will be highly elongated and elliptical. These storms usually occur along a frontal boundary or dryline, with the discontinuity of the airmasses providing a mechanical lifting mechanism.
2. Typical MCC Life Cycle
There are four stages hypothesized in the typical MCC life cycle.
Stage 1: Genesis
A number of individual thunderstorms form within a region where conditions are favorable for convection (low-level warm advection, upward motion, a conditionally unstable lapse rate, etc.). The thunder~ storms will often produce severe weather during this phase. Atmid-levels, potentially cool environmental air is entrained, producing strong, evaporationally driven downdrafts with meso-high pressure systems and cold air outflows occurring in the surface boundary layer.
Stage 2: Development
A mid-level (750 to 400mb) warm region forms within the general region of the storms due to latent heat release within the convective elements and subsidence in the clear air between the storms. Outflow boundaries from individual storms merge at the surface, forming a large meso-high cold air outflow boundary. Low-level inflow of moist, potentially unstable air continues as the system grows rapidly. In response to the thunderstorm-produced warming, mid-level air converges into the system, where it is incorporated into a region of mean, mesoscale ascent. Movement of the MCC tends to be with the 700 to 500 mb mean flow. This also tends to be parallel to the 1000-500 mb thickness contours.
Stage 3: Mature
Intense convective elements continue to form where the 1 ow-level inflow advects very unstable air into the system. Severe weather may still occur; however, the primary type of significant weather is now
-3-

likely to be locally heavy rains. The dominant characteristic of the mature system is often the large extent of mid-level rising motion and the attendant large area of precipitation. Locally heavy rains have been associ a ted with the heavier convective elements within the MCC system (Merritt and Fritsch, 1984). At this time, a large meso-high is present at upper levels over the system (Fritsch et al., 1979).
Stage 4: Dissipation
A rapid change in the character of the MCC begins when the intense, convective elements no longer exist. This often occurs as the MCC moves just east of the mid-level ridge axis, where it loses its energy source (the inflow of unstable, low-level air) and its mesoscale organization, and appears chaotic in the IR imagery. Reasons for the system•s decay may include moving away from the 11 fuel 11 source and into a region where low-level moisture convergence is significantly reduced - a region where the large-scale environment is drier and more stable. It may also be due to an internal or external (e.g.- radiational) process which initiates the decay of the system. This will be discussed in greater detail in section I-4-C. Although the MCC loses its organization rapidly, the cool air and outflow boundary at the surface, midand high-level clouds, and light showers may persist in the dissipation stage for many hours.
Recent work with lightning data by Holle, et al. (1985) shows very well that there is a great deal of strong convective activity in the early phase of the developing MCC. As it matures, the convection and lightning decrease dramatically within the storm. This is consistent with the discussion here, which notes that most of the severe weather occurs during the initial stages of the MCC, when the convective activity is generally at its peak.
Maddox suggests that the most significant feature of the MCC is its region of mid-tropospheric convergence and mean, mesoscale ascent as discussed in stage 2. This feature continues through the 1 ife cycle of the MCC until the convective energy source weakens. Thus, the dissipation stage may be a reflection of the decay of mean, mesoscale ascent. The apparent reliance of the MCC on this feature i 11 ustrates a striking difference between the MCC and other types of strong weather systems with respect to its organization, structure and dynamics (i.e.- frontal-type systems where vertical motion is largely a result of differential vorticity advection, etc.). The large area of very cold cloud tops that is associated with the MCC is thought to indicate upward vertical motion, particularly in the mid and upper levels.
3. Synoptic-scale Structure Associated with MCCs
This section will discuss the many synoptic conditions which tend to be favorable for the development of MCCs.
-4-

a. Low level conditions
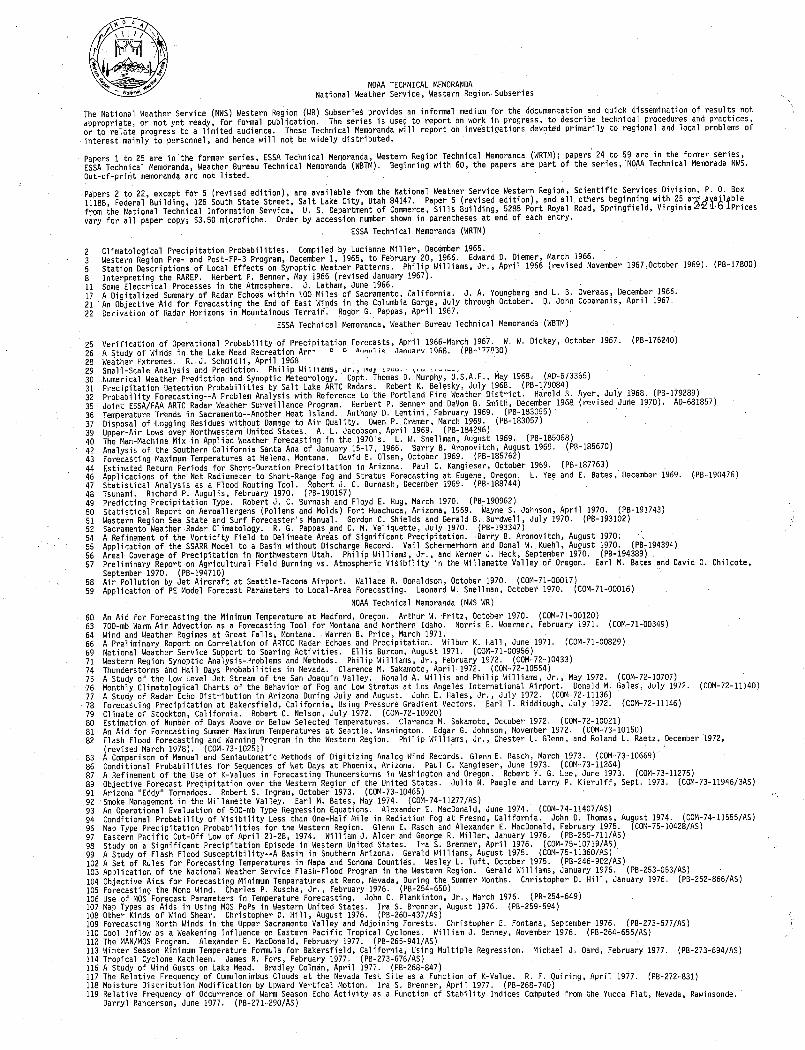
A typical low-level synoptic situation preceding an MCC is shown in Figure 1 (the surface analysis from the morning of 24 June 1978). Large-scale weak pressure gradients and 1 ight winds are not uncommon in the threat area during the morning hours. This figure shows a very weak surface trough extending from near Las Vegas, NV through Miles City, MT. Advection of warm, moist air (most easily observed on the 850 or 700 mb chart) into the threat region is apparently an important feature associated with potential MCC development. Maddox and Doswell (1982) document three cases which suggest that low-level warm advection dominated midtropospheric differential vorticity advection in forcing the mesoscale upward vertical motion field that leads to development of the convective elements associated with the MCCs. They postulated that the upward motion associatied with the MCC is "primarily a reflection of strong low-level warm advection rather than of strong differential PVA 11
• This indicates that the MCC acts much more like a big air mass thunderstorm rather than a squall line. It is forced more through thermal processes than it is through mechanical processes (i.e.- differential PVA, etc.).
The MCC will often form along or near a weak front or dry line. Many times, a stationary front stretched east/west across the Central Plains will lie just to the south of a developing MCC. In the example in Figure l, there is a distinct moisture gradient between Casper, WY (Td=36°F) and Billings, MT and Rapid City, SO (Td=520F and 550F, respectively), with the MCC forming in the moist region to the north of the Big Horns.
b. Vertical structure
The vertical structure of the atmosphere prior to the MCC development typically exhibits conditionally unstable lapse rates with warm, moist air near the surface, a capping inversion near 700 mb and relatively cold air at upper levels. The capping inversion is not always evident on the upper air soundings and is often associated with the northward tilt of the stationary frontal boundary. Advection of warm, moist air is necessary to keep the MCC system growing (usually evident at 700 or 850mb) and is usually enhanced by an approaching upper-level short wave trough.
c. Mid and upper tropospheric features
Figure 2 s haws an example of a 500 mb pattern which may often be associated with the development of an MCC. This was the 500 mb situation on the morning of 24 June 1978, from the previously mentioned case where an MCC developed north of the Big Horn Mountains. Major map features which are associ a ted with the MCC are the ridge axis to the east and a trough to the west of the threat area, leaving the region under weak to moderate southwesterly fiow. Upstream, a weak short wave trough is seen advancing to the northeast. Composite analyses of 500 and 200 mb winds prior to MCC development (Maddox,l983) indicate that this short wave feature normally propagates to the northwest of the threat area. Maddox notes that at 500 mb "there is considerable horizontal shear across the genesis region (GR) of the MCC with speeds increasing from 7 to 18 ms-1 from south to north". At 200 mb, a weak jet streak is present northwest of the GR; thus, the initial storm development and MCC genesis occurs when
-5-
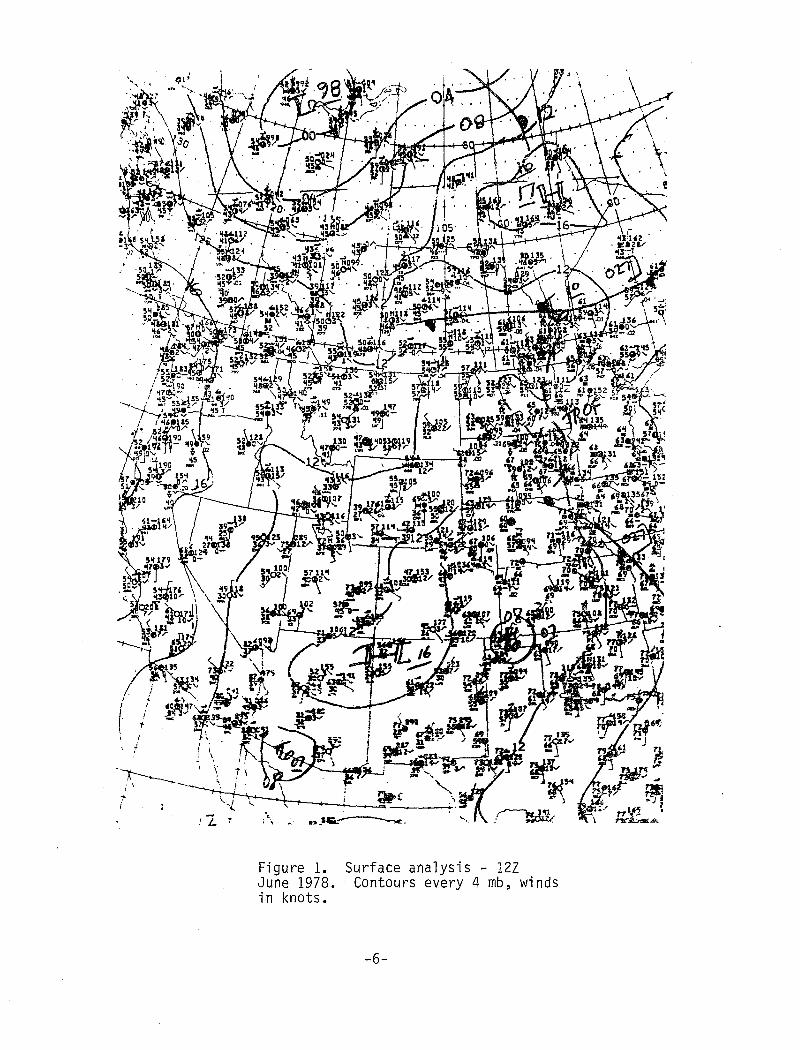
Figure l. June 1978. in knots.
Surface analysis - 12Z Contours every 4 mb, winds
-6-

I -.j
I
(; . . \ . {!.;/
.......__ I ... \ ~-t~i7 JUl.. \ ,JJ D JJ l ~r0L, ..,v _J
FEW ~ \ ' l• , J 4 ~ MJ \ , N\..1 17 e
,JJ
AND \ \
MJ SPORADIC \/
\ MJ
.• NIJ~ NI.J..IA
MJ
M.J /
AM
MJ
M.J !VIA
MANIJ
AM NIA
M.JJA
MJJAEI
!VIANI .I
NIP. lVI
ANI FNIA !VIA
\ \ C;
FNIA .JUL F.
\ AM
I
NIA
A~~~ /
Figure 3. Typical seasonal progression of tornado events based on SELS log, 1955-1967 (months are abbreviated)~
figure 2. 500mb ana1ysis - 122 24 June 1978. Contours every 60 m, winds in knots.

the right hand entrance region of the jet begins to move over the GR at 500mb. This result is consistent with that of Beebe and Bates (1955) who showed that the region most favorable for convection is associated with the divergent jet quadrant on the inner radial (concave) side of the jet. Under anti cycl ani c curvature, this would be in the right hand entrance region of the jet.
In the same paper mentioned above, Maddox also shows that the GR is characterized by a general increase of PVA with height. This PVA, however, is relatively weak and would probably not play a major role in the development of the mesoscale vertical motions of the MCC. However, the fact that the jet normally approaches to the northwest of the GR may be an important feature because it leaves the region on the anticyclonic side of the jet; thus, the absolute vorticity is likely to be weak over the threat area. The implications of this anticyclonic shear are discussed in the following paragraphs.
Theory states that for a given forcing (such as latent heat release in a thunderstorm which causes divergent circulations), the intensity of the ageostrophic response is greater in regions of weaker inertial stability2. This becomes clear when examining the vorti.city equation. If we ignore the solenoidal, differential friction and t\lilting terms and assume that the local change of vorticity is zero, we are left with the vorticity advection term balancing the divergence term. Since the vorticity advection term is weighted by one over the absolute vorticity, it is clear that for a given forcing, the divergent response will be greater when the absolute vorticity is weak. Likewise, the quasi-geostrophic omega ·equation suggests that for a given forcing, the vertical motion becomes more vigorous as the static stability decreases; thus, we have implications for enhanced divergent responses in both the horizontal and the vertical through weak inertial and static stablilties. Under such conditions, it is easier to maintain the divergent motions observed in the mature MCC systems for a long period of time. It is also probable that under these conditions, it is easier for an MCC to develop.
Diagnostic computations by Schneider (1985) support this hypothesis by showing a strong carrel ation between the generation of MCCs and the precursory existence of weak inertial stability aloft. This work was based on 12Z and OOZ soundings which were- analyzed on a 10 x 10 lat/lon grid on the MciDAS system at the University of Wisconsin-Madison. Eliassen (1951), while considering motions in an axially symmetric circular vortex, shows that meridional motions are favored in regions of weak upper-level inertial
2 When f -(~~-3)9 <0, where f is the planetary vorticity and(~~i)e is the change in the ~onal geostrophic wind with respect to latitude o'~n a e
(su\face, the atmosphere is inertially unstable. Given that f is positive, ~~~)e must be a,~l~rger positive number for inertial instability to be 'present. Since(d~~~ is positive only in cases of anticyclonic shear, it follows that inertial instability is possible only on the south side of the jet axis (in westerly flow) where the absolute vorticity is also weak (Haltiner and Martin, 1957).
-8-

stability. Additionally, Emanuel (1979) mentions that 11 the structure and scale of inertial circulations, together with the conditions under which they may occur, suggest a connection between inertial instability and certain mesoscale circulations in the atmosphere". He adds (Emanuel, 1985) that inertial instabilities are to horizontal divergence and lateral parcel displacements what static stabilities are to vertical motions; the weaker the stabilities, the more conducive the environment is to divergent motions. These results suggest that in regions of weak absolute vorticity, the corresponding weak inertial stability would permit an easier maintenance of ageostrophic circulations (i.e.- upper level horizontal outflow)3. Add in a weak static stability and we have an atmosphere which will be conducive to the 3-dimensional mesoscale divergent flow that appears to be necessary to support a system such as the MCC for an extended period of time.
d. Discussion
Since not all thunderstorms merge to form an MCC, a good question to ask would be 11 given static instability and thunderstorm development, at what times will an MCC not form? 11 The answer to this question is not necessarily simple and probably involves a number of factors. One factor appears to be the presence (or lack) of weak inertial stability in the region. To be very basic, the convective (static) stability influences the development of the initial thunderstorms. The inertial stability will influence the potential for the development and maintenance of mesoscale upper-level divergence, a necessary feature of the MCC. In the end, both types of stability will influence the development of the 'Mcc.
There is also a good deal of evidence that smaller-scale effects (such as topography and heat sources) may often play an important role in the initial thunderstorm development preceding the MCC. Maddox (1980) and Maddox and Reynolds (1976) both showed figures which indicated that the mesosystem source areas were often along the eastern slopes of the mountainous terrain. More than half of all 1978 MCCs developed in the lee of the Rockies, extending from Montana to western Texas. Additionally, Klitch and VonderHaar (1982) mention that "topography directly affects the development of mesoscale convective storms ••• inducing convection along the lee slopes of the Rocky Mountains and the adjacent High Plains". They do, however, point out that moisture convergence and instability may be more crucial for convective development than the lifting and convergence forced by the mountains. Even so, a good correlation was shown between cloud frequency and mountain slope location. The Big Horns were cited as one mountain range which seems to initiate convection.
3 While it has not been shown that weak inertial stability is a necessary precursory condition for MCC development, evidence exists that this condition does make it easier to maintain the upper level horizontal divergence that exists with the MCC. Researchers are currently unsure of the magnitude of the influence that weak inertial stability has on the developing MCC, indeed even if anticyclonic shear is necessary to develop an MCC. The arguments presented here, however, indicate that the weaker inertial stabilities will enhance the potential for MCC development and probably help to maintain it.
-9-

Research also indicates that the MCC is organized in a non-random manner on scales that are definitely not subgrid (with respect to the LFM or NGM). Yet the phenomena and the effects associated with the MCC system are not forecast by the operational models. Why not? There are two main reasons. First of all, the MCC is a convectively driven system whose physics are not yet well understood. Numerical modelers have difficulty parameterizing the effects of simple thunderstorms. Secondly, thi·s is a mesoscale system which develops from i ndi vi dual thunderstorms which are definitely subgri d. Si nee the models cannot correctly forecast the development and effects of individual thunderstorms (obviously the models cannot due to the thunderstorms subgrid nature), then they will also err by not developing an MCC which is so dependent upon the physics of the individual thunderstorms.
Si nee the models do not often forecast correctly the development of the MCCs, they also do not capture the changes that the MCC imposes upon the local large-scale environment, including the development of a meso-high in the upper troposphere (near 200mb). As a result, the vector difference between the observed upper tropospheric flow and the LFM predicted flow shows a large, anticyclonic flow perturbation over the MCC location with wind speed differences typically in the 30-50 knot range (Fritsch and Maddox, 1981). This interaction and modification of the 1 arge-scal e environment surrounding the MCC may well affect the future evolution of downstream synoptic scale features. Because the LFM does not capture this modification, it may also err significantly in predicting system development downstream. Recent research (Johnston, 1982) indicates that a mid-level vorticity maximum associated with the MCC often persists for an additional day and triggers thunderstorms downstream. However, it has not been shown that the meso-high created by the MCC at upper levels exists much longer than the MCC itself exists. In other words, the enhanced jet often observed to the north of the MCC is a response directly related to the mi d-1 evel warming within the MCC. When this warming ceases to exist, the upper level winds respond accordingly. Thus, the MCC represents not only a short-range forecast problem, it also suggests thunderstorm development and an impact on temperatures, cloud cover and precipitation for stations located downstream during the next 24 hours.
4. MCC Climatology
a. Time of year
Maddox's study of the 1978 MCCs together with data from the 1981 through 1982 MCC seasons (see Rodgers, et al., 1985) reveal the following average distribution of MCCs in the U.S. during the three years:
March 1 Apri 1 2. 5 May . 7 June 10.5 July 6.5 August 5.5 Sep,tember 1
-10-

/
It is apparent from this small data sampling that nearly 90% of a11 U.S. MCCs occur between the months of May and August, with the peak of the MCC season being in June.
b. Regional progression during the year
In addition to there being a preference for the time of year that MCCs occur, there is also a spatial transition of the MCCs during the season. The following discussion is based upon the regions affected by MCCs in 1978 and 1983 according to Maddox (1980) and Rodgers, et al., (1985), respectively.
March/April - The few MCCs that occur during these months seem to be genera 11 y confined to the southcentra 1 states, i ncl udi ng those within the region bordered by and including Texas, Kansas, Missouri and Mississippi. though they have reached as far north and east as southern Minnesota and Indiana.
May The region expands northward, with MCCs in Nebraska and Iowa becoming more common.
1-15 June The region has continued northward and has expanded on the north side to the east and west. It now includes eastern Wyoming, the southern half of North Dakota and Minnesota, and western Wisconsin and Illinois.
16-30 June - The western border now lies on the eastern edge of the mountains, extending from northern Montana to central Texas. The southern border has also shifted northward and no longer includes Louisiana. The eastern border includes Wisconsin and Illinois and the northern extent pushes north of the U.S./Canadian border.
July/August - Both of these months show a steady shift of the MCC affected area to the north and east such that by the end of August, the region is bordered by Michigan and Indiana to the east, includes southern Canada to the north, cuts through eastern Montana and Wyoming to the west and central Kansas and Missouri to the south.
September There was on 1 y one MCC during September of 1983; however, due to the infrequency of September MCCs, the time of year (and general cooling across the country) and the movement pattern of the MCC-affected region from March to August, it may be safe to assume that region would probably shift southeast~'lard during the month of September. This is consistent with this one observation, which occurred in Wisconsin and Michigan. With respect to the Western Region, Montana would probably experience very few MCCs during September.
-11-

It must be emphasized that this was the seasonal progression of MCCs for only two seasons~ 1978 and 1983. During other years, the timing of the events may be quite different due to large-scale influences on the weather patterns. However, it is probably safe to assume that the general progression of events is similar from year to year. Certainly, the forecaster must analyze each individual situation as it occurs and should not confine the MCCs to the re~ions outlined here in every situation.
It is also interesting to compare this seasonal MCC progression with the seasonal progression of tornado events (based on the SELS log, 1955-1967, Figure 3). This figure shows a similar seasonal progression to the north and west from Texas to Montana. Again, as far as the Western Region is concerned, only Montana was included in this analysis as the remainder of the region experiences fewer tornadoes. Similar to the occurrences of the MCCs, the tornadoes peak in eastern Montana in June and July.
c. Time of day
Perhaps one of the more interesting features of the MCC is the time of day during which the four .stages of the MCC life cycle typically take place. Maddox (1980) documented these times for the 43 1978 MCCs. The results show that nearly 80% of the initial thunderstorms formed between 1700Z. and 2230Z, with the average time of formation near .2000Z. The MCCs, on average, initiated 5-1/2 hours later at 0130Z (during the evening), reaching their maximum extent at 0730Z (in the early morning hours). They typically began to dissipate around 1230Z the next morning.
It is not so surprising that the thunderstorms would initiate during the middle of the afternoon, for this is when the air mass destablizes as the low level air warms up. · The interesting feature is that the MCC system typically increases to its maximum intensity well after the sun has set and terminates as the sun rises the next morning. Maddox has suggested that the MCC may have a great deal of influence on the nocturnal maxima in thunderstorm and precipitation frequencies over the central U.S. (documented by Wallace, 1975). This seems likely since the airmass and multicell thunderstorms rely heavily on solar heating (and generally die out soon after the sun sets). Even the supercell storms· tend to be modulated somewhat by the heating of the earth's lower layers, increasing in intensity as the stability decreases. Only the MCC shows a distinct preference for the evening and nighttime hours. The MCC may decay near sunrise because that is the time when it generally moves past the ridge axis into a region of drier, more stable air.
Other features may also influence the nocturnal preference. One of these may relate to the differential radiational cooling between the 1 ow-level MCC atmosphere and the surrounding 1 ow-level atmosphere. The ·longwave radiation emitted within the MCC is reabsorbed locally within the system. The outgoing longwave radiation emitted at low levels outside of the MCC escapes more easily, assuming clear skies outside the MCC. Therefore, the low-level temperatures outside of the MCC will cool more easily, resulting in higher surface pressures outside the MCC than those within the system. Higher surface pressures outside the MCC would enhance the low-level inflow which drives the system. After the sun comes up, the surface heating outside the MCC results in gradually lowered surface
-12-

- _/
pressures in comparison to the rain-cooled air within the MCC. This sets up a pressure gradient tendency which no longer favors the strong low-level flow coming into the sy~tem. Additionally, longwave radiational cooling at the top of the MCC may contribute to the destabl i zation .of the column. All this may contribute to the tendency of the MCC to be more concentrated at night and more spread out during the day as noted by Bosart and Sanders (1981). This general scenario has been discussed by Gray and McBride (1978) for tropical convective systems. Overall, these radiational effects are not considered to be significant factors in the maintenance of the nocturnal thunderstorm complex. Still, it is likely that they do play a role, even though it may be rather small compared to the larger scale forcings acting on the MCC system.
One problem does emerge from this hypothesis. If the differential radiational cooling does increase inflow into the storm at night, the inflow would consist of cooler air being entrained into the system. Though this cooler air would still be moist, what effect might it have upon the static stability of the system? Even though the entrainment of cooler air may modify its influence somewhat, it is still possible that differential radiational cooling plays a role in the maintenance of the MCC system at night.
Another important feature which may support the nocturnal development of the MCC is the low level nocturnal jet (Bonner, 1968). This would certainly feed more moisture into the MCC system during the night and enhance the MCC circulation (the greater the forcing, the greater the ageostrophic response) It is likely that this feature contributes to the development. of the MCC during the night and may help explain why there is a nocturnal maximum in the frequency of thunderstorms over the c·entra 1 United States. This low-level jet may be especially significant given the findings of Maddox concerning the importance of low-level warm air advection into the MCC system (section I-B-3-a). If indeed the warm. air advection is the main driving force behind the MCC, then the enhanced low-level nocturnal jet may have a strong influence on the MCC development.
-13-

II. Case Study of 21 June 1984 Montana MCC
During the afternoon of 21 June 1984, an MCC formed just north of the Big Horn Mountains in southern Montana. The storm began is two separate thunderstorm cells that developed near 2100Z merged at about 2155Z. The MCC spawned at least 6 tornadoes and hail 1-3/4 11 in diameter according to severe weather reports, with the first tornado report at 2310Z (see Table 1). The severe weather in Montana had ended by 0200Z 22 June, though the storm still produced heavy rains and scattered high wind reports as it passed through North Dakota during the morning hours.
A. Upper Air - OOZ 21 June 1984 to OOZ 22 June 1984
l. 500 mb
Figures 4a-c show the evolution of the 500 mb height and wind fields during the 24 hours which approximately preceded the formation of the MCC. Major map features show a long wave trough near the west coast of the United States with a long wave ridge over the central United States. Eastern r~ontana was under the influence of relatively weak upper level southwesterly flow. At OOZ the 21st (Fig~re 4a), a weak shortwave trough can be seen at the base of the trough with wind speeds of about 50 knots in the core of the jet. During the next 24 hours, the shortwave propagates northeastward moving into westcentral Montana. As a result, the anticyclonic shear increases and the upper level winds remain fairly weak (about 30 knots) over eastern Montana. Additionally, with the right front quadrant of the jet and NVA over the area, large-scale subsidence is suggested prior to the development of the thunderstorms.4 ·This is evident on the satellite photo from early in the morning on the 21st (Figure 5) as generally clear skies dominate the southeastern one-third of Montana. A deck of stratus dominates the weather in northern Montana as the comma associated with the approaching synoptic scale cyclone is seen pushing its way through eastern Idaho. All of the large scale features mentioned here, including the clear skies over the threat region, fit the classical 500mb MCC pattern very well, as described in section I-B-3. It is uncertain what affect, if any, the stratus deck in northern Montana had upon the development of the MCC. Possibilities will be suggested later in the paper.
2. 850 mb
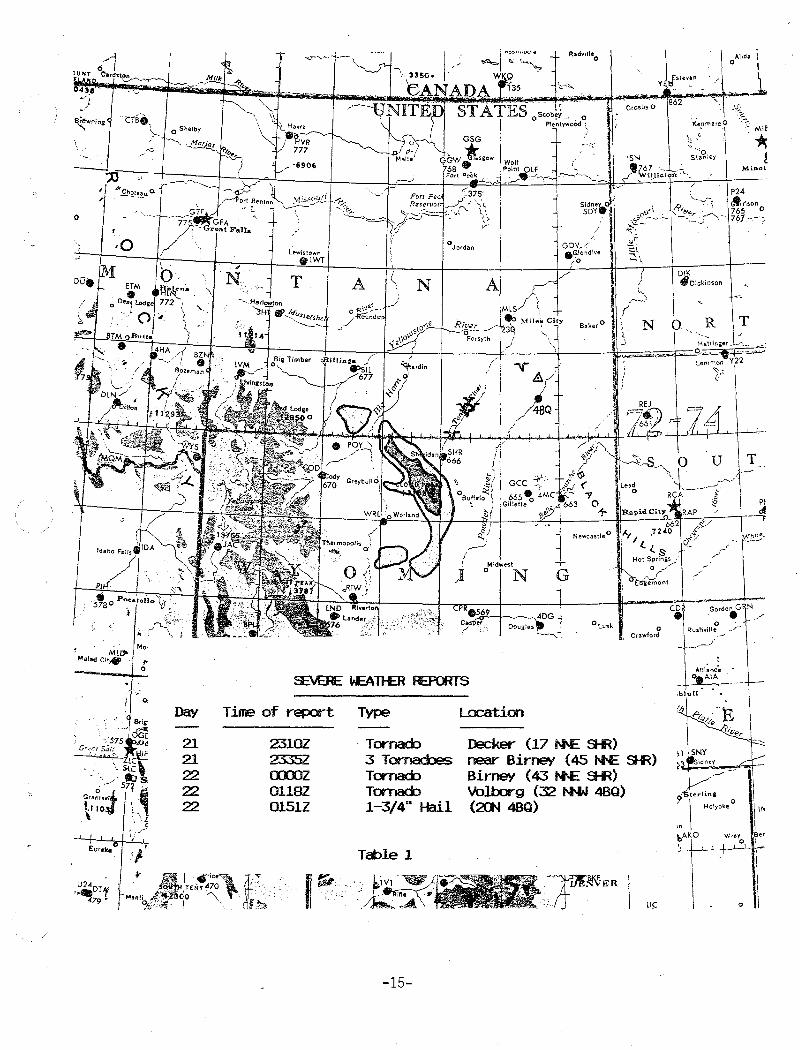
Figures 6a-c show the 850 mb maps valid every 12 hours from OOZ the 21st through OOZ the 22nd. The pressure patterns suggest advection of warm, moist air in eastern t'1ontana and the Dakotas during the 24 hours preceding the MCC. Temperatures rise between 1oc to soc from Kansas to North Dakota during the 24 hour period. Though the 850mb level at Lander, Wyoming is underground, height gradients suggest relatively weak winds throughout Wyoming and southern Montana. This is supported by surface pressure observations during much of the period (see Figure 8 for an example).
4 Straight jet streak ideas are used here and may not be entirely appropriate due to the strong curvature present with this system.
-14-
0
21 21 22 22 22
Time of Y"epot"'t
2310Z 2335Z co:::oz 01182 01512
Type
Tornacb 3 Tomacbes Tomacb Tor-nacb 1-3/4" Hail
Table 1
-15-
0 Lusk
Locatim
Decker- (17 ~ Si-R)
0 Crawford
near- Bir-ney ( 45 f\1\E _ 9fl) Bit'Tle'f ( 43 1'1£ Sfl) Volbor"g (32 I+W 4BQ) (2()\1 4BQ)
LI.C
1oickinson
Alidil 0
M.inol
P24 cfrrison 765 ° 76_7-- -·:
T
0

I >---' r;-\ I
570 5"""1 5fo4 5~1
Figure 4a. 500 mb analysis - OOZ 21 June 1984. Contours every 30 m, light stippling for winds of 30-40 kts. medium stippling 40-50 kts, heavy stippling 50 kts.
-0sJss
Figure 4b. As in Fig. 4a, except for 12Z 21 June 1984.

I j-....1
---J I
Figure 4c. As in Fig. 4a, except for OOZ 22 June 1984.
Figure 5. Visual satellite picture -1315Z 21 June 1984.
Z2~
Figure 6a. 850 mb analysis _ ooz 2~ Jun~ 1984. Contours every 30 m w1nds 1n knots. '
-18-

I
10~ I
I {
I , -..a;r
Figure 6b. As in 12Z 21 June 1984. Fig. 6a, except for
-19-

Figure 6c. As in Fig. 6a, except for ooz 22 June 1984.
-20-

3. Isentropic Analyses
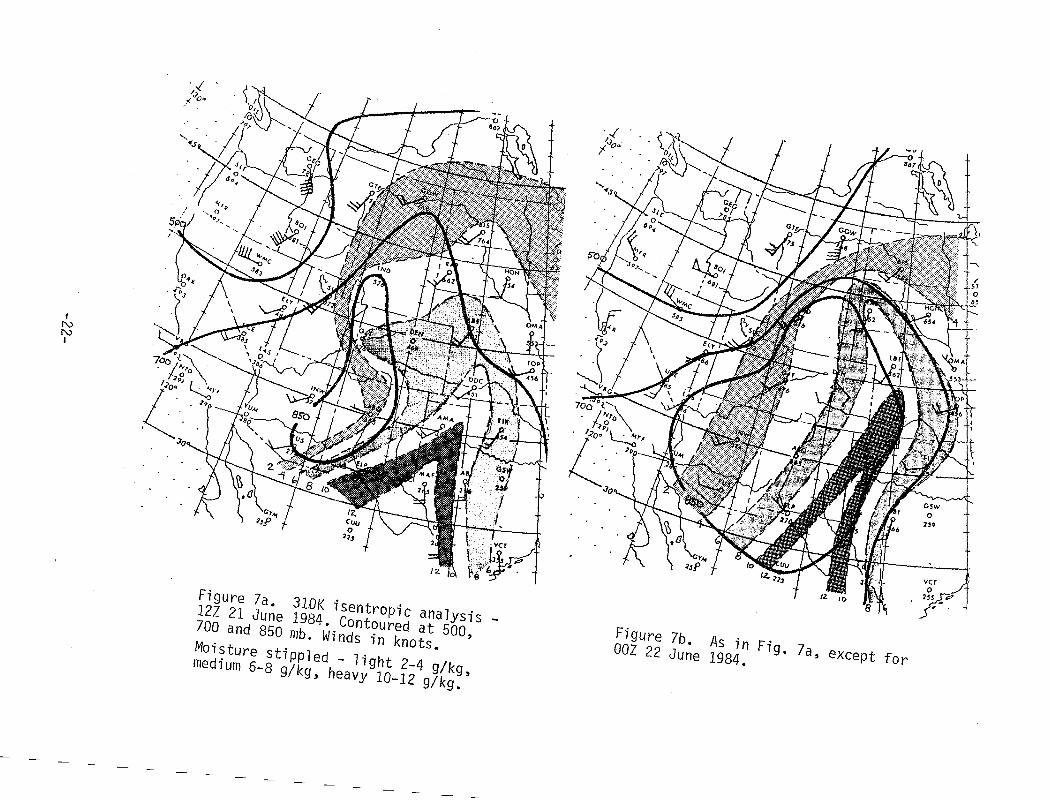
Isentropic analyses of the 31QOK surface for 12Z the 21st and OOZ the 22nd are shown in Figures 7a,b. While isentropic analyses are used more for widespread precipitation events and not for convective events (due to the assumed adiabatic airflow on an isentropic surface), they are helpful in showing the influx of moisture during the period preceding the MCC. In the analyses shown, a distinct tongue of 8 g/kg of moisture is seen advancing from Dodge City to Rapid City between 12Z and DOZ. These maps also show the warm advection into southeastern Montana very nicely.
4. Positive Area Analysis
Mielke (1979) has shown a strong relationship between the positive area (the energy of a parcel in J/g relative to that of the environment) with convective activity. The positive area at 12Z on the 21st is shown in Figure 8. A tongue of 1.5 J/g is evident extending into southeastern Montana. According to Mielke•s study, this high value indicates that thunderstorms are almost certain in this case, with a good chance that some will be strong - with large hail, heavy rains and tornadoes possible.
B. Satellite and surface synoptic sequence
Because of the wealth of knowledge that satellite pictures give to the forecaster and observer, meteorologists have been able to make great strides in both the forecasting and the understanding of weather systems at almost every time and spatial scale. One major discovery which can be attributed directly to satellite information is, of course, the MCC. These large thunderstorm systems were not known to exist in such an organized fashion until they were identified on satellite pictures in the mid to late 1970's. Certainly, the advent of these pictures has changed the way the meteorologist looks at the weather and has been one of the major accomplishments in the meteorological community during the past two decades. It has given the forecaster more detailed observations more often than the surface synoptic observations ever could. Because of the wide scatter and generally local nature of many surface observations, satellite photos may often be the first data received by the field meteorologist with information regarding the development of the thunderstorms which merge to form the MCC. Therefore, it is clear that satellite pictures are an important and valuable tool which should be used to diagnose the development of the MCC storm system.
In this section, we will look at a sequence of satellite and surface synoptic observations to investigate the conditions prior to and during the development of the MCC. As seen earlier in Figure 5, there were generally clear conditions which existed throughout Wyoming and southern t4ontana during the morning hours of the 21st. Figure 9 is the surface map from 12Z the 21st. It shows the clear conditions, with generally light surface winds. Troughs of low pressure extend southwestward and northwestward from northern Wyoming. An indistinct dry line (indicated by the 450F isodrosotherm) stretched from the northwest to southeast across the Wyoming plateau. By 13Z (Figure 10), the trough extending to the northwest appears to be weakening to the north and strengthening to the south. This is
-21-
I N N I
-,.; ,;<'.}0•
Figure 7a. 310K isentropic analysis -12Z 21 June 1984. Contoured at 500, 700 and 850 mb. Winds in knotse Moisture stippled - 1ight 2-4 g/kg, medium 6-8 g/kg, heavy 10-12 g/kg.
·.; /oo
Figure lb. As in Fig. la, except for ooz 22 June 1984.
239
vcr 0
2H

/
Figure 8. Positive area analysis in J/g - 12Z 21 June 1984 (after WRTA 84-23).
-23-

I N ..j:» I
'lz., El" I
"
Figure 9. Surface analysis - 12Z 21 June 1984. Contours every 2 mb, winds in knots, 45°F isodrosotherm dashed. Frontal location based on satellite pictures.
Jl!
"W -:._ GGV .,0 ~EH /
81<E ,J --.
WMc ·o '"
ONO
1
I
'-0 tl~.M sii
··t.
I I 'i!/t, .
' o" 'I
·~ i ,.
\~~ .
• I ;~
e.•'> • Q~\ •
Figure 10. As in Fig. 9, except for 13Z 21 June 1984.
o;,'T'=
~w'
1"1~ \~
-

mainly evident due to the 1.6 mb one hour pressure rise at Bozeman (BZN) and the 0.9 mb pressure fall at Sheridan (SHR). At this time it is difficult to determine any change in the character of the trough extending to the southwest.
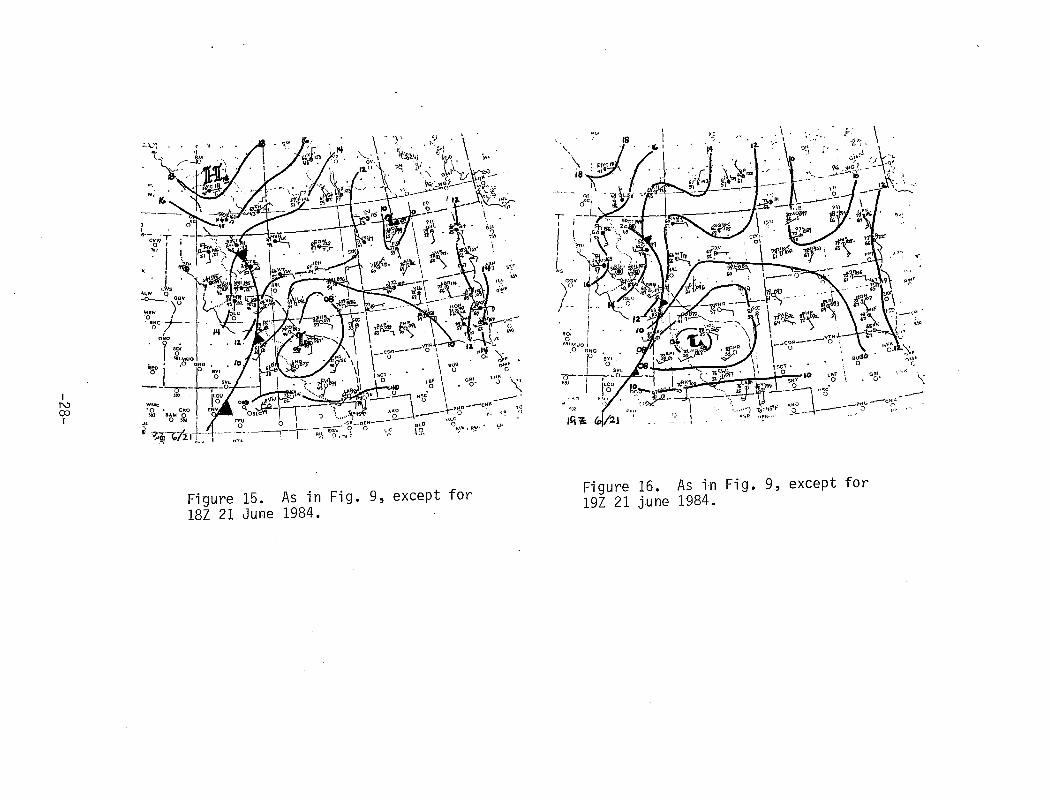
At 14Z (Figure 11), there is continued evidence that the trough extending to the northwest is weakening as the pressure at Sheridan drops another 0.7 mb and the wind begins to turn easterly. The dew points across much of the state have begun to rise, probably due to the sunshine and evaporation of ground moisture in the morning. This is likely the reason for the rising dew points, especially at stations such as Worland (WRl) and Casper (CPR) where there is little or no wind. At 15Z (Figure 12), a double structure is apparent in the surface pressure field, with one low pressure center between Sheridan and Worland and the other near lander (LND). The exact location of the southern low center is not yet obvious at this time due to the lack of pressure observations to the southwest of Lander.
At 16Z (Figure l3) the pressure at Sheri dan continues to fa 11, now down to 1008.4 mb, with the low still centered between Sheridah and Worland. The dew points continue to rise across much of the state with Lander•s dew point now at 500F. A great deal of low level moisture is evident across South Dakota with strong southeasterly flow pushing it toward southeastern Montana. The weakening of the inverted trough near the continental divide in Montana has become very evident by this time as the pressure at Kalispell (FCA) rose 2.2 mb between 15Z and 16Z while the pressure at Cut Bank (CTB) remained fairly steady. It is likely that the strong pressure rise at Kalispell is due to the passage of the synoptic scale cold front during the hour. By 17Z (Figure 14), the 10 knot northeasterly wind and falling pressure at Lander suggests that a low has developed just southeast of lander.· Again, the double structure is apparent in the surface pressure field across Wyoming, with the other low just southeast of Sheridan. Overall, a general cyclonic circulation is forming over Wyoming. It is also interesting to note that while this feature has not moved during the past two hours, it has deepened from 1009mb to 1007 mb.
On the 18Z surface map (Figure 15) the double structure in the pressure pattern is no longer evident as the lows apparently have merged to a single, more organized, low pressure center located just west of Worland. The central pressure has dropped to near 1006 mb. Additionally, a strong push of dry air is evident through centra 1 Wyoming associ a ted with the intensified southerly winds around the low. Dew points at Worland and Lander dropped 12oF and 10oF, respectively, in one hour - coinciding with the development of winds from the south and southwest. This is probably related to the mixing down of dry air from a 1oft. No 1 anger is the dry line indistinct as it was in the early daytime hours. Now there is a 17Df difference in dewpoint between Worland and Sheridan, the latter of which remains under the influence of the moist easterly flow. The boundary between the dry southerly flow and the moist easterly flow may well be the Big Horn Mountains by this time. By 19Z (Figure 16), the dry air has apparently encompassed the low. The 450f isodrosotherm is very probably in contact with the Big Horn, which are acting as a barrier between the moist air and the dry air. The dewpoint at Worland has dropped another 5 degrees to 350F during the hour while the Sheridan dewpoint remains at 570F. Note also that the temperatures in northwestern Montana have remained
-25-

I N
"" I
"'EH
_?liKE ---f-----+-0
,;,,_,
Figure 11. As in 14Z 21 June 1984.
Fig. 9,
.-c 0
except for
''" .. ) s~
~ ..... ·t~ 18
~~
q80
ILCU
<Me I' 0 0• EKO ENVo 563 BAM Q 0
~~/t..7.z.1L _ _j_ __
Figure 12. 15Z 21 June
As in 1984.
Fig· 9,
,, '
E'~ • R('\. '
except for
•'' II.._\..

I N -....)
I
-,t,
' . ~s·- 'T
c'~~ j K I
LLS "LW () GGV -o--'\o MEH I _0·~·-./
T WMC ·o "1
~~
'"' l~i--- ,;.~., "' DJ..:''
Figure 13. 16Z 21 June
As in 1984.
Fig. 9,
""
except for
~·~~ is~
_,_
MEH
WMC 0 !8~
Figure 14. 17Z 21 June
As in 1984.
Fig· 9,
,\2. t·' \ :.,}·\.
oj ~.'
\)
0· '-,· o" ')tJ.I (
til~
,~: E_IS , !'l~L '
except for
I N co I
Figure 15. 18Z 21 June
As in 1984.
Fig·
'"
GLD
\9. ·\;!"
9, except for
'! (2.
,... --l-~--..J.....----4~-- II
I ' '-... .... ~ .. ...,, ' P~.lli $'(~.
I •s
' ,_, ~
I ao; I t;~Muo) .0~ GNG •. YO •
0 SYL o-- -0
581 16u ~:-I f'•'
~~=-
-·.~ '· ··-
Figure 16. 19Z 21 june
10
!
As in 1984.
Fig·
I. \
W"''::!Tf' ~11r7 -nn.••• s-!_1
I C.iw·-- "' 7 "!.'\ \ , .. ,.
·~ - ~ ":.-:•.---,. _ .. _, p~"
v·• \
9, except for

/ quite cool, with Great Falls (GTF) still at 5QOF. In a composite analysis of MCC cases, Maddox (1983) stated that 11 temperatures are highest, and mixing ratios lowest, to the south and southwest of the (MCC) genesis region with very cool temperatures northwest of the genesis region".
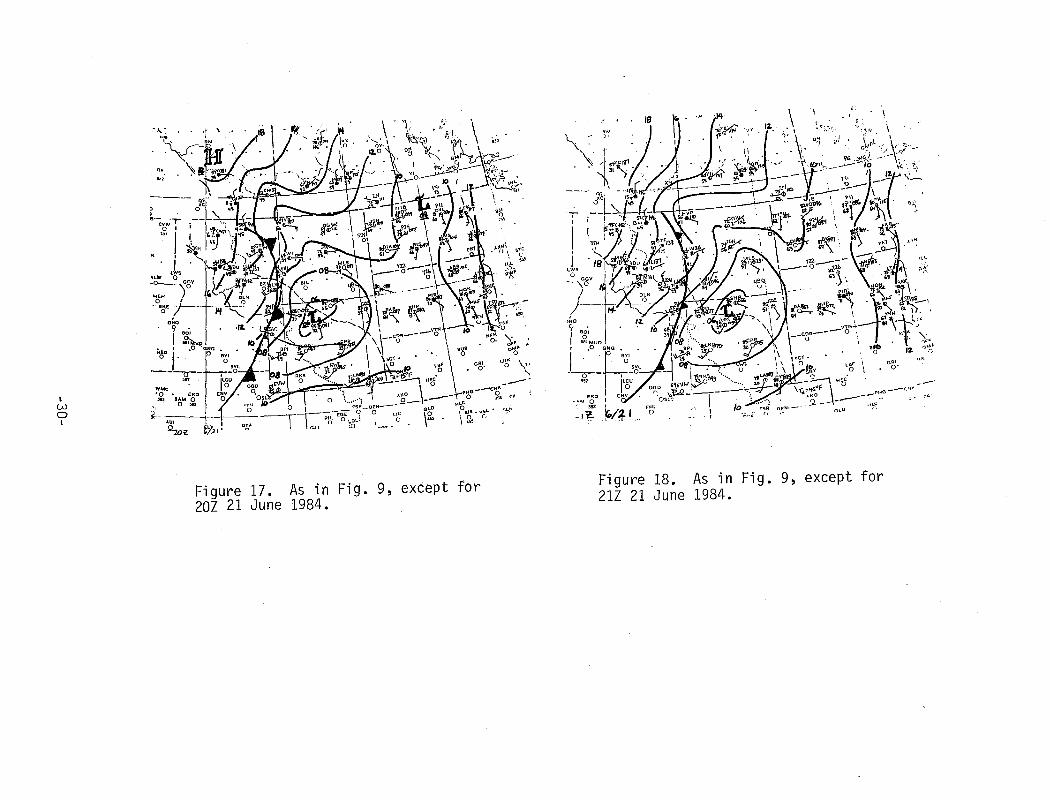
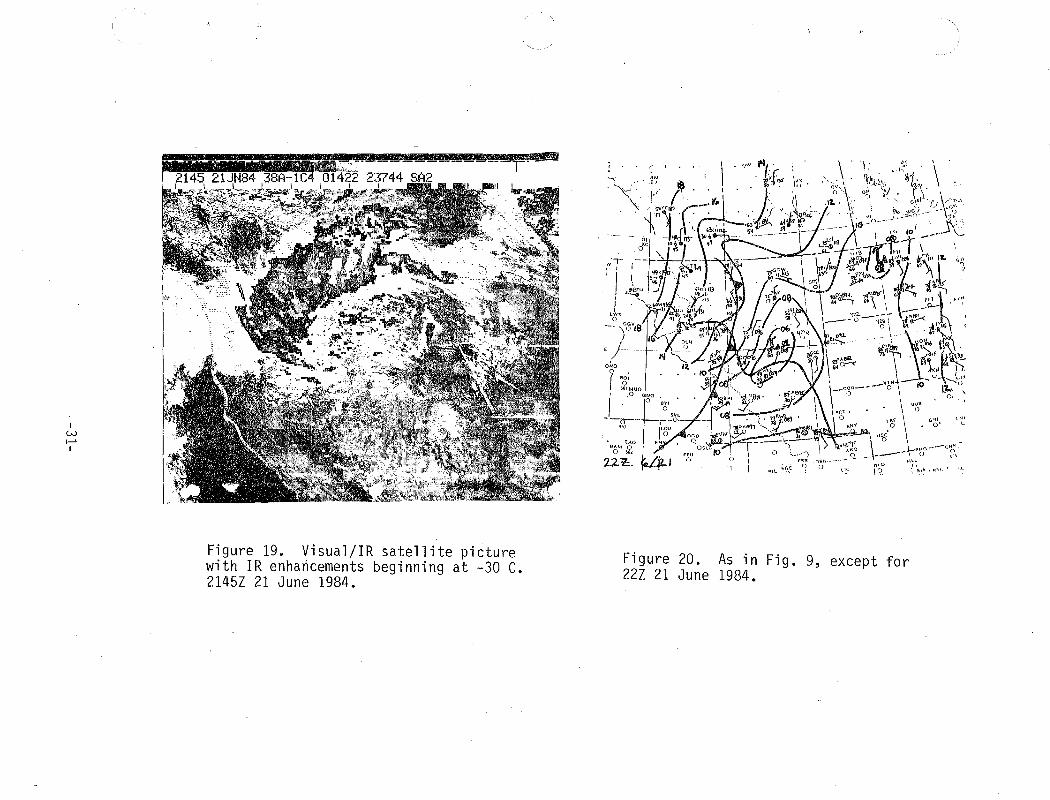
By 20Z (Figure 17), the 1 ow has deepened to under 1006 mb and has moved northeastward to a location just northwest of vJorland. The dew points south of the low continue to drop while those to the north remain fairly steady. A strong moisture discontinuity has formed along the Big Horn Mountains. The surface map for 21Z (Figure 18) shows a strong circulation center located just southwest of Sheridan. However, at this time northerly winds are evident at Cody (COD) and Billings (BIL). This may be a significant feature associated with the development of the initial thunderstorms since these northerly winds are moist and originate at lower elevations than the very dry air which has moved near or over the Big Horns (Sheridan is located about 15 miles northeast of the 7000 foot level of the Big Horns vdth an elevation of near 4200 feet). If the dry air over the Wyoming plateau did move north of the Big Horns and above the moist surface air, convectively unstable lapse rates would have been created. Given the location of the surface low, it is probable that the low level winds northwest of Sheri dan had shifted to the northeast prior to 21Z. This would have created a forcing mechanism through which the convective i nstabi 1 ity could manifest itself. Since radar echoes first appeared on the Billings radar at 2l30Z5, it is likely that the storms began to develop near 2lOOZ. Figure 19 shows a close-up of the satellite picture taken at 2145Z. It suggests that the storms did form just to the northeast of the mountains where the proposed forced uplift would have taken place. The dry air aloft may be a possible cause for such strong development of the thunderstorms since they appear to have developed at nearly the same time that the dry line was near the Big Horns with northeasterly surface winds to the north. It is possible that this type of forced uplift of warm, moist low level air plays a major role in the development of MCC-producing thunderstorms in the lee of the mountains. This may be why the mountains and their lees appear to be preferred source regions of MCCs (Maddox, 1980). Additionally, local mountain-valley circulations superimposed on similar larger-scale upslope conditions will enhance convection near or over the mountains.
Figure 20 shows the surface map from 22Z. The low center has deepened further to 1004 mb and has probably moved northeast of the Big Horns near the Montana/Wyoming border to the west of Sheridan. A very distinct cyclonic circulation is evident around the low with surface wind speeds generally around 10 knots. This represents a major change from the morning when there was no organized pressure center and the winds were generally light and variable.
The daytime development of a small surface 1 ow with a well-defined circulation is often observed prior to the development of severe storms such as the MCC (Doswell, 1977). Szoke et al (1984), Maddox et al (1981) and Doswell (1980) document additional cases which show a similar small surface low and an associated region of surface cyclonic vorticity which develops in a High Plains upper level ridge situation prior to severe thunderstorm or MCC development.
5 Western Region Technical Attachment 84-23.
-29-
I w 0 l
--\.:
""" 0 - SK.E--
0
'Q,oz I '»··
Figure 17. 20Z 21 June
As in 1984.
Fig. 9~
\g: .. '; ..
except for
RM
'
i
~l.t'
IB
FFU 0
Figure 18. 21Z 21 June
As in 1984.
Fig·
.\
~~ .'.,_, ..
··" p,~'
ncO
9, except for
I w I-' I
Figure 19. Visual/IR satellite picture with IR enhancements beginning at -30 C. 2145Z 21 June 1984.
,_
Figure 20. As in Fig. 9, except for 22Z 21 June 1984.
Ull L

If the development of the surface 1 ow is an important feature and influence on severe weather, then reasons for its development are important. One obvious explanation - in this case - would be the therm~l inducement caused by the strong warming of the dry air over the Wyoming plateau. Previous studies by Whiting and Bailey (1957), Tegtmeier (1974) and Moller (1980) have found relationships between tornadic storms and subsynoptic low pressure systems; these subsynoptic systems were associated with regions of significant warm advection. Recently, Kaplan, et al (1984) indicated that the subsynoptic low pressure system is also enhanced by strong heating in the planetary boundary layer. Their modelling study also showed that strong sensible (or solar) heating acted to enhance divergence in the mid-to-upper levels, which would also enhance the pre-convective environment. These findings are also consistent with the Petterssen Development Equation which indicates that one would expect surface cyclonic development with upper level PVA, warm advection, sensible heating and subsidence. With very weak vorticity advection over the region of the subsynoptic surface low development, it seems likely that the thermal advection and sensible heating played an important role in the development of this feature.
Additional development may have occurred in this case due to the stratus deck located in northern Montana during the morning hours of the 21st (seen on the 1315Z satellite picture, Figure 5). The resultant differential diabatic heating may have helped create a thermally induced low-level pressure gradient across central Montana, resulting in intensified easterly winds across the state (Bluestein, 1982).6 As the winds reached the mountains, they slowed down due to increased friction. This created an imbalance between the pressure gradient force and the coriolis force, causing the winds to shift out of the north. This, in turn, pulls more 11 cold 11 air (and thus, higher pressure) southward east of the mountains, further intensifying the circulation around the low. This process is referred to as 11 Cold air damming 11 (Bosart and Lin, 1984).
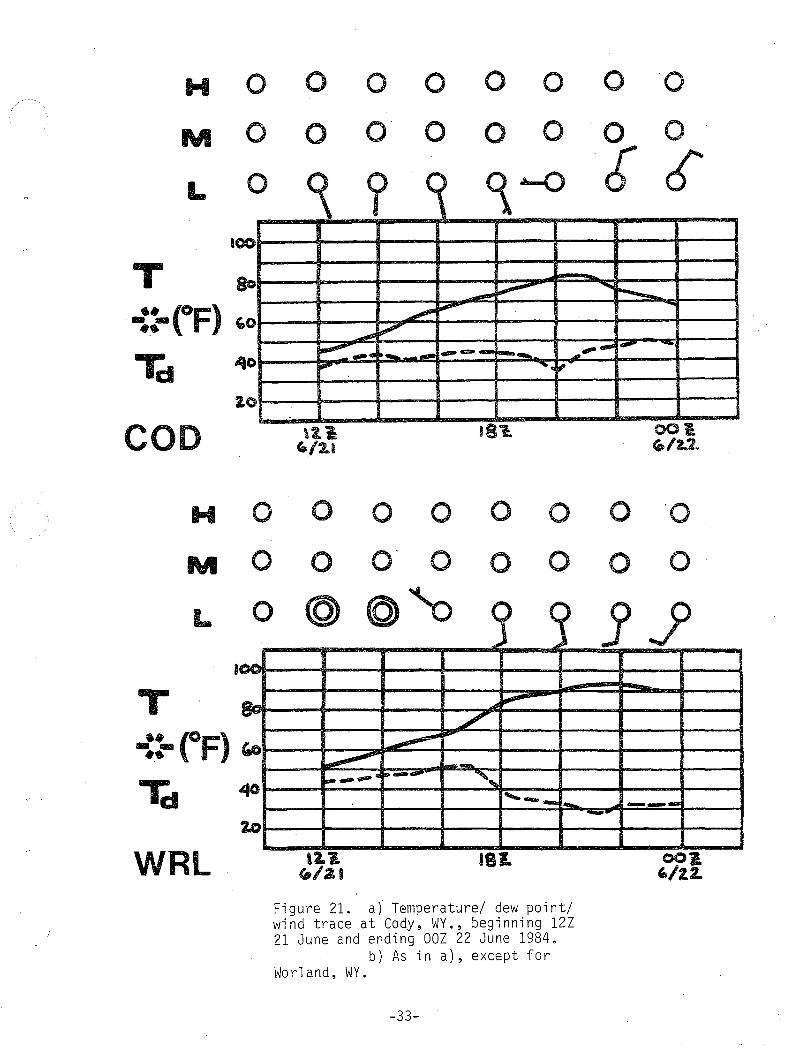
Figures 2la and b (the temperature, dew point and wind traces from 12Z the 21st to OOZ the 22nd at Cody and Worland, respectively), show that cold air did move down the east side of the mountains. While the winds were out of the south, the temperatures rose and the dew points dropped at both locations. By 21Z, the wind at Cody shifted out of the north, raising the dew point 10 degrees in one hour and keeping the temperature at 820F. By OOZ, the temperature had dropped from 820F to 680F at Cody while the Worland temperature was still at gooF under southerly winds. This temperature drop and wind shift at Cody occurred prior to the passage of the synoptic sea 1 e front and was due to the ci rcul ati on around the subsyno pti c 1 ow center. If, as hypothesized, cold air damming did enhance the northerly flow of cold air around the subsynoptic low, it likely also acted to enhance the low-level baroclinicity. This, in turn, intensifies the mesoscale dynamics associated with this subsynoptic system. It is not to say that cold air damming was the primary cause of the subsynoptic low, only that it probably enhanced the dynamics associated with it.
6 The potential for cold air damming increased during the morning hours. This is evident in the GGW minus SHR pressure differential change -from +1.3mb to +4.4 mb at 16Z, representing an overall increase in easterly flow over much of Montana.
-32-
T
H 0
M 0
L 0
aoo
8o
~!-{oF) '0
0
0
cs
0 0
o· o
? q '
~ ',ttlll"""
....,., v
0
0
o o ·o 0 0 0
~"'-() 66
--- ,.,.- "'liiii ......._ .....
- -1d .qo ~- .. !"OII!Io ·- ---- r--- _,.-
COD
H
M
II""'
2.0
0 0 0 0
o o o· o 0
0
'• ~·
0
0
o ·o 0 0
L 0 0 Q (0) (9) ~ l ~ JY
a ... -~
0
2.0
WRL
'""' ~
/ ~ ~
~ --____ .. !"'-- ', , __ -
Figure 21. a) Temperature/ dew point/ wind trace at Cody, WY., beginning 12Z 21 June and ending OOZ 22 June 1984.
b) As in a), except for Worland, WY.
-33-
---_,

The development of this surface feature may have also had a strong influence on severe weather formation due to the moisture convergence which it created. The surface moisture convergence mesoanalysis for 22Z is shown in Figure 22. The largest values are located just east of the surface low with most of southeastern Montana showing moderately strong surface moisture convergence. This low level moisture influx supports the potential for MCC development.
Additionally, the static stability was very weak as shown by the 22Z derived lifted indices? in Figure 23. Most of the indices in southeastern Montana are less than -7 with even greater static instability in western South Dakota. There was very 1 i ttl e difference between the 22Z and 19Z indices. Maddox (1985) suggests that lifted indices of -4 indicate a pretty good chance for thunderstorm development while indices of -10 represent a significant threat. The indices of less than -7 would represent excellent initial conditions for thunderstorm development in southeastern Montana, especially when other localized forcings (such as topographical uplift) are present.
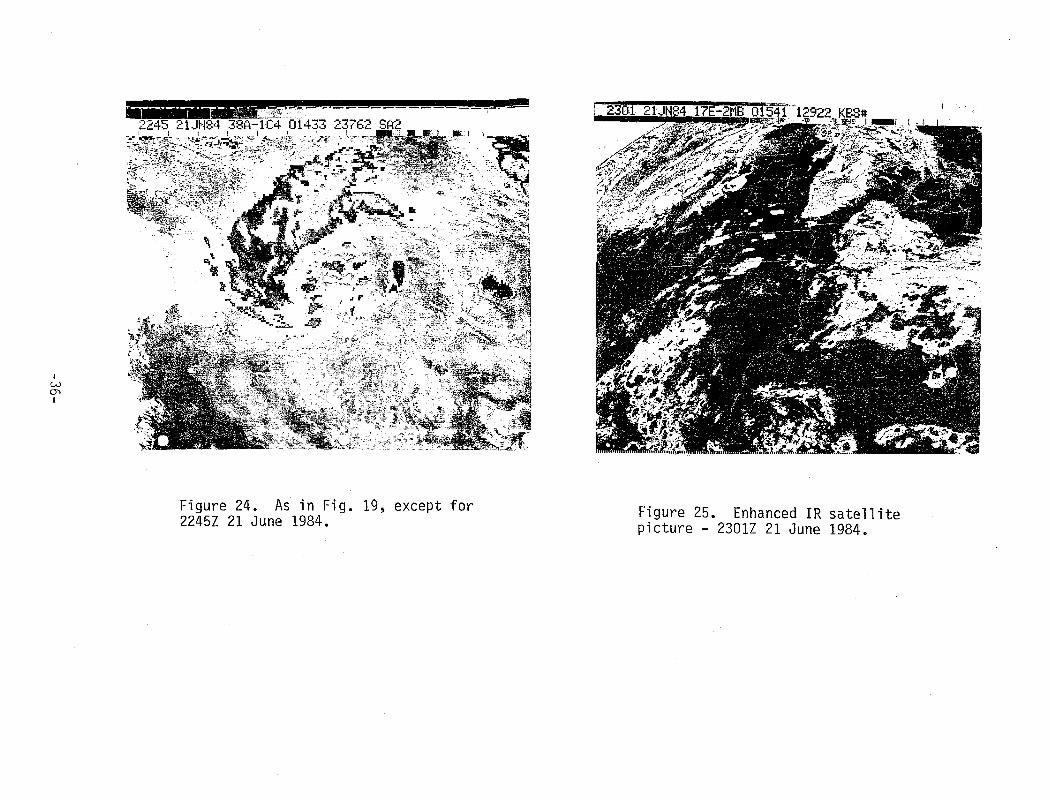
By 2245Z, the individual thunderstorm tops have overlapped as seen on the satellite photo in Figure 24. It appears that the storms themselves have not quite joined together at this time. However, just 16 minutes later, the enhanced IR satellite picture (Figure 25) shows that the cloud shield has increased in size and become more uniformly circular. It is also interesting to note the nyu notch near the south end of the cloud mass. McCann (1983) has noted that storms which exhibit a nyn pattern have about a 70% chance of subsequently becoming severe where the average 1 ead time of the onset of the nyu to the first report of severe weather is about 30 minutes. As we have already mentioned, this storm did become severe, with the first report (a tornado) occurring just 9 minutes (see Tab 1 e 1) after the nyu pattern appeared on the satellite photo. The tornado was reported near Decker, Montana which is almost right on the Montana/Wyoming border. It is apparent that the tornado developed approximately under the nyu pattern in the enhanced IR satellite photo; thus, this case supports the relationships. which have been found between severe weather and the nyu pattern.
The 23Z surface map is shown in Figure 26. The 15 knot northwesterly wind at Sheri dan indicates that the surface 1 ow center has moved to the northeast and is located in nearly the same place as the reported severe weather and the IR nyu pattern. The dew point at Sheridan rose 80F during the hour as the wind shifted from the southwest to the northwest, thus putting Sheridan in the path of the moist air which has wrapped around the low. The moisture discontinuity is still very evident between Worland and Sheridan but is not evident in the vicinity of the low (as there are no observations in the critical places). If the dry air did move aloft as it passed over the Big Horns, it would have been lost on the surface observations. Besides this, the convection and precipitation would probably have
7 These lifted indices are derived using the 12Z upper air observations in association with the hourly surface observations. In cases such as this, where mid-level thermal change is minimal, the analysis would be fairly accurate.
-34-

Figure 22. Mesoanalysis of surface moisture convergence field at 22Z 21 June 1984. Convergence shaded. Heavy shading indicates values greater than 20 x 10-8 g/kg-sec.
Figure 23. Derived lifted indices using 22Z surface data.
-35-
I w CJ)
I
J,I!EII~. . ' .~·· '
~-·~- ;~:J·:·,
·- ·~~~~~~
Figure 24. As in Fig. 19~ except for 2245Z 21 June 1984. Figure 25. Enhanced IR satellite
picture - 2301Z 21 June 1984.

I w '-J I
RV • (!•
, )
'"
,.~~;r
K i LWS
ALW Q GGV -o-.\0 MEH ) 0 I
--aije~-) ---
ONo
9 801
I 6~ ~wo 1 0 GNG "60 I .
---u-'"
WMc "Q • EKO
GLO
\~5
Figure 26. As in Fig. 9, except for 23Z 21 June 1984.
'LL .o •"''
c.\..N 0
0,
,,c ,, "'
~·- ...i:<' ~:·_ o -· 0 •• - -- .. 0 ->- 1l .~.~ .. ' ~::~'i~~ r ~ .-.-.11- -..11 111..-...11 --- .1-A --.11-.1 -.1-'
Figure 27. Water vapor satellite image - 2315Z 21 June 1984.

eliminated any trace of the dry air at the 1 evel which it had existed. Thus, while the dry air may well have been an important feature with regard to the in.itial development of the thunderstorms, it is not a feature that one would expect to find within the MCC atmosphere.
Figure 27 shows the satellite water vapor imagery from 2315Z. The developing MCC stands out very clearly due to the large amount of middle and high level moisture associated with the system. Another interesting feature is the moisture discontinuity associated with the synoptic scale front which is 1 ocated through northwest Utah, southeast Idaho and westcentra 1 Montana. It is quite apparent that this front is not associated directly with the MCC or the small surface low which we've been following.
The 2345Z satellite photo (Figure 28) shows continued development of the MCC. Three more tornadoes were reported at 2335Z near Birney, MT which is located on the upstream (southwest) side of the MCC. It' is important to mention here that when viewing satellite IR and enhanced IR imagery during a highly convective time period, the downwind side of the cold cloud tops is often just cirrus "blowoff" with few clouds beneath the cirrus overcast. With respect to MCCs, this generally is true only when the system is still new and growing- when the convective elements associated with the thunderstorms are still strong. An example of this may be seen when comparing the Miles City (MLS) observation at OOZ the 22nd (Figure 29) with the 2345Z satellite photo (Figure 28). Miles City was reporting broken cloud cover at 30,000 feet while theIR photo showed cloud top temperatures less than -sooc overhead. The importance of this is evident. During the embryonic stage of the MCC, not all locations beneath the cold cloud tops are experiencing rain. The rain at this time is generally confined to the upstream locations and is more intense than at 1 ater stages of the MCC. This observation indicates that the enhanced IR photos may be deceiving, especially during the developmental stage of the MCC.
The surface map for OOZ on the 22nd shows that the surface low has moved slowly toward the northeast and is still probably very near the 1 ocati on of the severe weather. Moist flow from the east and the north can be seen entering the MCC system at low levels. The visible satellite picture from 0015Z (Figure 30) shows numerous overshooting tops which are probably associated with the severe weather near the south end of the MCC. The eastern half of the cloud mass shows a relatively thin, flattopped cirrus cloud cover, though a new convective element appears to be developing north of·Miles City. This is supported by the 0045Z IR photo (Figure 31) which shows cloud top temperatures reaching -550C in the northeast portion of the storm. Elsewhere, the coldest tops are in the western half of the developing MCC in the regions of relatively strong convection. Cloud top temperatures reach -650C at the coldest point.
Lack of surface observations near the center of the low at OlZ (Figure 32) make it difficult to pinpoint the exact location. However, it is apparent from the isobaric pattern that the low has translated mainly eastward from its location at OOZ and is probably near Broadus (4BQ). The final tornado report came in at 0118Z, located 32 miles north-northwest from Broadus. The 0115Z visible satellite photo (Figure 33) shows a large overshooting top in the southern portion of the MCC- very near the location
-38-

I w <..D I
/'/
Figure 28 •. As in Fig. 19, except for 2345Z 21 June 1984.
Figure 29. As in Fig. 9, except for OOZ 22 June 1984.
1!'.4
<0 fl't\ "'!( 0 .
.,\.N 0

I ..j::o.
0 I
Figure 30. Visual satellite picture -0015Z 22 June 1984. Figure 31. As in Fig. 19, except for
0045Z 22 June 1984.

I .f::O. ~~
I
. , 'I
I i
LWS
000
~· ..
·y~
S?lMoc l
l iHI I 0
'" . I .
I ,0 {H.JG
()
-~n---~-S0t I IILCU ' 0
BAM Ebo / EQV 0 sal
"' %:t.i! ~~.z~ D},..l..
I '
v.
Figure 32. 01Z 22 June
~'~ f ~ .. , •, I
.'!
.\ . '\'
?"· \ (.)\.tO otl . .,
nEN----
0 LIC 0 \
o,\" ,E,o;
" ' - ,· \ I' j~ :
~J,Jt
Gc;. lt~~ '\, '
FRI ·.,.; ,·. E.IS. p~\.. • <c.,_il :.~~ .·· ( l
As in 1984.
Fig. 9, except for Figure 33. Visual 0115Z 22 June
satellite 1984.
picture -

of the reported tornado. It is interesting 'to note the thunderstorm report for past weather at Miles City at OlZ. This suggests the passage of a developing convective element - probably the one which was noted on the 0045Z IR satellite photo. The 0115Z satellite photo also shows that the synoptic front has nearly reached the left edge of the MCC. It is uncertain what interactions there were between these two systems.
By 02Z (Figure 34), all of the severe weather was over. The final report consisted of large hail 20 miles north of Broadus at 0151Z. The 02Z surface map shows that the 1 ow has moved further east and now is located near the MT/WY/SD border. The central pressure has increased to 1006 mb. The 03Z surface map continues to show this position as the central pressure fills to near 1007mb. At this time the satellite picture (Figure 35) shows that the MCC is continuing to move to the northeast, now removed from the location of the low pressure center. This photo also shows that a smaller MCC had also developed near another small mesolow along a stationary frontal boundary in northern Kansas.
From this time on, the mature Montana MCC tracked across . northeast Montana and western North Dakota during the morning hours. Figure 36 shows the 06Z satellite photo with widespread convection across much of the center part of the cloud mass. At llZ and 12Z the thunderstorms were still being reported at Minot (MOT) and Bismark (BIS) in North Dakota.
III. Differences Between 20 June 84 and 21 June 84
After a detailed study of the case of 21 June 1984, it is not difficult to understand that the setting was right for thunderstorm and MCC development. There were a number of i ndi cations that waul d have clued the forecasters in to the possibility of MCC development:
1) June and July are the favored months for MCC occurrences in Montana, 2) favorable large scale conditions existed, 3) a great deal of moisture was present in low levels, available for
inflow into a storm, 4) static and inertial stability were both weak, 5) there was warm air advection into eastern Montana, and 6) potential existed for differential diabatic heating and cold air
damming to enhance baroclinicity over the plateau
Certainly, convection was expected in eastern Montana on the 21st due to the extremely weak stability of the air mass. A good deal of thunderstorm activity had also occurred during the previous afternoon and evening over much of Montana, Wyoming and the Dakotas (Figure 37). Not only were these thunderstorms less severe, but no MCC formed either. They were apparently partly associated with a weak wave moving through central Canada and extending into the northern states during the afternoon. An alert forecaster, realizing the importance of warm advection as a driving mechanism for an MCC, would have noted the lack of significant change between the advection pattern on the 20th (day 1) andtheti.st (day 2) and concluded that although thunderstorms were expected due to the weak static stability, an MCC was no more likely on day 2 than on day 1.
-42-

I -i'o-> w I
)
'
;_ ~:
'"'
t~·- .•
~r: I K >
LLS ALW r, GGV
-o-.\'-' MEH I 0 ) 8rKE
1 ONO
9 801
I 0 ·, ~fllMI/f) I
0 GNG l ' 0 RYI
0
WMc '0 EKO 58) BAM 0
' 0 5S2 l
Alii I 9 oz r. "(,/zz
. i- \
-) .. \
"-·;,r ~.r:, \
G>_~ ,,.
E_tS, o·
Figure 34. As in Fig. 9, except for 02Z 22 June 1984.
l'l•"f
",Lit
',
s"~"o:::
Figure 35. Enhanced IR satellite picture - 0301Z 22 June 1984.

I .p, .p, I
Figure 36. Enhanced IR satellite picture - 0601Z 22 June 1984.
Figure 37. IR satellite picture-0445Z 21 June 1984.

However, there were two significant differences between the two days. The first major difference was the location of the 500 mb short wave on the two days. At OOZ on the 21st (Figure 4a), the short wave affecting Montana and Wyoming was still located at the base of the trough along the west coast. By OOZ on the 22nd (Figure 4c), the short wave had propagated around the base of the trough and was moving across west-central Montana. Subsidence associated with the right front quadrant of this jet streak was highly evident in the satellite photos on 12Z the 2.lst, where the clear skies allowed for maximum solar heating over the Wyoming Plateau. Additionally, inertial destablization of the atmosphere occurred to the right of the jet streak (see section I-B-3). This would suggest a greater chance for MCC development on day 2.
The other major difference is evident by comparing the surface maps from OOZ on the 21st (Figure 38) and OOZ on the 22nd (Figure 29). While a subsynoptic surface low center is evident in each case, some important differences can be seen. 1) The low on day 2 has a much more organized cyclonic circulation about its center than the low on day 1. 2) In association with the organized circulation. the dry air push from the southwest is very close to the low center on day 2 while on day 1, the push of dry air isn't near the center of the low. Since the development of this organized circulation center and the push of dry air over the Big Horns appears to have been a major influence on the intense convection that took place on day 2, the lack of a similar organization on day 1 may have influenced the non-severity of the thunderstorms on that day.B Note, however, that thunderstorms did form in association with this subsynoptic low on day 1, a consistent result to those discussed in the previous section. 3) Subjective analysis of surface moisture convergence at OOZ on the 21st (day l) suggests that the strongest values would be along the inverted trough to the north (where the thunderstorms were occurring) and not around the 1 ow center. 4) Little or no cold air damming occurred on day 1. Perhaps as a result,
·the baroclinicity around the subsynoptic low was considerably weaker on that day.
It is probable that the stronger cyclonic vorticity, the larger moisture convergence values, the 1 ocation of the dry air, the i ntensi fi ed barocl i ni city, and the topographical effects all contributed to some extent to make the convection on the 2nd day more intense than that on the 1st. The development of these convective storms into an MCC on day 2 and not on day 1 was supported by the location of the jet streak. its associated region of weakened inertial stability, and probably by the intensification of the low-level warm advection field around the subsynoptic low.
IV. MCC Forecasting Checklist
Following are a number of items which may be used as a guide for forecasting the occurrance of.an MCC:
8 Admittedly, this is a very subjective observation and statement. The primary purpose for its inclusion in this paper is to have the readers look over the synoptic situation from each day to get a feel for the differences between the two cases.
-45-

Figure 38. As in Fig. 9, except for OOZ 21 June 1984.
-46-

1. Is this a month during which severe convective weather and MCCs may occur in your forecasting area? Make it a routine to check for possible MCC development during this period of time.
2. Is the large scale situation conducive to potential MCC develop ment, with a trough to the west and a ridge nearby or to the east? Note that MCCs have formed just to the east of the ridge axis, though this is not common.
3. Is a weak short wave trough approaching to the northwest side of the region?
4. Is the region under anticyclonic shear?
5. Is there a large area of weak static stability in the air mass ahead of the short wave?
6. Is there a pronounced low level flow of warm, moist air into the region to support MCC development?
7. Does potential exist for the development of a subsynoptic surface low associated with warm air advection and strong solar heating?
8. Are there topographical features or weak stationary frontal boundaries which may be utilized to focus convective development? These areas should be monitored using satellite photos, if possible, to determine initial thunderstorm development on a near-real time basis.
9. Is cold air damming possible?
10. Is there a mechanism for low-level warm advection?
11. Specific parameters to consider:
a. surface dewpoints )6QOF b. K index )29 c. 1 i fted index <.-4 d. total totals index )50 e. positive area index )1.0
Please note that most of the items in the above checklist are oriented toward subjective analysis of the data presented. As the forecasters gain experience with these general rules, they should try to determine numerical values for some of the aforementioned items for use as local 11 rules of thumb". In such a way, the local MCC forecasting guidelines should become more objective and straightforward.
Acknowledgements
I wish to thank Larry Dunn for his work in obtaining the data and for his analysis of the case study. Thanks also to Robert Maddox, Lance Bosart, Glenn Rasch, Ken Mielke and Russ Schnieder for their helpful input.
-47-

References
Bluestein, H.B., 1982: A wintertime mesoscale· cold front in the Southern Plains. Bull. Amer. Meteor. Soc., 63, 178-185.
Bonner, W.D., 1968: Climatology of th~ low level jet. Mon. Wea. Rev., 96, 833-850.
Bosart, L.F. and S.C. Lin, 1984: A diagnostic analysis of the President's Day Storm of February 1979. Mon. Wea. Rev., 112, 2148-2177.
Bosart, L.F. and F. Sanders, 1981: The Johnstown Flood of July 1977: A long-lived convective system. J. Atmos. Sci., 38, 1616-1642.
Doswell, C.A., 1977: Obtaining meteorologically significant surface divergent fields through the filtering property of objective analysis. Mon. Wea. Rev., 105, 885-892.
-----, 1980: Synoptic-scale environments associated with High Plains severe thunderstorms. Bull. Amer. Meteor. Soc., 61, 1388-1400.
Eliassen, A., 1951: Slow thermally or frictionally controlled meridional circulations in a circular vortex. Astrophy. Norv., 5, 19-60.
Fritsch, J.M. and R.A. Maddox, 1981: Convectively driven mesoscale weather systems aloft. Part I: Observations. J. Appl. Meteor., 20, 9-19.
-----, -----, L.R. Hoxit and C.F. Chappell, 1979: Convectively driven mesoscale pressure systems. Pre rints, Fourth Conference on Numerical Weather Prediction Silver S rin , AMS, Boston, pp.398-406.
Gray, W.M. and J.L. McBride, 1978: Influences of cloud and cloud-free radiational differences on tropical disturbance maintenance and diurnal modulation. Preprints, Third Conference on Atmospheric Radiation (Davis), AMS, Boston, pp. 272-275.
Haltiner, G.J. and F.L. Martin, 1957: Dynamical and physical meteorology. McGraw-Hill Publishers, New York, 454 pp.
Holle, R.L., A.I. Watson,J.R. DaughertyandR.E. Lopez,1985: Cloud-to-ground lightning in the mesoscale convective system on Mby 20-21, 1979 during SESAME. Preprints, Fourteenth Conference on Severe'Storms (Indianapolis), AMS, Boston.
Johnston, E.C., 1982: Mesoscale vorticity centers induced by mesoscale convective complexes. Preprints, Ninth conference on Weather Forecas~ ing and Analysis, AMS, Boston, pp. 196-200.
Kaplan, M.L., J.W. Zack, V.C. Wong and G.D. Coats, 1984: The interactive role of subsynoptic scale jet streak and planetary boundary layer processes in organizing an isolated convective complex. Mon. Wea. Rev., 112, 2212-2238.
-48-

Klitsch, M.A. and T.H. Vander Haar, 1982: Compositing digital satellite data to detect regions of orographically induced convection on the northern High Plains. Atmospheric Scince Paper No. 351, Colorado State University, Ft. Collins, 87 pp.
Leblanc, R.E., 1974: Hydrodynamic stability: A case study in isentropic coordinates. M.S. Thesis, University of Wisconsin, Madison.
Maddox, R.A., 1980: Mesoscale Convective Complexes. Bull. Amer. Meteor. Soc., 61, 1374-1387.
-----,1983: Large-scalemeteorological conditionsassociatedwithmidlatitude, mesoscale convective complexes. Mon. Wea. Rev., 111, 1475-i493.
-----, 1985: Personal Communication., NOAA, ERL, Boulder.
-----and C.A. Doswell, 1982: An examination of jet stream configurations, 500mb vorticity advection and low-level thermal advection patterns during extended periods of intense convection. Mon. Wea. Rev., 110, 184-197.
----- and D.W. Reynolds, 1976: A satellite climatology of convective clouds and cloud systems over eastern Montana and Wyoming. Department of Atmospheric sciences, Colorado State University, Ft. Collins, 21 pp.
-----, D.M. Rodgers, W. Deitrich and D.L. Bartels, 1981: Meteorological settings associated with significant convective storms in Colorado. NOAA Tech. Memo. ERL OWRM-4, 75 pp.
McCann, D.W., 1983: The enhanced-V, a satellite observable severe storm signature. Mon. Wea. Rev., 111, 887-894.
Merritt, J.H. and J.M. Fritsch, 1984: On the movement of the heavy precipitation areas of mid-latitude mesoscale convective complexes. Pre rints, Tenth Conference on Weather Forecastin and Anal sis Clearwater Beach , AMS, Boston, pp.529-536.
Mielke, K.M., 1979: A computer program for convective parameters. Nat•l Wea. Dig., 4, No. 3, 10-18.
Moller, A.R., 1980: Mesoscale surface analysis of the 10 April 1979 tornadoes in Texas and Oklahoma. Preprints, Eighth Conference on Weather Forecasting and Analysis (Denver), AMS, Boston, pp.36-43.
Reynolds, D.W. and T.H. Vander Haar, 1979: Satellite support to HIPLEX: Summary of results 1976-1978. Final Report, Bureau of Reclamation Contract #6-07-DR-20020, 89 pp. (Available f~om Dept. of Atmospheric Science, Colorado State University, Ft. Collins).
Rodgers, D.M., M.J. Magnano and J.H. Arns, 1985: Mesoscale convective complexes bver the United States in 1983. Mon. Wea. Rev., 113, 888-901.
Schneider, R., 1985: Personal Communication. University of Wisconsin, Madison.
-49-

Szoke, E.J., M.L. Weisman, J.M. Brown, F. Caracena and T.W. Schlatter, 1984: A subsynoptic analysis of the Denver tornadoes of 3 June 1981. Mon. Wea. Rev., 112, 790-808.
Tegtmeier, S.A., 1974: The role of the surface, subsynoptic, low pressure system in severe weather forecasting. M.S. Thesis, Dept. Meteor., University of Oklahoma, Norman, 66.pp.
Wallace, J.M., 1975: Diu'rnal variations in precipitation and thunderstorm frequency over the coterminous United States. Mon. Wea. Rev., 103, 406-419.
Western Region Technical Attatchment 84-23, 1984: Mesoscale Convective Complex - Montana Style. NWS/Scientific Services Division, Western Region H~adquarters, Salt Lake City, 5 pp.
Whiting, R.M. and R.E. Bailey, 1957: Some meteorological relationships in the prediction of tornadoes. Mon. Wea. Rev., 85, 141-150.

NOAA Technical Memoranda NWS WR: (Continued)
121 Cl inwtological Prediction of Cumulonimbus Clouds in the V'cinity of the Yucca Flat Weather Station. R. F. Quiring, June 1977. (PB-271-704/AS) 122 A 1·1ethoo for Transforming Temperature Distribution to Normality. Morris S. Webb, Jr., June 1977. (PB-271-742/AS) 124 Statistical Guidance for Prediction of Eastern Nm·th Pacific Tropical Cyc:lone Motion - Part I. Charles J. l~eumann and Preston W. Left~<ich, August 1977.
(PB-272-661) 125 Statistical Guidance on the Prediction of Eastern North Pacific Tropical Cyclone Motion - Part II. Preston W. Leftwich and Charles J. Neumann, August
1977. (PB-273-155/AS) . 127 Development of a Probability Equation for WintercType Precipitation Pattr!rns in Great Falls, Montana. Kenneth B. Mielke, February 1978.(PB-281-387/AS) 128 Hand Calculator Program to Compute Parcel Thermal Dynamics. Dan Gudgel, April lg78. (PB-283-080/AS) 129 Fire Whirls. David W. Goens, May 1978. (PB-283-866/AS) 130 Flash-Flood Procedure. Ralph C. Hatch and Gerald Wi 11 i ams, May 1g78. ( PB-286-014/AS) 131 Automated Fire-Weather Forecasts. Mark A. Mollner and David E. Olsen, September 1978. (PB-289-916/AS) !32 Estimates bf the Effects of Terrain Blocking on the Los Angeles WSR-74C Weather. Radar. R. G. Pappas, R. Y. Lee, B. W. Finke, October 1978. (PB289767/AS) 133 Spectral Techniques in Ocean Wave Forecasting. John A. Jannuzzi, October 1978. (PB2913!7/AS) 134 Solar Radiation. John A. Jannuzzi, November 1978. (PB291195/AS) 135 Application of a Spectrum Analyzer in Forecasting Ocean Swell in Southern Calif01·nia Coastal Waters. Lawrence P. Kierulff, January 1979. (PB292716/AS) !36 Basic Hydrologic Principles. Thomas L. Dietrich, January 1979. (PB292247/AS) 137 LFM 24-Hour Prediction of Eastern .Pacific Cyclones Refined by Satellite Images. John R. Zimmerman and Charles P. Ruscha, Jr., Jan. 1979. (PB294324/AS) 138 A Simple Analysis/Diagnosis System for Real Time Evaluation of Vertical Motion. Scott Heflick and James R. Fors, February 1979. (PB294216/AS) 139 Aids for Forecasting Minimum Temperature in the Wenatchee Frost District. Robert S. Robinson, April 1979. (PB298339/AS) 140 Influence of Cloudiness on Summertime Temperatures in the Eastern Washington Fire Weather District. James Hal comb, Apri 1 J97g. (PB298674/AS) 141 Comparison of LFM and MFM Precipitation Guidance for Nevada During Doreen. Christopher Hill, April 1979. (PB29B6!3/AS) 142 The Usefulness of Data from Mountaintop Fire Lookout Stations in Determining Atmospheric Stability. Jonathan W. Corey, April 1979. (PB298899/AS) 143 The Jepth of the Marine Layer at San Diego as Related to Subsequent Cool Season Precipitation Episodes in Arizona. Ira S. Brenner, May 1979.
(PB298817/AS) !44 Arizona Cool Season Climatological Surface Wind and Pressure Gradient Study. Ira S. Brenner, May !979. (PB298900/AS) 145 On the Use of Solar Radiation and Temperature Models to Estimate the Snap Bean Maturity Date in the Willamette Valley. Earl M. Bates, August 1979.
( PB80 -160971) 146 The BART Experiment. Morris s. Webb, October 1979. (PB80-155112) 147 Occurrence and Distribution of Flash Floods in the Western Region. Thomas L. Dietrich, December 1979. (PBB0-160344) 149 ~11sinterpretations at Precipitatiun Probai.J"ilHy rurecust$ . .'\ll.J.r: !!. Mu~;.-hy, ~i'lrah Lichtenstein, narucl1 Fischhoff~ and Robert L. Winkler, February
1980. (PBS0-174576) 150 Annual Data and Verification Tabulation- Eastern and Central North Pacific Tropical Storms and Hurricanes 1979. Emil B. Gunther and Staff, EPHC,
April !980. (PB80-220486) · 151 NMC Model Performance in the Northeast Pacific. James E. Overland, PMEL-ERL, April 19AO. (PBR0-196033) !52 Climate of Salt Lake City, Utah. Wilbur E. Figgins, October 1984. 2nd Revision. (PB85 123875) 153 An Automatic Lightning Detection System in Northern California. James· E. Rea ahd Chris E. Fontana, June 1980. (PB80-225S92) 154 Regression Equation for the Peak Wind Gust 6 to 12 Hours in Advance at Great Falls During Strong Downslope Wind Storms. Michael J. Oard, July 1980.
(PB8!-!0B367) 155 A Raininess Index for the Arizona Monsoon. John H. TenHarkel, July 1980. (PBBI-1064g4) !56 The Effects of Terrain Distribution on Summer Thunderstorm Actjvity at Reno, Nevada. Christopher Dean llill, July 1980. (PB81-10250!) 157 An Operational Evaluation of the Scofield/Oliver Technique for Estimating Precipitation Rates from Satellite Imagery. Richard Ochoa, August 1980.
(PB61-.\08227) 158 Hydrology Practicum. Thomas Dietrich, September 1980. (PB8!-134033) 159 Tropical Cyclone Effects on California. Arnold Court, October 1980. (PBSI-133779) 160 Eastern North Pacific Tropical Cycl'one Occurrences During Intraseasonal Periods. Preston W. Leftwich and Gail M. Brown, February 1981. (PB8!-205494) 161 Solar Radiation as a Sole Source of Energy for Photovoltaics in Las Vegas, Nevada, for July and December. Darryl Randerson, April !981. (PB8!-224503) 1A? A S.vstems Approach to Rcul-Time Runoff Analysis with a Deterministic Rainfall-Runoff Model. Robert J. C. 8urna~h and R. Lin·ry rf'rr;1l, /\pril 19f'H.
I '''''' 1- ?~4~91) 16:.\ 1\ r.r·11111arison of T1·1o Methods for Foteca.sting Thunderstorms at Luke Air force 13a<;e, 1\rizonr.~. Lt. Colonel Keith R. Co0lcy, April 1981. (rBP.l-2?.!5393) !64 Ao ubjective Aid for Forecasting Afternoon Relative Humidity Along the Washington Cascade East Slopes. RobertS. Robinson, April 1981. (mnl-2:\ll)B) 1~S Annual Data and Verification Tabulation, Eastern North Pacific Tropi ca 1 Storms and Hurricanes 1980. Emil [L Gunt.her and Staff, May J 981. ( P8R2-2303~6) !66 Preliminary Estimates of Wind Power Potential at the Nevada Test Site. Howard G. Booth, June 1981. (PB82-127036) 167 AI\AP User's Guide. Mark Mathewson, July 1981. (revised September !98!). (PBRZ-196783) 168 Forecasting the Onset of Coastal Gales Off Washington-Oregon. John R. Zimmerman and William D. Burton, AugusL 198.1. (PB82-127051) 169 1\ Stat'istical-Dynamical·Model for Prediction of Tropical Cyclone Motion in the Eastern North Pacific Ocean. Preston W. Leftwictl, Jr., October 1981. 170 1\n Cnhanced Plotter for Surface Airways Ob:;ervations. Andrew ,l. Spry and ,l('ffrc:y L. Anderson, October 1981. (PRR2-153R83) 171 Verification of 72-Hour 500-mb Map-Type Predictions. R. F. Quiring, November 1981. (PIJP.2-1580q8) !72 Forecasting Heavy Snow at Wenatchee, Washington. James W. Holcomb, December 1981. (Pll!-12-177783) 173 CC'ntral San Joaquin Valley Type Maps. Thomt~s R. Crossan, OecPmber 1981. (PB8?-1Q6064)
~~~ ~.~~~a·~e~~t~e~~~t~~r~~~~a~io~a~~~~~~~io~e~~n~~~~n 1~l~~ih ~aBc~~i~9 ~?r0o3r\cal Storms and Hul~ricanes 1931. Emil 8. Gunther and :;taff. ~lune 1982.{PR82-252420) 176 Approximations to the Peak Surface Wind Gusts from OP.sert Thunderstorms. Darryl Ranclt.~rson, JuM 1.982. (PB82-253089) 177 Climate of Phoenix, P.rizona. Robert J. SchMidli, April 1~6° (r·evised March 1983). (PB83246801) 178 A11nual Data and Verification Tabulation, Eastern Not"tb Pacific Tropical Storms and Bu-rricatJes 1982. E. B. Guntber, .June 1983. (PB85 106078)
179 Stratified Maxim~ Temperature Relationships Between Sixteen Zone Stations .in Arizona and Respective Key Stations. I-ra s. Brenner, June 1983 • (PBS 3_24 ~_gQ4) 180 Standard Hydrolog~c Exchange Format (SHEF) Version I. Phillip A. Pasteries, Vernon C. Bissel, David G. Bennett, August, 1983. (PB85 106052) 181 Quantitative and Spacial Distribution of Hinter Precipitatic,n Along Utah's Wasatch Front. Lawrence '8. Dunn, August. 1983. (PB85 106912) 182 500 Millibar Sign Frequency Teleconnection Cha"t"tS -Hinter. T~aw"t"ence B. Dunn~ December~ 1983.
183 500 Millibar S~gn Frequency Telecot~nection Charts - Spring. Lawrence B. Dunn, Je.nuary, 1984. (PB85 111367
)
184 Collection and Use of Lightning Strike Data in the Western U.S. During Summer 1983. Clen_n P.asch and Hark Mathewson, February, 1984" C"PB85 11~.:::; 1:)
i~~ ~~1.\~tl~;~:r a~~g~e~~~i~=~~~n T~;~~l~~~~~i~~s~~~~t~o;t~uP:~~ficL~~~~~~~lBSt~~~· a~~r~~r~l~~U.es(P1B9~) .11Jt?9i. Gunther' Harch 1984. (PB85 109635)
187 SOU i·1illibarSign Frequency Teleconnection Charts- Fall. Lawrence B. Dunn~ May 1984, (PB85 110930) 188 The Use and I~terpretation of Isentropic Analyses. Jeffrey L. Anderson, October 1984. (PB85 132694)
~~~0 ~~~~~\~~~\!k~ef+~!~~t~~~w~:~~~at~~~eE~~~~~n a~n~ ~~~~~1~.Trg~0~~\-:tg~~~e~~~r~u6ngg~~s 1m~· E. B. Gunther and R. L. cross, April !985. (PBB5 IB7BB87P>
191 larqe Scale Patterns Associated with t1ajor Freeze Episodes.in the Aaricultural Southwe5t. Ronald S. !::iamtlton and Glenn R. Lussk~vP Decen1ber 1985. 192 NWR Vol'ce Synthesis Project: Phase I. Glen t4. Sampson, January 1936.

NOAA SCIENTIFIC AND TECHNICAL PUBLICATIONS
The National Oceanic and Atmospheric A dministrati01i was established as part of the Department of Commerce on October 3, 1970. The mission responsibilities of NOAA arc to asses<; the socioeconomic impact of natural and technological changes in the environment and to monitor and predict the state of the solid Earth, the oceans and their living resources, the atmosphere, and the space environment of the Earth.
The major components of NOAA regularly produce various types of scientific and technical information in the following kinds of publications:
PROFESSIONAL PAPERS- Important definitive research results, major techniques, and special investigations.
CONTRACT AND GRANT REPORTS- Reports prepared by contractors or grantees under NOAA sponsorship.
ATLAS -Presentation of analyzed data generally in the form of maps showing distribution of rainfalL chemical and physical conditions of oceans and atmosphere, distribution of fishes and marine mammals, ionospheric conditions, etc.
TECHNICAL SERVICE PUBLICATIONS- Reports containing data, observations, instructions, _etc. A partial listing includes data serials; prediction and outlook periodicals; technical manuals, training papers, planning reports. and information serials; and miscellaneous technical publications.
TECHNICAL REPORTS- Journal quality with extensive details, mathematical developments, or data listings.
TECHNICAL MEMORANDUMS -Reports of preliminary, partial, or negative research or technology results, interim instructions, and the like.
Information on availability of NOAA publications can be obtained from:
ENVIRONMENTAL SCIENCE INFORMATION CENTER (D822) ENVIRONMENTAL DATA AND INFORMATION SERVICE
NATIONAL OCEANIC AND ATMOSPHERIC ADMINISTRATION U.S. DEPARTMENT OF COMMERCE
6009 Executive Boulevard Rockville, MD 20852
_,
'"