NOAA Technical Memorandum NWS WR-274 … Technical Memorandum NWS WR-274 Climate of Prescott,...
79
NOAA Technical Memorandum NWS WR-274 Climate of Prescott, Arizona Bob Fogarty, Michael Staudenmaier Jr, 1st Revision by Michael Staudenmaier 1 January 2009 1 National Weather Service Office, Flagstaff Arizona United States National Oceanic and National Weather Services Department of Commerce Atmospheric Administration Dr. John (Jack) Hayes, Assistant Administrator Carlos M. Gutierrez, Secretary VADM C. Lautenbacher for Weather Services Under Secretary
Transcript of NOAA Technical Memorandum NWS WR-274 … Technical Memorandum NWS WR-274 Climate of Prescott,...

NOAA Technical Memorandum NWS WR-274 Climate of Prescott, Arizona Bob Fogarty, Michael Staudenmaier Jr, 1st Revision by Michael Staudenmaier1 January 2009 1 National Weather Service Office, Flagstaff Arizona United States National Oceanic and National Weather Services Department of Commerce Atmospheric Administration Dr. John (Jack) Hayes, Assistant Administrator Carlos M. Gutierrez, Secretary VADM C. Lautenbacher for Weather Services Under Secretary
And is approved for publication by Scientific Services Division
Western Region
Andy Edman, Chief Scientific Services Division
Salt Lake City, UT

CONTENTS
Page I. Climate of Prescott, Arizona ............................................................................................1 Climate Summary ................................................................................................................5 II. Temperature Records
Daily Maximum and Minimum Temperature Extremes......................................................7 Highest and Lowest Average Temperatures by Month .....................................................19 Warmest and Coldest Winter, Spring, Summer, and Fall..................................................22 Highest and Lowest Annual Temperatures........................................................................24 Average Number of Days Per Year with Maximum Temperatures
85, 90, and 95 Degrees or Higher ..........................................................................24 Average Number of Days Per Year with Minimum Temperatures
40, 32, and 10 Degrees or Lower...........................................................................25 Freeze and Growing Season Data ......................................................................................25 Greatest Number of Consecutive Days with Maximum Temperatures
90 degrees or Higher..............................................................................................26 Greatest Number of Consecutive Days with Maximum Temperatures
95 degrees or Higher..............................................................................................26 Greatest Number of Consecutive Days with Maximum Temperatures 100 degrees or Higher ……………………………………………………………27 Greatest Number of Consecutive Days with Minimum Temperatures
10 degrees or Lower...............................................................................................27 III. Precipitation Records
Greatest Daily 24-Hour Precipitation (7 A.M. to 7 A.M.).................................................29 Maximum and Minimum Precipitation by Months ...........................................................32 Wettest and Driest Seasons................................................................................................34 Yearly Precipitation Totals ................................................................................................36 15 Wettest and Driest Precipitation Years .........................................................................37 Greatest Number of Days with 0.01 Inch and 0.10 Inch
or More, with Average Number of Days ...............................................................38 Greatest Number of Days with 0.25 Inch and 0.50 Inch
or More, with Average Number of Days ...............................................................38 Greatest Number of Consecutive Days with 0.01 Inch
and 0.25 Inch or More............................................................................................39 Greatest Number of Consecutive Days with 0.50 Inch
and 0.75 Inch or More............................................................................................40 Greatest Number of Consecutive Days without Measurable Precipitation .......................40 Excessive Storms ...............................................................................................................41 Greatest Daily 24-Hour Snowfall ......................................................................................42 Maximum Monthly Snowfalls ...........................................................................................45

First and Last Snowfalls………………………………………………………………….46 Seasonal Snowfall Totals...................................................................................................47 15 Snowiest and Least Snowy Seasons .............................................................................48 Greatest Number of Days with Snowfall of One Inch or More and Three Inches or More.............................................................................................49 Greatest Number of Days with Snowfall of Six Inches or More.......................................49 Snowiest Calendar Days ....................................................................................................50 Snowiest Consecutive Two Calendar Days .......................................................................50 Excessive Snowstorms.......................................................................................................51 Number of Days with Snowfall of 1 Inch or More............................................................51
IV. Miscellaneous Information
Normal Heating and Cooling Degree Days .......................................................................53 Monsoon Statistics .............................................................................................................54 Normal Daily Maximum, Minimum, and Mean Temperatures.........................................55 Sunrise and Sunset Table ...................................................................................................68
I. NARRATIVE GEOGRAPHICAL AND CLIMATOLOGICAL SUMMARY

1
CLIMATE OF PRESCOTT, ARIZONA
Prescott is located at the foot of
the northern end of the Bradshaw Mountains in central Arizona at 5200 feet elevation. To the south of the city the mountains rise to peaks of 7900 feet; to the north the terrain slopes gently down the valley of Granite Creek to its junction with the Verde River.
Prescott=s elevation of 5200 feet assures a variety of weather including cool winters, warm summers, moderate humidity, and considerable diurnal temperature changes. Only limited farming is carried on because of the relatively short of the growing season. The average date of the last occurrence of 32°F in the spring is May 16 and that of the first 32°F temperature in the fall is October 10. The average precipitation for Prescott is 19.19 inches.
Summers in Prescott have an
average maximum temperature (average maximum for June, July and August) of 86.2°F (the all-time record high is 105°F). On average, only 37 days in the summer have maximum temperatures of 90°F or higher. Summer minimum temperatures are cool and refreshing with low temperatures mainly in the 50s.
The moderate summer heat gives way to a cooler but nonetheless pleasant fall period with average maximum temperatures generally ranging from 80°F down to 50°F by the end of the season and minimum temperatures normally falling below freezing by the middle of October.
Winter weather typically begins by November and becomes well entrenched by December, with increasingly colder weather. By December, minimum temperatures are generally in the low 20s; however afternoon maximum temperatures still average in the 50s, due to the amount of sunshine the station receives.
By mid-April, winter weather usually begins to break, and warm spells become more frequent. Spring in Prescott is typically breezy and dry with little precipitation occurring in May and early June.
There are two distinct periods of precipitation in Prescott. One occurs during the winter months from November through April when the jet stream is located over the state, allowing moist Pacific storm systems to move over the area. The other distinct period is classified as the summer rainy season, or >summer monsoon.= The monsoon rainy period usually occurs during July and August when most of Arizona is subjected to widespread thunderstorm activity. These thunderstorms are extremely variable in intensity and location and occur mainly between the hours of 12 p.m. and 8 p.m.
Since there is no concentration of industry, smoke pollution is almost nonexistent, and the air is remarkably free of contaminants of any kind, although smoke from resident=s fireplaces can accumulate on some of the colder nights due to strong radiational inversions that develop. Smoke from prescribed burning, and more rarely a forest fire, can also be an occasional issue during the spring, early summer and later in the fall.

2
A HISTORY OF WEATHER OBSERVATIONS AT PRESCOTT
The first official weather station
in Prescott was established May 1, 1898. The office was located at 140 South McCormick Street. The first observer was Dr. Warren E. Day.
In May 1908, the station was moved to the Pamsetgaaf Sanitorium, which was one-half mile west southwest of the previous location. The word Pamsetgaaf is an acronym for Pure Air, Maximum Sunshine, Equable Temperature, Good Accommodation, and Food. The station was moved to a slightly lower elevation site in 1924, but remained on the sanitorium grounds.
On December 21, 1937, the weather station was moved to 617 East Willis Street.
During the 1940s the station experienced several moves. The first occurred on June 1, 1940 to 233 North Virginia. Then on July 5, 1944, the location was moved to the Arizona Highway Department about one-half mile southeast of the previous location on North Virginia.
On August 12, 1945, the weather
station moved to the Prescott Fire Hall on Cortez Street where it stayed until 1956. On February 24 of that year the observing location moved to Radio Station KYCA one mile northeast of the Prescott post office.
On January 1, 1970, the weather
station moved to 601 Flora Street. It remained on Flora Street until 1983 when it made one final move on April 25 to the Sun Dog Wastewater Treatment
Plant on Sun Dog Ranch Road. This is where the observations are taken today.
In addition to this station there is
an automated site at Love Field. Observations have been taken there since July 2, 1948. On February 3, 1999 the Automated Surface Observing System (ASOS) was installed and continues to provide 24 hours per day observations.
SOME HIGHLIGHTS OF THE
WEATHER RECORDS IN PRESCOTT
Many unusual weather events
have taken place in Prescott since official weather observations began on May 1, 1898. The following is a brief description of some of the more extreme conditions recorded.
The all-time record high temperature for Prescott of 105°F occurred on July 17, 1925. It occurred during a short heat wave. Four days out of the six day period from the 13th through the 18th had high temperatures of 100°F or greater, and on the 17th Prescott also set a record high low temperature of 70°F.
The all-time record warmest minimum temperature for Prescott was first set on July 15, 2003 when the mercury fell to only 76°F. It was then tied on July 6, 2007 when the same temperature was recorded for the minimum temperature.
The longest consecutive stretch of days with maximum temperatures of 95°F or greater in Prescott was 17 days. This occurred during June 20 - July 6, 1929. The highest temperature reached

3
during this longest stretch of warm weather was 103°F.
The longest consecutive stretch of days with maximum temperatures of 90°F or greater in Prescott was 33 days. This occurred during June 18 - July 20, 1905.
The maximum number of days in a calendar year with temperatures of 95°F or greater was 35 set in 1905. The maximum number of days in a year with temperatures of 90°F or greater was 81 days which was set in 1933
The coldest temperature ever recorded in Prescott was -21°F which was observed on January 22, 1937. Although the temperature warmed 47 degrees that afternoon, the maximum of 26°F was still the record low maximum for the date.
The maximum number of consecutive days with minimum temperatures of 10°F or lower was 12 days. This has happened twice; first from December 15-26, 1928 and again from December 28, 1932-January 8, 1933.
The maximum number of days in a calendar year with temperatures of 10°F or lower was 32 days set in 1933. The maximum number of days in any month with temperatures of 10°F or lower was 23 days set in the extremely cold month of January 1937. The average minimum temperature that month was 3.8°F which was about 20 degrees below normal. Of those 23 days, 14 had low temperatures equal to or below 0°F and included the all time record low temperature.
The most precipitation ever recorded in one calendar year at Prescott was 39.47 inches, set during 1905. The least precipitation recorded in one calendar year at Prescott was 3.41 inches, set in 1907. The average annual precipitation for Prescott is 19.19 inches.
The all-time record for heaviest
precipitation during any calendar day at Prescott was 4.28 inches which was set on November 27, 1919. This day was in the middle of one the wettest periods of Prescott’s weather history during which 5.23 inches fell in a six day period. The entire event ended with an accumulation of 13 inches of snow.
The most precipitation to occur within a continuous stormy period occurred from February 11-19, 1927 when in excess of 10.59 inches fell. The exact total is not known, because on the 13th the record shows there were 5.0 inches of snowfall and 0.00 inches of precipitation. It is possible that the actual total for the nine day period was between 11 and 12 inches.
Because of this excessive
precipitation event, February 1927 was the wettest month on record, with 10.59 inches of precipitation falling during the month.
The average yearly snowfall in Prescott is 20.4", but is extremely variable from year to year. The most snowfall ever recorded during the snow season (July - June) was 97.4 inches in 1931-32. On the other extreme, several seasons have recorded no snowfall, the most recent in 1913-14.

4
The snowiest day in Prescott’s weather history was January 11, 1930 when 21.8" fell. This was in the middle of the most snowfall to occur within a continuous stormy period. From January 10-13, 1930 there was 39.5" of snow measured.
January 1949 was the snowiest
month with 53.0” recorded. The greatest number of
consecutive days without measurable precipitation was recorded from September 25, 1999 – January 1, 2000, a
total of 99 days! The greatest number of consecutive days with measurable precipitation was 13 set during the period of July 6-18, 1953, when a total of 5.42" of precipitation fell.
The greatest number of
consecutive days with measurable snowfall was 6 days set three times, most recently from February 11-16, 1978. Interestingly, there were only 6.0" of snow during this period. The other two six day periods are on the list of excessive snow storms.

5
CLIMATE SUMMARY
TEMPERATURE* RECORD NORMAL1 NORMAL1 NORMAL1 RECORD
MONTH MAX MAX AVG MIN MIN JANUARY 73 50.9 37.1 23.3 -21
FEBRUARY 77 54.2 39.9 25.6 -12 MARCH 81 57.9 43.8 29.7 2
APRIL 87 65.2 50.2 35.2 11 MAY 97 73.8 58.3 42.8 20 JUNE 103 84.6 67.9 51.2 25 JULY 105 88.3 73.4 58.5 34
AUGUST 102 85.7 71.4 57.0 32 SEPTEMBER 98 80.8 65.5 50.1 26
OCTOBER 92 71.4 55.3 39.1 13 NOVEMBER 83 59.6 44.1 28.5 -1 DECEMBER 78 51.6 37.5 23.3 -9
ANNUAL 105 -21
1 Climatological normals 1971-2000. * All values are ºF.
PRECIPITATION** SNOWFALL** RECORD RECORD
MONTH NORMAL1 MAX NORMAL1 MAX JANUARY 1.58 7.79 4.1 53.0
FEBRUARY 1.87 10.59 4.6 37.5 MARCH 1.91 7.11 5.7 34.2
APRIL 0.76 6.90 1.5 9.8 MAY 0.64 2.35 0.0 6.0 JUNE 0.40 2.46 0.0 0.0 JULY 2.87 8.80 0.0 0.0
AUGUST 3.28 10.51 0.0 0.0 SEPTEMBER 2.07 10.02 0.0 0.0
OCTOBER 1.28 7.82 0.2 5.0 NOVEMBER 1.25 8.68 1.4 21.3 DECEMBER 1.28 6.96 2.7 46.0
ANNUAL 19.19 39.47 20.4 97.4
1 Climatological normals 1971-2000. ** All values are inches.

6
II. TEMPERATURE RECORDS

7
DAILY MAXIMUM AND MINIMUM TEMPERATURE EXTREMES MAY 1898 - DECEMBER 2008 MONTH: January
High Low High Low Date Max Year Max Year Min Year Min Year
1 69 1918 30 1960+ 39 1982+ -5 1924 2 69 1918 26 1907 40 1938 -5 1960 3 72 1918 24 1949 49 1997 -15 1937 4 70 1948 22 1949 39 1900 -8 1937 5 73 1927 21 1910 38 1991+ -6 1937 6 68 2003 22 1913 39 1991 -6 1910 7 69 1948 25 1971 37 1993+ -7 1913 8 70 1969 30 1971+ 43 1993 -2 1971 9 68 2002+ 34 1989 41 1957 -6 1899
10 69 1953 31 1937 41 2005+ -14 1937 11 70 1953 31 1913 45 2005 -7 1937+ 12 66 1990 26 1963 41 1940 -5 1913 13 66 2002+ 26 1963 44 1957 -3 1963 14 69 1943 32 1930 45 1980 3 1964 15 71 1943 33 2007 40 1938 -5 1962 16 71 1975 30 1960+ 40 1911+ 1 1949+ 17 71 1974 27 1960 43 2000 -4 1928 18 71 1971 32 1987 40 2000+ 0 1937+ 19 73 1971 27 1935 38 1959+ -8 1935 20 72 1971 25 1937 39 1965 -5 1935 21 72 1971 21 1937 42 1971 1 1937 22 66 2000+ 26 1937 44 1967 -21 1937 23 70 1910 25 1937 37 1956+ -4 1937 24 69 1970+ 30 1949+ 40 1950 -8 1929 25 68 1951+ 30 1929 41 1995 -9 1937 26 70 1975 35 1902 40 2000+ -9 1937 27 66 1942+ 35 1979+ 42 1975 2 1979 28 68 2003 30 1949 40 1901 0 1949 29 69 1986 29 1979+ 40 1936 1 1949+ 30 69 1971+ 30 1979 39 1963+ -8 1949 31 69 1971 22 1916 41 1963 -1 1979+
Month 73 1971+ 21 1937+ 49 1997 -21 1937
+ Also occurred in prior years.

8
DAILY MAXIMUM AND MINIMUM TEMPERATURE EXTREMES MAY 1898 - DECEMBER 2008 MONTH: February
High Low High Low Date Max Year Max Year Min Year Min Year
1 70 2003+ 25 1985 46 1963 -2 1949 2 70 2003 27 1985 39 1936 0 1939+ 3 72 1934 25 1985 36 1989 -10 1922 4 75 1963 31 1985 40 1928 -7 1933 5 74 1963 32 1985 40 1935 -5 1985 6 76 1963 33 1985 38 1978 -12 1899 7 74 1963+ 26 1989 42 1950 -6 1903+ 8 72 1963 24 1933 41 1957 -9 1929 9 74 1996 31 1939 43 1976 -9 1929
10 76 1926 32 1965 40 1978+ -8 1933 11 70 1926 29 1965 42 1919 5 1939+ 12 70 1910 31 1948 44 1916 4 1965 13 74 1957 28 1905 44 2003 9 2004+ 14 74 1957 20 1905 42 2003 0 1905 15 71 1971 25 1905 39 1980 1 1942 16 71 1996 30 1905 38 1962 5 1990 17 72 1977 32 1905 46 1955 6 1911 18 72 1977 34 1917 43 1986 12 1975+ 19 72 1935+ 30 1955 42 1986+ 10 1933 20 75 1981 31 1913 48 1996 5 1955 21 73 1977 33 1913 48 1996 5 1955 22 70 1982+ 31 1913 44 1901 4 1953 23 71 2002 37 1969 44 1918 -2 1913 24 71 1989+ 35 1960 44 1918 10 1960+ 25 75 1921 30 1987 44 1910 10 1977+ 26 75 1986 32 1987 40 1940+ 9 1912 27 77 1986 30 1962 42 1988+ 5 1996 28 74 1986 35 1996 44 1938 -2 1913 29 74 1972 38 2004 37 1932 14 1904
Month 77 1986 20 1905 48 1996+ -12 1899 + Also occurred in prior years.

9
DAILY MAXIMUM AND MINIMUM TEMPERATURE EXTREMES MAY 1898 - DECEMBER 2008 MONTH: March
High Low High Low Date Max Year Max Year Min Year Min Year
1 74 1967 35 1953 43 1938+ 2 1913 2 76 1910 30 1971+ 44 1920 10 1971 3 77 1910 32 1966 43 1986+ 3 1966 4 79 1910 32 1976 42 1995 4 1966 5 78 1910 34 1976 43 1995 11 1948 6 77 1910 40 1945 51 2001 9 1945 7 76 1972 34 2000 44 2001 10 1945 8 76 1972 37 1935 45 1960 11 1969+ 9 76 1972+ 37 1935 47 1954+ 13 1922
10 79 1989 38 1962+ 47 1954 8 1935 11 78 1989+ 34 1952 45 1985 12 1948 12 80 1900 35 2006 49 1960 12 1969 13 78 1900 35 2006 43 2004 11 1956+ 14 77 2007 34 1973 46 2008 9 1952 15 78 1934 37 1969 43 1961 7 1924 16 78 2007+ 40 1991 41 2003 10 1917 17 81 2007 36 1991 42 1994 16 1925+ 18 83 2007 39 1986 42 1993 11 1899 19 76 2004 40 1935 45 1959+ 11 1935 20 77 2004 39 1985+ 45 1939+ 12 1904 21 81 2004 39 1952 47 2001+ 10 1904 22 80 2004+ 36 1991+ 48 2001 14 1923 23 79 2004 37 1980 46 2001 12 1917 24 79 1940 36 1913 46 2001+ 13 1929 25 77 2001 35 1913 49 1998 11 1964 26 77 1925 38 1902 47 2001+ 10 1902 27 78 1988 33 1975 49 2001 13 1942+ 28 78 1986 34 1975 49 1963 9 1975 29 78 1934 38 1973 50 2001 12 1975 30 80 1934 38 1998 44 2008 17 1976+ 31 81 1934 43 1912 51 1971 16 1938+
Month 81 1934 30 1971+ 51 2001+ 2 1913 + Also occurred in prior years.

10
DAILY MAXIMUM AND MINIMUM TEMPERATURE EXTREMES MAY 1898 - DECEMBER 2008 MONTH: April
High Low High Low Date Max Year Max Year Min Year Min Year
1 81 1966 43 1949 49 2001 16 1904 2 81 1959+ 38 1999 51 2001 15 1975 3 82 1961 40 1999 50 2001 15 1955 4 83 1961 38 1964 49 1967+ 16 1955 5 79 1960+ 36 1999 52 1961 15 1921 6 80 1972+ 40 1922 49 1972 21 1955+ 7 84 1930 45 1922 46 1994 16 1929 8 84 1989+ 37 1975 49 2001 15 1901 9 84 1989 36 1919 51 2007 15 1928
10 83 1989 38 1965 49 1960 15 1933 11 83 1934 43 2001 56 1989 15 1933 12 85 1934 38 1965+ 54 1982 14 1953 13 85 1937+ 42 1927 50 1919 15 1927 14 85 1936 45 1976 52 2000 16 1972 15 87 1936 45 1976 51 2002 18 1970 16 86 1948 44 1998 51 1914 11 1924 17 86 1936 37 1976 49 1987+ 19 1922 18 86 1962 43 1995+ 52 1919 16 1922 19 85 1989 39 1968 51 2001 17 1922 20 84 1930 42 1971 58 1938 19 1933 21 84 1965+ 47 1995+ 53 1997 21 1923 22 84 1989+ 42 1925 57 1958 17 1963 23 86 1949 34 1925 58 1919 22 1967+ 24 87 1949 40 1925 58 1919 20 1960 25 85 1927 53 1999 56 2002 20 1904 26 85 1996+ 47 1963 49 1910 11 1899 27 87 2000+ 43 1985 57 1996 19 1899 28 86 2000 44 1900 53 1999+ 22 1970 29 85 2007+ 38 1970 55 1990 19 1970 30 87 1943 41 1915 55 1995 22 1904+
Month 87 2000+ 34 1925 58 1938+ 11 1925+ + Also occurred in prior years.

11
DAILY MAXIMUM AND MINIMUM TEMPERATURE EXTREMES MAY 1898 - DECEMBER 2008 MONTH: May
High Low High Low Date Max Year Max Year Min Year Min Year
1 89 1947 41 1915 54 1997 21 1967 2 93 1947 41 1915 54 1996 24 1915* 3 95 1947 53 1905 53 1989 20 1915* 4 94 1947 50 1959+ 58 1933 25 1969* 5 93 1947 44 1930 52 2004+ 25 1950* 6 91 1947 46 1930 54 1989 21 1899* 7 89 1934 49 1971+ 53 1997+ 23 1899* 8 93 1934 51 1986 57 2000 21 1930 9 96 1934 50 1979 56 1991 24 1930*
10 92 1934 47 1979 60 1962 23 1899* 11 89 1960 52 1957 53 1962 22 1899* 12 93 1996 50 1933 56 1993 24 1899* 13 94 1996 55 1933 60 1996+ 23 1962 14 92 1938 43 1951 58 1984 21 1933 15 94 1927 48 1951 55 1938 27 1968 16 91 1927 55 1944 60 1996 26 1955 17 92 1927 57 1981 55 2001+ 24 1903* 18 90 1934 58 1977+ 56 1948 24 1977* 19 92 1934 52 1917 60 1934 26 1921* 20 92 2008+ 50 1917 58 2008 27 1974* 21 90 2008+ 53 1979 62 2008 26 1962* 22 92 2005 54 1975 57 2006+ 24 1927* 23 93 2005+ 58 2008 57 1984 25 1899* 24 93 2000 54 1965 59 1943 27 1960 25 91 2001+ 51 2008+ 61 2001 24 1980 26 93 1951 58 1996 60 1943 27 1916* 27 92 1974+ 60 1987 59 2005 30 1911* 28 95 2003+ 62 1909 59 2003 26 1929* 29 97 1910 61 1971 62 1986 28 1953 30 96 1910 52 1971 58 1984+ 27 1918+ 31 96 1910 61 1917 61 1994 29 1921+
Month 97 1910 41 1915+ 62 2008+ 20 1915* + Also occurred in prior years. * 1899 data considered suspect. See note on page 19.

12
DAILY MAXIMUM AND MINIMUM TEMPERATURE EXTREMES MAY 1898 - DECEMBER 2008 MONTH: June
High Low High Low Date Max Year Max Year Min Year Min Year
1 94 2002 59 1991 65 1910 28 1923 2 95 1926 59 1991 63 1910 25 1899 3 94 1922 64 1999+ 68 1924 31 1929 4 95 1996+ 57 1915 62 1956+ 28 1908 5 96 1996 57 1999 62 2006 29 1925 6 95 2006+ 59 1925 63 2006 33 1933 7 98 1928 60 1993 64 2006 32 1954+ 8 100 1955 67 1995 65 2000 30 1950 9 96 1996+ 64 1995 63 1990 33 1950
10 98 1921 62 1968 61 1996 35 1968+ 11 97 1936 69 1976+ 63 2008 32 1954 12 100 1933 67 1928 65 1918 32 1947 13 101 1933 63 1955 65 1959 36 1950+ 14 100 1940+ 65 1921 68 1999 35 1970+ 15 99 1940 72 1973+ 64 1960+ 33 1901 16 98 1940 62 1921 72 2000 34 1901 17 100 1940 63 1995 66 2000 28 1923 18 101 1936 65 1995 67 1963 33 1939+ 19 100 1940+ 66 1967 66 1925 35 1923 20 100 1936 69 1975 65 1989 38 1921 21 102 1936+ 70 1975 67 1988 33 1923 22 101 1954 74 1994 65 2005 38 1947 23 101 1929 77 1972+ 66 1937 38 1948+ 24 102 1929 76 1972 68 2006 38 1930+ 25 103 1929 74 1965 65 2006+ 38 1941 26 101 1929 71 1965 67 1981 35 1901 27 101 1994+ 76 1913 66 2000 38 1965 28 102 1900 77 1910 70 2000 34 1941 29 101 1924 71 1988 70 1958 36 1913 30 103 1994+ 76 1986+ 70 1990 40 1933+
Month 103 1994+ 57 1999+ 72 2000 25 1899 + Also occurred in prior years.

13
DAILY MAXIMUM AND MINIMUM TEMPERATURE EXTREMES MAY 1898 - DECEMBER 2008 MONTH: July
High Low High Low Date Max Year Max Year Min Year Min Year
1 100 1947+ 64 1911 73 1990 42 1982+ 2 100 1947+ 76 1911 68 2001 37 1928 3 100 1985+ 69 1912 71 1947 34 1912 4 101 2007 72 1925 68 1967 40 1935+ 5 103 2007 75 1952 69 1957 41 1921 6 102 1905 74 1967 76 2007 40 1902 7 103 1905 75 1950 71 1996 43 1903+ 8 104 1905 71 1950 72 2007 44 1902 9 100 1956+ 75 1937+ 70 1939 43 1926+
10 103 1900 72 1930 69 2007+ 41 1902 11 104 1900 78 1930+ 69 2007 42 1936 12 103 1900 73 2008 71 2004 43 1902 13 103 1939 69 1918 71 2004 46 1944+ 14 100 2005+ 72 1910 75 1947 43 1944 15 101 1934 65 1918 76 2003 47 1962 16 100 1998+ 73 1919 70 1970 45 1903 17 105 1925 72 1919 70 1925 43 1924 18 102 2005 75 1969 67 2005+ 41 1924 19 102 1901 74 1911 73 2005 40 1898 20 101 1937 71 1994 72 2005 37 1924 21 101 1937 74 1991 71 2005 43 1898 22 99 1932 69 1913 71 2000 37 1901 23 99 1936+ 74 1915 69 2006 46 1913 24 99 1996+ 74 1998+ 71 1940 45 1913+ 25 102 1943 69 1955 67 1996 45 1944 26 102 1931 69 1912 67 1960 45 1903 27 102 1898 74 1912 70 1935 44 1913 28 100 1995+ 68 1916 67 2006 45 1913+ 29 102 1995 74 1987 67 1995 46 1913+ 30 101 1898 73 1999 68 1994 45 1903 31 99 1978+ 70 1950 69 2002 46 1903
Month 105 1925 64 1911 76 2007+ 34 1912 + Also occurred in prior years.

14
DAILY MAXIMUM AND MINIMUM TEMPERATURE EXTREMES MAY 1898 - DECEMBER 2008 MONTH: August
High Low High Low Date Max Year Max Year Min Year Min Year
1 101 1938 75 1963+ 68 2002 46 1950+ 2 99 1993+ 72 2003+ 70 1938 45 1903 3 98 1918 71 1951 70 1934 46 1903 4 99 1904 72 1997 68 1957 45 1976 5 99 1994 71 1909 65 2007 41 1924 6 102 1905 71 1967 69 1994 43 1928 7 98 1905 77 1931 66 1994 43 1928 8 98 1995 75 1968 68 1969 47 1951+ 9 101 1928 68 1930 69 1961 49 1949+
10 97 1937+ 71 1918 66 1995+ 44 1949 11 101 1937 69 1923 67 1956 41 1949 12 99 1937+ 73 1923 67 1994 42 1949+ 13 100 1933 63 1979 68 2002 45 1949+ 14 99 1933 68 1916 68 2002+ 42 1899 15 98 1898 67 1961 70 1962 40 1968 16 97 1898 69 1947 64 1992+ 42 1918 17 100 1905 73 1977 67 1911 40 1899 18 100 1905 66 1983 65 2002 40 1938+ 19 99 1928 71 1983 69 2002 41 1899 20 100 1928 72 1957 66 1960 37 1909 21 96 1938 71 1984 66 1997 42 1979 22 94 1991+ 73 1988 66 1991 43 1979 23 97 1936 64 1992 66 2005 32 1968 24 96 1931+ 58 1992 65 2006+ 40 1968 25 97 1985 69 1917 67 1964 43 1948 26 98 1924 73 1993 65 1994 41 1940 27 97 1924 69 1993 63 1988 41 1954 28 97 1924 71 1988+ 63 2001 41 1932+ 29 96 1998+ 66 1951 63 2008+ 42 1920 30 95 1950 68 2000 64 2008+ 42 1964 31 98 1950 67 1913+ 65 2006 38 1957
Month 102 1905 58 1992 70 1962+ 32 1968 + Also occurred in prior years. * August 1904 data not included due to potential errors – see page 19.

15
DAILY MAXIMUM AND MINIMUM TEMPERATURE EXTREMES MAY 1898 - DECEMBER 2008 MONTH: September
High Low High Low Date Max Year Max Year Min Year Min Year
1 98 1950 69 1967+ 67 1995 38 1957 2 98 1948 71 1967+ 62 1995 39 1951 3 96 1948 71 1936 63 2002+ 41 1964+ 4 96 1947 70 1912 64 1963 36 1961 5 96 1932 68 1909 63 1995 35 1961+ 6 94 1955+ 67 1970 64 2002 38 1936 7 96 1936 57 1981 62 1899 42 1948+ 8 95 1932 68 1911 66 2005 36 1935 9 94 1947+ 66 1912 64 2003 38 1941
10 96 1932 70 2003 66 1957 35 1912 11 93 1990+ 71 1996 63 1969 36 1912+ 12 94 1948+ 65 1982 61 1993+ 34 1906 13 96 1905 67 1927 62 1967+ 32 1952 14 95 1905 65 1911 61 1990 36 1930 15 94 2000 62 1906 62 1997 28 1903 16 96 1932 70 1906 62 1997 26 1903 17 95 1928 64 1940 63 2007 27 1903 18 94 1956 58 1965 63 1943 30 1903 19 94 1934 56 1965 61 1943 30 1978+ 20 92 1928+ 66 1978 61 1983 27 1978 21 92 1943+ 65 1965 62 2000 30 1978 22 93 1899 66 2004+ 61 2007 30 1912 23 95 1899 60 1986 58 1954+ 30 1901 24 97 1899 62 1986+ 59 2003 28 1923 25 94 1899 52 1986 60 2003+ 27 1917 26 95 1899 58 1986 60 1997+ 27 1924 27 91 1921 63 1986 61 1909 28 1924+ 28 91 2003 61 1982 60 1940 27 1934+ 29 91 1933 60 1905 55 1951+ 29 1900 30 90 1933 54 1971 58 1956 30 1965+
Month 98 1950+ 52 1986 67 1995 26 1903 + Also occurred in prior years.
16
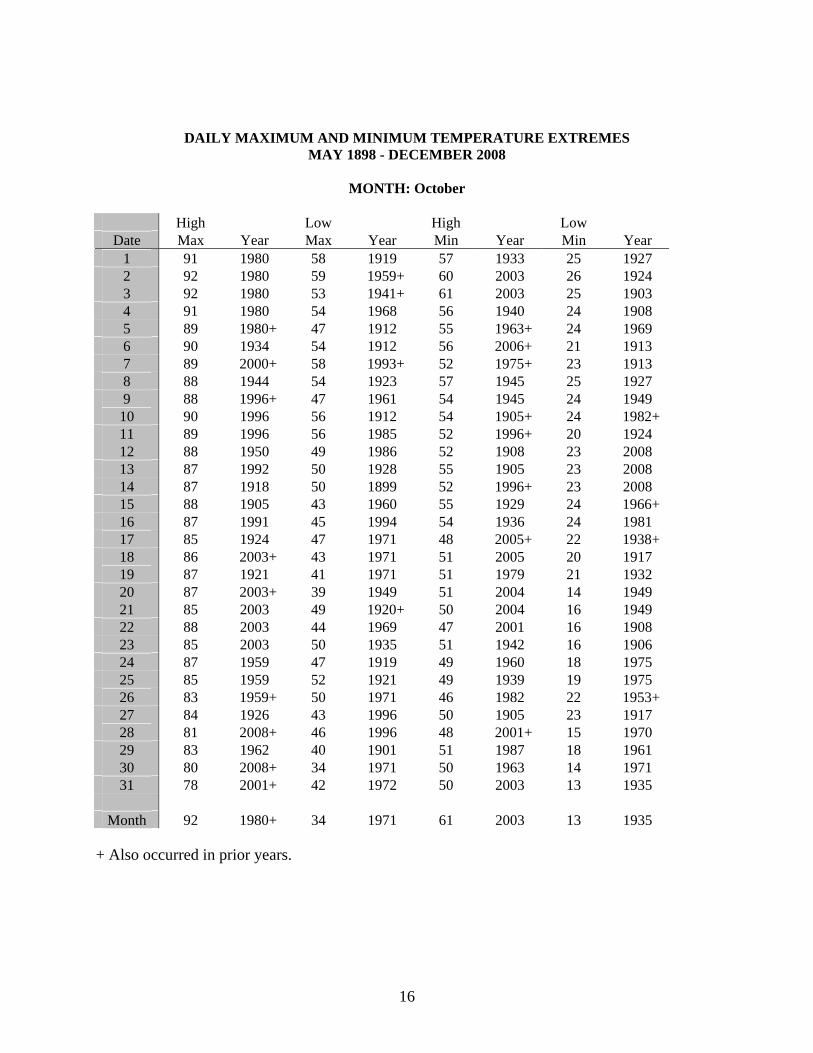
DAILY MAXIMUM AND MINIMUM TEMPERATURE EXTREMES MAY 1898 - DECEMBER 2008 MONTH: October
High Low High Low Date Max Year Max Year Min Year Min Year
1 91 1980 58 1919 57 1933 25 1927 2 92 1980 59 1959+ 60 2003 26 1924 3 92 1980 53 1941+ 61 2003 25 1903 4 91 1980 54 1968 56 1940 24 1908 5 89 1980+ 47 1912 55 1963+ 24 1969 6 90 1934 54 1912 56 2006+ 21 1913 7 89 2000+ 58 1993+ 52 1975+ 23 1913 8 88 1944 54 1923 57 1945 25 1927 9 88 1996+ 47 1961 54 1945 24 1949
10 90 1996 56 1912 54 1905+ 24 1982+ 11 89 1996 56 1985 52 1996+ 20 1924 12 88 1950 49 1986 52 1908 23 2008 13 87 1992 50 1928 55 1905 23 2008 14 87 1918 50 1899 52 1996+ 23 2008 15 88 1905 43 1960 55 1929 24 1966+ 16 87 1991 45 1994 54 1936 24 1981 17 85 1924 47 1971 48 2005+ 22 1938+ 18 86 2003+ 43 1971 51 2005 20 1917 19 87 1921 41 1971 51 1979 21 1932 20 87 2003+ 39 1949 51 2004 14 1949 21 85 2003 49 1920+ 50 2004 16 1949 22 88 2003 44 1969 47 2001 16 1908 23 85 2003 50 1935 51 1942 16 1906 24 87 1959 47 1919 49 1960 18 1975 25 85 1959 52 1921 49 1939 19 1975 26 83 1959+ 50 1971 46 1982 22 1953+ 27 84 1926 43 1996 50 1905 23 1917 28 81 2008+ 46 1996 48 2001+ 15 1970 29 83 1962 40 1901 51 1987 18 1961 30 80 2008+ 34 1971 50 1963 14 1971 31 78 2001+ 42 1972 50 2003 13 1935
Month 92 1980+ 34 1971 61 2003 13 1935 + Also occurred in prior years.

17
DAILY MAXIMUM AND MINIMUM TEMPERATURE EXTREMES MAY 1898 - DECEMBER 2008 MONTH: November
High Low High Low Date Max Year Max Year Min Year Min Year
1 79 1916 40 1972+ 50 2003 15 1929 2 80 1931+ 46 1936 47 1978 18 1956 3 80 1924 42 1974+ 47 1953 15 1956 4 79 1924 41 1974 55 1960 12 1935 5 78 1988+ 43 1957 50 2001 11 1935 6 79 1934 44 2000+ 49 1960 12 1947+ 7 78 2007+ 45 2000 47 1970 11 1938 8 79 1926 43 1919 47 2004 15 1945 9 78 1973+ 42 1966 47 2002 12 1948
10 78 1980+ 43 1915 47 1995+ 14 1946 11 78 1934 44 2000 46 1978+ 14 1950+ 12 78 1973 39 1972 47 1983 10 1929 13 77 1999 35 1985 51 1983 7 1916 14 76 1999+ 38 1985 45 1962 6 1916 15 76 1999+ 32 1964 47 1942 11 1956+ 16 83 1933 33 1964+ 42 1913 11 1964+ 17 76 1999 31 1958 42 1965 3 1964+ 18 75 1898 34 1964 42 1982 5 1958 19 79 1936 33 1930 44 1977+ 9 1964 20 75 2007 31 1994 42 1909 8 1956 21 74 1995 39 1979 44 1955 10 1956+ 22 75 1917 39 1947+ 42 1900 4 1929 23 74 1924 30 1931 50 1909 3 1931 24 75 1933 30 1931 49 1965 -1 1931 25 76 1970 36 1931 43 1921+ 7 1931 26 76 1950 34 1988 44 1958 10 1902 27 77 1933 34 1973+ 42 1926 10 1973 28 73 1998 36 1919+ 37 2008+ 9 1948 29 72 1980+ 37 1975+ 40 1970+ 3 1919 30 73 1980 32 2006 41 1961 5 1975
Month 83 1933 30 1931 55 1960 -1 1931 + Also occurred in prior years.
18
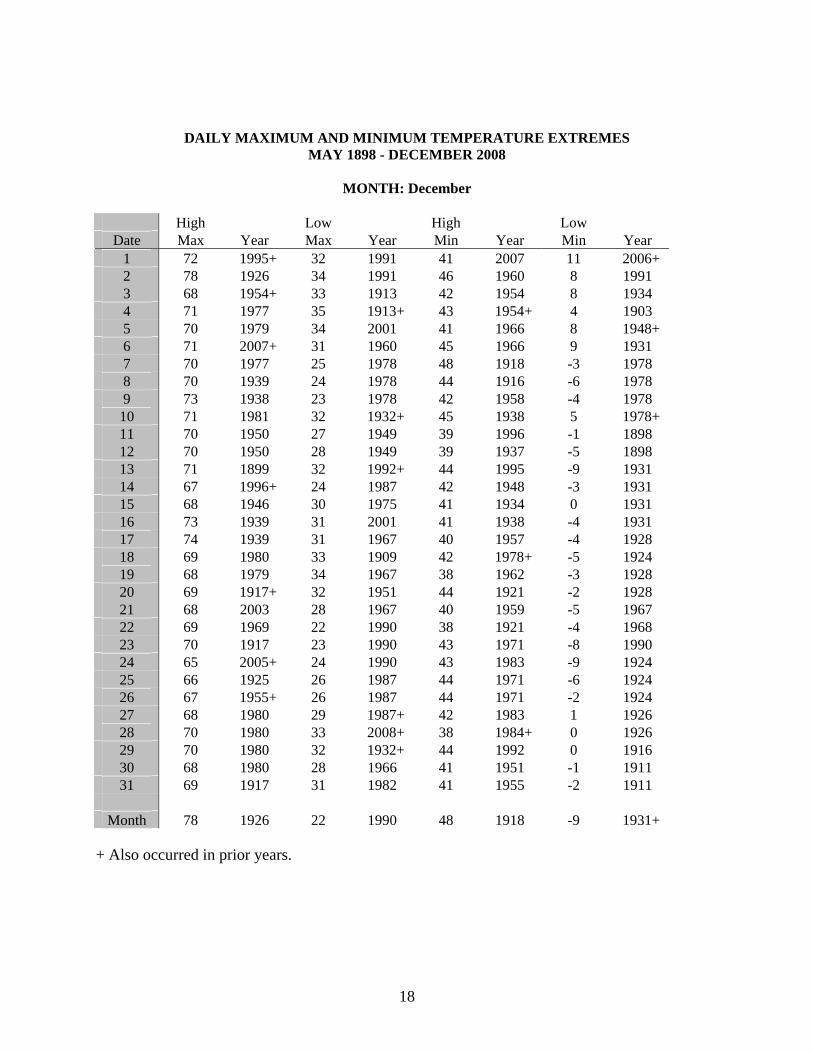
DAILY MAXIMUM AND MINIMUM TEMPERATURE EXTREMES MAY 1898 - DECEMBER 2008 MONTH: December
High Low High Low Date Max Year Max Year Min Year Min Year
1 72 1995+ 32 1991 41 2007 11 2006+ 2 78 1926 34 1991 46 1960 8 1991 3 68 1954+ 33 1913 42 1954 8 1934 4 71 1977 35 1913+ 43 1954+ 4 1903 5 70 1979 34 2001 41 1966 8 1948+ 6 71 2007+ 31 1960 45 1966 9 1931 7 70 1977 25 1978 48 1918 -3 1978 8 70 1939 24 1978 44 1916 -6 1978 9 73 1938 23 1978 42 1958 -4 1978
10 71 1981 32 1932+ 45 1938 5 1978+ 11 70 1950 27 1949 39 1996 -1 1898 12 70 1950 28 1949 39 1937 -5 1898 13 71 1899 32 1992+ 44 1995 -9 1931 14 67 1996+ 24 1987 42 1948 -3 1931 15 68 1946 30 1975 41 1934 0 1931 16 73 1939 31 2001 41 1938 -4 1931 17 74 1939 31 1967 40 1957 -4 1928 18 69 1980 33 1909 42 1978+ -5 1924 19 68 1979 34 1967 38 1962 -3 1928 20 69 1917+ 32 1951 44 1921 -2 1928 21 68 2003 28 1967 40 1959 -5 1967 22 69 1969 22 1990 38 1921 -4 1968 23 70 1917 23 1990 43 1971 -8 1990 24 65 2005+ 24 1990 43 1983 -9 1924 25 66 1925 26 1987 44 1971 -6 1924 26 67 1955+ 26 1987 44 1971 -2 1924 27 68 1980 29 1987+ 42 1983 1 1926 28 70 1980 33 2008+ 38 1984+ 0 1926 29 70 1980 32 1932+ 44 1992 0 1916 30 68 1980 28 1966 41 1951 -1 1911 31 69 1917 31 1982 41 1955 -2 1911
Month 78 1926 22 1990 48 1918 -9 1931+ + Also occurred in prior years.
19
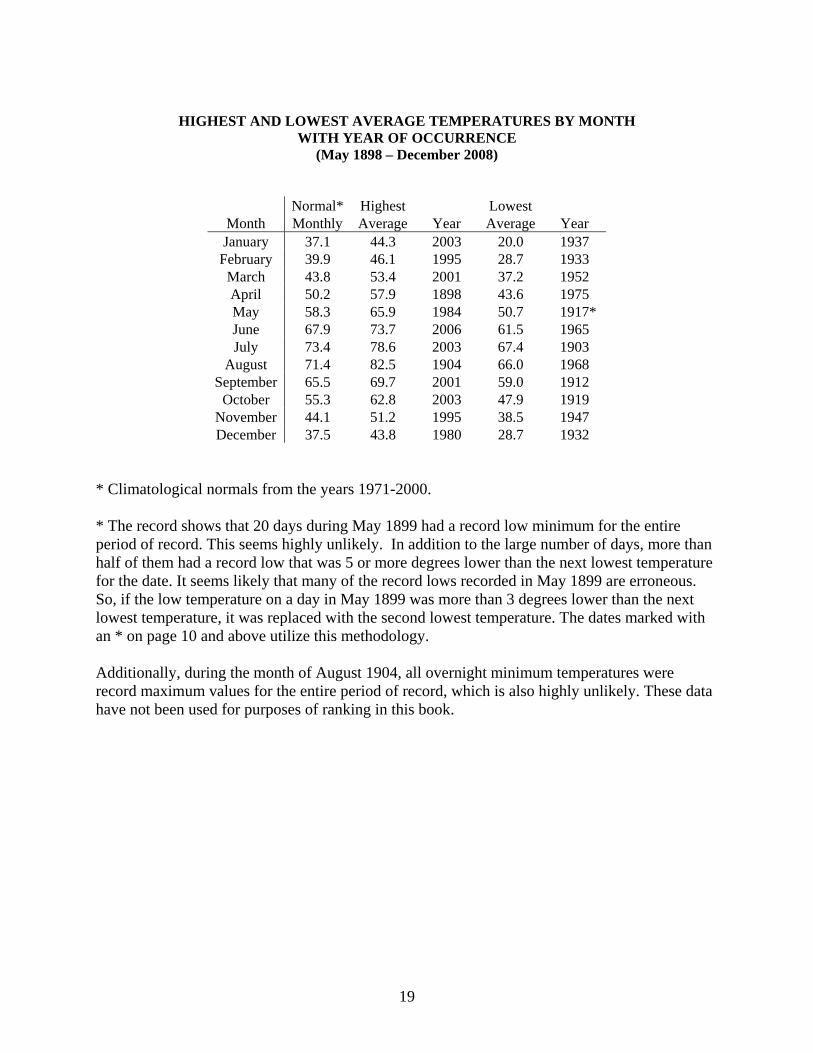
HIGHEST AND LOWEST AVERAGE TEMPERATURES BY MONTH
WITH YEAR OF OCCURRENCE (May 1898 – December 2008)
Normal* Highest Lowest Month Monthly Average Year Average Year January 37.1 44.3 2003 20.0 1937
February 39.9 46.1 1995 28.7 1933 March 43.8 53.4 2001 37.2 1952 April 50.2 57.9 1898 43.6 1975 May 58.3 65.9 1984 50.7 1917* June 67.9 73.7 2006 61.5 1965 July 73.4 78.6 2003 67.4 1903
August 71.4 82.5 1904 66.0 1968 September 65.5 69.7 2001 59.0 1912
October 55.3 62.8 2003 47.9 1919 November 44.1 51.2 1995 38.5 1947 December 37.5 43.8 1980 28.7 1932
* Climatological normals from the years 1971-2000. * The record shows that 20 days during May 1899 had a record low minimum for the entire period of record. This seems highly unlikely. In addition to the large number of days, more than half of them had a record low that was 5 or more degrees lower than the next lowest temperature for the date. It seems likely that many of the record lows recorded in May 1899 are erroneous. So, if the low temperature on a day in May 1899 was more than 3 degrees lower than the next lowest temperature, it was replaced with the second lowest temperature. The dates marked with an * on page 10 and above utilize this methodology. Additionally, during the month of August 1904, all overnight minimum temperatures were record maximum values for the entire period of record, which is also highly unlikely. These data have not been used for purposes of ranking in this book.

20
HIGHEST AND LOWEST MONTHLY AVERAGE TEMPERATURES (May 1898 – December 2008)
Highest Monthly Lowest Monthly
Average
Temperature Average
Temperature
Month Normal* Temp Year Temp Year
January 37.1 44.3 2003 20.0 1937 43.4 1986 25.3 1949 42.2 1953 28.0 1933 41.7 1956 28.4 1932 41.6 2000 30.0 1924
February 39.9 46.1 1995 28.7 1933 45.0 1957 30.5 1939 44.8 1996 31.4 1905 44.7 1963 31.7 1903 44.1 1991 32.0 1949
March 43.8 53.4 2001 37.2 1952 52.5 2004 37.5 1973 51.8 1972 37.9 1945 50.8 1934 38.1 1902 48.9 1989 38.1 1913
April 50.2 57.9 1989 43.6 1975 56.6 2002 44.3 1941 56.6 2001 44.8 1912 56.3 1992 45.1 1967 56.1 2000 45.2 1970
May 58.3 65.9 1984 50.7 1917** 65.7 2001 52.0 1980 65.0 2000 52.1 1977 64.8 2006 52.3 1953 64.7 1997 52.7 1933
June 67.9 73.7 2006 61.5 1965 73.2 2002 61.9 1923 72.7 1994 62.7 1941 72.6 2000 62.7 1967 72.5 1960 63.4 1982
* Monthly normals based on climatological normals 1971-2000. ** See note on page 18 regarding May 1899.

21
HIGHEST AND LOWEST MONTHLY AVERAGE TEMPERATURES (May 1898 – December 2008)
Highest Monthly Lowest Monthly
Average
Temperature Average
Temperature
Month Normal* Temp Year Temp Year
July 73.4 78.6 2003 67.4 1903 77.3 2007 67.5 1912 77.2 2005 69.2 1944 77.2 2002 69.3 1913 76.8 2006 69.3 1955
August 71.4 82.5 1904 66.0 1968 75.9 1995 67.4 1900 75.5 2002 67.5 1912 75.2 1994 67.6 1899 74.4 2007 68.0 1916
September 65.5 69.7 2001 59.0 1912 69.3 1956 59.5 1900 69.1 1997 60.8 1986 69.1 1983 61.0 1901 69.1 1943 61.1 1923
October 55.3 62.8 2003 47.9 1919 61.2 1988 48.6 1923 60.0 2001 49.0 1946 59.5 1987 49.1 1903 59.5 1950 49.2 1971
November 44.1 51.2 1995 38.5 1947 50.6 2007 38.7 1922 50.5 1999 38.8 1931 50.2 1949 38.9 1948 49.1 1942 39.0 2000
December 37.5 43.8 1980 28.7 1932 43.2 1977 29.5 1967 43.0 1950 29.6 1911 42.6 1939 30.5 1931 42.1 1958 31.4 1928
* Monthly normals based on climatological normals 1971-2000.

22
WARMEST AND COLDEST
WINTER, SPRING, SUMMER, FALL (May 1898 – December 2008)
WINTER (December 21-March 20) Average = 39.2* Warmest Coldest
Temp Year Temp Year 43.3 1985-86 31.1 1936-37 43.0 1971-72 32.8 1948-49 42.8 1994-95 33.1 1916-17 42.5 1942-43 33.2 1912-13 42.4 1899-00 35.4 1968-69 42.2 1998-99 35.4 1954-55 42.0 1995-96 35.6 1963-64 42.0 1933-34 35.7 1978-79 41.8 1980-81 35.8 1914-15 41.7 2002-03 35.8 1921-22
SPRING (March 21-June 20) Average = 55.9* Warmest Coldest
Temp Year Temp Year 61.1 1996 51.6 1917 60.6 2002 51.7 1975 60.1 1989 52.0 1980 60.0 2006 52.3 1967 60.0 2004 52.3 1899 60.0 1943 52.5 1912 59.5 1940 52.8 1903 59.5 1934 52.8 1904 59.4 2007 52.8 1913 59.0 1985 53.0 1973
* Averages based on climatological normals 1971-2000.

23
WARMEST AND COLDEST WINTER, SPRING, SUMMER, FALL
(May 1898 – December 2008)
SUMMER (June 21-September 20) Average = 71.0* Warmest Coldest
Temp Year Temp Year 74.8 2007 65.9 1912 74.7 2002 67.1 1903 73.9 1943 68.0 1913 73.8 1995 68.0 1941 73.8 1994 68.2 1916 73.5 2003 68.4 1950 73.2 1933 68.4 1923 73.1 1960 68.4 1911 73.0 2008 68.6 1982 72.9 2001 68.7 1906
FALL (Sept 21-Dec 20) Average = 48.6* Warmest Coldest
Temp Year Temp Year 53.2 1995 43.3 1971 52.5 1942 44.1 1923 52.3 1950 44.6 1912 51.9 2003 44.9 1972 51.8 1999 45.0 1916 51.4 1977 45.0 1902 51.0 1988 45.5 1911 50.9 1962 45.5 1920 50.8 2007 45.6 1908 50.7 1954 45.6 1913
* Averages based on climatological normals 1971-2000. ! Also occurred in prior year(s)

24
HIGHEST AND LOWEST ANNUAL TEMPERATURE
(1899 - 2008)
Highest Annual Average Lowest Annual Average
Temp Year Temp Year
57.4 1908 44.4 1907
56.9 2001 50.0 1913
56.6 2003 50.2 1903
56.5 1996 50.2 1912
56.5 1943 50.2 1919
56.3 2007 51.0 1923
56.2 2000 51.0 1945
56.0 2002 51.4 1902
55.7 1995 51.4 1911
55.6 2005 51.4 1915
Average Annual
Temperature* 54.0
* Average based on climatological normals 1971-2000. AVERAGE NUMBER OF DAYS PER YEAR WITH MAXIMUM TEMPERATURES 85,
90 AND 95 DEGREES OR HIGHER (1971 – 2000)
85 Degrees or higher………………..73 90 Degrees or higher………………..32 95 Degrees or higher…………………8

25
AVERAGE NUMBER OF DAYS PER YEAR WITH MINIMUM TEMPERATURES 40,
32 AND 10 DEGREES OR LOWER (1971 – 2000)
40 Degrees or lower………………199 32 Degrees or lower………………139 10 Degrees or lower…………………4
FREEZE AND GROWING SEASON DATA (1898 – 2008)
Longest growing season on record.…………………203 days in 1987* Shortest growing season on record.…………………..97 days in 1968*
Average growing season………………………………………147 days
Average date of last spring frost (32 degrees)………………….May 15 Earliest date of last spring frost (32 degrees)..................April 11, 2004 Latest date of last spring frost (32 degrees).…………….June 17, 1923
Average date of first fall frost (32 degrees)………………...October 10 Earliest date of first fall frost (32 degrees).…….….….August 23, 1968 Latest date of first fall frost (32 degrees)…………November 15, 1988
Average date of last spring freeze (28 degrees)………………..April 28 Earliest date of last spring freeze (28 degrees).….…..February 24, 2001 Latest date of last spring freeze (28 degrees)…………….June 17, 1923
Average date of first fall freeze (28 degrees)……..................October 21 Earliest date of first fall freeze (28 degrees)……….September 15, 1903 Latest date of first fall freeze (28 degrees)……...….November 22, 1999
* Based on the last day of 32 degrees in the spring and the first day of 32 degrees in the fall.

26
GREATEST NUMBER OF CONSECUTIVE DAYS WITH MAXIMUM
TEMPERATURES 90 DEGREES OR HIGHER (May 1898 – December 2008)
Days Dates
33 June 18 – July 20, 1905 30 June 9 – July 8, 1936 28 June 20 - July 17, 2007 26 June 26 – July 21, 1901 24 June 30 – July 23, 2005 24 June 13 - July 6, 1960 23 June 23 – July 15, 2002 22 June 27 – July 18, 2003 21 June 11 - July 1, 1974 20 July 24 - August 12, 1995 20 June 13 – July 2, 1961 20 June 27 – July 16, 1934 20 June 19 - July 8, 1929
Only periods with 20 or more days are tabulated.
GREATEST NUMBER OF CONSECUTIVE DAYS WITH MAXIMUM TEMPERATURES 95 DEGREES OR HIGHER
(May 1898 – December 2008)
Days Dates 17 June 20 - July 6, 1929 15 July 4 - July 18, 2003 12 June 21 - July 2, 1990 11 July 13 - July 23, 1936 11 July 6 - July 16, 1934 11 June 27 - July 7, 1930 11 July 3 - July 13, 1905 10 July 1 - July 10, 2007 10 July 3 - July 12, 1940 9 June 18 - June 26, 1961 9 June 12 - June 20, 1940 9 July 7 - July 15, 1939 9 June 21 - June 29, 1932
Only periods with 9 or more days are tabulated.

27
GREATEST NUMBER OF CONSECUTIVE DAYS WITH MAXIMUM TEMPERATURES 100 DEGREES OR HIGHER
(May 1898 – December 2008)
Days Dates 6 June 21 - June 26, 1929 4 July 10 - July 13, 2003 4 June 18 - June 21, 1936 4 July 10 - July 13, 1934 4 July 6 - July 9, 1905 4 July 9 - July 12, 1900 3 July 4 - July 6, 2007 3 June 26- June 28, 1990 3 July 10 - July 12, 1958 3 June 17 - June 19, 1940 3 July 12 - July 14, 1939 3 July 16 - July 18, 1925 3 June 27 - June 29, 1900
Only periods with 3 or more days are tabulated.
GREATEST NUMBER OF CONSECUTIVE DAYS WITH MINIMUM TEMPERATURES 10 DEGREES OR LOWER
(May 1898 – December 2008)
Days Dates 12 December 15 - December 26, 1928 12 December 28, 1932 - January 8, 1933 9 January 20 - January 28, 1937 8 December 23 - December 30, 1903 8 January 21 - January 28, 1904 8 January 19 - January 26, 1926 8 January 26 - February 2, 1949 8 December 27, 1966 - January 3, 1967 7 January 27 - February 2, 1902 7 January 3 - January 9, 1902
Only periods with 7 or more days are tabulated.

28
III. PRECIPITATION RECORDS

29
GREATEST DAILY 24 HOUR PRECIPITATION (INCHES)
(7 A.M – 7 A.M.) May 1898 – December 2008
January February March April 24 Hr 24 Hr 24 Hr 24 Hr
Date Pcpn Year Pcpn Year Pcpn Year Pcpn Year 1 1.30 1937 1.13 1940 1.58 1991 1.75 1905 2 1.16 1922 2.60 1919 1.70 1991 1.40 1946 3 0.60 1910 0.96 1988 3.21 1938 0.77 1997 4 1.69 1922 1.50 1958 2.10 1905 1.16 1965 5 1.06 1995 1.12 1976 0.68 1927 2.01 1926 6 1.26 1965 1.40 1965 1.02 1981 0.94 2004 7 1.25 1937 3.81 1937 0.51 1998 0.57 1946 8 1.88 1957 1.13 1994 2.80 1918 0.79 1926 9 1.00 1957 2.05 1932 1.00 1905 0.76 1965
10 2.90 1911 0.92 1963 2.17 1912 0.57 1994+ 11 2.18 1930 1.38 1982 1.12 1952 0.90 1912 12 1.00 2005 1.39 2005 2.06 1982 1.66 1905 13 1.30 1997 1.43 1931 1.00 1918 0.67 1941 14 0.95 1997 1.27 1937 0.71 1941 0.47 1941 15 0.67 1978 2.50 1927 0.43 1924 0.26 2003 16 0.85 1916 3.00 1927 1.80 1930 0.75 1976 17 2.00 1905 2.64 1927 1.27 1937 3.40 1917 18 1.60 1916 0.58 1917 1.20 1905 0.72 1917 19 0.86 1993 0.90 1990 0.61 1982 1.01 1990 20 1.18 1917 2.25 1993 0.95 1905 0.58 1926 21 1.19 1933 1.83 1920 0.72 1991 1.17 1925 22 0.85 1982 2.15 1920 1.02 1954 1.31 1988 23 1.18 1943 0.59 1957 1.16 1954 0.68 1942 24 0.68 1944 1.84 1987 1.40 1906 1.11 1990 25 1.60 1923 1.10 1958 1.10 1906 0.26 1994+ 26 1.30 1995 0.95 2003 1.31 1989 0.80 1963 27 1.80 1957 0.37 1942 1.03 1924 0.60 1900 28 1.90 1968 1.44 1997* 0.36 1973 0.50 1953 29 1.59 1915 0.45 1960 1.10 1961 0.71 1951 30 2.35 1980 0.89 1967 0.84 1915 31 1.51 1922 1.55 1903
Month 2.90 1911 3.81 1937* 3.21 1938 3.40 1917 + Also occurred in prior years. * There is a report of 7.92 inches on the 28th in 1905. However, there is no other precipitation reported on any other day for the month in that year. It seems likely that the monthly total has been reported on that day and that 7.92 inches did not fall in 24 hours.

30
GREATEST DAILY 24 HOUR PRECIPITATION (INCHES)
(7 A.M – 7 A.M.) May 1898 – December 2008
May June July August 24 Hr 24 Hr 24 Hr 24 Hr
Date Pcpn Year Pcpn Year Pcpn Year Pcpn Year 1 0.56 1978 0.37 1973 1.18 1994 2.65 1984+ 2 0.45 1981 0.80 1972+ 0.80 1961 1.09 1926 3 0.29 1930 0.36 1973 1.75 1961 1.90 1971 4 0.33 1982 0.80 1932 0.75 1918 1.81 1934 5 0.84 1982 0.27 1932 0.91 1952 1.66 1934 6 0.63 1973 0.20 1993 1.05 1927 1.00 1986+ 7 1.03 1921 0.30 1948+ 1.00 1906 1.60 1919 8 0.59 1976 0.17 1972 0.60 1913 1.92 1971 9 0.69 1912 0.65 1957 1.78 1983 1.46 1994
10 1.30 1922 0.40 1968 1.70 1985 1.36 2001 11 0.47 1933 0.30 1927 1.62 1965 1.85 1960 12 0.70 1957 0.72 1955 0.84 1973 2.08 1984 13 0.27 2008 0.96 1955 1.06 1935 1.20 1964 14 0.37 1989 0.65 1918 1.11 1942 1.47 1931 15 0.17 1951 0.30 1918 1.23 1903 1.26 1961 16 0.58 1993 0.87 1972 1.36 1908 1.60 1927 17 0.48 1995+ 0.28 1949 1.40 1909 1.21 1998 18 0.18 1921 0.92 1967 1.17 1954 1.51 1971 19 0.49 1993 0.26 1967+ 1.31 1930 1.13 1903 20 0.58 1917 0.18 1918 1.86 1974 1.51 1963 21 0.38 1920 1.05 1958 1.70 1904 1.07 1911 22 0.42 1920 0.64 2000 1.28 1901 3.15 1960 23 0.62 1940 0.53 1965 1.10 1923 1.75 1992 24 0.34 1965 0.17 2005 2.96 1970 1.09 1959 25 0.28 1979 0.20 1954 1.40 1926 1.20 1904 26 1.22 1919 1.35 1954 2.55 1958 1.28 1963 27 0.21 1979 0.70 1910 1.49 1987 1.10 1958 28 0.30 1937 0.68 1938 1.06 1945 2.10 1925 29 0.97 1934 0.75 2000 1.31 1985 2.00 1951 30 0.25 1992 1.10 1966 1.77 1977 0.47 1925 31 0.83 1986 2.02 1921 0.95 1919
Month 1.30 1922 1.35 1954 2.96 1970 3.15 1960 + Also occurred in prior years.

31
GREATEST DAILY 24 HOUR PRECIPITATION (INCHES)
(7 A.M – 7 A.M.) May 1898 – December 2008
September October November December 24 Hr 24 Hr 24 Hr 24 Hr
Date Pcpn Year Pcpn Year Pcpn Year Pcpn Year 1 1.27 1922 0.47 1959+ 1.43 1987 1.79 2007 2 0.78 1984 0.79 1990 1.60 1957 1.43 1947 3 2.55 1965 1.03 1914 0.55 1957 2.02 1908 4 2.41 1990 1.23 1940 0.70 1905 0.75 1992 5 1.35 1994 1.88 1912 0.85 1905 1.37 1972 6 1.07 1939 2.40 1916 1.36 1987 1.68 1966 7 1.61 1927 1.88 1972 0.80 1905 1.31 1966 8 1.29 1933 0.65 2001 1.32 2004 1.30 2007 9 1.26 1986 0.60 1960 0.79 1982 0.93 1965
10 0.73 1996 0.93 1960 1.10 1902 1.79 1965 11 0.79 1984 1.00 1899 2.92 1978 1.44 1927 12 1.65 1958 1.46 1928 2.24 1978 0.94 1932 13 1.88 1941 0.32 1987 1.27 2003 1.21 1934 14 0.79 1962 0.49 1925 0.92 1955 1.16 1967 15 1.10 1999 0.72 1980 1.10 1899 1.51 1908 16 1.50 1925 0.61 1994 1.00 1952 1.80 1908 17 1.90 1983 0.72 1971 0.85 1900 0.63 1914 18 2.00 1923 1.27 1949 1.32 1930 1.46 1967 19 0.79 1914 1.62 1972 0.78 1984 1.70 1967 20 1.45 1952 0.87 1920 1.10 1902 0.83 1938 21 0.65 1991 1.26 1979 1.04 1963 1.28 1938 22 0.27 1913 1.65 2000 0.50 1905 1.71 1921 23 2.17 1983 0.43 1974 3.01 1965 2.18 1945 24 3.08 1983 1.23 1919 0.70 1906 1.37 1940 25 1.93 1943 2.00 1919 1.24 1965 1.44 1959 26 2.00 1997 0.78 1940 1.65 1985 2.25 1921 27 0.60 1962+ 0.86 1912 4.28 1919 1.72 1923 28 1.24 1958 1.28 2004 1.63 1975 1.10 1992 29 0.80 1914 0.80 1936 1.90 1933 1.42 1936 30 2.25 1983 1.10 1987 1.15 1922 3.13 1951 31 1.45 1920 0.90 1948
Month 3.08 1983 2.40 1916 4.28 1919 3.13 1951 + Also occurred in prior years.
32
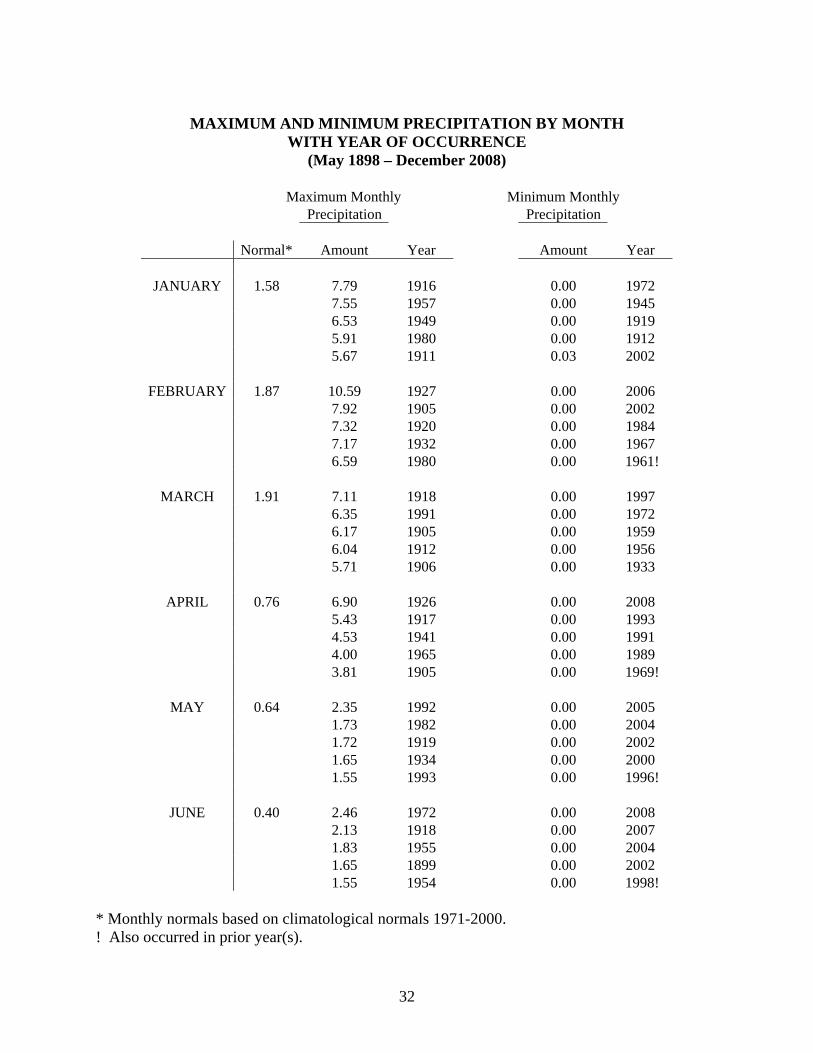
MAXIMUM AND MINIMUM PRECIPITATION BY MONTH
WITH YEAR OF OCCURRENCE (May 1898 – December 2008)
Maximum Monthly Minimum Monthly Precipitation Precipitation Normal* Amount Year Amount Year
JANUARY 1.58 7.79 1916 0.00 1972 7.55 1957 0.00 1945 6.53 1949 0.00 1919 5.91 1980 0.00 1912 5.67 1911 0.03 2002
FEBRUARY 1.87 10.59 1927 0.00 2006 7.92 1905 0.00 2002 7.32 1920 0.00 1984 7.17 1932 0.00 1967 6.59 1980 0.00 1961!
MARCH 1.91 7.11 1918 0.00 1997 6.35 1991 0.00 1972 6.17 1905 0.00 1959 6.04 1912 0.00 1956 5.71 1906 0.00 1933
APRIL 0.76 6.90 1926 0.00 2008 5.43 1917 0.00 1993 4.53 1941 0.00 1991 4.00 1965 0.00 1989 3.81 1905 0.00 1969!
MAY 0.64 2.35 1992 0.00 2005 1.73 1982 0.00 2004 1.72 1919 0.00 2002 1.65 1934 0.00 2000 1.55 1993 0.00 1996!
JUNE 0.40 2.46 1972 0.00 2008 2.13 1918 0.00 2007 1.83 1955 0.00 2004 1.65 1899 0.00 2002 1.55 1954 0.00 1998!
* Monthly normals based on climatological normals 1971-2000. ! Also occurred in prior year(s).

33
MAXIMUM AND MINIMUM PRECIPITATION BY MONTH
WITH YEAR OF OCCURRENCE (May 1898 – December 2008)
Maximum Monthly Minimum Monthly Precipitation Precipitation Normal* Amount Year Amount Year
JULY 2.87 8.80 1908 0.00 1993 7.46 1953 0.11 1905 6.92 1970 0.28 1902 6.19 1912 0.32 1997 5.99 1931 0.41 1940
AUGUST 3.28 10.51 1971 0.11 2002 8.82 1984 0.30 1996 8.70 1934 0.30 1944 8.39 1963 0.45 1945 6.74 1904 0.51 1985
SEPTEMBER 2.07 10.02 1983 0.00 2000 5.20 1965 0.00 1973 4.91 1958 0.00 1968 4.87 1927 0.00 1959 4.45 1999 0.00 1953!
OCTOBER 1.28 7.82 1972 0.00 2003 5.18 2000 0.00 1999 4.22 1912 0.00 1995 3.72 1960 0.00 1973 3.47 1940 0.00 1952!
NOVEMBER 1.25 8.68 1905 0.00 1999 5.97 1978 0.00 1989 5.41 1919 0.00 1980 5.40 1965 0.00 1976 4.39 1985 0.00 1956!
DECEMBER 1.28 6.96 1965 0.00 2005 6.08 1967 0.00 1999 5.69 1908 0.00 1963 5.42 1923 0.00 1958 5.29 1921 0.00 1950!
* Monthly normals based on climatological normals 1971-2000. ! Also occurred in prior year(s).

34
WETTEST AND DRIEST
WINTER, SPRING, SUMMER, FALL (May 1898 – December 2008)
WINTER (December 21-March 20) Average = 5.35* Wettest Driest
Amount Year Amount Year
18.73 1904-05 0.20 2001-02 14.97 1926-27 0.77 1955-56 14.65 1936-37 0.87 1971-72 14.60 1979-80 1.05 1903-04 14.28 1921-22 1.14 1966-67 12.38 1992-93 1.26 2005-06 11.83 1917-18 1.33 1963-64 11.83 1915-16 1.34 1998-99 11.50 1977-78 1.52 1970-71 11.48 2004-05 1.53 1899-00
SPRING (March 21-June 20) Average = 2.04* Wettest Driest
Amount Year Amount Year
8.41 1926 0.06 1966 6.65 1917 0.13 1974 5.06 1941 0.15 1913 4.98 1965 0.30 2003 4.95 1903 0.31 1938 4.79 1905 0.33 1943 4.77 1906 0.35 1956 4.73 1973 0.39 1996 4.13 1990 0.41 1948 3.86 1912 0.42 1984
* Averages based on climatological normals 1971-2000.

35
WETTEST AND DRIEST
WINTER, SPRING, SUMMER, FALL (May 1898 – December 2008)
SUMMER (June 21-Sept 20) Average = 7.98* Wettest Driest
Amount Year Amount Year
15.66 1984 2.23 1900 13.59 1970 2.30 1944 13.26 1971 2.64 1928 12.76 1925 2.68 1978 12.74 1953 3.19 1979 12.42 1946 3.23 1993 12.33 1927 3.53 1968 12.05 1969 4.12 1980 11.98 1998 4.17 1905 11.69 1909 4.21 1915
FALL (Sept 21-Dec 20) Average = 3.89* Wettest Driest
Amount Year Amount Year
11.97 1972 0.11 1917 10.83 1978 0.18 1929 10.63 1905 0.49 1950 10.52 1919 0.57 1989 10.17 1965 0.72 1942 9.77 1983 0.97 2005 7.85 1908 1.00 1973 7.81 1967 1.25 1956 7.72 1987 1.29 1995 7.48 1940 1.34 1948
* Averages based on climatological normals 1971-2000.
36
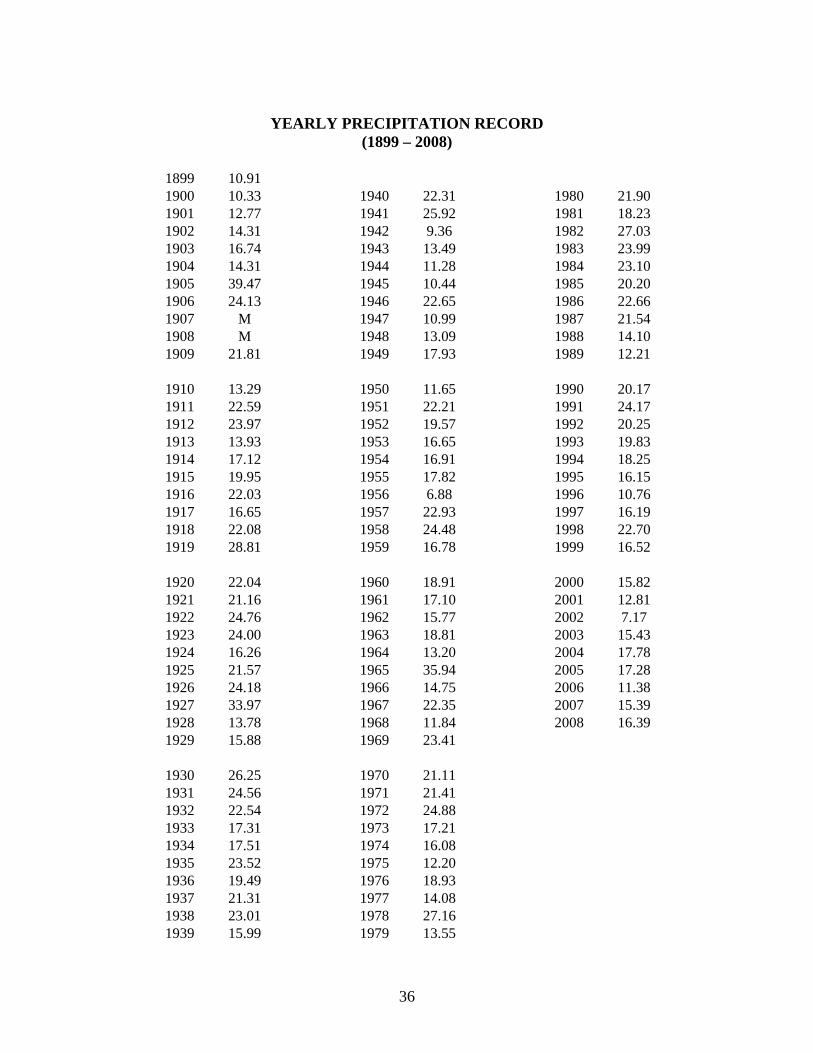
YEARLY PRECIPITATION RECORD
(1899 – 2008)
1899 10.91 1900 10.33 1940 22.31 1980 21.90 1901 12.77 1941 25.92 1981 18.23 1902 14.31 1942 9.36 1982 27.03 1903 16.74 1943 13.49 1983 23.99 1904 14.31 1944 11.28 1984 23.10 1905 39.47 1945 10.44 1985 20.20 1906 24.13 1946 22.65 1986 22.66 1907 M 1947 10.99 1987 21.54 1908 M 1948 13.09 1988 14.10 1909 21.81 1949 17.93 1989 12.21
1910 13.29 1950 11.65 1990 20.17 1911 22.59 1951 22.21 1991 24.17 1912 23.97 1952 19.57 1992 20.25 1913 13.93 1953 16.65 1993 19.83 1914 17.12 1954 16.91 1994 18.25 1915 19.95 1955 17.82 1995 16.15 1916 22.03 1956 6.88 1996 10.76 1917 16.65 1957 22.93 1997 16.19 1918 22.08 1958 24.48 1998 22.70 1919 28.81 1959 16.78 1999 16.52
1920 22.04 1960 18.91 2000 15.82 1921 21.16 1961 17.10 2001 12.81 1922 24.76 1962 15.77 2002 7.17 1923 24.00 1963 18.81 2003 15.43 1924 16.26 1964 13.20 2004 17.78 1925 21.57 1965 35.94 2005 17.28 1926 24.18 1966 14.75 2006 11.38 1927 33.97 1967 22.35 2007 15.39 1928 13.78 1968 11.84 2008 16.39 1929 15.88 1969 23.41
1930 26.25 1970 21.11 1931 24.56 1971 21.41 1932 22.54 1972 24.88 1933 17.31 1973 17.21 1934 17.51 1974 16.08 1935 23.52 1975 12.20 1936 19.49 1976 18.93 1937 21.31 1977 14.08 1938 23.01 1978 27.16 1939 15.99 1979 13.55

37
15 WETTEST YEARS (January 1899 – December 2008)
Rank Amount* Year
1 39.47 1905 2 35.94 1965 3 33.97 1927 4 28.81 1919 5 27.16 1978 6 27.03 1982 7 26.25 1930 8 25.92 1941 9 24.88 1972
10 24.76 1922 11 24.56 1931 12 24.48 1958 13 24.18 1926 14 24.17 1991 15 24.13 1906
* All amounts are in inches.
15 DRIEST YEARS (January 1899 – December 2008)
Rank Amount* Year
1 6.88 1956 2 7.17 2002 3 9.36 1942 4 10.33 1900 5 10.44 1945 6 10.76 1996 7 10.91 1899 8 10.99 1947 9 11.28 1944
10 11.38 2006 11 11.65 1950 12 11.84 1968 13 12.20 1975 14 12.21 1989 15 12.77 1901
* All amounts are in inches.
AVERAGE YEARLY PRECIPITATION: 19.19 INCHES* * Based on the 30 year average yearly precipitation from 1971–2000.

38
GREATEST NUMBER OF DAYS WITH 0.01 INCHES OR MORE AND 0.10 INCHES OR MORE BY MONTH AND YEAR OF OCCURRENCE
(1899 – 2008)
0.01 Inch or more 0.10 Inch or more Average Greatest Average Greatest
Month # of Days # of Days Year # of Days # of Days Year
January 5.3 16 1993+ 3.6 12 1949 February 5.4 14 1993+ 3.5 11 1941+
March 5.6 18 1973 3.6 13 1973 April 4.0 18 1926 2.3 14 1926 May 2.6 12 1992 1.5 8 1992 June 1.9 11 1972 1.1 6 1972+ July 9.8 21 1953 6.4 15 1919
August 10.6 24 1971 6.6 17 1971 September 5.4 15 1940 3.4 9 1958+
October 3.7 15 1972 2.3 11 1972 November 4 13 1905 2.5 11 1905 December 4.9 13 1965 3.2 10 1965+
Annual 63.3! 92 1978+ 40.0! 60 1941
GREATEST NUMBER OF DAYS WITH 0.25 INCHES OR MORE AND 0.50 INCHES
OR MORE BY MONTH AND YEAR OF OCCURRENCE (1899 – 2008)
0.25 Inch or more 0.50 Inch or more Average Greatest Average Greatest
Month # of Days # of Days Year # of Days # of Days Year
January 2.1 9 1916 1.1 5 1980+ February 2.2 8 1980 1.1 6 1927+
March 2.2 8 1978+ 1.1 6 1918 April 1.3 8 1926 0.6 6 1926 May 0.7 4 1992 0.2 1 1993+ June 0.6 4 1918 0.2 2 2000+ July 3.8 12 1908 1.8 8 1991
August 4.2 12 1904 2.2 7 1963 September 2.2 7 1995 1.1 4 1983
October 1.4 8 1972 0.7 5 1972 November 1.5 11 1905 0.8 8 1905 December 2.0 9 1926 1.0 5 1967+
Annual 24.2! 40 1965 12.1! 24 1991
+ Also occurred in prior years. ! Total may be different than sum of average number of days due to rounding.

39
GREATEST NUMBER OF CONSECUTIVE DAYS WITH 0.01 INCHES OR MORE
(Periods with 9 or more days tabulated) (May 1898 – December 2008)
Total Days Period Precipitation
13 July 21 - August 2, 2007 4.42 13 July 6 - July 18, 1953 5.42 11 February 6 - February 16, 1978 1.68 11 August 20 - August 30, 1971 3.43 11 July 21 - July 31, 1904 4.57 10 July 30 - August 8, 1968 1.55 10 September 4 – September 13, 1939 3.36 10 February 6 - February 15, 1935 3.28 10 July 27 - August 5, 1930 1.26 9 August 23 - August 31, 2000 1.56 9 February 14 - February 22, 1980 6.59 9 August 1 - August 9, 1963 2.01 9 July 22 - July 30, 1952 1.23 9 July 18 - July 26, 1915 2.31
GREATEST NUMBER OF CONSECUTIVE DAYS WITH
0.25 INCHES OR MORE (Periods with 4 or more days tabulated)
(May 1898 – December 2008) Total
Days Period Precipitation 5 July 20 - July 24, 1998 3.67 5 November 4 - November 8, 1905 3.35 4 July 30 - August 2, 2007 1.79 4 July 28 - July 31, 1999 1.23 4 February 19 - February 22, 1980 2.94 4 February 14 - February 17, 1980 3.58 4 February 28 - March 3, 1978 3.01 4 October 4 - October 7, 1972 3.79 4 December 12 – December 15, 1967 2.63 4 December 14 – December 17, 1965 1.39 4 April 1 - April 4, 1965 2.63 4 August 2 - August 5, 1964 1.38 4 October 31 – November 3, 1957 3.16 4 January 7 - January 10, 1957 3.66 4 July 6 - July 9, 1953 2.09 4 April 11 - April 14, 1941 2.43 4 December 11 – December 14, 1932 2.42 4 February 14 - February 17, 1927 9.29 4 February 8 - February 11, 1920 2.37 4 January 16 - January 19, 1916 3.92 4 August 19 - August 22, 1904 2.10

40
GREATEST NUMBER OF CONSECUTIVE DAYS WITH
0.50 INCHES OR MORE (Periods with 4 or more days tabulated)
(May 1898 – December 2008)
Total Days Period Precipitation
5 July 20 - July 24, 1998 3.67 4 February 14 - February 17, 1927 9.29 4 November 4 – November 7, 1905 3.10
GREATEST NUMBER OF CONSECUTIVE DAYS WITH
0.75 INCHES OR MORE (Periods with 3 or more days tabulated)
(May 1898 – December 2008)
Total Days Period Precipitation
4 February 14 - February 17, 1927 9.29 3 July 30 - August 1, 1991 2.68 3 January 11 - January 13, 1930 3.88 3 January 16 - January 18, 1916 3.67 3 March 24 - March 26, 1906 3.40 3 November 5 – November 7, 1905 2.40
GREATEST NUMBER OF CONSECUTIVE DAYS WITHOUT MEASURABLE
PRECIPITATION (Less than 0.01 inches) DURING AN ENTIRE YEAR (May 1898 – December 2008)
Days Period
99 September 25, 1999 - January 1, 2000 97 October 8, 1917 - January 12, 1918 97 October 3, 1903 - January 7, 1904 96 April 3 – July 7, 1974 92 March 29 - June 28, 1966 87 January 2 - March 29, 2002 85 April 22 – July 15, 1902 84 April 6 – June 28, 1909 84 August 31 - November 22, 1898 80 April 25 – July 13, 2004
41
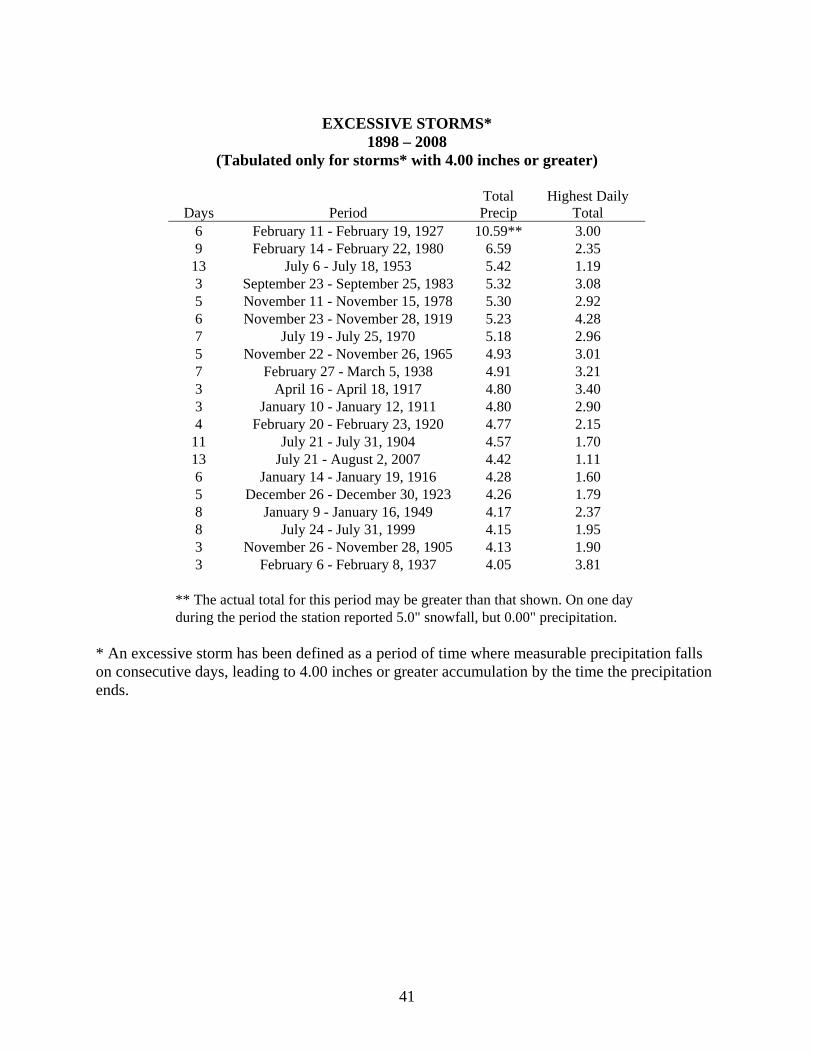
EXCESSIVE STORMS*
1898 – 2008 (Tabulated only for storms* with 4.00 inches or greater)
Days Period Total Precip
Highest Daily Total
6 February 11 - February 19, 1927 10.59** 3.00 9 February 14 - February 22, 1980 6.59 2.35
13 July 6 - July 18, 1953 5.42 1.19 3 September 23 - September 25, 1983 5.32 3.08 5 November 11 - November 15, 1978 5.30 2.92 6 November 23 - November 28, 1919 5.23 4.28 7 July 19 - July 25, 1970 5.18 2.96 5 November 22 - November 26, 1965 4.93 3.01 7 February 27 - March 5, 1938 4.91 3.21 3 April 16 - April 18, 1917 4.80 3.40 3 January 10 - January 12, 1911 4.80 2.90 4 February 20 - February 23, 1920 4.77 2.15
11 July 21 - July 31, 1904 4.57 1.70 13 July 21 - August 2, 2007 4.42 1.11 6 January 14 - January 19, 1916 4.28 1.60 5 December 26 - December 30, 1923 4.26 1.79 8 January 9 - January 16, 1949 4.17 2.37 8 July 24 - July 31, 1999 4.15 1.95 3 November 26 - November 28, 1905 4.13 1.90 3 February 6 - February 8, 1937 4.05 3.81
** The actual total for this period may be greater than that shown. On one day during the period the station reported 5.0" snowfall, but 0.00" precipitation.
* An excessive storm has been defined as a period of time where measurable precipitation falls on consecutive days, leading to 4.00 inches or greater accumulation by the time the precipitation ends.

42
GREATEST DAILY 24 HOUR SNOWFALL (INCHES) (7 A.M. – 7 A.M.)
May 1898 – December 2008
January February March April 24 Hr 24 Hr 24 Hr 24 Hr
Date Snow Year Snow Year Snow Year Snow Year 1 13.0 1937 6.5 1901 4.0 1915 1.0 1949+ 2 2.5 1949 19.2 1919 8.0 1964 7.5 1977 3 6.0 1910 8.0 1985 3.8 1948 4.0 1964 4 5.0 1922 5.1 1946 9.0 1945 6.0 1965 5 5.0 1974 3.0 1904 2.0 1970 6.0 1921 6 9.0 1907 11.5 1929 12.0 1981 2.5 1906 7 12.5 1937 3.5 1901 3.0 2000 0.6 1975 8 6.0 1937 8.0 1939 15.0 1901 8.0 1978 9 5.8 1900 5.5 1959 11.0 1905 3.0 1944
10 9.5 1949 4.0 1985 2.5 1927 1.5 2001 11 21.8 1930 8.0 1923 8.0 1969+ 2.0 1927 12 8.0 1930 2.8 1919 14.0 1922 5.0 1941 13 9.0 1930 5.0 1927 4.0 1990+ 1.0 1967 14 4.0 1949 9.3 1932 6.0 1973 0.3 1976 15 3.0 1949 13.2 1932 2.0 1982+ 16 10.0 1917 3.0 1973 14.5 1930 5.0 1976 17 5.0 1935 3.0 1975+ 8.0 1963 5.0 1917 18 11.3 1933 7.5 1917 7.0 1922 2.5 1917 19 3.5 1979 7.0 1990 5.0 1982 2.0 1968 20 6.0 1954 3.5 1971+ 8.0 1991 2.0 1902 21 11.9 1933 6.0 1944 8.5 1991 5.0 1925 22 10.0 1982 5.5 1985 4.0 1991 2.5 1988 23 5.0 1902 4.0 1969+ 6.0 1945 2.0 1942 24 9.0 1949 15.0 1987 4.0 1904 1.0 1980 25 7.0 1949 11.0 1987 13.0 1902 26 10.0 1902 4.0 1987 4.5 1977 0.5 1951 27 14.0 1918 3.0 1951 4.5 1924 3.3 1932 28 2.0 2001+ 8.0 1997 2.5 1909 1.0 1933 29 4.0 1902 0.0 2004+ 9.0 1961 3.0 1906 30 2.0 1933+ 0.5 1973 1.3 1915 31 15.0 1922 3.5 1949
Month 21.8 1930 19.2 1919 15.0 1901 8.0 1978 + Also occurred in prior years.

43
GREATEST DAILY 24 HOUR SNOWFALL (INCHES)
(7 A.M. – 7 A.M.) May 1898 – December 2008
May June July August 24 Hr 24 Hr 24 Hr 24 Hr
Date Snow Year Snow Year Snow Year Snow Year 1 3.0 1915 2 3.0 1915 3 4 1.0 1950 5 6 1.5 1930 7 8 9 1.0 1930
10 3.0 1922 11 4.7 1933 12 13 14 15 16 17 18 19 20 21 22 23 24 25 26 27 28 29 30 31
Month 4.7 1933 0.0 ALL 0.0 ALL 0.0 ALL

44
GREATEST DAILY 24 HOUR SNOWFALL (INCHES)
(7 A.M. – 7 A.M.) May 1898 – December 2008
September October November December 24 Hr 24 Hr 24 Hr 24 Hr
Date Snow Year Snow Year Snow Year Snow Year 1 1.0 1961 2.5 1906 2 6.0 1906 3 4.5 1925 1.0 1944 4 4.0 1953 5 2.5 2004 6 7.0 1978 7 2.5 1926 8 6.5 1971 9 2.0 1946 7.5 1972
10 1.5 1946 14.5 1898 11 1.0 1982 4.1 1928 12 3.5 1972 9.4 1932 13 2.0 1947 10.0 1967 14 1.0 1922 11.0 1967 15 0.7 1980 9.0 1964 6.5 1915 16 0.5 1980 7.0 1964 2.5 1924+ 17 0.8 1971 2.0 1949+ 18 4.5 1908 3.0 1967 19 5.0 1949 3.0 1984 10.0 1967 20 13.0 1902 3.0 1968+ 21 0.5 1920 4.0 1905 10.5 1909 22 1.0 1906 3.8 1931 6.0 1924 23 4.8 1940 4.0 1918 24 7.0 1906 3.0 1941 25 5.3 1918 7.5 1916 26 2.0 1983 3.0 1910 27 5.0 1909 4.0 1966 28 13.0 1919+ 1.8 1935 29 2.0 1901 19.0 1933 9.1 1931 30 2.5 1974 8.5 1991 18.6 1915 31 1.0 1972 7.7 1915
Month 0.0 ALL 5.0 1949 19.0 1933 18.6 1915 + Also occurred in prior years.

45
MAXIMUM MONTHLY SNOWFALL WITH YEAR OF OCCURRENCE
(May 1898 – December 2008)
Normal* Amount** Year
JANUARY 4.1 53.0 1949 45.8 1930 35.6 1937 34.3 1933 22.0 1922!
FEBRUARY 4.6 37.5 1932 32.5 1987 27.0 1919 25.0 1901 23.8 1939
MARCH 5.7 34.2 1973 29.5 1991 28.0 1952 21.0 1930 21.0 1922
APRIL 1.5 9.8 1965 9.5 1977 8.5 1917 8.0 1978 7.1 1906
MAY 0.0 6.0 1915 4.7 1933 3.0 1922 2.5 1930 1.0 1950
JUNE 0.0 0.0 ALL
* Monthly normals calculated from period 1971-2000. ** All amounts in inches. ! Also occurred in prior year(s).

46
MAXIMUM MONTHLY SNOWFALL
WITH YEAR OF OCCURRENCE (May 1898 – December 2008)
Normal* Amount** Year
JULY 0.0 0.0 ALL
AUGUST 0.0 0.0 ALL
SEPTEMBER 0.0 0.0 ALL
OCTOBER 0.2 5.0 1949 4.5 1908 2.5 1974 2.3 1971 2.0 1901
NOVEMBER 1.4 21.3 1906 21.0 1933 17.0 1902 16.0 1964 13.0 1919
DECEMBER 2.7 46.0 1967 37.0 1915 32.6 1932 32.2 1931 22.1 1909
* Monthly normals calculated from period 1971-2000. ** All amounts in inches.
FIRST AND LAST SNOWFALLS
(1898 – 2008)
Average date of first measurable snowfall………………………December 9 Average date of last measurable snowfall………………………….March 16 Average length of snowfall season………………………….………118 days
Earliest date of first measurable snowfall………………….October 15, 1980 Latest date of last measurable snowfall………………………..May 11, 1933

47
SEASONAL SNOWFALL (INCHES) (1898 – 2008)
1899 32.0 1900 5.8 1940 6.5 1980 16.2 1901 40.0 1941 16.3 1981 18.8 1902 44.0 1942 29.6 1982 29.4 1903 37.2 1943 2.4 1983 14.0 1904 10.5 1944 30.9 1984 5.0 1905 15.0 1945 26.2 1985 27.5 1906 32.6 1946 18.1 1986 7.5 1907 M 1947 5.5 1987 48.0 1908 M 1948 32.4 1988 20.5 1909 27.2 1949 69.3 1989 2.4
1910 42.6 1950 19.7 1990 22.5 1911 7.7 1951 30.1 1991 35.0 1912 2.4 1952 46.1 1992 14.3 1913 7.4 1953 20.0 1993 2.6 1914 0.0 1954 27.0 1994 6.5 1915 30.0 1955 19.0 1995 2.1 1916 53.7 1956 7.5 1996 2.5 1917 57.4 1957 8.0 1997 12.1 1918 24.0 1958 2.3 1998 14.1 1919 45.7 1959 10.5 1999 0.5
1920 29.6 1960 11.5 2000 10.5 1921 17.5 1961 10.0 2001 24.5 1922 54.0 1962 5.5 2002 2.0 1923 25.0 1963 10.5 2003 6.5 1924 20.0 1964 21.0 2004 5.0 1925 20.3 1965 34.6 2005 10.5 1926 10.7 1966 26.0 2006 12.3 1927 28.0 1967 14.2 2007 2.4 1928 8.5 1968 52.0 2008 0.5 1929 58.2 1969 37.0
1930 71.8 1970 8.8 1931 4.3 1971 16.3 1932 97.4 1972 14.6 1933 77.6 1973 60.7 1934 24.3 1974 28.5 1935 26.0 1975 25.6 1936 12.3 1976 23.5 1937 52.8 1977 26.1 1938 7.0 1978 26.8 1939 44.7 1979 53.0
Snowfall is for the period July through June ending the year indicated.

48
15 SNOWIEST YEARS (July 1898 – December 2008)
Rank Amount* Year
1 97.4 1931-1932 2 77.6 1932-1933 3 71.8 1929-1930 4 69.3 1948-1949 5 60.7 1972-1973 6 58.2 1928-1929 7 57.4 1916-1917 8 54.0 1921-1922 9 53.7 1915-1916
10 53.0 1978-1979 11 52.8 1936-1937 12 52.0 1967-1968 13 48.0 1986-1987 14 46.1 1951-1952 15 45.7 1918-1919
15 LEAST SNOWY YEARS (July 1898 – December 2008)
Rank Amount* Year
1 0.0 1913-1914 2 0.5 2007-2008 3 0.5 1998-1999 4 2.0 2001-2002 5 2.1 1994-1995 6 2.3 1957-1958 7 2.4 2006-2007 8 2.4 1988-1989 9 2.4 1942-1943
10 2.4 1911-1912 11 2.5 1995-1996 12 2.6 1992-1993 13 4.3 1930-1931 14 5.0 2003-2004 15 5.0 1983-1984
* All amounts in inches. + Also occurred in prior years.
AVERAGE YEARLY SNOWFALL: 20.4 INCHES*
* Based on the 30 year average yearly snowfall from 1971-2000.

49
GREATEST NUMBER OF DAYS WITH SNOWFALL OF ONE INCH OR MORE AND THREE INCHES OR MORE BY MONTH AND YEAR OF OCCURRENCE
(June 1950 – December 2008)
One Inch or more Three Inches or more Average Greatest Average Greatest
Month # of days # of days Year Month # of days # of days Year January 1.6 6 1955 January 0.5 4 1979
February 1.4 4 1998+ February 0.7 4 1985+March 1.4 10 1973 March 0.8 5 1973 April 0.5 2 1988+ April 0.1 2 1965 May 0.1 0 May 0 0 June 0 0 June 0 0 July 0 0 July 0 0
August 0 0 August 0 0 September 0 0 September 0 0
October 0.1 1 1974+ October 0 0 November 0.5 3 1952 November 0.2 2 1965+December 1.3 8 1967 December 0.4 5 1967
Annual 6.8! 18 1973 Annual 2.7! 9 1979+
GREATEST NUMBER OF DAYS WITH SNOWFALL OF SIX INCHES OR MORE BY
MONTH AND YEAR OF OCCURRENCE (June 1950 – December 2008)
Six Inches or more Average Greatest
Month # of days # of days Year January 0.3 1 2001+
February 0.2 2 1987 March 0.2 2 1991+ April 0 1 1978+ May 0 0 June 0 0 July 0 0
August 0 0 September 0 0
October 0 0 November 0.1 2 1965 December 0.2 4 1968
Annual 1.0! 4 1968
+ Also occurred in prior years. ! May be different than sum of average number of days due to rounding.

50
SNOWIEST CALENDAR DAYS (May 1898 – December 2008)
Rank Amount* Date
1 21.8 January 11, 1930 2 19.2 February 2, 1919 3 19.0 November 29, 1933 4 18.6 December 30, 1915 5 15.0 February 24, 1987 5 15.0 January 31, 1922 5 15.0 March 8, 1901 8 14.5 March 16, 1930 8 14.5 December 10, 1898
10 14.0 March 12, 1922 10 14.0 January 27, 1918
SNOWIEST CONSECUTIVE TWO CALENDAR DAYS (May 1898 – December 2008)
Rank Amount* Dates
1 29.8 January 11 – 12, 1930 2 26.3 December 30 – 31, 1915 3 26.0 February 24 – 25, 1987 4 22.5 February 14 – 15, 1932 4 22.5 January 10 – 11, 1930 6 21.4 December 29 – 30, 1915 7 21.0 December 14 – 15, 1967 7 21.0 November 29 – 30, 1933 9 20.5 March 16 – 17, 1930
10 18.5 January 7 – 8, 1937 11 17.7 December 9 – 10, 1931 12 17.0 January 12 – 13, 1930 13 16.5 March 20 – 21, 1991 14 16.4 December 12 – 13, 1932
* All values in inches.
51
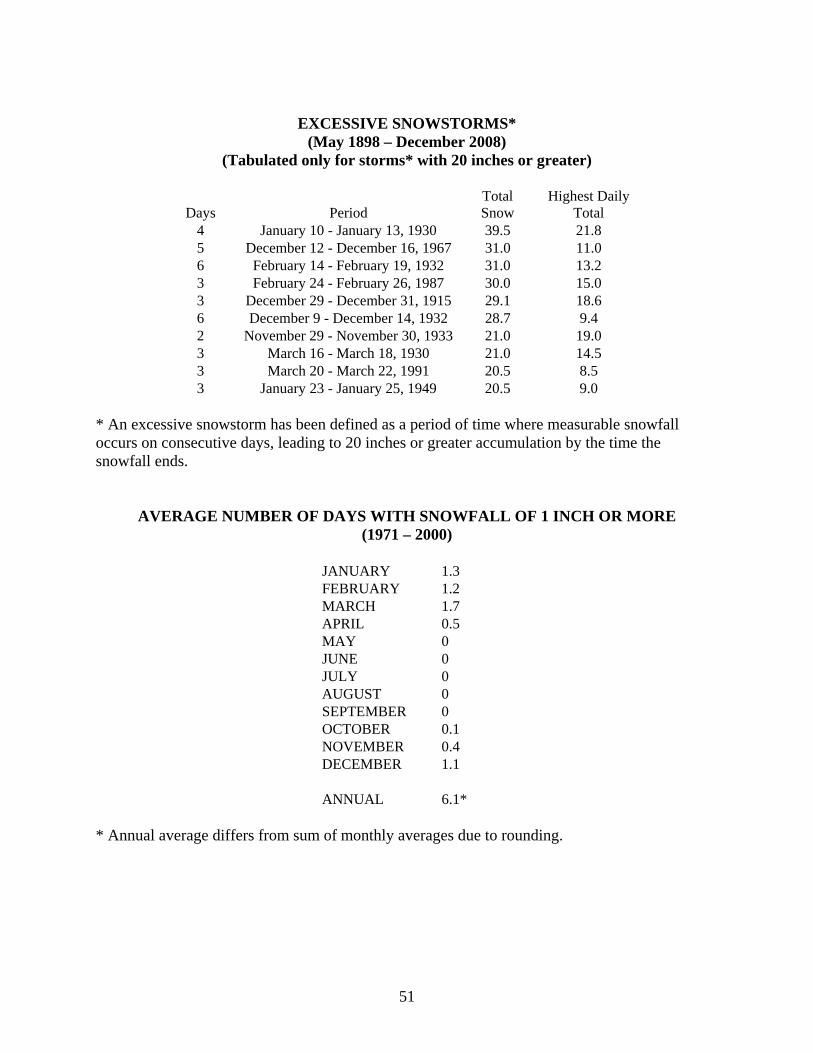
EXCESSIVE SNOWSTORMS*
(May 1898 – December 2008) (Tabulated only for storms* with 20 inches or greater)
Days Period Total Snow
Highest Daily Total
4 January 10 - January 13, 1930 39.5 21.8 5 December 12 - December 16, 1967 31.0 11.0 6 February 14 - February 19, 1932 31.0 13.2 3 February 24 - February 26, 1987 30.0 15.0 3 December 29 - December 31, 1915 29.1 18.6 6 December 9 - December 14, 1932 28.7 9.4 2 November 29 - November 30, 1933 21.0 19.0 3 March 16 - March 18, 1930 21.0 14.5 3 March 20 - March 22, 1991 20.5 8.5 3 January 23 - January 25, 1949 20.5 9.0
* An excessive snowstorm has been defined as a period of time where measurable snowfall occurs on consecutive days, leading to 20 inches or greater accumulation by the time the snowfall ends.
AVERAGE NUMBER OF DAYS WITH SNOWFALL OF 1 INCH OR MORE (1971 – 2000)
JANUARY 1.3 FEBRUARY 1.2 MARCH 1.7 APRIL 0.5 MAY 0 JUNE 0 JULY 0 AUGUST 0 SEPTEMBER 0 OCTOBER 0.1 NOVEMBER 0.4 DECEMBER 1.1 ANNUAL 6.1*
* Annual average differs from sum of monthly averages due to rounding.

52
IV. MISCELLANEOUS INFORMATION
53
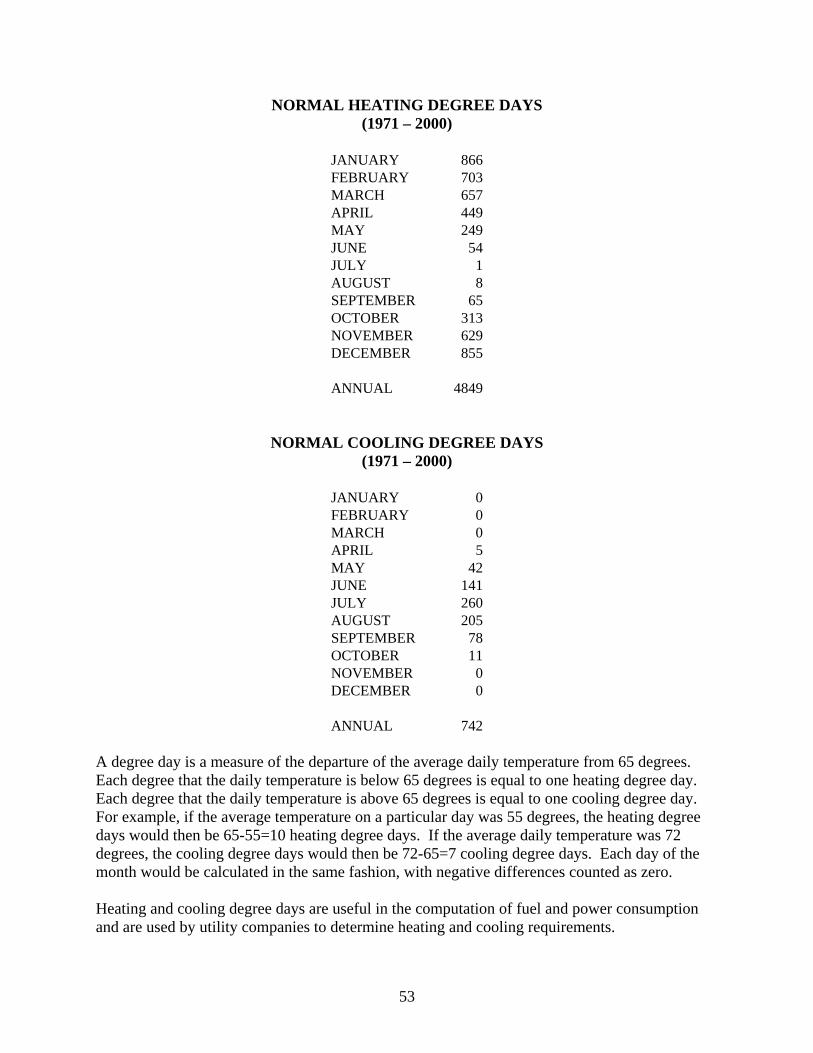
NORMAL HEATING DEGREE DAYS (1971 – 2000)
JANUARY 866FEBRUARY 703MARCH 657APRIL 449MAY 249JUNE 54JULY 1AUGUST 8SEPTEMBER 65OCTOBER 313NOVEMBER 629DECEMBER 855 ANNUAL 4849
NORMAL COOLING DEGREE DAYS (1971 – 2000)
JANUARY 0FEBRUARY 0MARCH 0APRIL 5MAY 42JUNE 141JULY 260AUGUST 205SEPTEMBER 78OCTOBER 11NOVEMBER 0DECEMBER 0 ANNUAL 742
A degree day is a measure of the departure of the average daily temperature from 65 degrees. Each degree that the daily temperature is below 65 degrees is equal to one heating degree day. Each degree that the daily temperature is above 65 degrees is equal to one cooling degree day. For example, if the average temperature on a particular day was 55 degrees, the heating degree days would then be 65-55=10 heating degree days. If the average daily temperature was 72 degrees, the cooling degree days would then be 72-65=7 cooling degree days. Each day of the month would be calculated in the same fashion, with negative differences counted as zero. Heating and cooling degree days are useful in the computation of fuel and power consumption and are used by utility companies to determine heating and cooling requirements.

54
MONSOON STATISTICS
(1948 – 2008) (based on Phoenix Official Monsoon Data)
Average Starting Date of the Monsoon….…July 7 Average Ending Date of Monsoon…September 13
Based on criteria of three consecutive days with average dew point temperatures in Phoenix of 55 degrees or greater.
EARLIEST AND LATEST START DATES FOR THE MONSOON SEASON (1948 – 2007)
(based on Phoenix Official Monsoon Data)
Earliest Start Date Latest Start Date
June 17, 2000 July 25, 1987 June 19, 1958 July 21, 1997 June 21, 2001 July 21, 1960 June 23, 1954 July 19, 2007 June 25, 1999 July 19, 1980 June 25, 1984 July 19, 1963 June 27, 1966 July 18, 2005 June 27, 1962 July 18, 2003 June 28, 1959 July 17, 1994 June 29, 1990! July 17, 1979
EARLIEST AND LATEST END DATES FOR THE MONSOON SEASON
(1948 – 2008) (based on Phoenix Official Monsoon Data)
Earliest End Date Latest End Date
August 19, 2004 October 10, 1983 August 19, 1979 October 10, 1977 August 22, 1973 October 8, 1966 August 22, 1962 October 5, 1984 August 27, 1956 September 28, 1976 August 30, 1957 September 28, 1974 August 31, 2000 September 26, 1982 August 31, 1953 September 25, 1990
September 1, 1948 September 24, 1981 September 2, 1988! September 24, 1952
! Also occurred in prior year(s).

55
NORMALS
PRESCOTT, AZ
1971 to 2000
Latitude: 34º 34’ N Longitude: 112º 25’ W Elevation: 5205 Feet
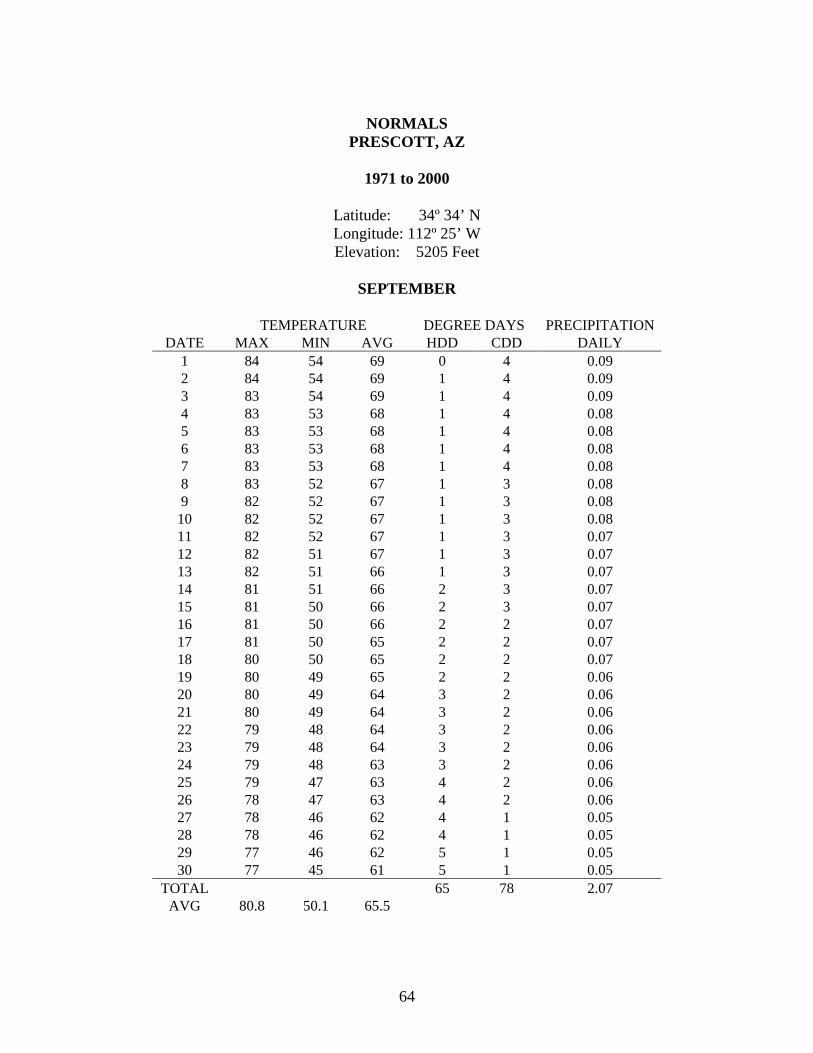
The daily values presented in these tables are not simple means of observed daily values. They are interpolated using a much less variable set of monthly normals calculated using the natural spline function. In leap years, use the February 28th values for the 29th, and adjust the heating degree monthly totals accordingly. Daily precipitation normals were also computed using the natural spline function and do not exhibit the typical daily random fluctuations. However, they may be used to compute normal precipitation over time intervals.
56
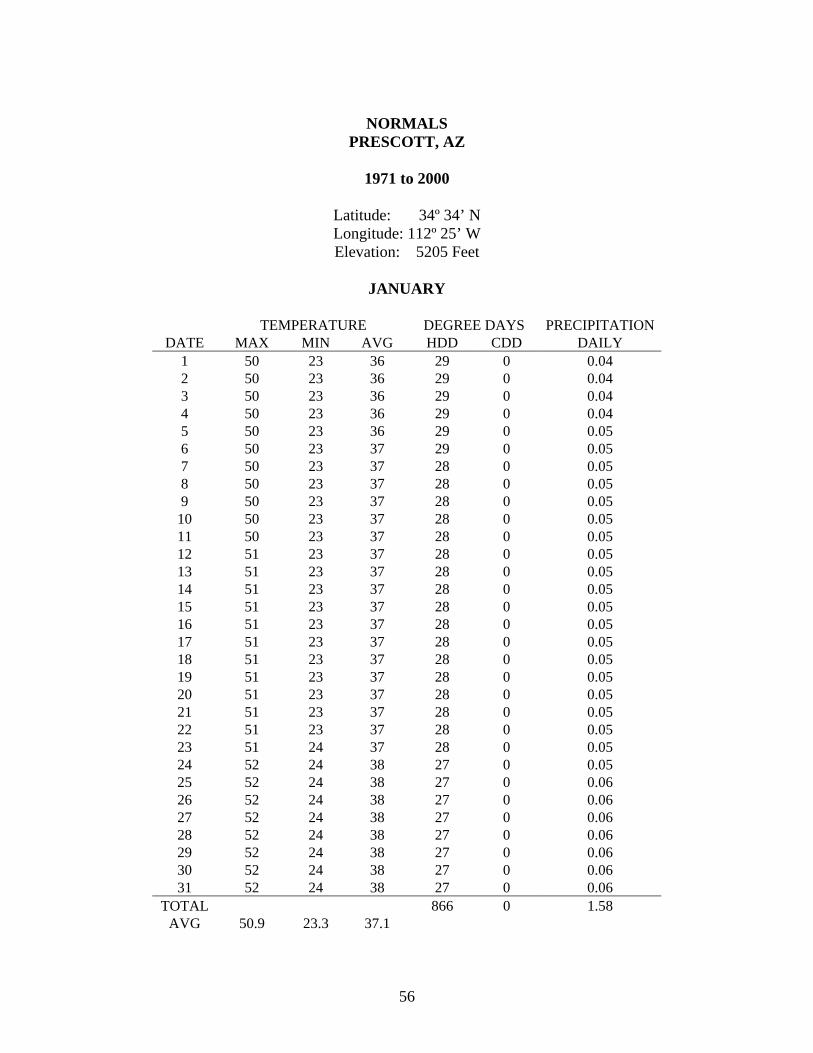
NORMALS
PRESCOTT, AZ
1971 to 2000
Latitude: 34º 34’ N Longitude: 112º 25’ W Elevation: 5205 Feet
JANUARY
TEMPERATURE DEGREE DAYS PRECIPITATION
DATE MAX MIN AVG HDD CDD DAILY 1 50 23 36 29 0 0.04 2 50 23 36 29 0 0.04 3 50 23 36 29 0 0.04 4 50 23 36 29 0 0.04 5 50 23 36 29 0 0.05 6 50 23 37 29 0 0.05 7 50 23 37 28 0 0.05 8 50 23 37 28 0 0.05 9 50 23 37 28 0 0.05
10 50 23 37 28 0 0.05 11 50 23 37 28 0 0.05 12 51 23 37 28 0 0.05 13 51 23 37 28 0 0.05 14 51 23 37 28 0 0.05 15 51 23 37 28 0 0.05 16 51 23 37 28 0 0.05 17 51 23 37 28 0 0.05 18 51 23 37 28 0 0.05 19 51 23 37 28 0 0.05 20 51 23 37 28 0 0.05 21 51 23 37 28 0 0.05 22 51 23 37 28 0 0.05 23 51 24 37 28 0 0.05 24 52 24 38 27 0 0.05 25 52 24 38 27 0 0.06 26 52 24 38 27 0 0.06 27 52 24 38 27 0 0.06 28 52 24 38 27 0 0.06 29 52 24 38 27 0 0.06 30 52 24 38 27 0 0.06 31 52 24 38 27 0 0.06
TOTAL 866 0 1.58 AVG 50.9 23.3 37.1
57
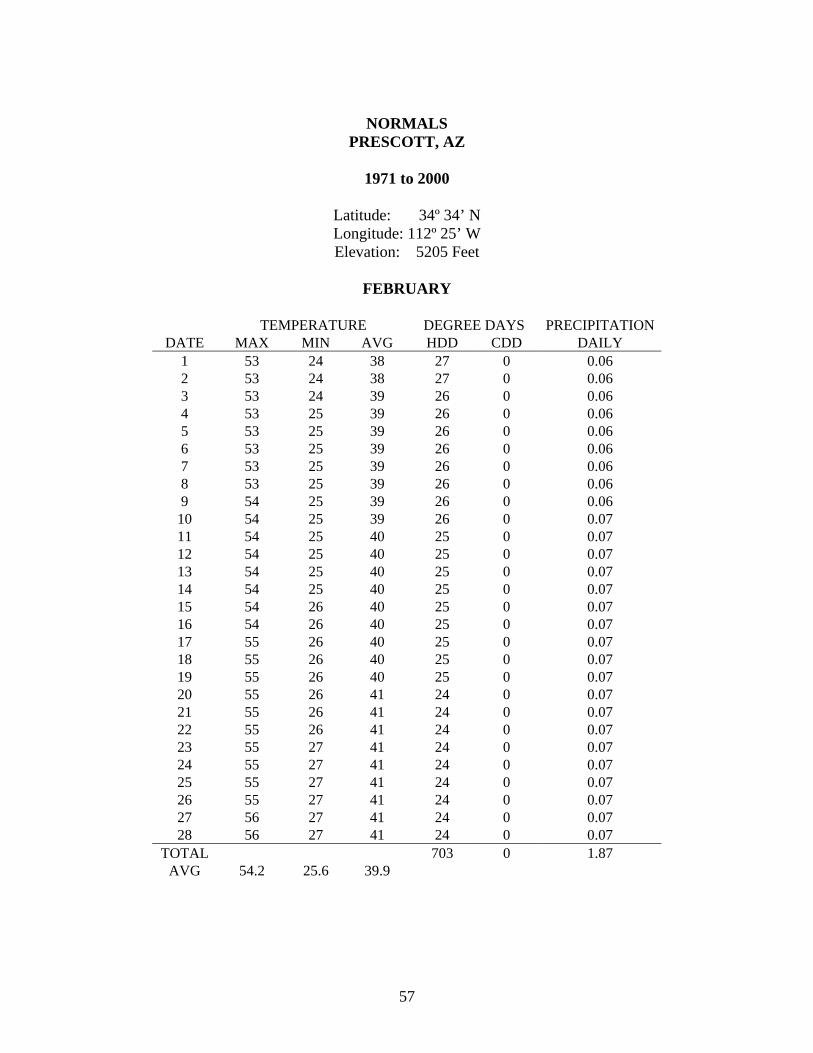
NORMALS
PRESCOTT, AZ
1971 to 2000
Latitude: 34º 34’ N Longitude: 112º 25’ W Elevation: 5205 Feet
FEBRUARY
TEMPERATURE DEGREE DAYS PRECIPITATION
DATE MAX MIN AVG HDD CDD DAILY 1 53 24 38 27 0 0.06 2 53 24 38 27 0 0.06 3 53 24 39 26 0 0.06 4 53 25 39 26 0 0.06 5 53 25 39 26 0 0.06 6 53 25 39 26 0 0.06 7 53 25 39 26 0 0.06 8 53 25 39 26 0 0.06 9 54 25 39 26 0 0.06
10 54 25 39 26 0 0.07 11 54 25 40 25 0 0.07 12 54 25 40 25 0 0.07 13 54 25 40 25 0 0.07 14 54 25 40 25 0 0.07 15 54 26 40 25 0 0.07 16 54 26 40 25 0 0.07 17 55 26 40 25 0 0.07 18 55 26 40 25 0 0.07 19 55 26 40 25 0 0.07 20 55 26 41 24 0 0.07 21 55 26 41 24 0 0.07 22 55 26 41 24 0 0.07 23 55 27 41 24 0 0.07 24 55 27 41 24 0 0.07 25 55 27 41 24 0 0.07 26 55 27 41 24 0 0.07 27 56 27 41 24 0 0.07 28 56 27 41 24 0 0.07
TOTAL 703 0 1.87 AVG 54.2 25.6 39.9

58
NORMALS
PRESCOTT, AZ
1971 to 2000
Latitude: 34º 34’ N Longitude: 112º 25’ W Elevation: 5205 Feet
MARCH
TEMPERATURE DEGREE DAYS PRECIPITATION
DATE MAX MIN AVG HDD CDD DAILY 1 56 27 42 23 0 0.07 2 56 28 42 23 0 0.07 3 56 28 42 23 0 0.07 4 56 28 42 23 0 0.07 5 56 28 42 23 0 0.07 6 56 28 42 23 0 0.07 7 56 28 42 23 0 0.07 8 56 28 42 23 0 0.07 9 57 29 43 22 0 0.07
10 57 29 43 22 0 0.07 11 57 29 43 22 0 0.07 12 57 29 43 22 0 0.07 13 57 29 43 22 0 0.07 14 57 29 43 22 0 0.07 15 57 30 43 22 0 0.07 16 58 30 44 21 0 0.06 17 58 30 44 21 0 0.06 18 58 30 44 21 0 0.06 19 58 30 44 21 0 0.06 20 58 30 44 21 0 0.06 21 59 30 45 20 0 0.06 22 59 31 45 20 0 0.06 23 59 31 45 20 0 0.06 24 59 31 45 20 0 0.05 25 59 31 45 20 0 0.05 26 60 31 45 20 0 0.05 27 60 31 46 19 0 0.05 28 60 32 46 19 0 0.05 29 61 32 46 19 0 0.05 30 61 32 46 19 0 0.04 31 61 32 47 18 0 0.04
TOTAL 657 0 1.91 AVG 57.9 29.7 43.8

59
NORMALS
PRESCOTT, AZ
1971 to 2000
Latitude: 34º 34’ N Longitude: 112º 25’ W Elevation: 5205 Feet
APRIL
TEMPERATURE DEGREE DAYS PRECIPITATION
DATE MAX MIN AVG HDD CDD DAILY 1 61 32 47 18 0 0.04 2 62 32 47 18 0 0.04 3 62 33 47 18 0 0.04 4 62 33 47 18 0 0.04 5 62 33 48 17 0 0.03 6 63 33 48 17 0 0.03 7 63 33 48 17 0 0.03 8 63 34 48 17 0 0.03 9 64 34 49 16 0 0.03
10 64 34 49 16 0 0.03 11 64 34 49 16 0 0.03 12 64 34 49 16 0 0.03 13 65 35 50 16 0 0.02 14 65 35 50 15 0 0.02 15 65 35 50 15 0 0.02 16 65 35 50 15 0 0.02 17 66 35 51 15 0 0.02 18 66 36 51 14 0 0.02 19 66 36 51 14 0 0.02 20 66 36 51 14 0 0.02 21 67 36 52 14 0 0.02 22 67 37 52 13 0 0.02 23 67 37 52 13 0 0.02 24 67 37 52 13 0 0.02 25 68 37 52 13 0 0.02 26 68 37 53 13 1 0.02 27 68 38 53 12 1 0.02 28 68 38 53 12 1 0.02 29 69 38 53 12 1 0.02 30 69 39 54 12 1 0.02
TOTAL 449 5 0.76 AVG 65.2 35.2 50.2

60
NORMALS PRESCOTT, AZ
1971 to 2000
Latitude: 34º 34’ N Longitude: 112º 25’ W Elevation: 5205 Feet
MAY
TEMPERATURE DEGREE DAYS PRECIPITATION
DATE MAX MIN AVG HDD CDD DAILY 1 69 39 54 11 0 0.02 2 69 39 54 11 0 0.02 3 70 39 55 11 1 0.02 4 70 40 55 11 1 0.02 5 70 40 55 11 1 0.02 6 70 40 55 10 1 0.02 7 71 40 56 10 1 0.03 8 71 41 56 10 1 0.03 9 71 41 56 10 1 0.03
10 72 41 56 9 1 0.03 11 72 41 57 9 1 0.03 12 72 42 57 9 1 0.03 13 73 42 57 9 1 0.03 14 73 42 58 9 1 0.02 15 73 43 58 8 1 0.02 16 74 43 58 8 1 0.02 17 74 43 58 8 1 0.02 18 74 43 59 8 1 0.02 19 75 44 59 7 1 0.02 20 75 44 59 7 2 0.02 21 75 44 60 7 2 0.02 22 76 44 60 7 2 0.02 23 76 45 60 6 2 0.02 24 76 45 61 6 2 0.02 25 77 45 61 6 2 0.02 26 77 45 61 6 2 0.02 27 78 46 62 5 2 0.01 28 78 46 62 5 2 0.01 29 79 46 62 5 2 0.01 30 79 47 63 5 2 0.01 31 79 47 63 5 3 0.01
TOTAL 249 42 0.64 AVG 73.8 42.8 58.3

61
NORMALS PRESCOTT, AZ
1971 to 2000
Latitude: 34º 34’ N Longitude: 112º 25’ W Elevation: 5205 Feet
JUNE
TEMPERATURE DEGREE DAYS PRECIPITATION
DATE MAX MIN AVG HDD CDD DAILY 1 80 47 63 4 3 0.01 2 80 47 64 4 3 0.01 3 81 48 64 4 3 0.00 4 81 48 65 4 3 0.00 5 81 48 65 3 3 0.00 6 82 48 65 3 3 0.00 7 82 49 65 3 3 0.00 8 83 49 66 3 4 0.00 9 83 49 66 3 4 0.00
10 83 50 66 2 4 0.00 11 84 50 67 2 4 0.00 12 84 50 67 2 4 0.00 13 84 50 67 2 4 0.00 14 85 51 68 2 4 0.00 15 85 51 68 2 5 0.01 16 85 51 68 1 5 0.01 17 85 52 69 1 5 0.01 18 86 52 69 1 5 0.01 19 86 52 69 1 5 0.01 20 86 52 69 1 5 0.01 21 86 53 70 1 5 0.02 22 87 53 70 1 6 0.02 23 87 53 70 1 6 0.02 24 87 54 70 1 6 0.03 25 87 54 71 1 6 0.03 26 87 54 71 1 6 0.03 27 87 55 71 0 6 0.04 28 88 55 71 0 7 0.04 29 88 55 71 0 7 0.04 30 88 56 72 0 7 0.05
TOTAL 54 141 0.40 AVG 84.6 51.2 67.9

62
NORMALS
PRESCOTT, AZ
1971 to 2000
Latitude: 34º 34’ N Longitude: 112º 25’ W Elevation: 5205 Feet
JULY
TEMPERATURE DEGREE DAYS PRECIPITATION
DATE MAX MIN AVG HDD CDD DAILY 1 88 56 72 1 7 0.05 2 88 56 72 0 7 0.06 3 88 57 72 0 7 0.06 4 88 57 72 0 8 0.06 5 88 57 73 0 8 0.07 6 88 57 73 0 8 0.07 7 88 58 73 0 8 0.07 8 88 58 73 0 8 0.08 9 88 58 73 0 8 0.08
10 88 58 73 0 8 0.08 11 89 58 73 0 8 0.09 12 89 58 73 0 8 0.09 13 89 59 74 0 8 0.09 14 89 59 74 0 9 0.09 15 89 59 74 0 9 0.10 16 89 59 74 0 9 0.10 17 89 59 74 0 9 0.10 18 89 59 74 0 9 0.10 19 89 59 74 0 9 0.10 20 88 59 74 0 9 0.11 21 88 59 74 0 9 0.11 22 88 59 74 0 9 0.11 23 88 60 74 0 9 0.11 24 88 60 74 0 9 0.11 25 88 60 74 0 9 0.11 26 88 59 74 0 9 0.11 27 88 59 74 0 9 0.11 28 88 59 74 0 9 0.11 29 88 59 74 0 8 0.11 30 88 59 73 0 8 0.11 31 88 59 73 0 8 0.12
TOTAL 1 260 2.87 AVG 88.3 58.5 73.4

63
NORMALS
PRESCOTT, AZ
1971 to 2000
Latitude: 34º 34’ N Longitude: 112º 25’ W Elevation: 5205 Feet
AUGUST
TEMPERATURE DEGREE DAYS PRECIPITATION
DATE MAX MIN AVG HDD CDD DAILY 1 88 59 73 0 8 0.12 2 87 59 73 0 8 0.11 3 87 59 73 0 8 0.11 4 87 59 73 0 8 0.11 5 87 59 73 0 8 0.11 6 87 59 73 0 8 0.11 7 87 58 73 0 8 0.11 8 87 58 73 0 8 0.11 9 87 58 72 0 8 0.11
10 86 58 72 0 7 0.11 11 86 58 72 0 7 0.11 12 86 58 72 0 7 0.11 13 86 58 72 0 7 0.11 14 86 57 72 0 7 0.11 15 86 57 72 0 7 0.11 16 86 57 72 0 7 0.11 17 86 57 71 0 7 0.11 18 86 57 71 0 6 0.11 19 85 57 71 0 6 0.11 20 85 56 71 0 6 0.11 21 85 56 71 0 6 0.10 22 85 56 71 0 6 0.10 23 85 56 70 0 6 0.10 24 85 56 70 1 6 0.10 25 85 56 70 1 5 0.10 26 84 55 70 1 5 0.10 27 84 55 70 1 5 0.10 28 84 55 70 1 5 0.10 29 84 55 69 1 5 0.09 30 84 55 69 1 5 0.09 31 84 54 69 1 5 0.09
TOTAL 8 205 3.28 AVG 85.7 57.0 71.4
64
NORMALS
PRESCOTT, AZ
1971 to 2000
Latitude: 34º 34’ N Longitude: 112º 25’ W Elevation: 5205 Feet
SEPTEMBER
TEMPERATURE DEGREE DAYS PRECIPITATION
DATE MAX MIN AVG HDD CDD DAILY 1 84 54 69 0 4 0.09 2 84 54 69 1 4 0.09 3 83 54 69 1 4 0.09 4 83 53 68 1 4 0.08 5 83 53 68 1 4 0.08 6 83 53 68 1 4 0.08 7 83 53 68 1 4 0.08 8 83 52 67 1 3 0.08 9 82 52 67 1 3 0.08
10 82 52 67 1 3 0.08 11 82 52 67 1 3 0.07 12 82 51 67 1 3 0.07 13 82 51 66 1 3 0.07 14 81 51 66 2 3 0.07 15 81 50 66 2 3 0.07 16 81 50 66 2 2 0.07 17 81 50 65 2 2 0.07 18 80 50 65 2 2 0.07 19 80 49 65 2 2 0.06 20 80 49 64 3 2 0.06 21 80 49 64 3 2 0.06 22 79 48 64 3 2 0.06 23 79 48 64 3 2 0.06 24 79 48 63 3 2 0.06 25 79 47 63 4 2 0.06 26 78 47 63 4 2 0.06 27 78 46 62 4 1 0.05 28 78 46 62 4 1 0.05 29 77 46 62 5 1 0.05 30 77 45 61 5 1 0.05
TOTAL 65 78 2.07 AVG 80.8 50.1 65.5

65
NORMALS
PRESCOTT, AZ
1971 to 2000
Latitude: 34º 34’ N Longitude: 112º 25’ W Elevation: 5205 Feet
OCTOBER
TEMPERATURE DEGREE DAYS PRECIPITATION
DATE MAX MIN AVG HDD CDD DAILY 1 77 45 61 5 1 0.05 2 76 45 61 5 1 0.05 3 76 44 60 6 1 0.05 4 76 44 60 6 1 0.05 5 75 43 59 6 1 0.04 6 75 43 59 7 1 0.04 7 75 43 59 7 1 0.04 8 74 42 58 7 1 0.04 9 74 42 58 8 1 0.04
10 74 41 58 8 1 0.04 11 73 41 57 8 1 0.04 12 73 41 57 9 0 0.04 13 73 40 57 9 0 0.04 14 72 40 56 9 0 0.04 15 72 39 56 10 0 0.04 16 72 39 55 10 0 0.04 17 71 39 55 10 0 0.04 18 71 38 55 11 0 0.04 19 70 38 54 11 0 0.04 20 70 38 54 11 0 0.04 21 70 37 53 12 0 0.04 22 69 37 53 12 0 0.04 23 69 36 53 12 0 0.04 24 68 36 52 13 0 0.04 25 68 36 52 13 0 0.04 26 68 35 51 14 0 0.04 27 67 35 51 14 0 0.04 28 67 34 51 14 0 0.04 29 66 34 50 15 0 0.04 30 66 34 50 15 0 0.04 31 66 33 49 16 0 0.04
TOTAL 313 11 1.28 AVG 71.4 39.1 55.3

66
NORMALS
PRESCOTT, AZ
1971 to 2000
Latitude: 34º 34’ N Longitude: 112º 25’ W Elevation: 5205 Feet
NOVEMBER
TEMPERATURE DEGREE DAYS PRECIPITATION
DATE MAX MIN AVG HDD CDD DAILY 1 65 33 49 16 0 0.04 2 65 33 49 16 0 0.04 3 64 32 48 17 0 0.04 4 64 32 48 17 0 0.04 5 63 32 48 18 0 0.04 6 63 31 47 18 0 0.04 7 63 31 47 18 0 0.04 8 62 30 46 19 0 0.04 9 62 30 46 19 0 0.04
10 61 30 46 19 0 0.04 11 61 30 45 20 0 0.04 12 61 29 45 20 0 0.04 13 60 29 45 20 0 0.04 14 60 29 44 21 0 0.04 15 60 28 44 21 0 0.04 16 59 28 44 21 0 0.04 17 59 28 43 22 0 0.04 18 59 28 43 22 0 0.05 19 58 27 43 22 0 0.05 20 58 27 43 23 0 0.05 21 57 27 42 23 0 0.05 22 57 27 42 23 0 0.05 23 57 26 42 23 0 0.04 24 57 26 41 24 0 0.04 25 56 26 41 24 0 0.04 26 56 26 41 24 0 0.04 27 56 26 41 24 0 0.04 28 55 25 40 25 0 0.04 29 55 25 40 25 0 0.04 30 55 25 40 25 0 0.04
TOTAL 629 0 1.25 AVG 59.6 28.5 44.1

67
NORMALS
PRESCOTT, AZ
1971 to 2000
Latitude: 34º 34’ N Longitude: 112º 25’ W Elevation: 5205 Feet
DECEMBER
TEMPERATURE DEGREE DAYS PRECIPITATION
DATE MAX MIN AVG HDD CDD DAILY 1 54 25 40 25 0 0.04 2 54 25 39 26 0 0.04 3 54 24 39 26 0 0.04 4 54 24 39 26 0 0.04 5 53 24 39 26 0 0.04 6 53 24 39 26 0 0.04 7 53 24 39 27 0 0.04 8 53 24 38 27 0 0.04 9 53 24 38 27 0 0.04
10 52 23 38 27 0 0.04 11 52 23 38 27 0 0.04 12 52 23 38 27 0 0.04 13 52 23 38 27 0 0.04 14 52 23 37 28 0 0.04 15 51 23 37 28 0 0.04 16 51 23 37 28 0 0.04 17 51 23 37 28 0 0.04 18 51 23 37 28 0 0.04 19 51 23 37 28 0 0.04 20 51 23 37 28 0 0.04 21 51 23 37 28 0 0.04 22 51 23 37 28 0 0.04 23 51 23 37 28 0 0.04 24 50 23 37 28 0 0.04 25 50 23 37 29 0 0.04 26 50 23 36 29 0 0.04 27 50 22 36 29 0 0.04 28 50 22 36 29 0 0.05 29 50 23 36 29 0 0.05 30 50 23 36 29 0 0.05 31 50 23 36 29 0 0.05
TOTAL 855 0 1.28 AVG 51.6 23.3 37.5

° , ° , Location: W112 28, N34 32
PRESCOTT, ARIZONA Rise and Set for the Sun for 2009
Mountain Standard Time
Astronomical Applications Dept. U.S. Naval Observatory Washington, DC 20392-5420
68
Jan. Feb. Mar. Apr. May June July Aug. Sept. Oct. Nov. Dec.
Day Rise Set Rise Set Rise Set Rise Set Rise Set Rise Set Rise Set Rise Set Rise Set Rise Set Rise Set Rise Set h m h m h m h m h m h m h m h m h m h m h m h m h m h m h m h m h m h m h m h m h m h m h m h m
01 0737 1731 0728 1800 0659 1826 0617 1851 0540 1915 0518 1938 0521 1947 0541 1931 0603 1856 0625 1814 0651 1736 0719 171902 0737 1731 0727 1801 0657 1827 0615 1852 0539 1916 0518 1938 0521 1946 0541 1931 0604 1854 0625 1812 0651 1735 0720 171903 0737 1732 0726 1802 0656 1828 0614 1853 0538 1916 0518 1939 0522 1946 0542 1930 0605 1853 0626 1811 0652 1734 0720 171904 0737 1733 1725 1803 0655 1829 0613 1854 0537 1917 0517 1939 0522 1946 0543 1929 0605 1852 0627 1809 0653 1733 0721 171905 0737 1734 0724 1804 0653 1830 0611 1854 0536 1915 0517 1940 0523 1946 0543 1928 0606 1850 028 1805 0654 1732 0722 171906 0737 1735 0724 1805 0652 1830 0610 1855 0535 1919 0517 1940 0523 1946 0544 1927 0607 1849 0629 1807 0655 1732 0723 171907 0737 1736 0723 1806 0651 1831 0608 1856 0534 1920 0517 1941 0524 1946 0545 1926 0607 1847 0629 1805 0656 1731 0724 171908 0737 1737 0722 1807 0650 1832 0607 1857 0533 1920 0517 1941 0524 1945 0546 1925 0608 1846 0630 1804 0657 1730 0724 171909 0737 1737 0721 1808 0648 1833 0606 1857 0532 1921 0517 1942 0525 1945 0546 1924 0609 1845 0631 1803 0658 1729 0725 171910 0737 1738 0720 1809 0647 1834 0605 1858 0531 1922 0517 1942 0526 1945 0547 1923 0610 1843 0632 1801 0659 1728 0726 172011 0737 1739 0719 1810 0646 1835 0603 1859 0530 1923 0517 1943 0526 1944 0548 1922 0610 1842 0632 1800 0700 1728 0727 172012 0737 1740 0718 1811 0644 1835 0602 1900 0529 1923 0517 1943 0527 1944 0549 1921 0611 1840 0633 1759 0701 1727 0727 172013 0737 1741 0717 1812 0643 1836 0601 1901 0529 1924 0517 1944 0527 1944 0549 1919 0612 1839 0634 1757 0702 1726 0728 172014 0737 1742 0716 1813 0641 1837 0559 1901 0528 1925 0517 1944 0528 1943 0550 1918 0612 1838 0635 1756 0703 1726 0729 172115 0736 1743 0715 1813 0640 1838 0558 1902 0527 1926 0517 1944 0529 1943 0551 1917 0613 1836 0636 1755 0704 1725 0729 172116 0736 1744 0714 1814 0639 1839 0557 1903 0526 1927 0517 1945 0529 1942 0552 1916 0614 1835 0637 1754 0705 1724 0730 172117 0736 1745 0713 1815 0637 1839 0556 1904 0526 1927 0517 1945 0530 1942 0552 1915 0615 1833 0637 1753 0706 1724 0731 172218 0735 1746 0712 1816 0636 1840 0554 1904 0525 1928 0517 1945 0531 1941 0553 1914 0615 1832 0638 1751 0707 1723 0731 172219 0735 1747 0711 1817 0635 1841 0553 1905 0524 1929 0517 1945 0531 1941 0554 1912 0616 1830 0639 1750 0708 1723 0732 172320 0735 1748 0709 1818 0633 1842 0552 1906 0524 1930 0517 1946 0532 1940 0555 1911 0617 1829 0640 1749 0709 1722 0732 172321 0734 1749 0708 1819 0632 1843 0551 1907 0523 1930 0518 1946 0533 1940 0555 1910 0617 1828 0641 1748 0709 1722 0733 172322 0734 1750 0707 1820 0630 1843 0550 1908 0523 1931 0518 1946 0533 1939 0556 1909 0618 1826 0642 1747 0710 1722 0733 172423 0733 1751 0706 1821 0629 1844 0548 1908 0522 1932 0518 1946 0534 1938 0557 1907 0619 1825 0642 1745 0711 1721 0734 172524 0733 1752 0705 1822 0628 1845 0547 1909 0521 1932 0518 1946 0535 1938 0557 1906 0620 1823 0643 1744 0712 1721 0734 172525 0732 1753 0704 1823 0626 1846 0546 1910 0521 1933 0519 1946 0535 1937 0558 1905 0620 1822 0644 1743 0713 1721 0735 172626 0732 1754 0702 1824 0625 1847 0545 1911 0521 1934 0519 1947 0536 1936 0559 1904 0621 1821 0645 1742 0714 1720 0735 172627 0731 1755 0701 1824 0623 1847 0544 1912 0520 1934 0519 1947 0537 1936 0600 1902 0622 1819 0646 1741 0715 1720 0735 172728 0730 1756 0700 1825 0622 1848 0543 1912 0520 1935 0520 1947 0538 1935 0600 1901 0623 1818 0647 1740 0716 1720 0736 172829 0730 1757 0621 1849 0542 1913 0519 1936 0520 1947 0538 1934 0601 1900 0623 1816 0648 1739 0717 1720 0736 172830 0729 1758 0619 1850 0541 1914 0519 1936 0521 1947 0539 1933 0602 1858 0624 1815 0649 1738 0718 1719 0736 172931 0728 1759 0618 1850 0519 1937 0540 1932 0603 1857 0650 1737 0737 1730

69
NOAA TECHNICAL MEMORANDA National Weather Service, Western Region Subseries The National Weather Service (NWS) Western Region (WR) Subseries provides an informal medium for the documentation and quick dissemination of results not appropriate, or not yet ready, for formal publication. The series is used to report on work in progress, to describe technical procedures and practices, or to relate
progress to a limited audience. These Technical Memoranda will report on investigations devoted primarily to regional and local problems of interest mainly to personnel, and hence will not be widely distributed. Papers 1 to 25 are in the former series, ESSA Technical Memoranda, Western Region Technical Memoranda (WRTM); papers 24 to 59 are in the former series, ESSA Technical Memoranda, Weather Bureau Technical Memoranda (WBTM). Beginning with 60, the papers are part of the series, NOAA Technical Memoranda NWS. Out-of-print memoranda are not listed. Papers 2 to 22, except for 5 (revised edition), are available from the National Weather Service Western Region, Scientific Services Division, 125 South State Street - Rm 1311, Salt Lake City, Utah 84138-1102. Paper 5 (revised edition), and all others beginning with 25 are available from the National Technical Information Service, U.S. Department of Commerce, Sills Building, 5285 Port Royal Road, Springfield, Virginia 22161. Prices vary for all paper copies; microfiche are $3.50. Order by accession number shown in parentheses at end of each entry. ESSA Technical Memoranda (WRTM) 2 Climatological Precipitation Probabilities. Compiled by Lucianne
Miller, December 1965. 3 Western Region Pre- and Post-FP-3 Program, December 1, 1965, to
February 20, 1966. Edward D. Diemer, March 1966. 5 Station Descriptions of Local Effects on Synoptic Weather Patterns.
Philip Williams, Jr., April 1966 (Revised November 1967, October 1969). (PB-17800)
8 Interpreting the RAREP. Herbert P. Benner, May 1966 (Revised January 1967).
11 Some Electrical Processes in the Atmosphere. J. Latham, June 1966. 17 A Digitalized Summary of Radar Echoes within 100 Miles of
Sacramento, California. J. A. Youngberg and L. B. Overaas, December 1966.
21 An Objective Aid for Forecasting the End of East Winds in the Columbia Gorge, July through October. D. John Coparanis, April 1967.
22 Derivation of Radar Horizons in Mountainous Terrain. Roger G. Pappas, April 1967.
ESSA Technical Memoranda, Weather Bureau Technical Memoranda (WBTM) 25 Verification of Operation Probability of Precipitation Forecasts, April
1966-March 1967. W. W. Dickey, October 1967. (PB-176240) 26 A Study of Winds in the Lake Mead Recreation Area. R. P. Augulis,
January 1968. (PB-177830) 28 Weather Extremes. R. J. Schmidli, April 1968 (Revised March 1986).
(PB86 177672/AS). (Revised October 1991 - PB92-115062/AS) 29 Small-Scale Analysis and Prediction. Philip Williams, Jr., May 1968.
(PB178425) 30 Numerical Weather Prediction and Synoptic Meteorology. CPT
Thomas D. Murphy, USAF, May 1968. (AD 673365) 31 Precipitation Detection Probabilities by Salt Lake ARTC Radars.
Robert K. Belesky, July 1968. (PB 179084) 32 Probability Forecasting--A Problem Analysis with Reference to the
Portland Fire Weather District. Harold S. Ayer, July 1968. (PB 179289)
36 Temperature Trends in Sacramento--Another Heat Island. Anthony D. Lentini, February 1969. (PB 183055)
37 Disposal of Logging Residues Without Damage to Air Quality. Owen P. Cramer, March 1969. (PB 183057)
39 Upper-Air Lows Over Northwestern United States. A.L. Jacobson, April 1969. PB 184296)
40 The Man-Machine Mix in Applied Weather Forecasting in the 1970s. L.W. Snellman, August 1969. (PB 185068)
43 Forecasting Maximum Temperatures at Helena, Montana. David E. Olsen, October 1969. (PB 185762)
44 Estimated Return Periods for Short-Duration Precipitation in Arizona. Paul C. Kangieser, October 1969. (PB 187763)
46 Applications of the Net Radiometer to Short-Range Fog and Stratus Forecasting at Eugene, Oregon. L. Yee and E. Bates, December 1969. (PB 190476)
47 Statistical Analysis as a Flood Routing Tool. Robert J.C. Burnash, December 1969. (PB 188744)
48 Tsunami. Richard P. Augulis, February 1970. (PB 190157) 49 Predicting Precipitation Type. Robert J.C. Burnash and Floyd E.
Hug, March 1970. (PB 190962)
50 Statistical Report on Aeroallergens (Pollens and Molds) Fort Huachuca, Arizona, 1969. Wayne S. Johnson, April 1970. (PB 191743)
51 Western Region Sea State and Surf Forecaster's Manual. Gordon C. Shields and Gerald B. Burdwell, July 1970. (PB 193102)
52 Sacramento Weather Radar Climatology. R.G. Pappas and C. M. Veliquette, July 1970. (PB 193347)
54 A Refinement of the Vorticity Field to Delineate Areas of Significant Precipitation. Barry B. Aronovitch, August 1970.
55 Application of the SSARR Model to a Basin without Discharge Record. Vail Schermerhorn and Donal W. Kuehl, August 1970. (PB 194394)
56 Areal Coverage of Precipitation in Northwestern Utah. Philip Williams, Jr., and Werner J. Heck, September 1970. (PB 194389)
57 Preliminary Report on Agricultural Field Burning vs. Atmospheric Visibility in the Willamette Valley of Oregon. Earl M. Bates and David O. Chilcote, September 1970. (PB 194710)
58 Air Pollution by Jet Aircraft at Seattle-Tacoma Airport. Wallace R. Donaldson, October 1970. (COM 71 00017)
59 Application of PE Model Forecast Parameters to Local-Area Forecasting. Leonard W. Snellman, October 1970. (COM 71 00016)
60 An Aid for Forecasting the Minimum Temperature at Medford, Oregon, Arthur W. Fritz, October 1970. (COM 71 00120)
63 700-mb Warm Air Advection as a Forecasting Tool for Montana and Northern Idaho. Norris E. Woerner, February 1971. (COM 71 00349)
64 Wind and Weather Regimes at Great Falls, Montana. Warren B. Price, March 1971.
65 Climate of Sacramento, California. Laura Masters-Bevan. NWSO Sacramento, November 1998 (6th Revision. (PB99-118424)
66 A Preliminary Report on Correlation of ARTCC Radar Echoes and Precipitation. Wilbur K. Hall, June 1971. (COM 71 00829)
69 National Weather Service Support to Soaring Activities. Ellis Burton, August 1971. (COM 71 00956)
71 Western Region Synoptic Analysis-Problems and Methods. Philip Williams, Jr., February 1972. (COM 72 10433)
74 Thunderstorms and Hail Days Probabilities in Nevada. Clarence M. Sakamoto, April 1972. (COM 72 10554)
75 A Study of the Low Level Jet Stream of the San Joaquin Valley. Ronald A. Willis and Philip Williams, Jr., May 1972. (COM 72 10707)
76 Monthly Climatological Charts of the Behavior of Fog and Low Stratus at Los Angeles International Airport. Donald M. Gales, July 1972. (COM 72 11140)
77 A Study of Radar Echo Distribution in Arizona During July and August. John E. Hales, Jr., July 1972. (COM 72 11136)
78 Forecasting Precipitation at Bakersfield, California, Using Pressure Gradient Vectors. Earl T. Riddiough, July 1972. (COM 72 11146)
79 Climate of Stockton, California. Robert C. Nelson, July 1972. (COM 72 10920)
80 Estimation of Number of Days Above or Below Selected Temperatures. Clarence M. Sakamoto, October 1972. (COM 72 10021)
81 An Aid for Forecasting Summer Maximum Temperatures at Seattle, Washington. Edgar G. Johnson, November 1972. (COM 73 10150)
82 Flash Flood Forecasting and Warning Program in the Western Region. Philip Williams, Jr., Chester L. Glenn, and Roland L. Raetz, December 1972, (Revised March 1978). (COM 73 10251)
83 A comparison of Manual and Semiautomatic Methods of Digitizing Analog Wind Records. Glenn E. Rasch, March 1973. (COM 73 10669)
86 Conditional Probabilities for Sequences of Wet Days at Phoenix, Arizona. Paul C. Kangieser, June 1973. (COM 73 11264)
87 A Refinement of the Use of K-Values in Forecasting Thunderstorms in Washington and Oregon. Robert Y.G. Lee, June 1973. (COM 73 11276)
89 Objective Forecast Precipitation Over the Western Region of the United States. Julia N. Paegle and Larry P. Kierulff, September 1973. (COM 73 11946/3AS)
91 Arizona "Eddy" Tornadoes. Robert S. Ingram, October 1973. (COM 73 10465)
92 Smoke Management in the Willamette Valley. Earl M. Bates, May 1974. (COM 74 11277/AS)
93 An Operational Evaluation of 500-mb Type Regression Equations. Alexander E. MacDonald, June 1974. (COM 74 11407/AS)
94 Conditional Probability of Visibility Less than One-Half Mile in Radiation Fog at Fresno, California. John D. Thomas, August 1974. (COM 74 11555/AS)
95 Climate of Flagstaff, Arizona. Paul W. Sorenson, and updated by Reginald W. Preston, January 1987. (PB87 143160/AS) (Revised August 2002 3rd Revision)
96 Map type Precipitation Probabilities for the Western Region. Glenn E. Rasch and Alexander E. MacDonald, February 1975. (COM 75 10428/AS)
97 Eastern Pacific Cut-Off Low of April 21-28, 1974. William J. Alder and George R. Miller, January 1976. (PB 250 711/AS)
98 Study on a Significant Precipitation Episode in Western United States. Ira S. Brenner, April 1976. (COM 75 10719/AS)
99 A Study of Flash Flood Susceptibility-A Basin in Southern Arizona. Gerald Williams, August 1975. (COM 75 11360/AS)
102 A Set of Rules for Forecasting Temperatures in Napa and Sonoma Counties. Wesley L. Tuft, October 1975. (PB 246 902/AS)

70
103 Application of the National Weather Service Flash-Flood Program in the Western Region. Gerald Williams, January 1976. (PB 253 053/AS)
104 Objective Aids for Forecasting Minimum Temperatures at Reno, Nevada, During the Summer Months. Christopher D. Hill, January 1976. (PB 252 866/AS)
105 Forecasting the Mono Wind. Charles P. Ruscha, Jr., February 1976. (PB 254 650)
106 Use of MOS Forecast Parameters in Temperature Forecasting. John C. Plankinton, Jr., March 1976. (PB 254 649)
107 Map Types as Aids in Using MOS PoPs in Western United States. Ira S. Brenner, August 1976. (PB 259 594)
108 Other Kinds of Wind Shear. Christopher D. Hill, August 1976. (PB 260 437/AS)
109 Forecasting North Winds in the Upper Sacramento Valley and Adjoining Forests. Christopher E. Fontana, September 1976. (PB 273 677/AS)
110 Cool Inflow as a Weakening Influence on Eastern Pacific Tropical Cyclones. William J. Denney, November 1976. (PB 264 655/AS)
112 The MAN/MOS Program. Alexander E. MacDonald, February 1977. (PB 265 941/AS)
113 Winter Season Minimum Temperature Formula for Bakersfield, California, Using Multiple Regression. Michael J. Oard, February 1977. (PB 273 694/AS)
114 Tropical Cyclone Kathleen. James R. Fors, February 1977. (PB 273 676/AS)
116 A Study of Wind Gusts on Lake Mead. Bradley Colman, April 1977. (PB 268 847)
117 The Relative Frequency of Cumulonimbus Clouds at the Nevada Test Site as a Function of K-Value. R.F. Quiring, April 1977. (PB 272 831)
118 Moisture Distribution Modification by Upward Vertical Motion. Ira S. Brenner, April 1977. (PB 268 740)
119 Relative Frequency of Occurrence of Warm Season Echo Activity as a Function of Stability Indices Computed from the Yucca Flat, Nevada, Rawinsonde. Darryl Randerson, June 1977. (PB 271 290/AS)
121 Climatological Prediction of Cumulonimbus Clouds in the Vicinity of the Yucca Flat Weather Station. R.F. Quiring, June 1977. (PB 271 704/AS)
122 A Method for Transforming Temperature Distribution to Normality. Morris S. Webb, Jr., June 1977. (PB 271 742/AS)
124 Statistical Guidance for Prediction of Eastern North Pacific Tropical Cyclone Motion - Part I. Charles J. Neumann and Preston W. Leftwich, August 1977. (PB 272 661)
125 Statistical Guidance on the Prediction of Eastern North Pacific Tropical Cyclone Motion - Part II. Preston W. Leftwich and Charles J. Neumann, August 1977. (PB 273 155/AS)
126 Climate of San Francisco. E. Jan Null, February 1978. (Revised by George T. Pericht, April 1988 and January 1995). (PB88 208624/AS)
127 Development of a Probability Equation for Winter-Type Precipitation Patterns in Great Falls, Montana. Kenneth B. Mielke, February 1978. (PB 281 387/AS)
128 Hand Calculator Program to Compute Parcel Thermal Dynamics. Dan Gudgel, April 1978. (PB 283 080/AS)
129 Fire whirls. David W. Goens, May 1978. (PB 283 866/AS) 130 Flash-Flood Procedure. Ralph C. Hatch and Gerald Williams, May
1978. (PB 286 014/AS) 131 Automated Fire-Weather Forecasts. Mark A. Mollner and David E.
Olsen, September 1978. (PB 289 916/AS) 132 Estimates of the Effects of Terrain Blocking on the Los Angeles
WSR-74C Weather Radar. R.G. Pappas, R.Y. Lee, B.W. Finke, October 1978. (PB 289767/AS)
133 Spectral Techniques in Ocean Wave Forecasting. John A. Jannuzzi, October 1978. (PB291317/AS)
134 Solar Radiation. John A. Jannuzzi, November 1978. (PB291195/AS)
135 Application of a Spectrum Analyzer in Forecasting Ocean Swell in Southern California Coastal Waters. Lawrence P. Kierulff, January 1979. (PB292716/AS)
136 Basic Hydrologic Principles. Thomas L. Dietrich, January 1979. (PB292247/AS)
137 LFM 24-Hour Prediction of Eastern Pacific Cyclones Refined by Satellite Images. John R. Zimmerman and Charles P. Ruscha, Jr., January 1979. (PB294324/AS)
138 A Simple Analysis/Diagnosis System for Real Time Evaluation of Vertical Motion. Scott Heflick and James R. Fors, February 1979. (PB294216/AS)
139 Aids for Forecasting Minimum Temperature in the Wenatchee Frost District. Robert S. Robinson, April 1979. (PB298339/AS)
140 Influence of Cloudiness on Summertime Temperatures in the Eastern Washington Fire Weather district. James Holcomb, April 1979. (PB298674/AS)
141 Comparison of LFM and MFM Precipitation Guidance for Nevada During Doreen. Christopher Hill, April 1979. (PB298613/AS)
142 The Usefulness of Data from Mountaintop Fire Lookout Stations in Determining Atmospheric Stability. Jonathan W. Corey, April 1979. (PB298899/AS)
143 The Depth of the Marine Layer at San Diego as Related to Subsequent Cool Season Precipitation Episodes in Arizona. Ira S. Brenner, May 1979. (PB298817/AS)
144 Arizona Cool Season Climatological Surface Wind and Pressure Gradient Study. Ira S. Brenner, May 1979. (PB298900/AS)
146 The BART Experiment. Morris S. Webb, October 1979. (PB80 155112)
147 Occurrence and Distribution of Flash Floods in the Western Region. Thomas L. Dietrich, December 1979. (PB80 160344)
149 Misinterpretations of Precipitation Probability Forecasts. Allan H. Murphy, Sarah Lichtenstein, Baruch Fischhoff, and Robert L. Winkler, February 1980. (PB80 174576)
150 Annual Data and Verification Tabulation - Eastern and Central North Pacific Tropical Storms and Hurricanes 1979. Emil B. Gunther and Staff, EPHC, April 1980. (PB80 220486)
151 NMC Model Performance in the Northeast Pacific. James E. Overland, PMEL-ERL, April 1980. (PB80 196033)
152 Climate of Salt Lake City, Utah. William J. Alder, Sean T. Buchanan, William Cope (Retired), James A. Cisco, Craig C. Schmidt, Alexander R. Smith (Retired), Wilbur E. Figgins (Retired), February 1998 - Seventh Revision (PB98-130727)
153 An Automatic Lightning Detection System in Northern California. James E. Rea and Chris E. Fontana, June 1980. (PB80 225592)
154 Regression Equation for the Peak Wind Gust 6 to 12 Hours in Advance at Great Falls During Strong Downslope Wind Storms. Michael J. Oard, July 1980. (PB91 108367)
155 A Raininess Index for the Arizona Monsoon. John H. Ten Harkel, July 1980. (PB81 106494)
156 The Effects of Terrain Distribution on Summer Thunderstorm Activity at Reno, Nevada. Christopher Dean Hill, July 1980. (PB81 102501)
157 An Operational Evaluation of the Scofield/Oliver Technique for Estimating Precipitation Rates from Satellite Imagery. Richard Ochoa, August 1980. (PB81 108227)
158 Hydrology Practicum. Thomas Dietrich, September 1980. (PB81 134033)
159 Tropical Cyclone Effects on California. Arnold Court, October 1980. (PB81 133779)
160 Eastern North Pacific Tropical Cyclone Occurrences During Intraseasonal Periods. Preston W. Leftwich and Gail M. Brown, February 1981. (PB81 205494)
161 Solar Radiation as a Sole Source of Energy for Photovoltaics in Las Vegas, Nevada, for July and December. Darryl Randerson, April 1981. (PB81 224503)
162 A Systems Approach to Real-Time Runoff Analysis with a Deterministic Rainfall-Runoff Model. Robert J.C. Burnash and R. Larry Ferral, April 1981. (PB81 224495)
163 A Comparison of Two Methods for Forecasting Thunderstorms at Luke Air Force Base, Arizona. LTC Keith R. Cooley, April 1981. (PB81 225393)
164 An Objective Aid for Forecasting Afternoon Relative Humidity Along the Washington Cascade East Slopes. Robert S. Robinson, April 1981. (PB81 23078)
165 Annual Data and Verification Tabulation, Eastern North Pacific Tropical Storms and Hurricanes 1980. Emil B. Gunther and Staff, May 1981. (PB82 230336)
166 Preliminary Estimates of Wind Power Potential at the Nevada Test Site. Howard G. Booth, June 1981. (PB82 127036)
167 ARAP User's Guide. Mark Mathewson, July 1981, Revised September 1981. (PB82 196783)
168 Forecasting the Onset of Coastal Gales Off Washington-Oregon. John R. Zimmerman and William D. Burton, August 1981. (PB82 127051)
169 A Statistical-Dynamical Model for Prediction of Tropical Cyclone Motion in the Eastern North Pacific Ocean. Preston W. Leftwich, Jr., October 1981. (PB82195298)
170 An Enhanced Plotter for Surface Airways Observations. Andrew J. Spry and Jeffrey L. Anderson, October 1981. (PB82 153883)
171 Verification of 72-Hour 500-MB Map-Type Predictions. R.F. Quiring, November 1981. (PB82-158098)
172 Forecasting Heavy Snow at Wenatchee, Washington. James W. Holcomb, December 1981. (PB82-177783)
173 Central San Joaquin Valley Type Maps. Thomas R. Crossan, December 1981. (PB82 196064)
174 ARAP Test Results. Mark A. Mathewson, December 1981. (PB82 198103)
176 Approximations to the Peak Surface Wind Gusts from Desert Thunderstorms. Darryl Randerson, June 1982. (PB82 253089)
177 Climate of Phoenix, Arizona. Robert J. Schmidli and Austin Jamison, April 1969 (Revised July 1996). (PB96-191614)
178 Annual Data and Verification Tabulation, Eastern North Pacific Tropical Storms and Hurricanes 1982. E.B. Gunther, June 1983. (PB85 106078)
179 Stratified Maximum Temperature Relationships Between Sixteen Zone Stations in Arizona and Respective Key Stations. Ira S. Brenner, June 1983. (PB83 249904)
180 Standard Hydrologic Exchange Format (SHEF) Version I. Phillip A. Pasteris, Vernon C. Bissel, David G. Bennett, August 1983. (PB85 106052)
181 Quantitative and Spacial Distribution of Winter Precipitation along Utah's Wasatch Front. Lawrence B. Dunn, August 1983. (PB85 106912)
182 500 Millibar Sign Frequency Teleconnection Charts - Winter. Lawrence B. Dunn, December 1983. (PB85 106276)
183 500 Millibar Sign Frequency Teleconnection Charts - Spring. Lawrence B. Dunn, January 1984. (PB85 111367)

71
184 Collection and Use of Lightning Strike Data in the Western U.S. During Summer 1983. Glenn Rasch and Mark Mathewson, February 1984. (PB85 110534)
185 500 Millibar Sign Frequency Teleconnection Charts - Summer. Lawrence B. Dunn, March 1984. (PB85 111359)
186 Annual Data and Verification Tabulation eastern North Pacific Tropical Storms and Hurricanes 1983. E.B. Gunther, March 1984. (PB85 109635)
187 500 Millibar Sign Frequency Teleconnection Charts - Fall. Lawrence B. Dunn, May 1984. (PB85-110930)
188 The Use and Interpretation of Isentropic Analyses. Jeffrey L. Anderson, October 1984. (PB85-132694)
189 Annual Data & Verification Tabulation Eastern North Pacific Tropical Storms and Hurricanes 1984. E.B. Gunther and R.L. Cross, April 1985. (PB85 1878887AS)
190 Great Salt Lake Effect Snowfall: Some Notes and An Example. David M. Carpenter, October 1985. (PB86 119153/AS)
191 Large Scale Patterns Associated with Major Freeze Episodes in the Agricultural Southwest. Ronald S. Hamilton and Glenn R. Lussky, December 1985. (PB86 144474AS)
192 NWR Voice Synthesis Project: Phase I. Glen W. Sampson, January 1986. (PB86 145604/AS)
193 The MCC - An Overview and Case Study on Its Impact in the Western United States. Glenn R. Lussky, March 1986. (PB86 170651/AS)
194 Annual Data and Verification Tabulation Eastern North Pacific Tropical Storms and Hurricanes 1985. E.B. Gunther and R.L. Cross, March 1986. (PB86 170941/AS)
195 Radid Interpretation Guidelines. Roger G. Pappas, March 1986. (PB86 177680/AS)
196 A Mesoscale Convective Complex Type Storm over the Desert Southwest. Darryl Randerson, April 1986. (PB86 190998/AS)
197 The Effects of Eastern North Pacific Tropical Cyclones on the Southwestern United States. Walter Smith, August 1986. (PB87 106258AS)
198 Preliminary Lightning Climatology Studies for Idaho. Christopher D. Hill, Carl J. Gorski, and Michael C. Conger, April 1987. (PB87 180196/AS)
199 Heavy Rains and Flooding in Montana: A Case for Slantwise Convection. Glenn R. Lussky, April 1987. (PB87 185229/AS)
200 Annual Data and Verification Tabulation Eastern North Pacific Tropical Storms and Hurricanes 1986. Roger L. Cross and Kenneth B. Mielke, September 1987. (PB88 110895/AS)
201 An Inexpensive Solution for the Mass Distribution of Satellite Images. Glen W. Sampson and George Clark, September 1987. (PB88 114038/AS)
202 Annual Data and Verification Tabulation Eastern North Pacific Tropical Storms and Hurricanes 1987. Roger L. Cross and Kenneth B. Mielke, September 1988. (PB88-101935/AS)
203 An Investigation of the 24 September 1986 "Cold Sector" Tornado Outbreak in Northern California. John P. Monteverdi and Scott A. Braun, October 1988. (PB89 121297/AS)
204 Preliminary Analysis of Cloud-To-Ground Lightning in the Vicinity of the Nevada Test Site. Carven Scott, November 1988. (PB89 128649/AS)
205 Forecast Guidelines For Fire Weather and Forecasters -- How Nighttime Humidity Affects Wildland Fuels. David W. Goens, February 1989. (PB89 162549/AS)
206 A Collection of Papers Related to Heavy Precipitation Forecasting. Western Region Headquarters, Scientific Services Division, August 1989. (PB89 230833/AS)
207 The Las Vegas McCarran International Airport Microburst of August 8, 1989. Carven A. Scott, June 1990. (PB90-240268)
208 Meteorological Factors Contributing to the Canyon Creek Fire Blowup, September 6 and 7, 1988. David W. Goens, June 1990. (PB90-245085)
209 Stratus Surge Prediction Along the Central California Coast. Peter Felsch and Woodrow Whitlatch, December 1990. (PB91-129239)
210 Hydrotools. Tom Egger. January 1991. (PB91-151787/AS) 211 A Northern Utah Soaker. Mark E. Struthwolf, February 1991.
(PB91-168716) 212 Preliminary Analysis of the San Francisco Rainfall Record: 1849-
1990. Jan Null, May 1991. (PB91-208439) 213 Idaho Zone Preformat, Temperature Guidance, and Verification.
Mark A. Mollner, July 1991. (PB91-227405/AS) 214 Emergency Operational Meteorological Considerations During an
Accidental Release of Hazardous Chemicals. Peter Mueller and Jerry Galt, August 1991. (PB91-235424)
215 WeatherTools. Tom Egger, October 1991. (PB93-184950) 216 Creating MOS Equations for RAWS Stations Using Digital Model
Data. Dennis D. Gettman, December 1991. (PB92-131473/AS) 217 Forecasting Heavy Snow Events in Missoula, Montana. Mike
Richmond, May 1992. (PB92-196104) 218 NWS Winter Weather Workshop in Portland, Oregon. Various
Authors, December 1992. (PB93-146785) 219 A Case Study of the Operational Usefulness of the Sharp
Workstation in Forecasting a Mesocyclone-Induced Cold Sector Tornado Event in California. John P. Monteverdi, March 1993. (PB93-178697)
220 Climate of Pendleton, Oregon. Claudia Bell, August 1993. (PB93-227536)
221 Utilization of the Bulk Richardson Number, Helicity and Sounding Modification in the Assessment of the Severe Convective Storms of 3 August 1992. Eric C. Evenson, September 1993. (PB94-131943)
222 Convective and Rotational Parameters Associated with Three Tornado Episodes in Northern and Central California. John P. Monteverdi and John Quadros, September 1993. (PB94-131943)
223 Climate of San Luis Obispo, California. Gary Ryan, February 1994. (PB94-162062)
224 Climate of Wenatchee, Washington. Michael W. McFarland, Roger G. Buckman, and Gregory E. Matzen, March 1994. (PB94-164308)
225 Climate of Santa Barbara, California. Gary Ryan, December 1994. (PB95-173720)
226 Climate of Yakima, Washington. Greg DeVoir, David Hogan, and Jay Neher, December 1994. (PB95-173688)
227 Climate of Kalispell, Montana. Chris Maier, December 1994. (PB95-169488)
228 Forecasting Minimum Temperatures in the Santa Maria Agricultural District. Wilfred Pi and Peter Felsch, December 1994. (PB95-171088)
229 The 10 February 1994 Oroville Tornado--A Case Study. Mike Staudenmaier, Jr., April 1995. (PB95-241873)
230 Santa Ana Winds and the Fire Outbreak of Fall 1993. Ivory Small, June 1995. (PB95-241865)
231 Washington State Tornadoes. Tresté Huse, July 1995. (PB96-107024)
232 Fog Climatology at Spokane, Washington. Paul Frisbie, July 1995. (PB96-106604)
233 Storm Relative Isentropic Motion Associated with Cold Fronts in Northern Utah. Kevin B. Baker, Kathleen A. Hadley, and Lawrence B. Dunn, July 1995. (PB96-106596)
234 Some Climatological and Synoptic Aspects of Severe Weather Development in the Northwestern United States. Eric C. Evenson and Robert H. Johns, October 1995. (PB96-112958)
235 Climate of Las Vegas, Nevada. Paul H. Skrbac and Scott Cordero, December 1995. (PB96-135553)
236 Climate of Astoria, Oregon. Mark A. McInerney, January 1996. 237 The 6 July 1995 Severe Weather Events in the Northwestern United
States: Recent Examples of SSWEs. Eric C. Evenson, April 1996. 238 Significant Weather Patterns Affecting West Central Montana. Joe
Lester, May 1996. (PB96-178751) 239 Climate of Portland, Oregon. Clinton C. D. Rockey, May 1996.
(PB96-17603) - First Revision, October 1999 240 Downslop Winds of Santa Barbara, CA. Gary Ryan, July 1996.
(PB96-191697) 241 Operational Applications of the Real-time National Lightning
Detection Network Data at the NWSO Tucson, AZ. Darren McCollum, David Bright, Jim Meyer, and John Glueck, September 1996. (PB97-108450)
242 Climate of Pocatello, Idaho. Joe Heim, October 1996. (PB97-114540)
243 Climate of Great Falls. Montana. Matt Jackson and D. C. Williamson, December 1996. (PB97-126684)
244 WSR-88D VAD Wind Profile Data Influenced by Bird Migration over the Southwest United States. Jesus A. Haro, January 1997. (PB97-135263)
245 Climatology of Cape for Eastern Montana and Northern Wyoming. Heath Hockenberry and Keith Meier, January 1997. (PB97-133425)
246 A Western Region Guide to the Eta-29 Model. Mike Staudenmaier, Jr., March 1997. (PB97-144075)
247 The Northeast Nevada Climate Book. Edwin C. Clark, March 1997. (First Revision - January 1998 - Andrew S. Gorelow and Edwin C. Clark - PB98-123250)
248 Climate of Eugene, Oregon. Clinton C. D. Rockey, April 1997. (PB97-155303)
249 Climate of Tucson, Arizona. John R. Glueck, October 1997 250 Northwest Oregon Daily Extremes and Normans. Clinton C. D.
Rockey, October 1997 251 A Composite Study Examining Five Heavy Snowfall Patterns for
South-Central Montana. Jonathan D. Van Ausdall and Thomas W. Humphrey. February 1998. (PB98-125255)
252 Climate of Eureka, California. Alan H. Puffer. February 1998. (PB98-130735)
253 Inferenced Oceanic Kelvin/Rossby Wave Influence on North American West Coast Precipitation. Martin E. Lee and Dudley Chelton. April 1998. (PB98-139744)
254 Conditional Symmetric InstabilityCMethods of Operational Diagnosis and Case Study of 23-24 February 1994 Eastern Washington/Oregon Snowstorm. Gregory A. DeVoir. May 1998. (PB98-144660)
255 Creation and Maintenance of a Comprehensive Climate Data Base. Eugene Petrescu. August 1998. (PB98-173529)
256 Climate of San Diego, California. Thomas E. Evans, III and Donald A. Halvorson. October 1998. (PB99-109381)
257 Climate of Seattle, Washington. Dana Felton. November 1998. (PB99-113482)
258 1985-1998 North Pacific Tropical Cyclones Impacting the Southwestern United States and Northern Mexico: An Updated Climatology. Armando L. Garza. January 1999. (PB99-130502)
259 Climate of San Jose, California. Miguel Miller. April 1999. (PB99-145633)
260 Climate of Las Vegas, Nevada. Paul H. Skrbac. December 1999 261 Climate of Los Angeles, California. David Bruno, Gary Ryan, with
assistance from Curt Kaplan and Jonathan Slemmer. January 2000

72
262 Climate of Miles City, Montana. David A. Spector and Mark H. Strobin. April 2000
263 Analysis of Radiosonde Data for Spokane, Washington. Rocco D. Pelatti. November 2000
264 Climate of Billings, Montana. Jeffrey J. Zeltwanger and Mark H. Strobin. November 2000
265 Climate of Sheridan, Wyoming. Jeffrey J. Zeltwanger, Sally Springer, Mark H. Strobin. March 2001
266 Climate of Sacramento, California. Laura Masters-Bevan. December 2000 (7th Revision)
267 Sulphur Mountain Doppler Radar: A Performance Study. Los Angeles/Oxnard WFO. August 2001
268 Prediction of Heavy Snow Events in the Snake River Plain Using Pattern Recognition and Regression Techniques. Thomas Andretta and William Wojcik. October 2003
269 The Lewis and Clark Expedition 18-03-1806, Weather, Water and Climate, Vernon Preston, Pocatello Idaho, December 2004.
270 Climate of San Diego, California, Emmanuel M. Isla, September 2004 (2nd Edition)
271 Climate of Las Vegas, Nevada, Andrew S. Gorelow, January 2005, (2nd Edition)
272 Climate of Sacramento, California, Revised by: Laura A. Bevan and George Cline, June 2005
273 Climate of Flagstaff, AZ 4th Revision. Mike Staudenmaier, Jr, Reginald Preston(R), Paul Sorenson (R) , August 2005
274 Climate of Prescott, AZ, Bob Fogarty, Mike Staudenmaier Jr., Flagstaff WFO, AZ, January, 2009 (1st Revision).
275 Climate of San Diego, CA, 3rd Revision. Noel M. Isla, Jennifer Lee, March 2006
276 Climate of Reno, NV, Brian Ohara, Reno, NV October 2006 277 Forecaster's Handbook for Extreme Southwestern California Based
On Short Term Climatological Approximations: Part I - The Marine Layer and Its Effect On Precipitation and Heating Ivory J. Small, October 2006
278 Forecaster's Handbook for Extreme Southwestern California Based On Short Term Climatological Approximations: Part II – Wind Effects on Terrestrial and Marine Environments Ivory J. Small, December 2006
279 Effects of Wildfire in the Mountainous Terrain of Southeast Arizona: An Empirical Formula to Estimate 5-Year Peak Discharge from Small Post-Burn Watersheds, William B. Reed and Mike Schaffner , June 2007
280 The Climate of Fresno, California, Chris Stachelski and Gary Sanger, March 2008
281 The Climate of Bakersfield, California, Chris Stachelski and Gary Sanger, February 2008
282 Hazardous Weather Climatology for Arizona, Craig Shoemaker and Jeffrey T. Davis, February 2008
283 Effects of Wildfire in the Mountainous Terrain of Southeast Arizona: Empirical Formulas to Estimate from 1-Year through 10-Year Peak Discharge from Post-Burn Watersheds, William B. Reed and Mike Schaffner, July 2008

73
NOAA SCIENTIFIC AND TECHNICAL PUBLICATIONS The National Oceanic and Atmospheric Administration was established as part of the Department of Commerce on October 3, 1970. The mission responsibilities of NOAA are to assess the socioeconomic impact of natural and technological changes in the environment and to monitor and predict the state of the solid Earth, the oceans and their living resources, the atmosphere, and the space environment of the Earth. The major components of NOAA regularly produce various types of scientific and technical information in the following kinds of publications. PROFESSIONAL PAPERS--Important definitive research results, major techniques, and special investigations. CONTRACT AND GRANT REPORTS--Reports prepared by contractors or grantees under NOAA sponsorship. ATLAS--Presentation of analyzed data generally in the form of maps showing distribution of rainfall, chemical and physical conditions of oceans and atmosphere, distribution of fishes and marine mammals, ionospheric conditions, etc.
TECHNICAL SERVICE PUBLICATIONS -- Reports containing data, observations, instructions, etc. A partial listing includes data serials; prediction and outlook periodicals; techni-cal manuals, training papers, planning reports, and information serials; and miscellaneous technical publications. TECHNICAL REPORTS--Journal quality with extensive details, mathematical developments, or data listings. TECHNICAL MEMORANDUMS--Reports of preliminary, partial, or negative research or technology results, interim instructions, and the like.

lxxiv
Information on availability of NOAA publications can be obtained from:
NATIONAL TECHNICAL INFORMATION SERVICE
U. S. DEPARTMENT OF COMMERCE
5285 PORT ROYAL ROAD
SPRINGFIELD, VA 22161