Nguyen Thi Hong Lieu
130
HOLOCENE EVOLUTION OF THE CENTRAL RED RIVER DELTA, NORTHERN VIETNAM LITHOLOGICAL AND MINERALOGICAL INVESTIGATIONS Dissertation in fulfillment of the academic grade doctor rerum naturalium (Dr. rer. nat.) at the Faculty of Mathematics and Natural Sciences Ernst-Moritz-Arndt-University Greifswald Nguyen Thi Hong Lieu born on 29.05.1979 in Hanoi, Vietnam Greifswald, Germany 2006
Transcript of Nguyen Thi Hong Lieu

HOLOCENE EVOLUTION OF THE CENTRAL RED RIVER DELTA,
NORTHERN VIETNAM
LITHOLOGICAL AND MINERALOGICAL INVESTIGATIONS
Dissertation
in fulfillment of the academic grade
doctor rerum naturalium (Dr. rer. nat.)
at the Faculty of Mathematics and Natural Sciences
Ernst-Moritz-Arndt-University Greifswald
Nguyen Thi Hong Lieu born on 29.05.1979 in Hanoi, Vietnam
Greifswald, Germany
2006
Dekan: Prof. Dr. Klaus Fesser
1. Gutachter 1: Prof. Dr. Reinhard Lampe
2. Gutachter 2: Prof. Dr. Georg Irion
Tag der Promotion: 13 July 2006
Hiermit erkläre ich, dass diese Arbeit bisher von mir wieder an der Mathematisch-
Naturwissenschaftlichen Fakultät der Ernst-Moritz-Arndt-Universität Greifswald noch
einer anderen wissenschaftlichen Einrichtung zum Zwecke der Promotion eingereicht
wurde.
Ferner erkläre ich, dass ich diese Arbeit selbständig verfasst und keine anderen als die
darin angegebenen Hilfsmittel benutzt habe.
Nguyen Thi Hong Lieu
ACKNOWLEDGEMENTS
At the completion of my thesis I would like to express my gratitude to all persons who,
directly or indirectly, contributed to this study.
I would like first to thank my supervisor, Professor Dr. Reinhard Lampe, for his excellent
excursion guidance, ideas for my studying steps and his critical revision of my
manuscript. Without his patience in answering all my questions and support, I would have
not made it.
Next, I am very grateful for the 3-year-financial supporting from Ministry of Education
and Training of Vietnam (MOET) for me to do this Ph.D. work, all members of 322
project. And thanks to my home university to give me the possibility to study in
Greifswald. I am also highly appreciated the organization for my Ph.D. work of Joint
Graduate Education Program between Institute of Biotechnology, Vietnam Academy of
Science and Technology and University of Greifswald, especially Prof. Dr. Maria-
Theresia Schafmeister, Prof. Mai Trong Nhuan, Dr. Habil. Jörn Kasbohm, Prof. Le Tran
Binh, Dr. Le Thi Lai and other organizers of this program.
I specially thank to Dr. Habil. Jörn Kasbohm for his teaching about clay mineral as well
as accepting me analysis XRD samples in laboratory. Also, I would like to thank all of
my Vietnamese teachers in Vietnam and Prof. Tran Nghi, Prof. Mai Trong Nhuan, TS.
Chu Van Ngoi who were always clear my wondering as well as encourage me.
Finally, I would like to thank all members of my family, including my father, my mother, my brother, my sister and my nephew and my friends in Greifwald, especially our Red river delta group Duong and Steffen, for their constant support and their endless love during my study and work.
TABLE OF CONTENT 1. INTRODUCTION ................................................................................................................... 1
1.1. General introduction ............................................................................................1 1.2. Brief review of world deltas geology...................................................................2 1.3. The evolution of Holocene Asian deltas ..............................................................4 1.4. Study area location...............................................................................................6 1.5. Objective of this study .........................................................................................7
2. STUDY AREA AND STATE OF THE ART ......................................................................... 8 2.1. Geographical setting ............................................................................................8 2.2. Geological setting ..............................................................................................10
2.2.1. Stratigraphy................................................................................................10 2.3. Sea level evolution.............................................................................................14 2.4. Lithology and mineralogy..................................................................................17
2.4.1. Lithology....................................................................................................17 2.4.2. Mineralogy.................................................................................................19
3. METHODOLOGY ................................................................................................................ 22 3.1. Sampling and core description...........................................................................23 3.2. X-ray radiography..............................................................................................24 3.3. Grain size analysis .............................................................................................24 3.4. Light microscopy ...............................................................................................26 3.5. Complex Phase Analysis....................................................................................27 3.6. AMS-14C dating .................................................................................................31
4. THE LITHOLOGY, MINERALOGY OF HOLOCENE SEDIMENT IN CENTRAL RED RIVER DELTA.............................................................................................................................. 33
4.1. TB1 CORE.........................................................................................................33 4.1.1. Unit 0 - Shallow marine sediment (late Pleistocene).................................33 4.1.2. Unit 1 - Estuarine sediments ......................................................................37 4.1.3. Unit 2 - shallow marine, deltaic and fluvial sediments..............................39
4.2. TB2 CORE.........................................................................................................43 4.2.1. Unit 0 - shallow marine clay (late Pleistocene) .........................................44 4.2.1. Unit 0 - shallow marine clay (late Pleistocene) .........................................45 4.2.1. Unit 0 - shallow marine clay (late Pleistocene) .........................................46 4.2.2. Unit 1 - estuarine sediments.......................................................................46 4.2.3. Unit 2 - shallow marine, deltaic sediments ...............................................48
4.3. TB3 CORE.........................................................................................................51 4.3.1. Unit 0 – fluvial (later Pleistocene) .............................................................51 4.3.2. Unit 1 - estuary sediment ...........................................................................51 4.3.3. Unit 2 - shallow marine, deltaic sediments ................................................55
4.4. HT CORE...........................................................................................................59

4.4.1. Unit 1 - estuarine........................................................................................59 4.4.2. Unit 2 – Deltaic and fluvial sediment ........................................................62
4.5. HN CORE ..........................................................................................................64 4.5.1. Unit 0 – shallow marine (late Pleistocene) ................................................64 4.5.2. Unit 1- estuarine sediments........................................................................64 4.5.3. Unit 2 - deltaic and fluvial sediments ........................................................34
4.6. YM CORE .........................................................................................................36 4.6.1. Unit 0 -fluvial (late Pleistocene) ................................................................36 4.6.2. Unit 1- estuarine sediments........................................................................72 4.6.3. Unit 2 - deltaic and fluvial sediments ........................................................72
4.7. Discussion ..........................................................................................................74 5. SEQUENCE STRATIGRAPHY OF HOLOCENE SEDIMENT IN CENTRAL RED RIVER DELTA........................................................................................................................................... 89
5.1. Sequence stratigraphic boundaries.....................................................................89 5.1.1. The sequence boundary (SB) .....................................................................90 5.1.2. Transgressive surface (TS) ........................................................................90 5.1.3. Maximum flooding surface (MxFS) ..........................................................91
5.2. Systems tracts.....................................................................................................92 5.2.1. Lowstand systems tracts (LST)..................................................................92 5.2.2. Transgressive systems tract (TST)-Unit 1 ................................................92 5.2.3. Highstand systems tract (HST) -Unit 2.....................................................93
5.3. Discussion ..........................................................................................................94 6. HOLOCENE EVOLUTION OF THE CENTRAL RED RIVER DELTA............................ 98
6.1. First stage – 11.5-8.5 kyr BP .............................................................................98 6.2. Second stage – 8.5-0 kyr BP ............................................................................101 6.3. Discussion ........................................................................................................107
7. CONCLUSIONS ................................................................................................................. 112
INDEX OF FIGURES
Tab. 1.1 Features of the Red River
Tab. 1.2 The number of storms and tropical depressions
Tab. 3.1 Station list of the sediment cores with sediment recovery
Tab. 3.2 Mineral phase in powder specimen (<20 µm) Cu-Kα
Tab. 3.3 Clay minerals - phase in oriented specimen (<2 µm) Co-Kα
Tab. 3.4 Methods employed to each core
Tab. 4.1 Sedimentary facies in RRD collection in six cores
Tab. 4.2 The content of three components (quartz-feldspar-rock+mica) in coarse fraction
Tab. 4.3 Four group of clay mineral in Holocene sediments in central RRD
Tab. 4.3 AMS 14C dates from the sediment cores taken from the central RRD
Fig. 1.1 Study area and core location
Fig. 2.1 Holocene tectonic scheme in RRD (modified after Ngoi, 2000)
Fig. 2.2 Quaternary stratigraphic column of the RRD
Fig. 2.3 Sea-level curve for the western margin of the South China Sea during the past 20
kyr and sea-level curve in the Song Hong delta region during the past 8 kyr
Fig. 3.1 Illustrating flow chart sampling and methodological procedures
Fig. 3.3 Logarithmic diagram of grain size
Fig. 4.1-2-3-4-5-6a,b Characteristic of structure, grain size; mineral, fauna, plant
composition; clay-size mineral of Holocene sediments in TB1, TB2, TB3, HT, HN, YM
core
Fig. 4.7 The types of frequence curves and textural maturity inHolocene sediment in
central RRD
Fig. 4.8a,b Photographs, x-ray radiographs of typical sedimentary structure and facies in
unit 1, 2 in the TB1, TB2, TB3, HT, HN, YM core.
Fig. 4.9a The result of glycol ethylen oriented samples (< 2 µm; Co Kα) in central RRD
Fig. 4.9b The distribution of clay mineral in sedimentary facies in the central RRD
Fig. 4.10a,b Four types of gypsum, siderite, limonite and fauna observed in Holocene
sediment of RRD
Fig. 5.1 Location of high concentration of radioactive minerals in front of RRD (after
HOAN 1981) in relation with sediment correlation profile.
Fig. 5.2a,b,c Sequence stratigraphic profile T1, T2, T3 of Holocene sediments in central
RRD
Fig. 6.1 the evolution of Holocene minerals, fauna composition in central RRD
Fig. 6.2a Erosion valley in initial time of Holocene on RRD
Fig. 6.2b Paleogeographic maps illutraiting the evolution of RRD during the past 8.5 kyr
BP (modified after Tanabe, 2005)
Fig. 6.4 The relationship of climate, sea level rise and mean accumulation rate (includes a
tectonic subsidence) of Holocene deposits in central RRD
ABBREVIATIONS FULLNAME RRD Red River delta
Md mean grain size
So sorting
Sk skewness
wg. weight of sample
XRD Xray diffraction
i Illite
iw Illite well-ordered
ip Illite poor-ordered
k Kaolinite
c Chlorite
s Smectite
I/S ml Illite-smectite mixed layed
g Gibbsite
LGM Last Glacial Maximum
SB sequence boundary
TS trangressive surface
MxFS maximum flooding surface
LST lowstand systems tracts
TST transgressive systems tract
HST highstand systems tract
RT retrogradational parasequence set
AP aggradational-progradational parasequence set
PPS progradational parasequence set
FPS fluvial parasequence set

1
1. INTRODUCTION
1.1. General introduction
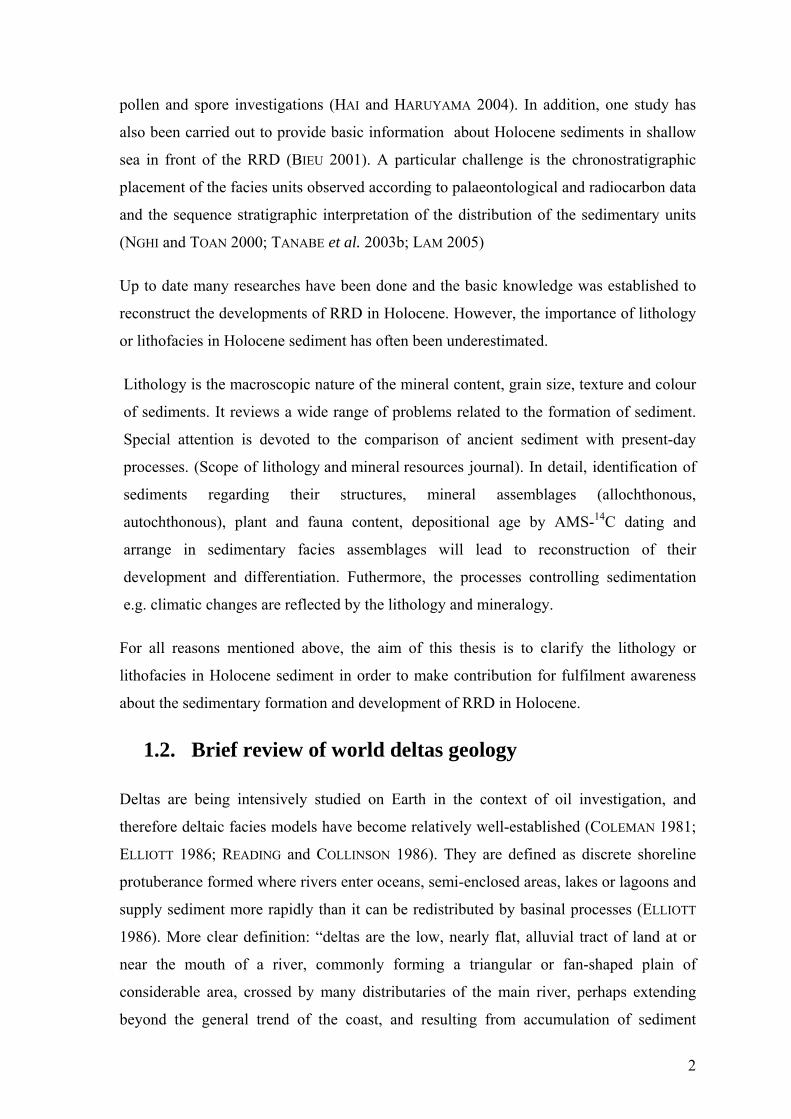
The Red River (Song Hong) originates in mountainous Yunnan Province, China, flows
1,200 km southeastwards, and empties finally into the Gulf of Bac Bo (Gulf of Tonking)
in the South China Sea (Fig.1.1). The total sediment discharge is 100-130 million tons per
year, and the water discharge is 120 km3/y (MILLIMAN et al. 1995). The vast amount of
sediment deposited in the river mouth region makes the Red River delta (RRD) to one of
the largest river deltas in Southeast Asia and the second largest in Vietnam after the
Mekong River delta. In the delta plain covering an area of 160.000 km2, the river diverges
into two major distributaries near Hanoi: Thai Binh River to the northeast and the Red
River proper to the southwest (Fig. 1.1). Red River, the studied area, is more important
carrying up to 80% of the total water discharge during the wet summer monsoon season
(MATHERS et al. 1996; VAN MAREN and HOEKSTRA 2005; ZBIGNIEW P. et al. 2005).
A sensitively tight relation of the fluvial system with the monsoon’s activities is obvious
and has been investigated with increasing intensity (ZBIGNIEW P. et al. 2005). Research
on RRD to investigate the variation of monsoon strength in millennium scale is
favourable because low frequency changes provide sufficient time for the sedimentary
system to respond and to preserve a stratigraphic signal (GOODBRED 2003; VAN MAREN
and HOEKSTRA 2004). However, the postglacial change of sea level is the main reason for
the development of the delta. From 15,000 years ago, after the last main ice-sheets global
expansion, the Holocene sediments, mostly fine sediment like silt and clay, accumulated
with increasing thicknesses from less than 20 m at the apex to 70 m in seaward directions
(MINH and DAN 1991; HARUYAMA et al. 2001; SAITO et al. 2004; TANABE et al. 2006).
Therefore, the central RRD was chosen to study by means of lithology and mineralogy.
This would be promising to fully understand the evolution of the delta not only because it
is the main valley of the RRD but because the Holocene sediments accumulated ina quite
complete profile of high thickness.
A lot of scientific works relevant to the late Quaternary stratigraphy of the RRD have
been published, such as geological, engineering geological, hydrogeological maps (KY
1976; TOAN 1995). The others, among the latest prominent research, refer to the
numerous boreholes with facies interpretation (TANABE et al. 2003b; LAM 2005) and
2
pollen and spore investigations (HAI and HARUYAMA 2004). In addition, one study has
also been carried out to provide basic information about Holocene sediments in shallow
sea in front of the RRD (BIEU 2001). A particular challenge is the chronostratigraphic
placement of the facies units observed according to palaeontological and radiocarbon data
and the sequence stratigraphic interpretation of the distribution of the sedimentary units
(NGHI and TOAN 2000; TANABE et al. 2003b; LAM 2005)
Up to date many researches have been done and the basic knowledge was established to
reconstruct the developments of RRD in Holocene. However, the importance of lithology
or lithofacies in Holocene sediment has often been underestimated.
Lithology is the macroscopic nature of the mineral content, grain size, texture and colour
of sediments. It reviews a wide range of problems related to the formation of sediment.
Special attention is devoted to the comparison of ancient sediment with present-day
processes. (Scope of lithology and mineral resources journal). In detail, identification of
sediments regarding their structures, mineral assemblages (allochthonous,
autochthonous), plant and fauna content, depositional age by AMS-14C dating and
arrange in sedimentary facies assemblages will lead to reconstruction of their
development and differentiation. Futhermore, the processes controlling sedimentation
e.g. climatic changes are reflected by the lithology and mineralogy.
For all reasons mentioned above, the aim of this thesis is to clarify the lithology or
lithofacies in Holocene sediment in order to make contribution for fulfilment awareness
about the sedimentary formation and development of RRD in Holocene.
1.2. Brief review of world deltas geology
Deltas are being intensively studied on Earth in the context of oil investigation, and
therefore deltaic facies models have become relatively well-established (COLEMAN 1981;
ELLIOTT 1986; READING and COLLINSON 1986). They are defined as discrete shoreline
protuberance formed where rivers enter oceans, semi-enclosed areas, lakes or lagoons and
supply sediment more rapidly than it can be redistributed by basinal processes (ELLIOTT
1986). More clear definition: “deltas are the low, nearly flat, alluvial tract of land at or
near the mouth of a river, commonly forming a triangular or fan-shaped plain of
considerable area, crossed by many distributaries of the main river, perhaps extending
beyond the general trend of the coast, and resulting from accumulation of sediment
3
supplied by the river in such quantities that it is not removed by tides, waves, and
currents“ (Glossary of geology, 2005, p.169).
Geological study of a delta began in time of Herodotus (ca. 400 B.C) who recognized that
the alluvial plain at the mouth of the Nile had the form of the Greek letter delta (Δ). After
that, many researchers were attracted in geological topic. A first model of delta, which
included delta plain, delta front and prodelta was discovered by GILBERT (1885).
Since 1885, especially in the last 50 years, mostly our understanding of modern deltas has
developed by the research works beginning on the Mississippi delta by SHEPARD (1960)
and then the others. Deltas are essentially cyclic in nature and consist of a progradational
- constructive phase that usually followed by a retrogradational - destructive phase
coinciding with delta abandonment. They have special deltaic sequence (coarsening - and
sandier - upward bottomet, foreset and topsed beds related to the seaward migration in
depositional environments) (REINECK and SINGH 1973). Based on sand distribution
pattern of 34 modern deltas, deltaic sediments have been classified into six categories .
However, the most widely used classification is Galloway’s tripartite scheme with river -
wave - tidal dominated deltas. By this scheme there are multifacies of onshore and
nearshore recognised not only in modern but also in ancient deltas. The implement of side
- scan sonar imaging, shallow high resolution seismic reflection profiles and cores on the
mouth of many rivers led to the recognition of abundance and importance of sedimentary
deformation in the subaqueous parts of modern deltas (COLEMAN 1981).
In the last 20 years, geological researches focus on the evolution of modern deltas in a
context of eustatic sea level changes (BOYD et al. 1989), and the application in a concepts
of sequence stratigraphy to ancient deltas as well as to the correlation of modern deltas
(COLEMAN 1981; GALLOWAY 1989).
Sequence stratigraphy has become a very popular methodology for establishing a quasi-
chronostratigraphic framework in order to facilitate facies analysis and paleogeographic
reconstruction. This scheme stratigraphy recognises units by defining discontinuation and
unconformity in relation to cyclic sea-level fluctuations. The systems tracts are linkages
of depositional systems from different places but contemporarely active. They can be
united and compared by the definition of three main systems tracts: lowstand,
trangressive and highstand systems tracts according to sea level position (VAN WAGONER
et al. 1988; POSAMENTIER and VAIL 1988b).
4
1.3. The evolution of Holocene Asian deltas
At present, the Asian coasts have many large deltas, which give us good examples for
deltas understanding generally, including their evolution, sediment facies, and response to
sea-level changes. The major reason that so many large deltas are found in Asia is the
existence of large rivers with huge sediment discharges, which have their sources in the
high peaks of the Himalayas and the Tibetan Plateau with high precipitation due to the
monsoonal climate; and the stable or slightly falling sea level over the last 6 ky. During
the Holocene, some Asian deltas have prograded more than 200 km seaward and created
wide delta plains. Hence, the Asian coastal zone is the depocenter and major sediment
sink of the world today. Most Asian deltas are located along tide-dominated coasts. They
include the Huanghe (Yellow), Changjiang (Yangtze), Pearl, Chao Phraya, Irrawaddy,
Ganges-Brahmaputra, Indus, Mekong, and RRD (SAITO et al. 1998).
Recently, major efforts have been put forth to assess the potential impacts that global
change may have on these delta systems. However, most such assessments have been
based on a gross over-simplification of delta behavior, as well as a limited database for
Asian deltas. Although some background information can be based on delta research from
other parts of the world, recent findings from the Asian mega deltas reveal that these
systems are fundamentally distinct from existing models. Notably, the following
characteristics of Asian deltas contribute to their unique behavior: 1) monsoon control, 2)
high sediment loads, 3) high, strongly seasonal water discharge, 4) large coastal tide
ranges, and 5) silt-sand dominated sediment texture, and 6) tectonic activity (only in a
few systems) (SAITO et al. 1998).
Several studies have been carried out on the Holocene evolution of large-river deltas and
incised-valley fills in Asia on the basis of internal lithology, sedimentary facies, and high-
resolution radiocarbon dating. These studies discuss the morpho-dynamic evolution of the
deltas and estuaries, detail sediment facies, incised-valley-fill successions, and past-
sediment discharge of the large rivers of Asia, e.g. the Ganges–Brahmaputra (GOODBRED
and KUEHLB 2000), the Mekong (LAP et al. 2000; TATEISHI et al. 2001; TANABE et al.
2003a) the Changjiang (Yangtze) (HORI et al. 2002; HORI et al. 2004), and the Huanghe
(SAITO et al. 2001). Delta evolution has taken place since the mid- Holocene, during a
sea-level highstand that came about by a deceleration of the sea-level rise (Stanley and
Warne, 1994). In particular, sea levels in Southeast and East Asia reached Holocene high

5
above the present levels because of hydroisostasy, and progradation of the deltas have
thus been enhanced by the stable and falling sea levels in the last 6 kyr (SAITO et al. 2001;
HORI et al. 2002; HANEBUTH et al. 2003)
Beside the scientific results of grain size, structure, fauna, AMS-14C dating, the recent
works over Holocene delta developments in Asia do not consider carefully about
allochthonous and authochthonous (detrital and authigenic, respectively). These materials
were transported into or new formed in the sediment. Therefore investigations of their
existence, in addition of other geological research methods, can be helpful with the
reconstruction of landscape developments: the sediment supply, the sediment transport as
well as the deposit and relocation. It is necessary for understanding of the processes
(decomposition, erosion, transport and deposit) that are derived from climatic changes
and eustatic (CHAMLEY 1989; 1990) Srodon dedicated to the use of clay minerals to the
reconstruction of geological processes (SRODON 1999). Also, the reaching of Holocene
sea level rise on the basis the clay mineral existence in the sediment was pursued by
Moon (MOON et al. 2000). Information of recent climatic fluctuations was derived from
the clay mineral existence in shallow water sediments (BISCAYE 1965). So that, RRD –
one of the typical delta was chosen to study lithology and mineralogy to clear the relation
of causes and results of sedimentary deposition.

6
1.4. Study area location
Fig. 1.1. Study area and core location (image © 2006 NASA)
The RRD is situated in a Neogene NW-SE-trending sedimentary basin (Song Hong
Basin) (NIELSEN et al. 1999) filled with Neogene and Quaternary sediments to a thickness
of more than 3 km (MINH and DAN 1991; MATHERS et al. 1996; MATHERS and
ZALASIEWICZ 1999). The Quaternary sediments, which unconformable overlie the
Neogene sediments, are composed mainly of sands and gravels with subordinate lenses of
silt and clay, and they thicken seaward to a maximum thickness of 200 m beneath the
coastal area of the delta.
The accommodation space in RRD includes incised valley, which formed during the last
glacial maximum (LGM), is southwest of the present Red River. The narrow, northwest-
southeast-oriented, elongated valley is approximately 20 km wide and more than 70 m
deep (TANABE et al. 2003a). The valley is filled with transgressive fluvial/estuarine and
regressive deltaic sediments deposited in relation to the sea-level changes since the LGM
(MATHERS and ZALASIEWICZ 1999; TANABE et al. 2003b; TANABE et al. 2003c; HORI et

7
al. 2004; TANABE et al. 2006). Sea-level changes since the LGM, paleoclimate have
influenced the sedimentary environments and evolution in the RRD (LAM 2005; LI et al.
2006; TANABE et al. 2006).
From this information, this study was carried out along the valley. The researching area
extends from the NW to SE in the center part of RRD (Fig. 1.1) from 105o10’04” E;
21o05’20” N (northwestmost core HN) to 106o30’40” E; 20o20’50” N (southeastmost
core TB2). The sediment cores investigated have lengths from from 30 to 70 m.
1.5. Objective of this study The goals of this study are to characterize the sedimentary formation in RRD
development process and the sedimentary evolution in relation to sea level change by
means of lithology and lithofacies with focus on Holocene. In order to reach those goals
the following tasks were established:
• Taking cores covering the entire Holocene and are located on a long transect
reaching from the delta apex to the river mouth (Hanoi to Ba Lat)
• Identification Holocene RRD sediments regarding their structures, mineral
assemblages (allochthonous, autochthonous), plant and fauna content,
depositional age by AMS-14C dating and arrange in sedimentary facies
assemblages.
• Use AMS-14C to establish the sequence stratigraphy to strata correlated.
• Reconstruction of development and differentiation of RRD.
• The overall goal of the investigation is to understand processes controlling
sedimentation and identificate of possible climatic changes in the RRD reflected
by the lithology and mineralogy.
Results are presented in three chapters. The first, dealing with the lithology of the
Holocene sediments in the central RRD, is a comprehensive description of the cores from
the study area. The second chapter provides a correlation of the Holocene sedimentary
units from the RRD based on a sequence stratigraphic approach. The third part of this
work describes the evolution of Holocene sedimentary in relation to sea-level change,
neotectonic, accommodation space, and monsoon climate.
8
2. STUDY AREA AND STATE OF THE ART
2.1. Geographical setting The centre of RRD plain can be divided into wave and fluvial-dominated systems on the
basis of surface topography and hydraulic processes (MATHERS et al. 1996; MATHERS and
ZALASIEWICZ 1999). The fluvial-dominated system is composed of meandering rivers,
meandering levee belts, flood plain, and fluvial terraces. It is located in the western part
of the delta, where the fluvial flux is relatively strong. The wave-dominated system is
located in the southwestern section of the delta, where wave energy is high due to strong
summer monsoon. The system is characterized by alternating beach ridges and back
marshes. Besides, RRD system includes a tide-dominated section that developed in the
northeastern part of the delta, where Hainam island shelters the coast from strong waves.
The system comprises tidal flats, marshes, and tidal creeks/channels.
The subaqueous part of the delta can be divided into delta front and prodelta on the basis
of the subaqueous topography. The delta front is from 0 to 20–30 m below present sea
level, and the prodelta is further offshore. The delta front can be further divided into two
parts: platform and slope . The delta front platform is above the slope break where the
water is about 6 m deep, and it has a gradient of < 0.9/1000. The delta front slope has a
relatively steep face with a gradient of > 3.0/1000 (TANABE et al. 2003b; TANABE et al.
2003c).
In recent time, RRD has influence of following characteristics of climate, hydrology,
wave and tidal, river flooding.
Climate: RRD has a tropical monsoon climate, with humidity averaging 84 % throughout
the year. During the winter or dry season (November to April), the monsoon winds
usually blow from the northeast along the China coast and across the Gulf of Tonkin,
picking up considerable moisture; consequently the winter season is dry only by
comparison with the rainy or summer season. During the summer monsoon (May to
October), the heated air of the Gobi Desert rises, far to the north, inducing moist air to
flow inland from the sea and deposit heavy rainfall. Temperatures range from a low of
5°C in December and January, the coolest months, to more than 37°C in April, the hottest
month. The climate in the investigation area is therefore by cool, dry winters (December
until March) and warm, wet summers (May until October) characterizes (VAN MAREN
and HOEKSTRA 2004; ZBIGNIEW et al. 2005).
9
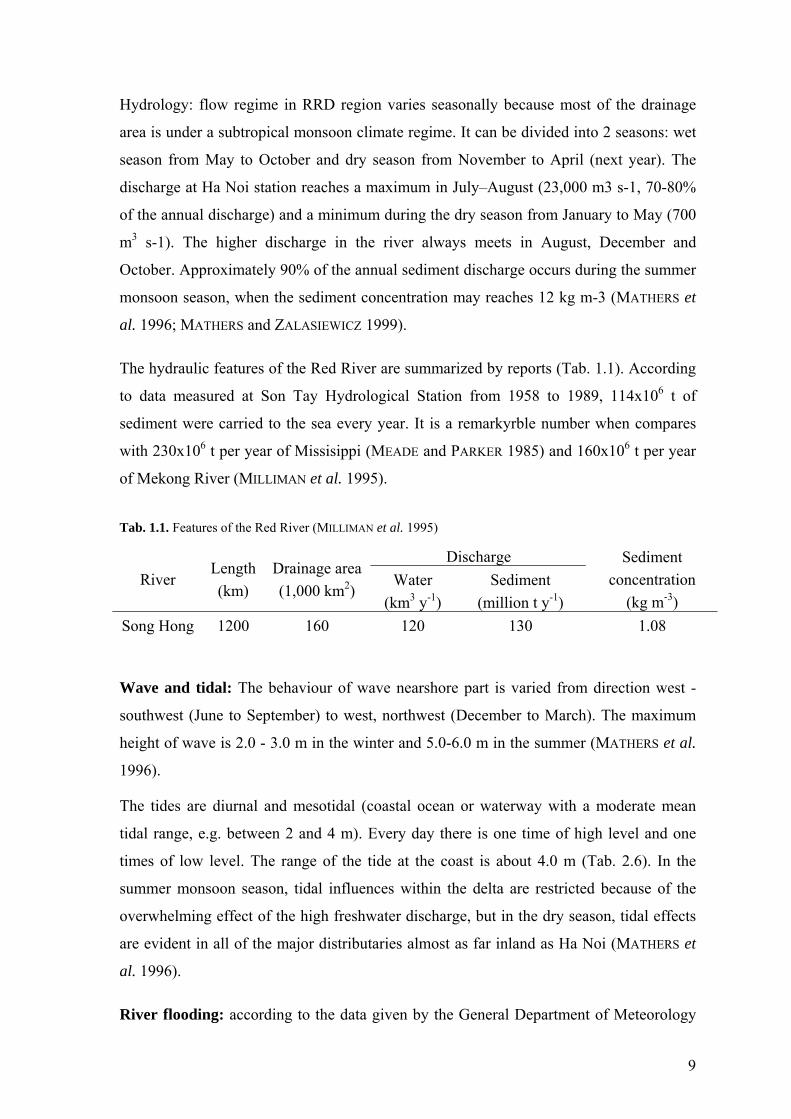
Hydrology: flow regime in RRD region varies seasonally because most of the drainage
area is under a subtropical monsoon climate regime. It can be divided into 2 seasons: wet
season from May to October and dry season from November to April (next year). The
discharge at Ha Noi station reaches a maximum in July–August (23,000 m3 s-1, 70-80%
of the annual discharge) and a minimum during the dry season from January to May (700
m3 s-1). The higher discharge in the river always meets in August, December and
October. Approximately 90% of the annual sediment discharge occurs during the summer
monsoon season, when the sediment concentration may reaches 12 kg m-3 (MATHERS et
al. 1996; MATHERS and ZALASIEWICZ 1999).
The hydraulic features of the Red River are summarized by reports (Tab. 1.1). According
to data measured at Son Tay Hydrological Station from 1958 to 1989, 114x106 t of
sediment were carried to the sea every year. It is a remarkyrble number when compares
with 230x106 t per year of Missisippi (MEADE and PARKER 1985) and 160x106 t per year
of Mekong River (MILLIMAN et al. 1995).
Tab. 1.1. Features of the Red River (MILLIMAN et al. 1995)
Discharge River
Length(km)
Drainage area (1,000 km2)
Water (km3 y-1)
Sediment (million t y-1)
Sediment concentration
(kg m-3) Song Hong 1200 160 120 130 1.08
Wave and tidal: The behaviour of wave nearshore part is varied from direction west -
southwest (June to September) to west, northwest (December to March). The maximum
height of wave is 2.0 - 3.0 m in the winter and 5.0-6.0 m in the summer (MATHERS et al.
1996).
The tides are diurnal and mesotidal (coastal ocean or waterway with a moderate mean
tidal range, e.g. between 2 and 4 m). Every day there is one time of high level and one
times of low level. The range of the tide at the coast is about 4.0 m (Tab. 2.6). In the
summer monsoon season, tidal influences within the delta are restricted because of the
overwhelming effect of the high freshwater discharge, but in the dry season, tidal effects
are evident in all of the major distributaries almost as far inland as Ha Noi (MATHERS et
al. 1996).
River flooding: according to the data given by the General Department of Meteorology

10
and Hydrology, from 1884 to 1989, there were 1,993 storms and tropical depressions
influenced on Vietnam territory (about 5 storms/tropical depressions per year) and 148 of
which (30%) came to the RRD (NGHI et al. 2002). In the three past decades (1960-1989)
the annual average storms and tropical depressions have the tendency to be increased as
below.
Tab. 1.2. The number of storms and tropical depressions (NGHI et al. 2002)
Number of Storms and Tropical Depressions Aver. Time/year 1960-1969 55 5.5 1970-1979 66 6.6 1980-1989 72 7.2
The increased storms and tropical depressions lead to the raising of the annual average
wave height. It results in changing the geomorphology and sedimentology (erosion,
accretion, shoreline, distribution of sediment) of the study area.
Storms landing directly into Bac Bo delta (northern plain) usually form on the South
China Sea. In three months July, August and September the storms have been formed
with big proportion 74%. In September, storms were formed with the highest frequency
(27%) (VAN MAREN and HOEKSTRA 2004)
2.2. Geological setting
2.2.1. Stratigraphy
The RRD is surrounded by mountainous areas formed of Precambrian crystalline rocks
and Palaeozoic and Mesozoic sedimentary rocks and the structure is dominated by NW-
SE aligned faulting. RRD developed overlying one trough valley which was formed by
faults. The NW–SE aligned Red River fault system regulates the distribution of the
mountainous areas, the drainage area, and the straight course of the Song Hong. However,
fault movements have been considerably minor since the late Miocene (NIELSEN et al.
1999).
This trough valley was developed from early Cainozoic and filled with Neocene and
Quaternary sediments with a thickness of more than 3 km (CHUONG 1991). Its floor
basement and surrounding mountainous region composed of complex materials such as
schist, quartz schist, quartz-feldspar-biotite-granate, Precambrian greenschist, terrigenous
rocks, carbonate rocks from Paleozoic to Mesozoic (MATHERS et al. 1996; MATHERS and

11
ZALASIEWICZ 1999). The Quaternary sediment - the top deposition of Cainozoic, which
unconformly overlies the Neogene deposits, are composed mainly of sands and gravels
with lenses of silt and clay. In this study area, the Quaternary sequence is thick about 100
m beneath Hanoi and thickens eastwards to attain about 200 m beneath parts of the
coastline. In offshore, the shallow water depths in the Gulf of Tonkin (< 50 m) suggest
that much of the sequence is preserved in the floor (MATHERS et al. 1996; MATHERS and
ZALASIEWICZ 1999). The simplified onshore and nearshore Quaternary stratigraphy
developed by Vietnamese workers (KY 1976; TOAN 1995) comprises two main series:
sea-level lowstand sediments (Pleistocene) and sea-level highstand sediments, the latter
building the modern delta (Holocene).
- Sea-level lowstand sediments (Pleistocene)
The Pleistocene sediments have been variously assigned to the Lechi, Hanoi and
Vinhphuc formations. They are thin along the basin margins but attain over 50 m
thickness beneath Hanoi and more than 100 m beneath the central delta coastline. These
deposits regularly constitute 60-75% of the entire thickness of the Quaternary (MATHERS
and ZALASIEWICZ 1999). The large grain–size, absence of marine fauna and occurrence of
oxidised sediments clearly proved that an alluvial regime was dominant. It can be
assumed that they accumulated during global cold phases when sea level stood
significantly lower than at present. Among these formations, Le Chi formation is the
oldest and is unconformably overlain by younger deposits. Le Chi began with alluvial and
proluvial pebble, gravel, and after that follow silt, clay lense. Similar, the next formation
– Hanoi had a fining upward. In relation to sea level, Vinh Phuc formation is changing
from alluvial to marine sediments. The result of radiocarbon dating is about 15,000-
18,000 years BP (TAM 1991).
- Sea-level highstand sediments - the modern delta (Holocene)
During the last glacial maximum, about 20,000 years BP global sea level was ca. 120 m
lower than at present. The shoreline would have been far out in the South China Sea with
the entire Gulf of Tonkin emerged. The predominantly fine-grained sediments were
exposed, eroded and formed thick motley coloured layers. After the last glacial maximum
and lateglacial sediments, Holocene sediments consist of two formations named Hai
Hung and Thai Binh. Early Holocene Hai Hung-1 formation, built up by fluvio-marin,
marine marsh and/or fresh water marsh facies types. The early middle Holocene of Hai
Hung 2 formation is built up by the marine facies which led to a rapid rise in sea level to

12
perhaps 1-3 m above present levels between 7,000-6,000 yr BP (NGHI et al. 1991;
TANABE et al. 2003b; TANABE et al. 2003c; SAITO et al. 2004; LAM 2005). This formation
is covered by Thai Binh formation of late Holocene. It consists of fluvial, fresh water
marsh sediments. The Thai Binh formation is composed of an upward-fining unit of
gravel, sand, and clay. It is developing up to now (3,000 yr BP - present day) (HAI and
HARUYAMA 2004).
Fig. 2.1 Quaternary stratigraphic column of the RRD (modified after (MINH and DAN 1991)
UPPERPLEISTONE
MIDDLEPLEISTOCENE
LOWERPLEISTOCENE
RECENT
HOLOCENE
NEOGENE
TRIAS+
OLDER Pre-Quaternary bedrock
Sands andgrevels withthan claylenses
Major aquifer
Lechiformation
Hanoiformation
Aquiclude
Aquiclude
Aquiclude
Aquifer/Aquiclude
Aquifer
AquiferSands
Discontinuousclay
Sands andgravels withthin claylenses;contains tectite clasts
Vinhphucformation
Haihung-2formation
Clays, siltsand sands
Marineclay layer
Sands and silts
Palaeosol?Marine clay
Sands with pebbles at baseDistributery channel
Floodplain peats,silts and clays Thaibinh
formation
Mainly“Low-stand”
sequence
Mainly“High-stand”
sequence
EventAgeHydrogeology+s
ilt Sand
Gravel
up to30m
up to60m
up to20m
up to30m
up to50m
up to5m
Clay
Haihung-1formation

13
2.2.2. Tectonics The tectonic movement in Holocene was characterized by block subsidence movement
with different velocities. It is the main cause leading to the sediment thickness
differentiation. Basing on the sediment thickness differentiation from mainland to the sea,
the following structural blocks separated by tectonic faults in direction NE - SW can be
named as follows (Fig. 2.2) (NGOI 2000). The subsidence rate of the basin is 0.04-0.12
mm/y in Neogene and Quaternary (MATHERS et al. 1996).
1. Block I: characterized by gentle subsidence in Holocene is controlled by Luoc fault
(NW). The thickness of the Holocene sediment is varied from 12 m to 25 m.
2. Block II: characterized by weak subsidence in Holocene is controlled by 2 faults: Ninh
Binh - Kien An fault (SE) and Luoc fault (NW). The thickness of the Holocene sediment
is varied from 20 m to 40 m.
3. Block III: characterized by intensive subsidence in Holocene is controlled by KienAn -
Ninh Binh fault (NW) and coastal fault (SE). The thickness of the Holocene sediment is
varied from 40 to 63 m. Some subsidence anomalies with subsidence speed of about 5
mm/yr were formed in Hai Hau district.
IV
IV
Block with gentle subsidence
NAM DINH
HUNG YEN
THAI BINH
Tien Hai
Ba Lat mouth
Vinh Linh fault
Chay River fault
Ninh Co river
Tra Ly mouth
Luoc River fault
Red River fault
Ninh Binh-Kien
An fault
Lo River fault
RED RIVER
105°50’ 106°21’
106°21’105°50’0 5 10 15km
Block with intensive subsidence
Block with intensive uplift
Deep fault
Fault information
I
III
II
20°50’
20°50’
20°13’
20°13’
Block with weak subsidence
I
III
II
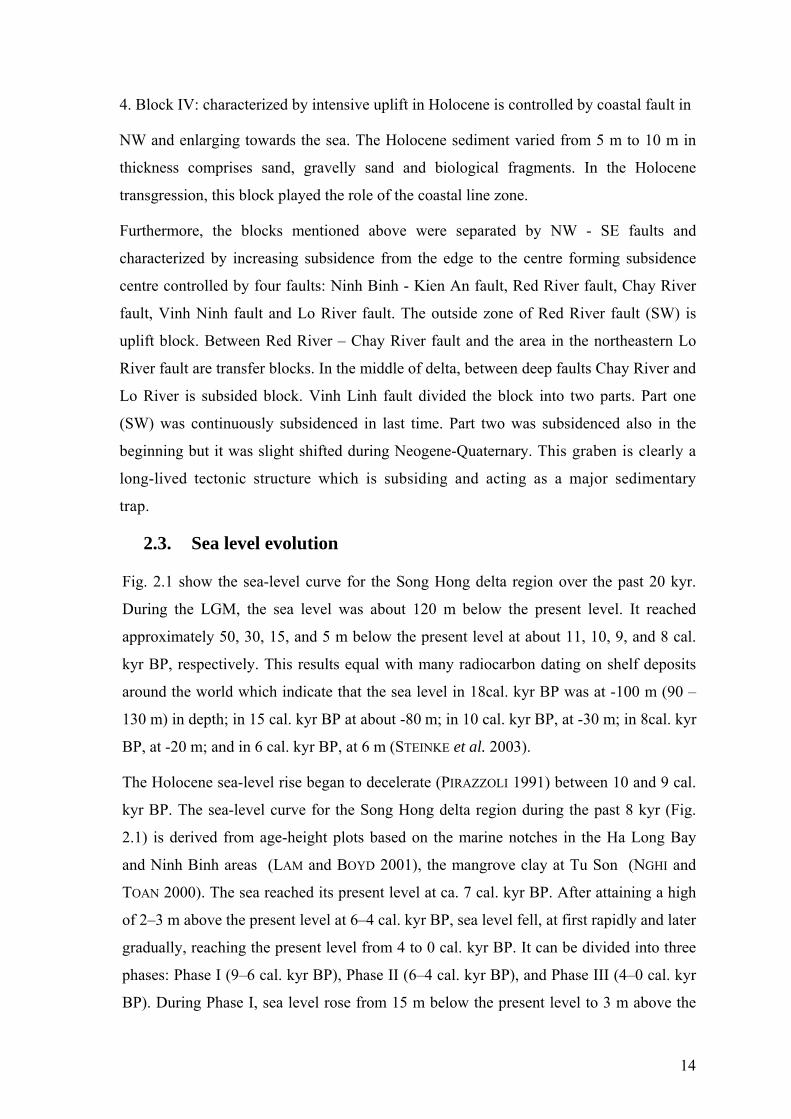
Fig. 2.2 Holocene tectonic scheme in RRD (modified after NGOI 2000, THANG 1998)
14
4. Block IV: characterized by intensive uplift in Holocene is controlled by coastal fault in
NW and enlarging towards the sea. The Holocene sediment varied from 5 m to 10 m in
thickness comprises sand, gravelly sand and biological fragments. In the Holocene
transgression, this block played the role of the coastal line zone.
Furthermore, the blocks mentioned above were separated by NW - SE faults and
characterized by increasing subsidence from the edge to the centre forming subsidence
centre controlled by four faults: Ninh Binh - Kien An fault, Red River fault, Chay River
fault, Vinh Ninh fault and Lo River fault. The outside zone of Red River fault (SW) is
uplift block. Between Red River – Chay River fault and the area in the northeastern Lo
River fault are transfer blocks. In the middle of delta, between deep faults Chay River and
Lo River is subsided block. Vinh Linh fault divided the block into two parts. Part one
(SW) was continuously subsidenced in last time. Part two was subsidenced also in the
beginning but it was slight shifted during Neogene-Quaternary. This graben is clearly a
long-lived tectonic structure which is subsiding and acting as a major sedimentary
trap.
2.3. Sea level evolution
Fig. 2.1 show the sea-level curve for the Song Hong delta region over the past 20 kyr.
During the LGM, the sea level was about 120 m below the present level. It reached
approximately 50, 30, 15, and 5 m below the present level at about 11, 10, 9, and 8 cal.
kyr BP, respectively. This results equal with many radiocarbon dating on shelf deposits
around the world which indicate that the sea level in 18cal. kyr BP was at -100 m (90 –
130 m) in depth; in 15 cal. kyr BP at about -80 m; in 10 cal. kyr BP, at -30 m; in 8cal. kyr
BP, at -20 m; and in 6 cal. kyr BP, at 6 m (STEINKE et al. 2003).
The Holocene sea-level rise began to decelerate (PIRAZZOLI 1991) between 10 and 9 cal.
kyr BP. The sea-level curve for the Song Hong delta region during the past 8 kyr (Fig.
2.1) is derived from age-height plots based on the marine notches in the Ha Long Bay
and Ninh Binh areas (LAM and BOYD 2001), the mangrove clay at Tu Son (NGHI and
TOAN 2000). The sea reached its present level at ca. 7 cal. kyr BP. After attaining a high
of 2–3 m above the present level at 6–4 cal. kyr BP, sea level fell, at first rapidly and later
gradually, reaching the present level from 4 to 0 cal. kyr BP. It can be divided into three
phases: Phase I (9–6 cal. kyr BP), Phase II (6–4 cal. kyr BP), and Phase III (4–0 cal. kyr
BP). During Phase I, sea level rose from 15 m below the present level to 3 m above the

15
present level at a rate of 6 mm/yr. During Phase II, sea level was stable. During Phase III,
it dropped from 3 m above the present level to the present level at an average rate of
0.67-0.1 mm/yr (TANABE et al. 2003b).
In comparison with other sea-level curves for the western coast of the South China Sea,
the relatively rapid sea-level fall of Phase III can be widely observed along the western
coast. The mid-Holocene marine terraces in the RRD plain (MATHERS and ZALASIEWICZ
1999; NGHI and N.Q. 1999; LAN 2000; STEINKE et al. 2003; SCHIMANSKI and
STATTEGGER 2005; TANABE et al. 2006) and those on Hainan Island (QIU, 1986 in
(PIRAZZOLI 1991), along the Vietnamese coast (TAM 1991), and on the small islands off
the Vietnamese coast (BIEU et al. 1999) suggest that rapid sea-level lowering, ranging in
magnitude from 0.5 to 4 m, occurred after about 4 kyr BP (4.5–4.0 cal. kyr BP). An
emerged marine notch in the Mekong delta plain, which indicates a sea level 2.5 m above
the present level at 4.2 cal. kyr BP (LAP et al. 2000), also supports this suggestion. Along
the coast of Gyangdong, China, indicators of higher sea levels, including cheniers
(HUANG et al., 1986, 1987 in PIRAZZOLI, 1991), suggest that the sea level started to fall
gradually from a height of 2 m above the present level to the present level at about 3 kyr
BP (2.8 cal. kyr BP). Furthermore, recently reported sea-level curves, reconstructed on
the basis of numerous age–height plots, including those from marine notches along the
Gulf of Thailand (SINSAKUL 1992), indicate that sea level started to fall at 4–3 kyr BP
(4.5–2.8 cal. kyr BP) from a height of 2–4 m above the present level. In summary, a
relatively rapid sea level fall with a magnitude of 0.5–4 m occurred widely along the
western coast of the South China Sea during the past 4.5 kyr, particularly at 4–3 cal. kyr
BP.

16
Dep
th b
elow
pre
sent
sea
leve
l (m
)0
-20
-40
-60
-80
-100
-1200 5000 10 000 15 000 20 000
Age (cal. yr BP)
Present sea level
Geyh et al. 1979Tran and Ngo, 2000Hanebuth et al., 2000Lam and Boy, 2001
Ha Long Bay (Lam and Boyd, 2001)Ninh Binh (Lam and Boyd, 2001)Tu Son (Tran and Ngo, 2000)
Hei
ght a
bove
pre
sent
sea
leve
l (m
) 4
3
2
1
00 1000 2000 3000 4000 5000 6000 7000 8000
Age (cal. yr BP)
(A)
(B)
Fig. 2.3 (A) Sea-level curve for the western margin of the South China Sea during the past 20 kyr. (B) Sea-
level curve in the Song Hong delta region during the past 8 kyr (modified after TANABE et al. 2003b).
17
2.4. Lithology and mineralogy
2.4.1. Lithology The lithological or sedimentary petrology is “the study of the composition, chracteristics,
and origin of sediments” (BATES L.R, JACKSON A.J.,1987 in Glossary of geology). The
understanding of lithology is connected closely to the studying of sediment (REINECK and
SINGH 1973). Thus, most of works about sediments in RRD were concerned about it.
The first study of lithology in sediment of RRD was published by Gourou in 1936 but the
Quaternary geology of RRD began only 30 years ago. Dealing with macrocharacteristics
of lithology e.g. fauna, pollen and facies for detailed division of Quaternary lithology-
stratigraphy by using classical methods - allostratigraphy and ages (fauna, pollen,
radiocarbon dating). The stratigraphy includes three Pleistocene and two Holocene
formations: Thai Thuy (KY 1976) or Le Chi (early Pleistocene) (NGHI et al. 1991), Ha
Noi (middle-later Pleistocene) and Vinh Phuc (later Pleistocene); Hai Hung (early-middle
Holocene) and Thai Binh (later Holocene) (KY 1976). These formations can be correlated
with eustatic cycles under creation of environmental (facies) sedimentary types (NGHI et
al. 1991). Assemblages of spores and pollen, foraminifera, diatoms were established (HAI
and HARUYAMA 2004). A model of this scheme effectively used in geological mapping at
middle and large scale (1: 200,000; 1:50,000) is shown in Fig. 2.1, but it only points
chronostratigraphy correlation without the identification of processes responsible for
sediment supply, dispersal and deposition in a delta wide scale.
Holocene lithostratigraphy and lithofacies have been studied more detailed in some
works. By the results of granulity analysis, environment indices (Eh, pH and absorption
cations), spores and pollen, foraminiferas, diatoms, 14C dating, sediment structure in X-
ray radiographs. It can be recognized that the evolution of RRD in Holocene passed three
stages: estuarine-lagoon stage, corresponding to the Holocene transgression (5 recognized
sedimentary facies); deltaic stage, corresponding to the Holocene regression during
middle-later Holocene (11 sedimentary facies). The deltaic stage is divided into 2
substages which are predominated of salt marsh and mangrove forest stage, and alluvial
stage with the development of 3 plain types: fluvial dominated system, wave dominated
system and tidal dominated system . In addition, seven distributary lobes formed during
Holocene regression have been established. Total thickness of Holocene sediments
changed from 10 m in the Hung Yen area to 56 m along the recent coastal zone at Thai

18
Binh- Ninh Binh (LAM 2003; LAM 2005)
According to the development of spores and pollen, four stages can be distinguished.
- 8-7 kyr BP: the tropical and subtropical conditions.
- 7-6 kyr BP: the tropical-humid climate.
- 6-3 kyr BP: The climate was warmer and belonged to the hot-humid tropical character.
- 3-0 kyr BP:The vegetation cover changed in accordance to the sea transgression
(happening at the time of 10-6 kyr BP, 3.5-2.5 kyr BP and 1-0 kyr BP) and sea regression
(6-3.5 kyr BP and 2.5-1 Kyr BP) (HAI and HARUYAMA 2004)
However, the study on spores and pollen from 10 boreholes has been showing that in
Holocene deposits has only two assemblages can be divided. The first assemblage is
abundant in pollen of mangrove plants with the most development of the Rhizophora
family (9.6-4.5 kyr BP). The second assemblage is rich in pollen of mangrove plants in
the degeneracy stage of the Sonneratia family (6.6-0.5 kyr BP) (HAI and HARUYAMA
2004)
The results of pollen, ASM-14C and facies study in VN and GA cores (LI et al. 2006)
shows that during the period 10,470–5,340 cal. yr BP, the tropica land subtropical
evergreen monsoon forest indicates a warm climate; however, a slight cooling stage
between 9,310 and 8,540 cal. yr BP was detected. After 5,340 cal. yr BP, the diversity of
vegetation increased, dominated by tropical and subtropical moist evergreen taxa with
abundant wetland components. This period, with a warm and wet climatic character lasted
until the climatic cooling at 4,530 cal. yr BP. Three climate cycles after 5,000 cal. yr BP
were identified: a cool and wet climate stage during 4,530–3,340 cal. yr BP, followed by
a warm and dry stage during 3,340–2,100 cal. yr BP; then, a cooling climate during
2,100–1,540 cal. yr BP under wet conditions, followed by a warming trend from 1,540 to
now. Beginning about 3,340 cal. yr BP, human impact is indicated by theremarkable
increase in Gramineae and secondary forest in both cores and the evidence for the
cultivation of wet rice. Especially after 2,100 cal. yr BP, upland cultivated species
increased obviously, reflexting human activities spreading up into montane areas.
Moreover, lithological correlation were developed after apply sequence stratigraphy
method. By compare AMS 14C age, building the stratigraphy, the changing of lithology or
sediment will be constructed from the difference location. The advantage of the
comparison is to identify the forming condition and transposition of sediment. For
19
example, in the same time and same climate, minerals will be young and concentrated
with high amount near the supply source, after the transportation, they will be changed
and spreaded out with low amount. This is the first idea to rearch RRD sediments.
2.4.2. Mineralogy
Non –clay minerals
Until now, there are no publications that mention about evaporated minerals at least in
Asia or RRD. Although RRD is under a subtropical monsoon climate regime, flow
regime in RRD region varies seasonally. Moreover, approximately 90% of the annual
sediment discharge occurs during the summer monsoon season. This is the good
condition to evaporates minerals were formed when sea water evaporating in exposed
sediment, in dry season.
According Lam (2003), the coarse fraction (>63 µm) of the Holocene sedimentary facies
(river bed, point bar, levee, distributary lobe, tidal channel, shore ridge, distal bar,
distributary mouth bar, tidal ridge, intertidal flat) is characterised by a polymineral
assemblage and includes quartz - 65-80%, rock fragments - 20-15% , mica, and feldspar.
The percentage of the constituents within this assemblage differs only slightly. Sands are
usually well sorted and rounded. Heavy minerals are usually concentrated in beach and
shore ridge sand. Some pyrite has been found in estuarine deposits and pyrite-siderite in
backbar swamps.
Clay minerals
Clay minerals were investigated to understand the depositional environment as well as the
origin and provenience of the sediments (CHAMLEY 1989; SRODON 1999). They are very
sensitive regarding changes of depositional environment and especially during the
weathering processes.
In accordance to many authors (CHAMLEY 1989; HAY et al. 1991; MEUNIER 2005) for
clay minerals weathering pathways from source rock to residuals can be described. In
general, illite and chlorite are the first clay mineral formed in young soil. They usually are
indicator of cool/dry weather (CHAMLEY 1989). More developing, the physical and
chemical weathering factor like pH, temperature, available water and pore solution
control elements e.g. Si, K, Al in soil to form other mineral (JACKSON 1964). For
example, the enrichment of Si in environment during dry periods will be slowly lead the
substitution of Al by Si and form illite-smectite mixed layer, smectite. Again, high

20
rainfall, high chemical activity in warm/wet climate Si and other cation with be released
from pore solution and higher amount of kaolinite, halloysite and finally gibbsite will
develop (JACKSON 1964).
During the transportation, clay minerals have different behaviours. Gibbsite is usually lost
due to it low tolerance for silica in solution (VELDE 1985). Hense, gibbsite has very low
content in aqueous fluid. They were indicator for the in-situ mineral or reworked material
on the location. Where flocculation does not occur, the finer clay particles which roughly
equates like smectite remain in suspension longest and are transported further offshore
(RICHARD 2005). In addition, illite has coarsest grains (100 to 0.4 µm), kaonilite is finer
(10-0.4 µm), and smectite is the finest (0.9 to 0.1 µm) (GIBBS 1977). Gibbs shows that in
Amazon River delta, the smectite content increase and illite and kaolinite decrease with
increasing distance from soil due to the grain size range. Thus, the concentration of clay
mineral not only have influence of climate but transportation also.
Clay mineral investigations were carried out to study sediments in general and delta in
particular. The variation of the clay mineral distribution in Yangtze delta plain in different
Holocene stages is determined by several major physical factors, i.e. sea level fluctuation,
climate change, and sediment sources (WANG Z. et al. 2005). Smectite distribution of
early Holocene was linked to the rapid sea-level rise, which induced land inundation. As
verified by pollen assemblages, high amount of chlorite in early Holocene can be
correlated to colder temperature and high amount of kaolinite in mid-Holocene were
possibly associated with a warm climate. The terrigenous sediment sources of late
Pleistocene and early Holocene were primarily derived from the provincial highlands and
the sediments of late Holocene were proved from the Yangtze basin. Moreover, after
MOON (2000), the abundance of chlorite is inversely related to that of smectite. The
kaolinite content is constant, and so it is clear that chlorite originating from the Han River
was transformed to smectite by pedogenesis during regression periods. Therefore, the
relative contents of clay minerals from the unconsolidated materials in the tidal flat of
Youngjong Island can be used as indicators of transgression and regression in accordance
with the sea-level fluctuation.
However, there are not much works contributed in the important role of clay mineral in
Asian delta as well as in RRD. Before 2000, clay mineral were studied for geological
mapping geological map of the area (TOAN 1995), analysing surface soil (THANH and
KAZUHIKO 2000; TRA et al. 2000) or distinguished sedimentary facies (NGHI et al. 2002;

21
LAM 2003). From 2000 up to now, clay mineral were assessed in some locations of RRD
(NIEDERMEYER 2001; GROTHE 2003; KASBOHM et al. 2003; GROTHE et al. 2005). They
showed that quartz, feldspars, mica are the source minerals at the beginning of the
weathering chain. They accumulated in the coastal zone where they experience further
alterations related to sea level change. Their alteration, therefore, reflect not only the
change of climate as mentioned above but is an indicator of sea-level fluctuation as in the
Yangtze delta, Youngjong Island.
Modern technology of methodology in clay mineral studies recognized that Holocene
sediments in Nam Phu core (TB2 in this work, near Balat river mouth) were formed and
accumulated under different climate conditions (GROTHE 2003; GROTHE et al. 2005). Due
to the content of smectite or montmorillonite according NGHI (2002) the chemical
weathering conditions with high rainfall and low sedimentation rates during middle
Holocene seafloor/prodelta development were established (8.5-6.5 cal. kyrs BP?).
However, the conclusion is only based on data from one core with limited time resolution
due to missing 14C age.
Hence, to contribute more detailed knowledge of mineralogy as well as lithology of
Holocene sediments in the central RRD, our study was carried out. It emphasizes
concerns the application of the concepts of sequence stratigraphy and the evolution of
RRD in context of eustatic sea level changes by special study of especially structure,
texture, mineralogical composition (LIEU et al. 2005), clay minerals, fauna, fossils and
AMS 14C for our six cores and other reference four cores in central RRD.
22
3. METHODOLOGY
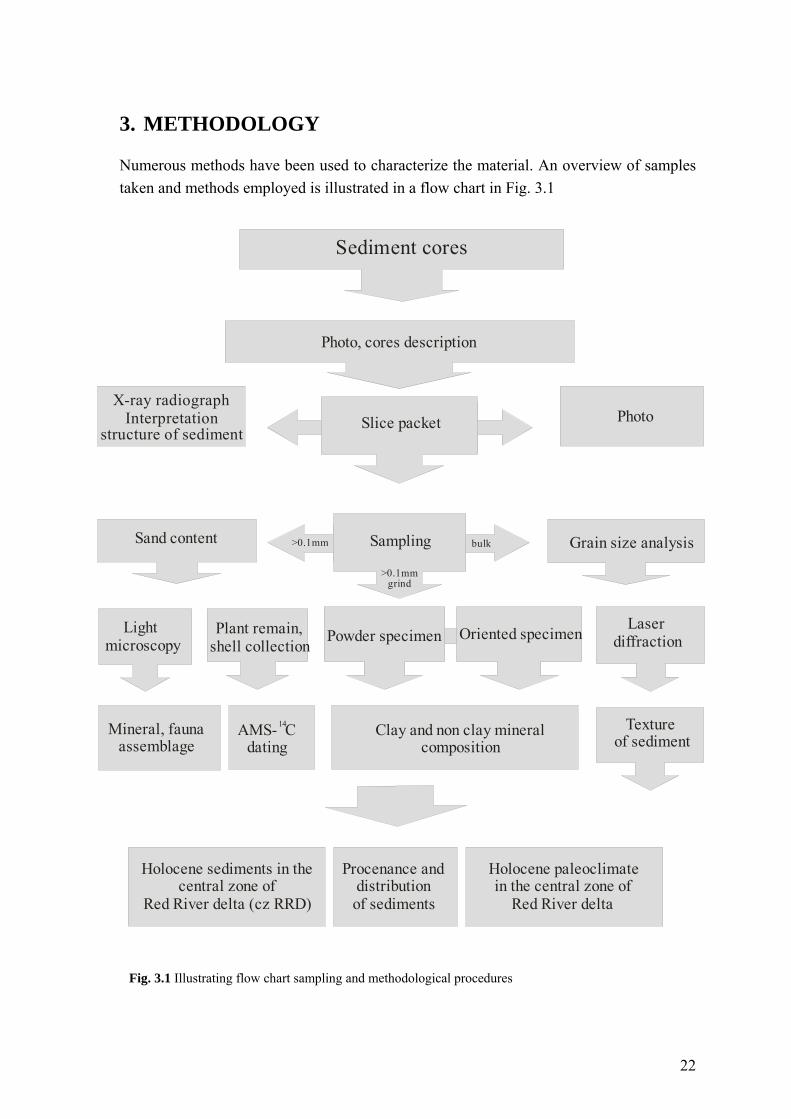
Numerous methods have been used to characterize the material. An overview of samples taken and methods employed is illustrated in a flow chart in Fig. 3.1
Fig. 3.1 Illustrating flow chart sampling and methodological procedures
X-ray radiographInterpretation
structure of sediment
AMS- C dating
14
Sediment cores
Photo
Sampling
Photo, cores description
Slice packet
bulk
>0.1mmgrind
Oriented specimenLight microscopy
Grain size analysis
Laser diffraction
>0.1mm
Texture of sediment
Clay and non clay mineral composition
Sand content
Mineral, fauna assemblage
Plant remain,shell collection
Holocene sediments in thecentral zone of
Red River delta (cz RRD)
Procenance and distribution of sediments
Holocene paleoclimate in the central zone of
Red River delta
Powder specimen

23
3.1. Sampling and core description
Two boreholes were cored in February, 2001 and five boreholes were cored in March, 2004 in RRD, Vietnam (Tab. 3.1).
Tab. 3.1 Station list of the sediment cores with sediment recovery
Core Time of drilling
core
Carried out by
Penetrationdepth (m)
Core recovery
(%)
Altitude (m) Latitude Longitude
1 TB1 03-2002 S.Grothe, Prof.R.Lampe, 52 71 1.82 ±
0.1 20°22’32’’ 106°27’38’’
2 TB2 03-2002 S.Grothe, Prof.R.Lampe, 70 82 1.82 ±
0.1 20°19’08’’ 106°33’48’’
3 HN 24-02-2004 Lieu N., Duong N., 38 61 12.49 ±
0.1 20°59’45’’ 105°50’36’’
4 YM 27-02-2004 Lieu N., Duong N., 35 48 3.5 ± 0.1 20°52’33’’ 106°06’07’’
5 TB3 15-03-2004 Lieu N., Duong N., Prof.R.Lampe
46 85 3.6 ± 0.1 20°31’58’’ 106°15’59’’
6 HT 21-03-2004 Lieu N., Duong N., Prof.R.Lampe
40 90 5.3 ± 0.1 20°48’49’’ 105°50’48’’
Boreholes were drilled by using the rotary drilling method. The core tubes had 1 m or 1.5
m in length and 9 cm in diameter. However, during the drilling procedure the tube was
screwed a bit into the sediment, whereby it might came to disturbances on the sample
material. To avoid heavy disturbances, material was sampled usually from the lowest part
of the tube. The peripheral part of the core section was rejected in order to exclude
disturbed sediment. Sandy materials was often gone lost because no core catcher was
mounted on the coring tube.The drilling was supported by Bentonit, i.e. contaminations
must be considered in the clay-mineralogical investigations.
In the field the principal samples were split, photographed and macroscopically
described. The sediment was described in colour, grain size (sand, silt, mud), content of
marine organisms (foraminifera, shells, sea urchins), in detail-recorded transitions and
sedimentary structures like burrows, erosional surfaces. After that, the samples were
immediately cut and packed in plastic box. Dimensions of the plastic boxes are 25 cm
long, 1 cm high and 10 cm wide (or 25 cm in length, 1 cm in height and 10 cm in width).
They were stacked and locked with package tape as hermetic as possible. For the loss
ranges, the remain materials were taken in plastic cups and plastic bag. Core ranges with
high portion of mollusca were collected in cups, too.
24
3.2. X-ray radiography
Beside macroscopically description was done in the field, X-ray radiographs were usually
used to analyze the internal sedimentary structures. Interpretation is based on the
visualisation and analysis of opacities on a radiograph.
The basis of this method is that X-rays photons have the potential to penetrate materials.
They will be attenuated partly by the materials, and the others will pass through the
materials to interact with and expose to the radiographic film. With the same thickness,
absorption of X-Rays is a function of the atomic number. The greater the amount of
materials absorption, the fewer X-Ray photons reach the film, and the whiter the image
on the film. Therefore the radiograph will display a range of densities from white, through
various shades of grey, to black, and the knitting between the different colour will show
the structure of sediment (HAMBLIN and KENNETH 1962). For example, clay absorbs X-
ray photons better than sand, because its gap fullness than sand in the same volume. The
result in film will be displayed light grey for clay and dark grey for sand. Similarly, shell
fragments (calcium carbonate) will be better absorbed than coal or plant remains
(REINECK and SINGH 1973).
160 samples of X-ray radiographies were analyzed for grain size, sediment structure and
degree of bioturbation, especially focussing on the identification of discontinuities within
the deposits process. X-ray films of Strukturix D4 of AGFA with 23.5 cm in length and
9.5 cm in width are used. The fresh opened samples (for both of silt and clay silt
sediment samples) are laid on the films and they were exposed to X-ray radiation at 36
kV, 5 minutes and amperage of 8 mA (SCHIMANSKI 2002). The films were developed and
scanned afterwards in the laboratory. Then the contrast and colour adjustment of the
picture are treated with the Adobe Photoshop 6.0 software to get better quality.
This method can detect finest lamination, cross bedding, erosion surface, shell, rooting
course, plant remains, bioturbation in samples even small traces. Most of them are
invisible to the naked eye but they are important indicators for studying structures in the
paleo-environment.
3.3. Grain size analysis
Variation of the grain size can be an important facies indicator of changes occurring in
erosion of the hinterland and river discharge which influence the amount and sedimentary
composition on the detrital sediment. The granulometry was carried out by laser

25
diffraction method using Frisch Analysette because of a compositionally homogeneous of
RRD samples.
Cleaned, random samples are dispersed in carrier fluid. Laser beams is diffracted when
directed through the fluid. The laser analyzer with a neon-helium laser source employs
low-angle light scattering based on the Mie theory. The angle of scattering is inversely
proportional to the particle size, while the intensity of scattering is proportional to the
number of particles (ESHEL et al. 2004).
About 500 samples were pre-treated. The material was taken from the core plastic box: 1 sample (about 0.1 gram material) in each 5 cm along the core of TB1 and TB2 and in each 8 cm along the core of TB3, HT, HN, HD, YM. Mollusca, Gastropoda or shell fragments were removed by HCl 10%. All samples were cooked with 100°C in H2O2 to remove plant remains and organic components. The sample material afterwards was treated with the well dispersing agent Pyrophosphat (Na4P2O7). This solution was shaken in ultra-sonic waves during 2 minutes before analysis. The pump speed is from 250 to 300 ml min-1, the stirrer speed is from 130 to 150 round min-1 during measurement process.
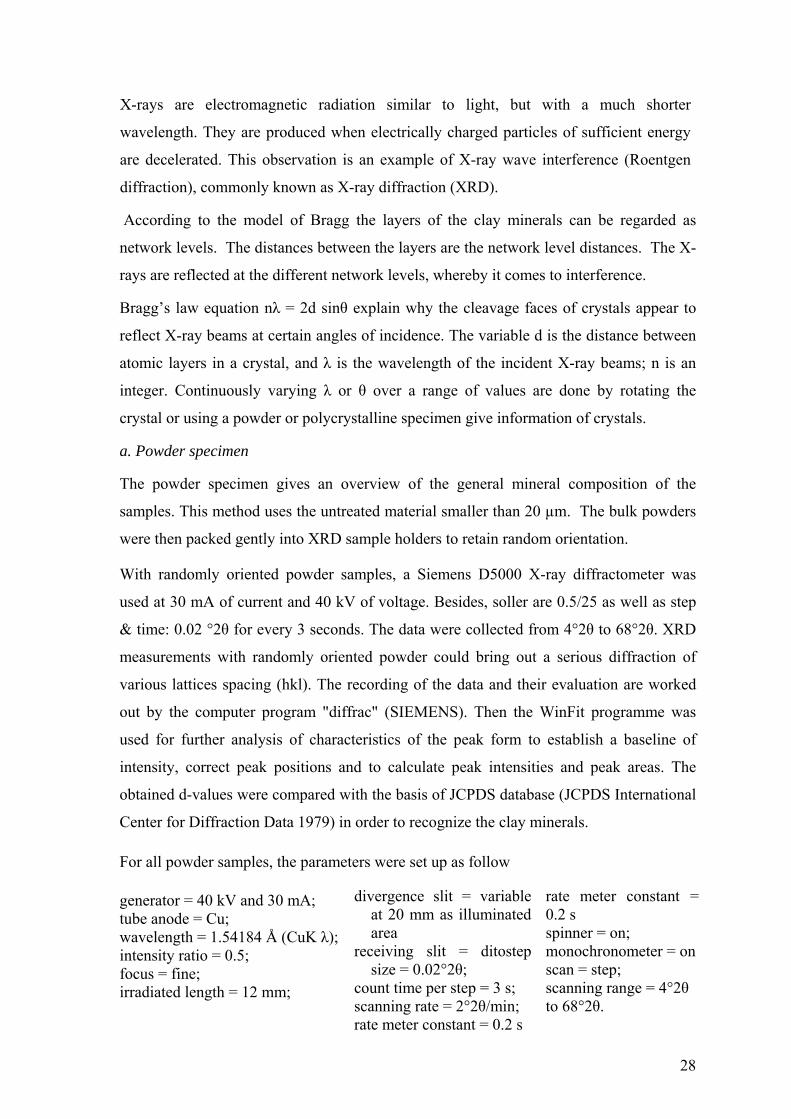
Fig. 3.2 (A) Classification and description of grain size fraction (SCHROEDER 1992). (B) sediment types of
the fine fraction plotted in a ternary coordinate system. S, s = Sand, sandy; Si, si = silt, silty; C, c = clay,
clayey; M, m = mud, muddy. 1, 2, 3 is fine, medium, coarse graine, respectively. For example, point ( ) has
2% sand, 98% silt, 15% clay, is medium clayey silt sediment. (SCHEFFER and SCHACHTSCHABEL 1998)
The result was classified by percentage of clay (<2 µm), fine silt (2 µm - 6.3 µm),
medium silt (6.3 µm - 20 µm), coarse silt (20 µm - 63 µm), fine sand (63 µm - 200 µm),
medium sand (200 µm - 630 µm), coarse sand (630 µm - 1000 µm), according to the DIN
4022 and (SCHROEDER 1992; SCHEFFER and SCHACHTSCHABEL 1998).
% S
and
(63-
2000
m
)μ
% C
lay (< 2 m
)μ
% Silt (2-63 m)μ
100
90
80
70
60
50
40
30
20
10
20 30 50 60 80 90 100704010
10090
60
7080
5040
3020
10
2
3
3 24
43 2
3
43
2
22
4Ss Sis3 Ssi Si
SicSimsSms
McMcs
MsSc
Sc
Cs3Cu3
Csi42Cu
Cm Cu2
Cc
4
Equivalent-01) Descriptionmm µm of grain-fraction>200 Boulders
200-63 cobbles63-20 coarse gravel20 - 6,3 medium gravel6 , 3 - 2 fine gravel
Gravel Coarsegrained
2000 - 630 coarse sand630 - 200 medium sand
2 -0,063
200 - 63 fine sandSand
6 3 - 20 coarse silt20 - 6,3 medium silt
0,063 -0,002
6 ,3 -2 ,0 fine siltSilt
2 ,0 - 0,63 coarse clay0 ,63 - 0,2 medium clay< 0,002
<0,2 colloidsClay
Finegrained
(A) (B)
26
There are several popular ways in which grain-size data can be plotted and treated
statistically like the histograms, frequency curves, and cumulative curves, in which
cumulative curves is the most common method. It is plotted on logarithmic paper.
Generally, quartiles Q1 (25 %), Q2 (50 %), and Q3 (75 %) are read from the curve (Fig.
3.2). Then the following Trask's parameters (REINECK and SINGH 1973) are calculated
with the help of these quartiles. System of Trask’s parameters was chosen but not Folk’s
or the other because grain size results were well showed with sedimentary development
and environmental change. It concluded following parameters.
- Mean grain size (Md) designates grain size. It lies in cumulative curves with the y-
coordinate 50% (Q50).
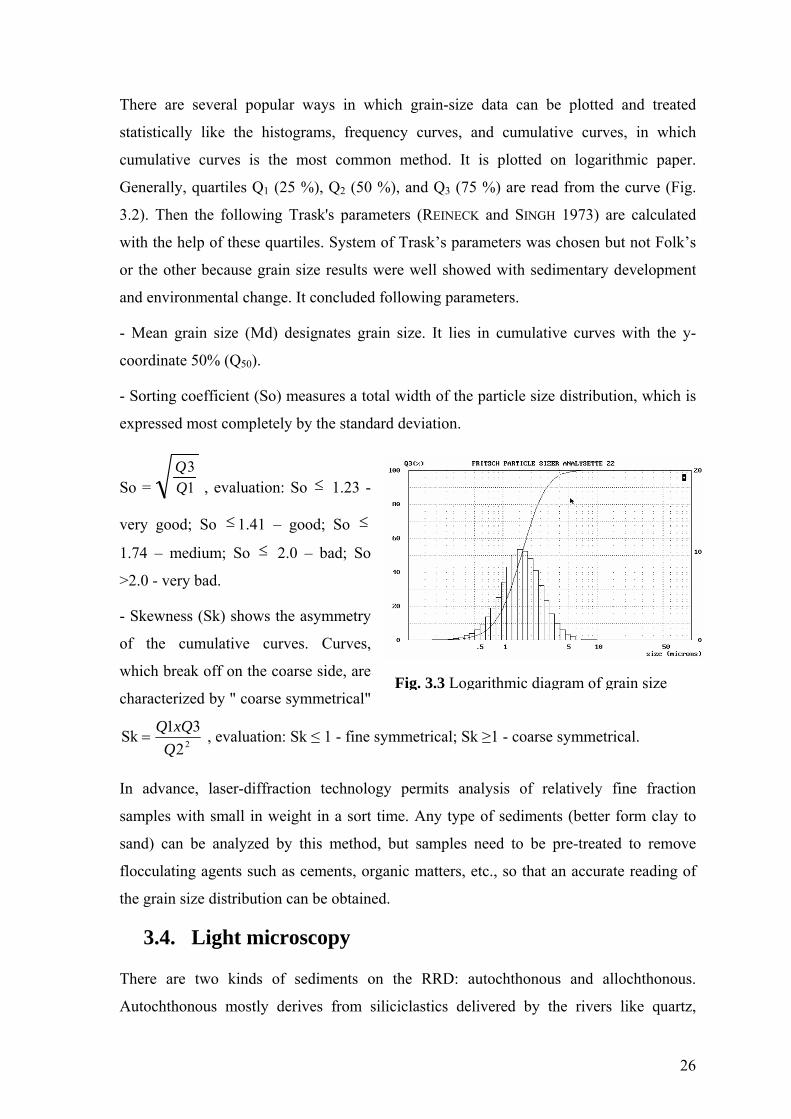
- Sorting coefficient (So) measures a total width of the particle size distribution, which is
expressed most completely by the standard deviation.
So = 13
, evaluation: So ≤ 1.23 -
very good; So ≤ 1.41 – good; So ≤
1.74 – medium; So ≤ 2.0 – bad; So
>2.0 - very bad.
- Skewness (Sk) shows the asymmetry
of the cumulative curves. Curves,
which break off on the coarse side, are
characterized by " coarse symmetrical"
2231Sk
QxQQ
= , evaluation: Sk ≤ 1 - fine symmetrical; Sk ≥1 - coarse symmetrical.
In advance, laser-diffraction technology permits analysis of relatively fine fraction
samples with small in weight in a sort time. Any type of sediments (better form clay to
sand) can be analyzed by this method, but samples need to be pre-treated to remove
flocculating agents such as cements, organic matters, etc., so that an accurate reading of
the grain size distribution can be obtained.
3.4. Light microscopy
There are two kinds of sediments on the RRD: autochthonous and allochthonous.
Autochthonous mostly derives from siliciclastics delivered by the rivers like quartz,
Fig. 3.3 Logarithmic diagram of grain size

27
feldspar, mica. The regression with marine influence formed the multiform of
allochthonous like gypsum, micro-organisms (mostly foraminifera) and shell fragments.
The sand composition has been only determined on cores TB1, TB2, TB3, and HT. The
samples taken to X-ray radiograph and grain size analysis must be used for sand
component determination. These were washed, classified into two groups of fractions:
from 0.1 mm to 0.25 mm and over 0.25 mm by sieve. The samples then split with an
Otto-microsplitter until at least 300 grains left for counting (PLAS and TOBI 1965). The
counted number of each item such as quartz, feldspar, gypsum in each group is
interpreted in percent. From this percent and the weight ratio of each group, the sand
composition can be calculated.
In the coarse grain analysis the following groups were considered.
Autochthonous Allochthonous quartz gypsum plant felspar siderite mollusca mica limonite gastropoda rock pyrite foram hyaline
foram agglutinated other fauna
The coarse grain analysis is a useful tool in environments with a high facies variability
(COLEMAN 1981; READING and COLLINSON 1986). Transitions from more terrestrially
influenced to more marine influenced environments that is implicated by sea-level rise,
are recorded in the composition of the coarse fraction, which allows, together with other
proxies, a precise facies interpretation (SCHIMANSKI 2002).
3.5. Complex Phase Analysis Clay minerals in the study area were mainly delivered by rivers, but also
reworked or formed in the marine environment (NIEDERMEYER 2001; GROTHE 2003).
Variations in mineral sources and - to a lesser extent - in climate influences on mineral
origination have to be considered, too. Here, the samples of Holocene age were
investigated for their clay mineral distribution by X-ray diffraction method. Semi-
quantitative determination by peak area ratio were determined.
About five gram of a sample were homogenized by distilled water and stored with 27°C
at least seven days in the drying furnace. Samples were hand-grinded and sieved to
particle size smaller than 20 µm.
28
X-rays are electromagnetic radiation similar to light, but with a much shorter
wavelength. They are produced when electrically charged particles of sufficient energy
are decelerated. This observation is an example of X-ray wave interference (Roentgen
diffraction), commonly known as X-ray diffraction (XRD).
According to the model of Bragg the layers of the clay minerals can be regarded as
network levels. The distances between the layers are the network level distances. The X-
rays are reflected at the different network levels, whereby it comes to interference.
Bragg’s law equation nλ = 2d sinθ explain why the cleavage faces of crystals appear to
reflect X-ray beams at certain angles of incidence. The variable d is the distance between
atomic layers in a crystal, and λ is the wavelength of the incident X-ray beams; n is an
integer. Continuously varying λ or θ over a range of values are done by rotating the
crystal or using a powder or polycrystalline specimen give information of crystals.
a. Powder specimen
The powder specimen gives an overview of the general mineral composition of the
samples. This method uses the untreated material smaller than 20 µm. The bulk powders
were then packed gently into XRD sample holders to retain random orientation.
With randomly oriented powder samples, a Siemens D5000 X-ray diffractometer was
used at 30 mA of current and 40 kV of voltage. Besides, soller are 0.5/25 as well as step
& time: 0.02 °2θ for every 3 seconds. The data were collected from 4°2θ to 68°2θ. XRD
measurements with randomly oriented powder could bring out a serious diffraction of
various lattices spacing (hkl). The recording of the data and their evaluation are worked
out by the computer program "diffrac" (SIEMENS). Then the WinFit programme was
used for further analysis of characteristics of the peak form to establish a baseline of
intensity, correct peak positions and to calculate peak intensities and peak areas. The
obtained d-values were compared with the basis of JCPDS database (JCPDS International
Center for Diffraction Data 1979) in order to recognize the clay minerals.
For all powder samples, the parameters were set up as follow
generator = 40 kV and 30 mA; tube anode = Cu; wavelength = 1.54184 Å (CuK λ); intensity ratio = 0.5; focus = fine; irradiated length = 12 mm;
divergence slit = variable at 20 mm as illuminated area
receiving slit = ditostep size = 0.02°2θ;
count time per step = 3 s; scanning rate = 2°2θ/min; rate meter constant = 0.2 s
rate meter constant = 0.2 s spinner = on; monochronometer = on scan = step; scanning range = 4°2θ to 68°2θ.

29
b. Oriented specimen Oriented specimen (grain size < 2 µm) preparation should be used for the investigation of
the clay minerals. Therefore, 0.2 g of sample material was diluted with 10 ml water and
rotated within 24 h. After the Atterberg sedimentation the particles <2 µm in suspension
lay off parallel in a Si slides. From this state, basis features of the clay minerals were
reflexed in the X-ray diffraction results. XRD analyses were carried out also on oriented
specimens including air-dried, ethylene-glycolated and 550°C-heated (during 4 hours)
specimens. The diffractometer is HZG 4A-2/Seifert C3000 with CoKα-radiation, 30 kV
of voltage, 30 mA of current and other parameters such as fixed slits: 1.09 mm/6.0 mm,
soller: 0.5/25, detector slit: 0.35 mm. Data recording was started at 4°2θ and ended at
34°2θ with a step size of 0.02°2θ and a count time of 2 seconds per step.
XRD analysis of oriented specimens can check the 001-spacing and the changing of this
spacing that caused by any expendable layers after saturation or thermal treatment. Based
on its different modifications, the minerals which were detected in powder mount were
confirmed or recognized clearly. The data of the oriented mount sample were also
regenerated by deconvolution procedures by means of WinFit (Krumm 1994).
Mineral identification
The result from powder specimen was used to identify the assemblage in each sample. Base on the appearing of following three main peaks, each mineral (both clay and non clay) was named (Tab. 3.2) (GOODBRED and KUEHLB 2000)
The peak area values of clay minerals in oriented specimen after fitting were used to
compare the appearance of minerals (HAY et al. 1991; MOON et al. 2000). It is based
upon the fact that clay minerals have many crystal lattices, hence they reflect X-ray
beams in different directions. If a mineral has high amount in sample, its peak will appear
with high intensity and high value of peak area. According to Starkey (1984), clay
minerals in RRD sediment are identified and interpreted (Tab. 3.3).
- Illite, one of mica clay mineral series, are characterized by intense 10 Å (001) and
3.3 Å (003) peaks that remain unaltered by ethylene glycol or glycerol solvation,
potassium saturation, and heating to 550°C (Fanning and others, 1989) (Tab. 3.2). The
value of area of peak 10 Å from air-dried sample was chosen to calculate. The degree of
crystallization of illite was evaluated by illite well-ordered (10.0 Å) and illite poor-
ordered (10.2 Å) (MEUNIER 2005).

30
Tab. 3.2 Mineral phase in powder specimen (<20 µm) Cu-Kα
Mineral ASTM-Code
d-Value (Å)
Intensity (%) Mineral ASTM-
Code d-Value
(Å) Intensity
(%)
Illite 26-0911 3.34 10.0 5.00
100 90 50
Quartz 05-04903.34 4.26 1.82
100 35 17
Chlorite 07-0166 7.08 14.0 3.52
100 60 50
Anbite 09-04663.19 3.78 6.39
100 25 20
Kaolinite 14-0164 7.17 1.49 3.58
100 90 80
Orthoclase 19-09313.31 3.77 4.22
100 80 70
Vermiculite 10-0613 14.2 4.57 2.85
100 60 30
Pyrite 06-07171.63 2.07 2.42
100 85 65
- Kaolinite and chlorite can be differentiated by comparison of the 3.58 Å and 3.54 Å
peaks, respectively (BISCAYE 1965). Heating alone will not distinguish the dioctahedral
kaolinite group minerals from Fe-rich chlorite because the 002, 003, and 004 chlorite
peaks are also weakened by this heat treatment (MOORE and REYNOLDS 1997). Area of
peak 3.58 Å and 3.54 Å in air-dried sample represents behaviour of kaolinite, chlorite,
respectively.
- Smectite is characterized by the 001 reflection will swell to about 17 Å when
saturated with ethylene glycol; when heated to 500°C, the 001 reflection will collapse to
about 10 Å (MOORE and REYNOLDS 1997). Hence, d-value in 17 Å is usually used to
identify smectite.
- Gibbsite, gypsum was identified by the 001 reflection which collapse to about 4.82 Å,
7.56 Å in air-dried samples, respectively.
- Quartz, orthoclase, albite were identified by the peaks with d values = 3.34 Å, 3.24 Å,
3.2 Å, respectively.
RRD sediments include mostly illite, kaolinite, chlorite so that the total (illite
(i)+kaolinite (k)+chlorite (c)) is the basic balanced denominator. The ratio k/(i+k+c),
c/(i+k+c) reflect the percent of kaolinite, chlorite, respectively. Another ratio is illite well-
orded per illite well ordered plus poor ordered (iw/(iw+ip)) which represents the relative
amount of better crystallized illite. Smectite is not the common mineral in samples, its
behaviour can be expressed in the ratio of smectite (s): s/(i+k+c+s). Beside that, gibbsite -
one of the weathering products of kaolinite in warm/wet climate (mentioned in 2.6) - is
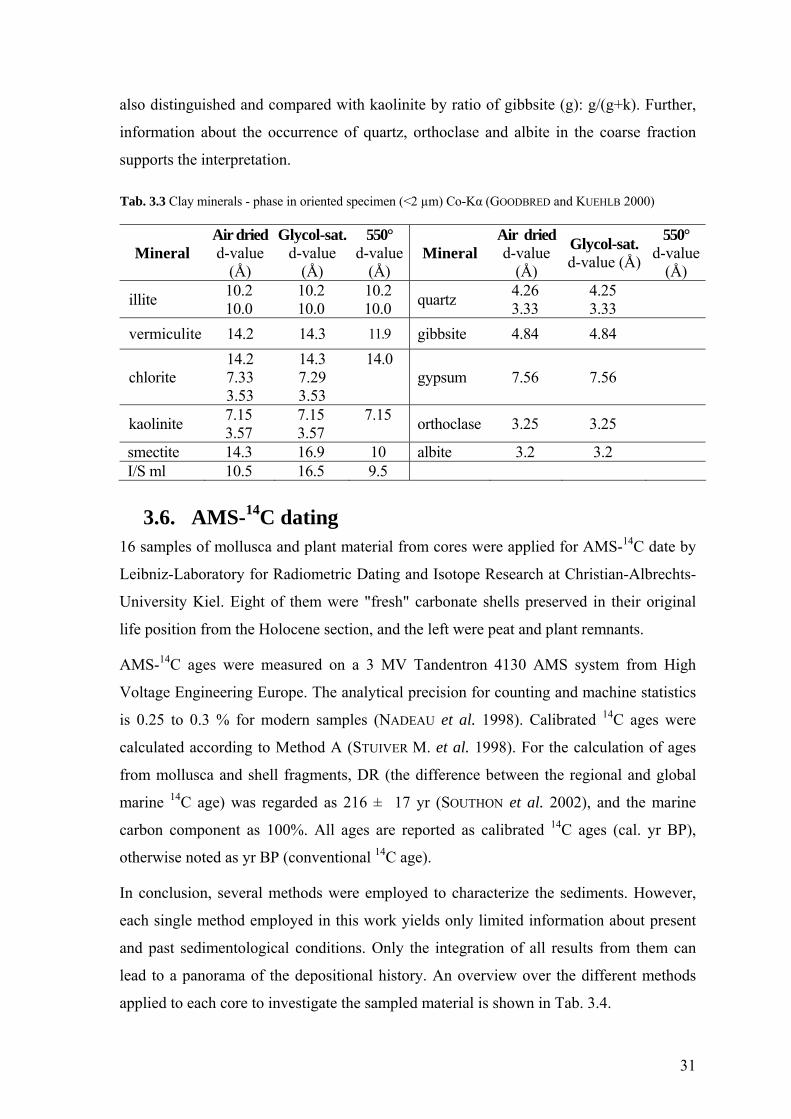
31
also distinguished and compared with kaolinite by ratio of gibbsite (g): g/(g+k). Further,
information about the occurrence of quartz, orthoclase and albite in the coarse fraction
supports the interpretation.
Tab. 3.3 Clay minerals - phase in oriented specimen (<2 µm) Co-Kα (GOODBRED and KUEHLB 2000)
Mineral Air dried d-value
(Å)
Glycol-sat.d-value
(Å)
550° d-value
(Å) Mineral
Air driedd-value
(Å)
Glycol-sat. d-value (Å)
550° d-value
(Å)
illite 10.2 10.0
10.2 10.0
10.2 10.0 quartz 4.26
3.33 4.25 3.33
vermiculite 14.2 14.3 11.9 gibbsite 4.84 4.84
chlorite 14.2 7.33 3.53
14.3 7.29 3.53
14.0 gypsum 7.56 7.56
kaolinite 7.15 3.57
7.15 3.57
7.15 orthoclase 3.25 3.25
smectite 14.3 16.9 10 albite 3.2 3.2 I/S ml 10.5 16.5 9.5
3.6. AMS-14C dating 16 samples of mollusca and plant material from cores were applied for AMS-14C date by
Leibniz-Laboratory for Radiometric Dating and Isotope Research at Christian-Albrechts-
University Kiel. Eight of them were "fresh" carbonate shells preserved in their original
life position from the Holocene section, and the left were peat and plant remnants.
AMS-14C ages were measured on a 3 MV Tandentron 4130 AMS system from High
Voltage Engineering Europe. The analytical precision for counting and machine statistics
is 0.25 to 0.3 % for modern samples (NADEAU et al. 1998). Calibrated 14C ages were
calculated according to Method A (STUIVER M. et al. 1998). For the calculation of ages
from mollusca and shell fragments, DR (the difference between the regional and global
marine 14C age) was regarded as 216 ± 17 yr (SOUTHON et al. 2002), and the marine
carbon component as 100%. All ages are reported as calibrated 14C ages (cal. yr BP),
otherwise noted as yr BP (conventional 14C age).
In conclusion, several methods were employed to characterize the sediments. However,
each single method employed in this work yields only limited information about present
and past sedimentological conditions. Only the integration of all results from them can
lead to a panorama of the depositional history. An overview over the different methods
applied to each core to investigate the sampled material is shown in Tab. 3.4.

32
Tab. 3.4. Methods employed to each core
Grain size analysis Phase analyse
Core No Depth
(m)
Number of
AMS-14C
datings
X-ray
radio-
graphies
Number
of slice
Sample in
slice
Light
microscopy XRD -
powder
XRD –
oriented
TB1 52 3 35 157 5 73 42 15
TB2 70 1 37* 164* 5 80 48* 48*
TB3 46 2 36 96 3 33 35 20
HN 38 5 23 80 3 27 28 12
YM 35 - 30 41 3 15 20 10
HT 40 5 16 70 3 16 26 13 (*): done by GROTHE (2003)

33
4. THE LITHOLOGY, MINERALOGY OF HOLOCENE SEDIMENT IN CENTRAL RED RIVER DELTA
The six cores sampled, are named TB1, TB2, TB3, HT, HN, and YM and are depicted in Fig. 4.1 to 4.6. The results of their investigation will be described below in this chapter, thereby focussing onto the following characteristics: lithology, colour, sedimentary structure, texture, character of facies boundaries, succession character, allochtonous, authochthonous minerals, clay minerals and their ratios, fossil components, mud content, radiocarbon dates. A description of the sedimentary facies contained in the two depositional units 1 and 2 is given in Tab. 4.1
4.1. TB1 CORE
TB1 core is located in wave-dominated system (beach ridge field) (MATHERS et al. 1998) on a low part of central RRD (altitude 1.82 ± 0.1 m; latitude 20°22’32’’; longitude 106°27’38’’) (Fig. 1.2). This core can be divided into 13 facies and three sedimentary units with the following depth range: unit 0-shallow marine deposit (late Pleistocene) (52.0-50.0 m), unit 1-estuarine deposit (50.0-33.5 m), unit 2-delta deposit (33.5-2.0 m). The characteristics of these units and facies from the bottom to the top of core are described below (Fig. 4.1.a-b-c).
4.1.1. Unit 0 - Shallow marine sediment (late Pleistocene)
Unit 0 (depth in core: 50-52 m) includes marine sediment (facies 0.1) which was exposed and weathered during LGM.
Facies 0.1 (depth in core: 52-50 m) is represented by reddish mottled medium clayey silt. It consists of massive clay rich mud clast in the lower and massive clay rich in limonite lense (<1 cm in diameter) in the upper section (Fig. 2.3.1). Clayey silt includes organic materials distribute like patches and abundant rootlets have iron encrustations in the upper part (photo 1.1). This facies is characterised by small mean grain size (Md: 9.08 µm), bad sorting (So: 2.33), symmetrical to fine skewness (Sk: 0.92). Frequency curve is leptokurtic with one peak of grain distribution (Fig. 4.7, type 14).
The main part in >0.1 mm fraction of samples are limonite (2.7-24%) (<0.5-2.0 cm) in diameter), quartz 1.5-17%, feldspar 0.5-8%, rock fragments 0.1-2% and reworked foraminifera (Fig. 4.1.b).
The samples consist of clay mineral assemblages with the highest concentration compared with the other facies in core. For example, gibbsite counts up to 54% in the total (g+k), and the ratio of (k/k+c+i) is 15%. Chlorite, illite are also in the same trend (c/(k+i+c): 16%) illite peak area is 821. Well-ordered illite is 61% of illite. The peak area of gypsum, quartz is significant (82, 444). Besides, a small amount of smectite was detected (s/(k+i+c+s: 1%) (Fig. 4.1.c).
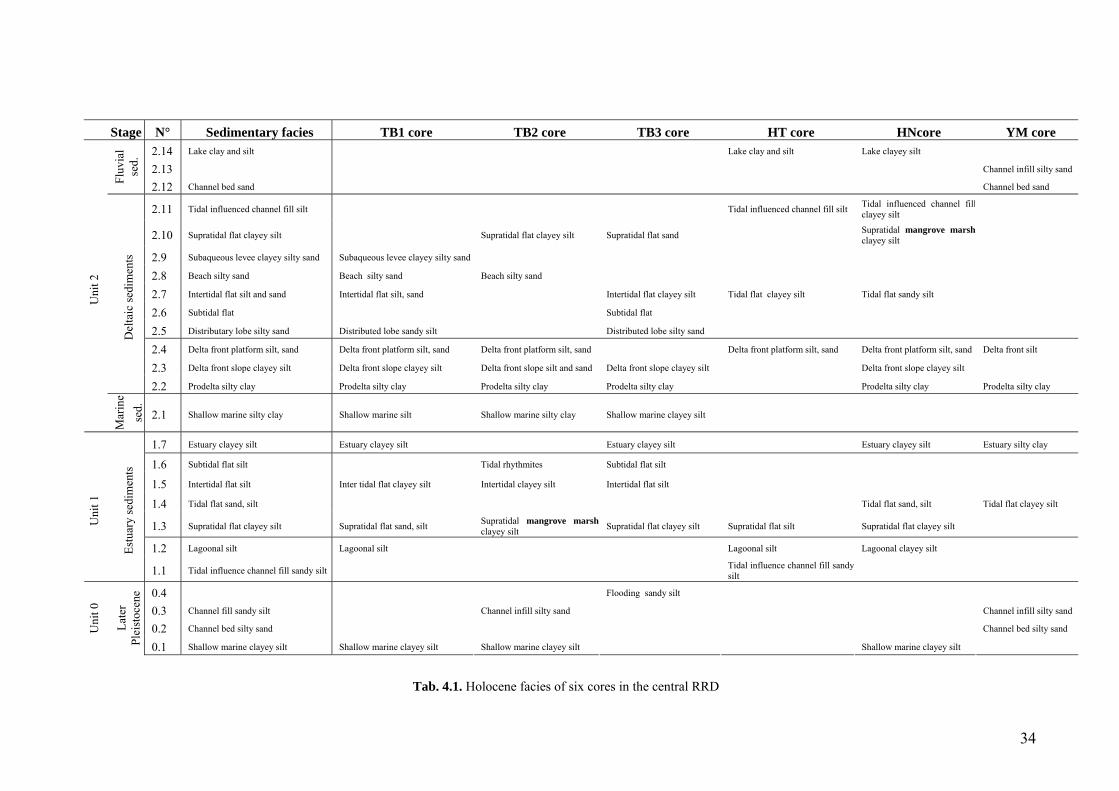
34
Stage N° Sedimentary facies TB1 core TB2 core TB3 core HT core HNcore YM core 2.14 Lake clay and silt Lake clay and silt Lake clayey silt
2.13 Channel infill silty sand
Fluv
ial
sed.
2.12 Channel bed sand Channel bed sand
2.11 Tidal influenced channel fill silt Tidal influenced channel fill silt Tidal influenced channel fillclayey silt
2.10 Supratidal flat clayey silt Supratidal flat clayey silt Supratidal flat sand Supratidal mangrove marshclayey silt
2.9 Subaqueous levee clayey silty sand Subaqueous levee clayey silty sand
2.8 Beach silty sand Beach silty sand Beach silty sand
2.7 Intertidal flat silt and sand Intertidal flat silt, sand Intertidal flat clayey silt Tidal flat clayey silt Tidal flat sandy silt
2.6 Subtidal flat Subtidal flat
2.5 Distributary lobe silty sand Distributed lobe sandy silt Distributed lobe silty sand
2.4 Delta front platform silt, sand Delta front platform silt, sand Delta front platform silt, sand Delta front platform silt, sand Delta front platform silt, sand Delta front silt
2.3 Delta front slope clayey silt Delta front slope clayey silt Delta front slope silt and sand Delta front slope clayey silt Delta front slope clayey silt
Del
taic
sedi
men
ts
2.2 Prodelta silty clay Prodelta silty clay Prodelta silty clay Prodelta silty clay Prodelta silty clay Prodelta silty clay
Uni
t 2
Mar
ine
sed.
2.1 Shallow marine silty clay Shallow marine silt Shallow marine silty clay Shallow marine clayey silt
1.7 Estuary clayey silt Estuary clayey silt Estuary clayey silt Estuary clayey silt Estuary silty clay
1.6 Subtidal flat silt Tidal rhythmites Subtidal flat silt
1.5 Intertidal flat silt Inter tidal flat clayey silt Intertidal clayey silt Intertidal flat silt
1.4 Tidal flat sand, silt Tidal flat sand, silt Tidal flat clayey silt
1.3 Supratidal flat clayey silt Supratidal flat sand, silt Supratidal mangrove marshclayey silt Supratidal flat clayey silt Supratidal flat silt Supratidal flat clayey silt
1.2 Lagoonal silt Lagoonal silt Lagoonal silt Lagoonal clayey silt
Uni
t 1
Estu
ary
sedi
men
ts
1.1 Tidal influence channel fill sandy silt Tidal influence channel fill sandysilt
0.4 Flooding sandy silt
0.3 Channel fill sandy silt Channel infill silty sand Channel infill silty sand
0.2 Channel bed silty sand Channel bed silty sand Uni
t 0
Late
r Pl
eist
ocen
e
0.1 Shallow marine clayey silt Shallow marine clayey silt Shallow marine clayey silt Shallow marine clayey silt
Tab. 4.1. Holocene facies of six cores in the central RRD

35
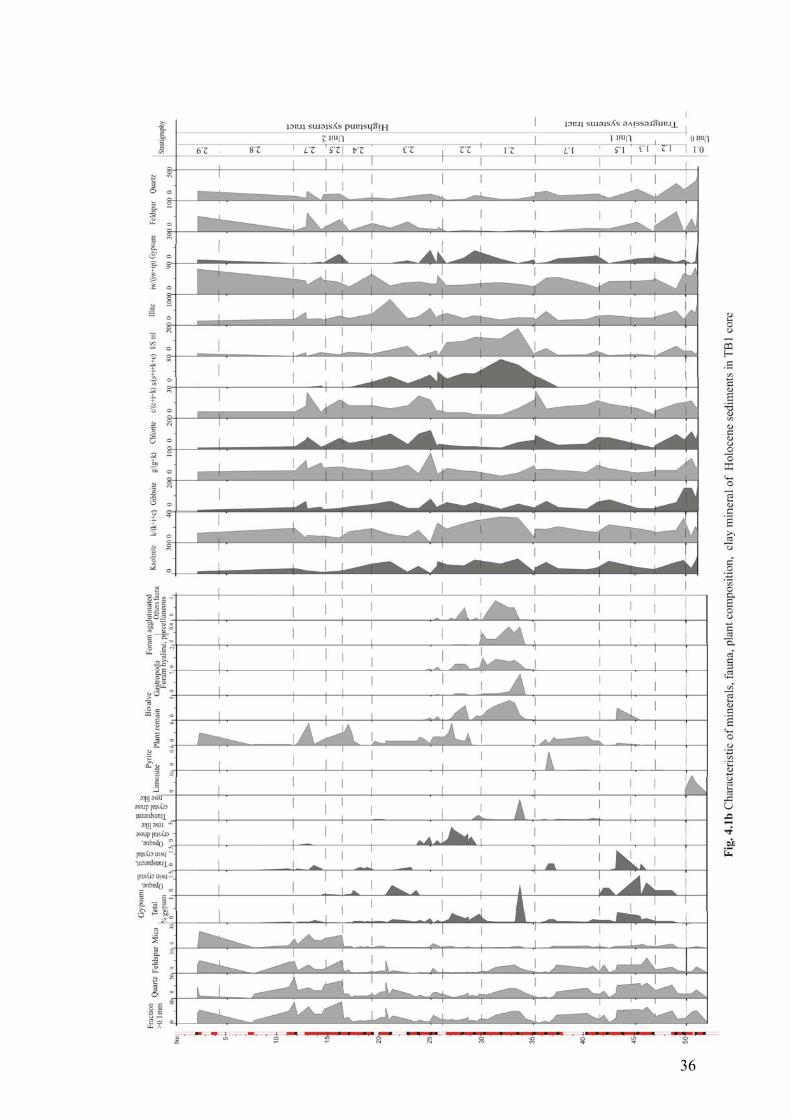
36

37
Interpretation: the occurrence of smectite in clay mineral composition and foraminifera in facies 0.1 shows that the shallow marine clayey silt was deposited during the interglacial. After that, the second primary composition of weathered products e.g. kaolinite, gibbsite, and limonite formed during LGM.
Unit 1 transfers to unit 2 by an erosional surface with weathering layer in the upper part. 14C age of most upper layer at depth 41.6 m from mollusc shell is 11,495 ± 42 cal. kyr BP. Hence, this unit belongs to late Pleistocene.
4.1.2. Unit 1 - Estuarine sediments
The unit (depth in core: 33.5-50 m) includes three facies related to a sea-level rise and relief inundation, namely lagoon (facies 1.3), tidal flat (facies 1.5b), and estuarine (facies 1.6).
Facies 1.3 (depth in core: 50.0-47.0 m) displays a fining-upward succession. The grey-coloured silt consists of discontinuous slanting parallel structures with light brownish encrustation (Fig. 4.8). The sediment is characterised by mean grain size (Md: 10.4), well sorting (So: 1.74), symmetrical skewness (Sk: 0.98), leptokurtic frequency curve (Fig. 4.7, type13).
In fraction >0.1 mm, quartz (10-25%), feldspar (3.5-7%), mica (0.5-3%) are major minerals in samples. Besides, in-situ minerals are micrograined crystals of brownish gypsum (0.2%).
Clay minerals compared with facies 0.1, show higher contents of kaolinite with the ratio k/(k+i+c) of 20%. Contracting, peak area value of illite decreases from 425 to 200, where the amounts of poor-ordered and well-ordered illite are similar (iw/(iw+ip): 47%). The amount of chlorite, similarly declines upward to 10% in ratio c/(k+i+c).
Interpretation: facies 1.3 resembles those of lagoonal silt reported by REINSON (1992). In the granulometry, the fine grain size with symmetrical skewness, leptokurtic frequency curve show quiet environment. The high amount of detrital mineral composition with kaolinite suggests that sedimentary resources are the destroyed Pleistocene weathering layer in a basin with fluvial influence.
Facies 1.5b (depth in core: 47.0-43.0 m) shows an overall fining upward succession from brown medium sand to brown-grey silt (Fig. 4.1a). Laminated sandy silt in the lower (46-47 m) and the interlaminated fine sand, mud (silt and clay) contain trough cross-bedding with bidirectional foresets in the upper part (Fig. 4.8). Mean grain size is 18.48 µm, sorting is bad (So: 2.69), symmetrical to coarsely skewed (Sk: 1.22). Frequency curve is mesokurtic with two or three peaks of distribution (Fig. 5.1, type 13).

38
Plentiful detrital composition in bulk samples (>0.1 mm) like the facies before. Authigenic minerals are gypsum and pyrite. Gypsum occurs as opaque twinned-druses and transparent rose-like crystals. Plant remains amount is 0.1-0.6%. The sediment included organic materials and shell fragments (Fig. 4.1.b).
In fraction <0.1 mm, ratios of well-ordered and poor-ordered illite are equal. The k/(k+i+c), g/(g+k), c/(c+k+i) ratios lie in 18%, 24%, 10%, respectively. Peak area of gypsum is 46.
Interpretation: Facies 1.5b can be interpreted as supratidal flat sand, silt that show an overall fining upward succession with trough cross bedding with bidirectional foresets in the upper (REINECK and SINGH 1973).. The frequency curve has two or three peaks of a grain distribution pointing to high energy environment
Radiocarbon date from a bivalve at 46.1 m is 11,495 cal. yr BP, which is probably too high. In the neighbouring NB core from a depth of 44.5 m a 14C age from wood material of 10-10.2 cal. kyr BP is reported (Tanabe S, 2005).
Facies 1.6 (depth in core: 43.0-41.5 m) contains brown-coloured fine clayey silt. Structures are massive or non-parallel bedding. Mean grain size is 11.58 µm, increase than the facies before. Sorting is still bad (So: 2.4), skewness is finely symmetric (Sk: 0.8), frequency curve has one peak (Fig. 4.1a).
Percentage of coarse grains (>0.1 mm) decreases upwards as well as quartz (15-2%), feldspar: (9-0.6%), mica and rock fragments (2-0%). Gypsum transparent twinned-crystal is 0.1% only in the bottom, gypsum transparent rose-like-druse in 0.4% from 41 m to top of facies. Plant remains were found more frequently than in the lower facies. Bivalve Macoma sp. dominated in the bottom of succession (from 0.1% to 2.5%). Some of the bivalves are fragments.
Similar to the lower facies, in fraction <0.1 mm the main clay composition is detrital. However, content of illite decreases upwards. High amounts of chlorite were identified (15%). Ratios of g/(g+k), c/(k+i+c) increase from 24 to 38%, from 10 to 15%, respectively, while the ratio k/(k+i+c) do not change.
Interpretation: facies 1.6 is interpreted as intertidal flat clayey silt. The concentration of shells may suggest a primary biogenetic concentration (KIDWELL 1993) in a tidal environment. Amount of chlorite becomes higher suggesting the rising water level (CHAMLEY 1989; MOON et al. 2000). The crystals of gypsum matured better than in the underlain deposits pointing to high saline and dry seasonal environment of 1.3 facies.
The transition of this facies to the next one is continuous.
Facies 1.7 (depth in core: 41.5-36.3 m) present fine clayey silt consists of brownish

39
massive clay with parallel discontinuous structure (Fig. 4.1a). The sediments are fine fraction with Md of 9.85 µm, bad sorted with So value of 2.23, symmetrical skewed (Sk: 0.95) and a leptokurtic distributional frequency curve.
Grain size becomes finer upwards, percentage of sand grains (>0.1 mm) decreases from 36.2% to 4.2%, quartz and mica-rock is reduced from 26% to 0.2% and 10% to 0.5%, respectively. Transparent twinned-druses of gypsum attain from 0.1% to 0.4% in the top. Gypsum is none coloured, slight sharpened and rose-like shaped (Fig. 4.9, right side). Plant remains still occur to 0.5-2.1% (Fig. 4.1.b). Fauna is absent. Calcareous concretions were identified (<1 cm in diameter).
Mineral composition of the fraction <0.1 mm shows that the facies is still dominated by detrital minerals. However, quartz, chlorite, feldspar, illite, kaolinite, halloysite as well as gibbsite tend to decrease upwards. Instead, the s/(s+k+i+c) ratio rises from 0 to 27% (Fig. 4.1.c).
Interpretation: Facies 1.7 is interpreted as estuarine clayey silt. Fining upward is characteristic and a decrease in the amounts of quartz, chlorite, feldspar, illite and gibbsite as well. That points to sea level highstand. Also smectite maximum by segregation processes represents sedimentation far from river source (CHAMLEY 1989).
Unit 1 unconformably passes into unit 2, which is coarser fraction (Fig. 4.1)
4.1.3. Unit 2 - shallow marine, deltaic and fluvial sediments
Facies 2.1 (depth in core 36.3-30.5 m) shows the overall coarsing-upward succession from fine silt to medium silt. Reddish brown-coloured massive clay is rich in biotubation, spotted burrows, and shell fragments. Bioturbation structures with lenses of jointed shells dominates. Minimum value of mean grain size is 8.49 µm but an unexpected value is 16 µm in 33.5 m, sorting is good (So: 1.99), skewness is symmetrical and leptokurtic (Sk: 1.01).
The fraction >0.1 mm amounts to 13.8-41.0%, consisting quartz: 7-20%, mica: 0.5-2%, feldspar: 1-3% in bulk sample. In-situ mineral includes gypsum. Nevertheless, gypsum is concentrated in the bottom from 33.5 m to 30.5 mm (0.1-4.2%) with highest percentage of transparent sand-rose-crystals, whereas in the top of the facies highest percentage of gypsum opaque sand-rose-crystal (0.5-0.9%) was observed. Especially, there is non-colored needle-pointed glass in this part. Complete bivalves Loripes, Cardium together with gastropoda Turritella? sp., Nellanoides? sp. are common 0.3-4%, and 0.1-3.5%, respectively. There are abundant hyaline, porcellaneous, agglutinated foraminifera, most of them are Quinqueloculina sp., Pseudorotalia papuanensis, Textularia sp (TATEISHI et al. 2001) (PETER FRENZEL, NHUNG N., personal communication). Other fauna are dinoflagellates, echinoids, sponges, echinozoans (0.5-1%). Foraminiferas reduce to 0.3%

40
and disappear in the next part. There are no plant remains in the sediment.
In the facies suddenly high values of smectite, I/S ml occur. This is accompanied with very high contents of kaolinite, but small contents of illite, and chlorite in the samples. The s/(s+k+i+c) ratio ranges from 35 to 72% with highest value (70%) in 32 m, the k/(k+i+c) ratio ranges from 25 to 30%, and the g/(g+k) ratio lies between 28 and 32%. Peak area of gypsum increases upwards (120).
ASM 14C date from shell material at depth 30.5 m is 3,896±59 cal. yr BP.
Interpretation: Facies 2.1 is interpreted as shallow marine silt. Sea-floor sediments pass into prodelta sediments indicating delta progradation. The massive clay, one peak frequency curve, high amount of foraminifera of this facies is comparable to prodelta sediments described by SCRUTON (1960) and COLEMAN (1981) or bay sediments identified by REINECK (1980). The shell layer may indicate a sediment-starved period in a sea-floor environment (KIDWELL 1993). Furthermore, the high amount of smectite, minor of chlorite, disappearance of detrital mineral prove that facies deposits accumulated during the high stand of sea-level (CHAMLEY 1989). Clay mineral assemblage and ratios and sea fauna complex indicates not only deposition in a marine environment but point also to the fact that sediment discharge into the basin was limited in this period.
Facies 2.2. (depth in core 30.5-26.3 m) consists of brown, greyish brown silt and clay similar like in facies 2.1. The differences are rhythmic laminated structures, an increase of gypsum, decrease and disappearance of fauna, smectite, I/S ml, and emerging plant remains. Rhythmic laminated silty clay layers and thin carbonate clay layers (?) are characteristic for prodelta deposits (Fig. 4.7) (REINECK and SINGH 1973). Almost all gypsum crystals are sand-rose-crystals (1%).
Interpretation: The composition of the facies shows a stronger sediment discharge from land and the river “comes closer” to our core site again. Therefore, this facies is interpreted as prodelta silty clay.
AMS-14C date shows 3,896±59 cal. yr BP of shell fragments. Perhaps, it may be a reworked shell, because in the neighbouring NB core in a similar depth a 14C date amounts to only 2,349 yr. BP (TANABE et al. 2006).
Facies 2.3 (depth in core: 26.3-19.1 m) displays fine clayey silt with different convolutions. Brown-coloured sediment includes calcareous concretions. The structure is sublaminated, convolve, sliding (Fig. 4.8). Sediment is coarsening upward with mean grain size 9.59 µm, median sorting (2.04), symmetrical to fine skewness (Sk: 0.93). Frequency curve is leptokurtic with one distribution peak (Fig. 5.1, type 6).
The percentage of coarse grains (>1 mm) rises from 6 to 20% like in facies 3.1.

41
Especially sand content is 49% with increasing percentage of quartz and feldspar, in 21 m. In-situ minerals are predominantly gypsum as transparent and opaque twinned-crystals, sandy rose crystal type. Rare shell fragments with the sign of rework are present (Fig. 4.1.b).
In the fraction <0.1 mm, a decrease of k/(k+i+c), and s/(s+k+i+c) ratios is clear while illite tend to increasing amounts. Although iw/(iw+ip) ratio fluctuates, poor-ordered illite still dominates in the facies. Chlorite is best developed in this core and the ratio of c/(k+i+c) attains highest amounts (17.9%). Quartz and feldspar increase. In <2 µm fraction gypsum is still abundant in the bottom and then it disappears in the top of the succession (Fig. 4.1c).
Interpretation: facies 2.3 is interpreted as delta front slope clayey silt deposition. The trends of detrital mineral, chlorite increasing opposite with smectite, kaolinite, gibbsite decreasing, could reflect the seaward progradation of the delta with fresh water influence. The composition of facies indicates rich sediment sources and discharge to the basin and a higher sedimentation rate.
Facies 2.4. (depth in core: 19.1-16.6 m) consists of brown silt, interlaminated sand, silt containing organic material layer in the upper and laminated silt with sandy lenses in the lower part. Coarsening upward sediments with 10.9 µm mean grain size, well sorted (So: 2.07) and fine skewness (Sk: 0.87). Frequency curve show one leptokurtic distribution (Fig. 4.7, type 5).
Like the facies before, the bulk sediment (fraction >0.1 mm) is poor in quartz (3-9%), mica, feldspar (0.5-2%). Plant remain percentage climb to 2.0% in the top of facies. Sediment includes brown grain type in the lower part, and then, transferred to twinned-crystal druse of gypsum (0.1-0.05%) in the top.
Clay mineral composition is characterised by the short decreasing of illite, chlorite, gibbsite and kaolinite. Furthermore, contents of I/S ml, smectite strong decrease and disappear.
Interpretation: Facies 2.4 is interpreted as delta front platform silt, sand. Coarsening upward sediment with interlaminated sand, silt structure show the stronger influence of continent deposits.
Facies 2.5 (depth in core 16.6- 14.6 m) consists of grey brown-coloured sandy silt with laminated bedding (Fig. 3.1a). The structure reveals laminated bedding (Fig. 4.8). Grain size suddenly increases up to 38.4 µm but the sorting and skewness are stable (So: 1.98; Sk: 0.75) (Fig 4.7, type 3).
The facies is concentrated in high percent of sand fraction: 45-57% with quartz (25-34%),

42
feldspar (5-15%), mica (11-15%). Gypsum is absent. Plant remains show the highest concentration in TB1 core (1.5-5%). (Fig. 4.1b)
In fraction <0.1 mm, amounts of quartz and feldspar increase remarkably, but illite is stable. The ratios, iw/(iw+ip) decrease from 41 to 35%, k/(k+i+c) drops to the minimum amount (6%), g/(g+k) is 40%, c/(k+i+c) ratio is 12%. Smectite was not detected (Fig. 4.1c).
Interpretation: The increasing grain size up to 53 µm connected with well sorting suggests energy in the mouth of lobe. The facies concentrated in high percent of quartz and feldspar, in trend of landing forward. Thus, facies is interpreted as distributary lobe sandy silt.
Facies 2.7 (depth in core: 14.6-10.0 m) shows thinly laminated dark red and dark sand/mud bedding with abundant plant. Particularly, fine sand intercalated with mica-organic layer in 0.5 cm thick in the top of facies (Fig. 4.8). Sandy silt is characterised by mean grain size at 21.75 µm, bad sorting (So: 2.35), coarsely skewed (Sk: 1.11) and frequency curve with two distributions (Fig 4.7, type 4).
In bulk sample, fraction >0.1 mm (30-68%), there is high amount of quartz (15-42%), feldspar (4-14%), rock grain and mica (muscovite and biotite) (9-11%). Amount of gypsum in micrograin type is stable (0.0-0.1%). Plant remains are reduced from 5.3 to 0.3%.
Clay minerals consist of a low amount of kaolinite, gibbsite, I/S ml, illite. High percentage of illite appears as well-ordered illite.
ASM 14C date from wood material at depth 13 m is 5,631 ± 56 cal. yr BP. Corelation with 14C date in the lower facies and other core from TANABE (2006), the material maybe the reworked.
Interpretation: The laminated sand shows the strong influence of tides so that this facies is considered intertidal flat silt and sand.
Facies 2.8 (depth in core: 4.0-10.0 m) shows brown-coloured fine silty sand with grey fine sand lense. The highest mean grain size from the whole core was observed (Md: 128.9 µm). Sediments are well sorted (So: 1.79), coarsely skewed (Sk: 1.39) and frequency curve shows two distributions.
Facies 3.6 has high volume of quartz (50%), feldspar (20%), the highest percentage of mica and rock fragments (30%). Amount of gypsum (transparent and opaque twinned-crystal) is 0.5%. Plant remain attains 5-7%. Unfortunately, most of the sand in the lower section was lost during drilling.
43
Interpretation: because of the well sorting of sand due to wave energy, facies 3.7 is interpreted as beach silty sand.
Facies 2.9 (depth in core: 2-4.0 m) consist of coarse clayey silty sand, dark grey-coloured. Ripple cross bedding or cross bedding structure are not clear (Fig. 4.8). The transition from the lower layer is gradual. Mean grain size is 63.79 µm. The skewness is like in the lower facies. Two peaks of frequency curve are leptokurtic and have same high (Fig. 5.1). A difference to other sediments below is the very bad sorting (So: 4.15) (Fig. 4.7, type 3).
Fraction >0.1 mm consists of high amount of quartz, feldspar, mica. In clay mineral assemblage, the k/(k+i+c) ratio is 12%, the g/(g+k) ratio lies between 30-40%, c/(k+i+c) ratio is 7%. Amount of illite is poor (peak area: 143) but commonly illite is well-ordered (iw/(iw+ip): 74%) (Fig. 4.1.c).
Interpretation: The deposits are made up by very bad sorted sediments with two peaks of grain size distribution showing ripple cross bedding or cross bedding structures. That why this facies is interpreted as subaqueous levee clayey silty sand.
In short, 52 m of TB1 core can be divided into three units. Deposition time of unit 0 was before 11 kyr BP, units 1 and 2 were built from 11.5 kyr BP until today. By comparing the basic sediment types and AMS 14C data from NB core (TANABE, 2005), unit 2 is composed from two subunits. subunit 1 (depth in core 36.3- 14.6 m), deposited from 4 to 1.5 kyr BP, is characterised by a dominance of clay, silt of prodelta, delta front slope, delta front platform facies. Subunit 2 (depth in core 14.6- 2 m), from 1.5 kyr BP- present, displays as silty sand, fine sand and medium sand of distributary lobe, intertidal flat, tidal flat and beach facies. TB1 core is one of the most important cores to built stratigaphical relation in RRD in this study.
4.2. TB2 CORE
TB2 core is in the wave-dominated system (MATHERS and ZALASIEWICZ 1999). It is located in the middle part of the central RRD, far from SE of Hanoi 167 km (altitude 1.82 ± 0.1; latitude 20°19’08’’; longitude 106°33’48’’) (Fig. 1.1). The core description is based on the data of GROTHE (2003) and GROTHE et al. (2005) additionally new information about composition of >0.1 mm fractions and recalculated clay mineral composition. Such as from data of kaolinite, gibbsite, chlorite, illite, smectite, new ratio system was established like k/(k+i+c), c/(k+i+c), s/(s+k+i+c). Due to new data, the structure is reorganised, especially created a new unit in the middle part of core. The information about colour, structure, grain size was presented in short term to easier compare with other boreholes. This core, with depth 70 m and recovery of 82%, can be divided into 10 sedimentary facies and they are grouped in four sedimentary units: unit 0- shallow marine (late Pleistocene) (69.5-63.8 m in depth); unit 1-estuarine (63.8-40 m in depth); unit 2-shallow marine, deltaic sediments (40-0 m) (Fig. 4.2a-b-c)

444.2.1.

45

46
Unit 0 - shallow marine clay (late Pleistocene)
Unit 0 (depth in core: 69.5-63.8 m) consists of blue clayey silt (Facies 0.1) and brown clayey silt to grey silty sand (Facies 0.2) in ascending order.
Facies 0.1 (depth in core: 69.5-70 m) is represented by greenish blue clayey silt. Samples have small mean grain size (Md: 8.47 µm) and well sorting (So: 1.84).
Clay minerals mostly consist high amount of kaolinite, gibbsite and halloysite. In that, the ratio of k/(k+i+c), g/(g+k) is 60%, 20%, respectively, but c/(k+i+c) ratio is only 10%. Facies 0.1 also has high amount of illite, in which iw/(iw+ip) ratio is approximately 80%.
Interpretation: facies 0.1 represents the late Pleistocene weathering surface. The bluish clay was sedimented during Flandirian transgression as marine clay. After that, they were weathered during LGM and enriched kaolinite and gibbsite. This facies was interpreted as shallow marine clayey silt.
Facies 0.3 (depth in core: 69.50-63.8 m) shows a coarsening upward from brown clayey silt to grey silty sand in the upper section. It shows the rapidly increasing in the mean grain size from 12.28 µm to 74.49 µm, and the sorting becomes bad level with range of 2.22 to 2.67. Sediments also are abundant in plant rests, mud clasts, and mollusca, especially in the sand. But much of the sandy sediments were lost during the drilling.
Clay minerals consist of 14% smectite in ratio of s/(s+k+i+c). The k/(k+i+c), c/(k+i+c) ratio is 12%, 10%, respectively. Amount of illite and its component are similar to facies 0.1. Gibbsite has high amount (g/(g+k): 30%).
Interpretation: facies 0.2 represents late Pleistocene channel infill silty sand. In that, high value of grain size, the lower k/(k+i+c) ratio are the characteristic of facies. The appearing of smectite may be from soil which deposited before were reworked. Preserved plant remains and shell fragments are instructional composition.
The boundary between unit 0 and unit 1 is unconformable boundary represented the late Pleistocene weathering surface during LGM.
4.2.2. Unit 1 - estuarine sediments
Unit 1 (depth in core: 63.8-40.55 m) is interpreted as estuarine sediments with marsh sediments shifting to estuary front and shallow marine sediments what display a fining-upward succession (REINECK 1972; TANABE et al. 2006). It consists of red and bluish-red clayey silt with peat layers (Facies 1.2); strongly bioturbated reddish brown clayey silt and fine sand with scattered mollusca, organic material (Facies 1.5a); and rhythmically inter-bedded red clayey silt, silt and fine sand, lenticular bedding, burrows and mollusca

47
(Facies 1.6).
Facies 1.3 (depth in core: 63.8-59.3 m) consists of red and bluish red clayey silt and silty clay with lenses and peat layers. In the lower portion a root was found, in the upper portion is characterized by peat layer. All over the facies, bioturbation is abundant (Fig. 4.2a). The mean grain size is the smallest in the core (4.54 µm only), and the sorting is well level (So: 1.97).
The impress of bulk sample is the concentration of wood and plant remains (100% in 61-59.5 m depth).
Smectite is disappeared in the clay mineral component. Compared with facies 0.2, the fine grain <2 µm of samples show a rising of c/(k+i+c) ratio up to 27%, but ratios of kaolinite (k/(k+i+c): 12%), illite and its constituent remained unchanged. Gibbsite as well as quartz and feldspar show decreasing amounts upwards (g/(g+k): 50%-30%).
ASM 14C date from peat material at depth 62 m is 12,031 ± 111 cal. yr BP.
Interpretation: facies 1.2 is interpreted as supratidal mangrove marsh clayey silt that is the initial succession of Holocene sediment in the RRD (NGHI et al. 2002; SAITO et al. 2004; LAM 2005; HANEBUTH et al. 2006)
Facies 1.4 (depth in core: 59.3-54.05 m) shows coarsening upward of brown clayey silty sediments. Primary sediment structures of laminated clayey silts and cross bedded fine sand were destroyed by strong bioturbation activity mainly. The mean grain size and the sorting are 10.04 µm and 1.97, respectively.
Detrital mineral is major in fraction <0.1 mm (2.5-26.8%) that includes quartz (4-17%), feldspar (1-2%), mica (1.5-6.4%). In authigenis, gypsum is developed with an amount: 0.1-0.4% and rarely pyrite. Some mollusca shell: 0-0.2% and plant remain: 0-1.5% are presented (Fig. 4.2 b).
In the clay mineral compound, the k/(k+i+c) ratio is the lowest (10-23%), g/(g+k) ratio raises up to 30%, c/(c+k+i) ratio vary between 1% to 29%. Quartz and feldspar continue to increase (Fig. 4.2 c).
Interpretation: The structures of laminated clayey silts and cross bedded fine sand, mollusca and developed gypsum show that the facies 1.5a is interpretated as tidal flat clayey silty.
Facies 1.6 (depth in core: 54.5 - 40.55 m) pass gradually from facies 1.2. It is characterized by a fining upward. The red clayey silt is rhythmical interbedded with thin layers (<1 mm) from silt and fine sand, silt and fine sand lenses also occur. Bioturbation is abundant, bivalves were found (up to 5%), and organic matter also. The sediment

48
becomes finer with grain size medium is 7.84 µm and normal sorting (2.03).
Bulk sample>0.1 mm: 1.8-13%, average: 4% includes quartz (0.5-4%), poor number of feldspar and mica: 0-0.3%, developed continuous amount of gypsum grain (0.1-1.2%), few pyrite (0.1%) and plant remains: 0-0.2%. In 45 m some foraminifera appear.
The k/(k+i+c) ratio is stable at 20%, g/(g+k) ratio ranges from 30% to 60%, c/(k+c+i) ratio is reduced to 10% whereas the amount of smectite is neglible. Illite decreases with peak value of 130, in that high percent of illite well-ordered The mineral assemblage is dominated by detrital particals.
Interpretation: facies 1.6 is interpretated as tidal rhythmites silt according to Reineck (1980) what belonged to the intertidal environment.
4.2.3. Unit 2 - shallow marine, deltaic sediments
This unit consists of greenish grey clayey silt and ravinement covers the red clayey silt (facies 2.1), greenish grey silty clay with abundant mollusca, foraminifera and high degree of bioturbation (Facies 2.2), reddish brown clayey silt nonrythmical interbedded with silt and fine sand layers (Facies 2.3), greenish grey laminated fine sand (Facies 2.4), greenish grey ripple cross bedded silty sand (Facies 2.8), and greenish brown mottled clayey silt (Facies 2.9). The lithology coarsens upward from facies 2.2 to facies 2.4, and fines upward again to facies 2.9 corresponds to a soil development in modern alluvial.
Facies 2.1 (depth in core: 40.55-35.85 m) consists of greenish grey clayey silt and ravinement covers the red clayey silt. Mean grain size reduces (Md: 6.88) and sorting is normal (2.15). Especially in the lower portion calcerous concretions appear, the sediments are bioturbated heavily, large burrows filled with scattered mollusca, silt and fine sand are abundant. The upper part consists of massive clayey silt and silty clay with less mollusca.
In fraction >0.1 mm: 4.2-28% of sample there are quartz: 1-16%, feldspar and mica: 0-2%, rock grain: 0.5-2.5%. Gypsum includes transparent rose-like-crystal at depth 40.2- 38.4 m,pyrite-a little amount. Small shell of a mollusca (pectinoidea (pectinacea) propeamussiidae? sp.) contents 0.2-8.3%, foraminifera (Pseudorotalia schroenteriana, Textularia sp., Quinqueloculina sp.) (PETER F., NHUNG N., personal communication) contents 0.1-0.7% (the most rich fauna in this core), no plant remain (Fig. 4.10a,b)
The clay mineral composition is characterized by high amounts of smectite and kaolinite, and low amounts of illite and chlorite. The s/(s+k+i+c) ratio ranges between 20 and 36%, the high ratio of k/(k+i+c) ranges between 30 and 60%, and the g/(g+k) ratio lies at 30%. Amount of illite is lowest in core with peak area is 100 included 50% illite poor-order. The c/(c+i+k) ratio is smallest than the are position (8%). Detrital particles in the <2μm fraction range between 63 and 66%.
49
Interpretation: facies 2.1 is interpretated as shallow marine clayey silt passing over into prodelta sediments. Burrows in the silty clay and clayey silt filled with mollusca (pectinoidea (pectinacea) propeamussiidae? sp.), foraminifera (Pseudorotalia schroenteriana, Textularia sp., Quinqueloculina sp.), silt, and fine sand are comparable with inner shelf sediments (COLEMAN 1981). The silt to fine sand bearing calcerous concretions are expected to be washed in from the close shore line.
Facies 2.2 (depth in core: 35.85-29.2 m) displays a coarsening upward from reddish brown massive clayey silt to laminated clayey silt and silt. The mean grain size and sorting of sediments are 9.36 µm and 2.26, respectively.
The fraction >0.1 mm: 5.2-17.5% of sediment included quartz: 3-14%, mica, rock: 0.2-2% grain and feldspar: 0.5-1%. Molusca and foraminifera become rare (0.1%) and disappear at 20 m. Contrary, plant remains content increase from 0.2 to 2%.
Clay mineral compostion is characterized by a decreased ratio of g/(g+k) from 30% to 0%, ratio of k/(k+i+c) from 48% to 7%, and smectite still with high content, s/(s+k+i+c) ratio from 36% to 1% while illite and chlorite display increasing amounts. Illite is dominated by illite well-ordered (80%). The ratio of c/(k+i+c) raise from 12% to 17%.
Interpretation: Facies 2.2 can be interpretated according to TANABE (2003b) as prodelta silty clay.
Facies 2.3 (depth in core: 29.2 -19.5 m) displays as greyey brown clayey silt, fine sand (at depth 28.3-28.4 m). The structure includes laminates, cross bedding. Sediments are rich in organic material and largely destroyed by bioturbation.
In fraction >0.1 mm: 6-50%, usually 6-9% of sample an amount of quartz: 4-40%, mica, rock: 1-10% grain and feldspar: 0.1-3%. That means their amount is higher than in facies 3.1. Gypsum includes types of opaque sandy-rose-crystal and twinned-crystal with 0.1-09% percent and reducing upward. The plant remains attain 0.2-2.1% and a grade of mollusca, foraminifera is a little.
Clay mineral compound is characterized by the decrease of smectite, I/S ml and gibbsite but rising amount of illite.
Interpretation: facies consists of the massive clay indicates dominant deposition from suspension. The nonrhythmical sand and organic matter discharges may have been caused by hyperpycnal flows related to river floods and storms (MUTTI et al. 2002). According to COLEMAN (1981), prodelta sediments can be divided by seasonal repeated structures due to river floods. Then this facies is inperpreted as delta front slope silt and sand.
Facies 2.4 (depth in core: 19.5-10.5 m) is consisting of greenish grey laminated fine sand containing peaty laminations and abundant organic material. In the upper portion,

50
greenish grey silty sand is showing ripple cross bedding and convolute bedding. The mean grain size is high with value of 31.17 µm, the sorting becomes bad (So: 2.53).
The fraction > 0.1 mm (44% in the bottom 5.6% in the top of this facies) is dominated by quartz (1.3-40%), plant remains (5%), rock grains, mica 0.5-2% and feldspar (0.4-2%). Gypsum is absent in this interval of core.
The clay mineral composition is dominated by illite poor-ordered and chlorite. The k/(k+i+c) ratio is 7%, c/(k+i+c) ratio is 14-21%, and the g/(g+k) ratio increases upwards and attains the highest in 50%.
Most of the sand in the lower portion was lost during drilling.
Interpretation: facies 2.4 is interpreted as delta front platform silt and sand with the rhythmically laminated sand and silt of shows characteristics of tidal sediments. The cross bedded sand with convolute bedding shows typical structures of a subaquaeous levee (REINECK 1980). The coarsest portion of the deltaic succession is correlated with the boundary zone of delta front platform and delta front slope in the Song Hong delta (HORI et al. 2002).
Facies 2.8 (depth in core: 10.5- 4.5 m) includes brown silt and sand with ripple bedding or cross bedding by wave-influence structure (at depth 4.45 m). The fraction >0.1 mm counts up to 21% weight of sample that composes 18% of quartz, 1% of feldspar, 0.1% biotite and muscovite, 0.1% of gypsum and 0.1% of plant remain. In grain size <0.1 mm, there are large amounts of gibbsite.
Interpretation: The facies can be interpreted as beach sandy silt like facies 2.8 of TB1 core.
Facies 2.10 (depth in core: 4.50-4.25 m) is characterized by a high degree of bioturbation. The mottled brown, greenish brown clayey silt inhibits much organic material. The sediment is fining upward with mean grain size is 9 µm and normal sorting (So: 2.05). Its components are mainly detrital mineral such as quartz (8%), mica (1%) and plant remains. Clay minerals are rich of kaolinite (k/(k+i+c): 12%), chlorite (c/(c+k+i): 17%), the ratio of g/(g+k) is 40%.
Interpretation: facies 2.9 is interpreted as a modern supratidal flat clayey silt development with the bioturbated silty clay.
Summary: due to good recovery (82%) of the core, Holocene succession in TB2 core can be divided into 10 sedimentary facies. In that the two facies 0.1 and 0.2 are related to late Pleistocene, three next facies (1.3, 1.5, 1.6) belong to estuarine sediments of transgression stage, and the four last facies (2.1, 2.2, 2.3, 2.4, 2.8, 2.10) are deltaic sediments of regressive stage. This core well reflex the development of delta. This precious
51
information will be usefully to interpret the evolution of sediment during Holocene.
4.3. TB3 CORE
The TB3 core is situated in the central study area, in the south of recent river and SE of Hanoi, 105 km away. It is also located in wave-dominated system (MATHERS et al. 1996) (altitude 3.6 ± 0.1; lat. 20°31’58’’; long 106°15’59’’) (Fig. 1.2). This core, with length of 46 m and recovery of 85%, can be divided into three sedimentary units like TB1 and TB2. Detailed description of these units and their facies from bottom to top is described below (Fig. 4.3.a-b-c).
4.3.1. Unit 0 – fluvial (later Pleistocene)
Facies 0.4 (depth in core 44.0-46.0 m) displays a yellowish brown mottled medium clayey silt, rich limonite lense massive clay (<1 cm in diameter). In the upper organic materials become abundant. Sediment is characterised by fine grain size (Md: 6.87 µm), medium to bad sorting (So: 2.10), symmetrical to fine skewness (Sk: 0.93).
The fraction <2 µm composes illite, kaolinite, gibbsite and the ratio k/(k+i+c), g/(g+k), c/(c+i+k) is 17%, 35%, 17%, respectively. It shows poor amount of illite (peak area: 92), most of them are illite well-ordered (70%).
Interpretation: based on structure and mineral composition this facies is interpreted as flooding sandy silt, which was weathered during the LGM.
With lateritic weathering surface the facies is unconformably passing upward into the next.
4.3.2. Unit 1 - estuary sediment
The unit consists of three facies: tidal flat silt, intertidal flat silt and lagoon-estuary silt.
Facies 1.3 (depth in core 40.3-44 m) displays grey-coloured medium clayey silt. Depending on visible description, it can be divided into two parts. In 42.5-44 m, grey fine silt presents ripple bedding structure and thick bivalves layer (<25 cm). Shelly thick layers consist of jointed bivalves also found along with rich organic material layers (<0.5 cm), root, and plant remain lense. In 40.3- 42.5 m, the structure is lenticular, cross bedding (25° bidirection). This part shows abundant organic material and plant remains (Fig. 4.3a). In total of facies, sediment is characterised by fine grain size (Md: 7.08), medium to bad sorting (So: 2.10), symmetrical to fine skewness (Sk: 0.94).
Most of >0.1 mm fraction (3-5% weight of sample) are detrital minerals likes quartz: 2.5-
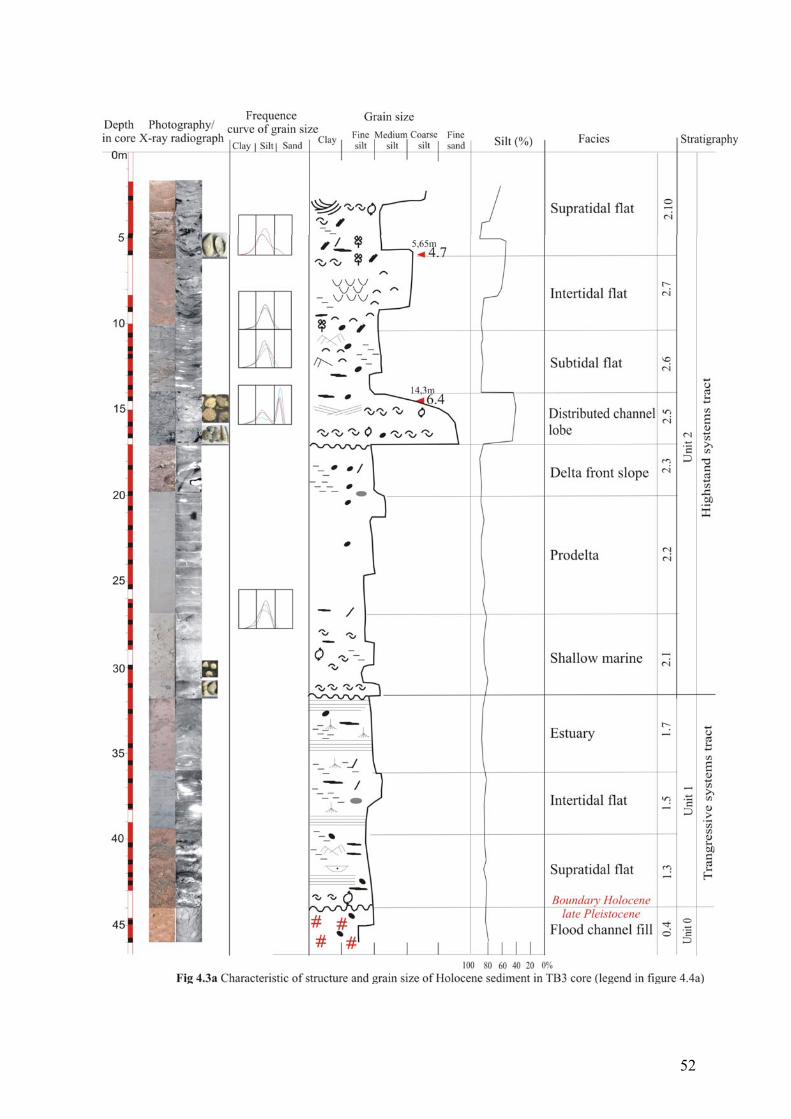
52

53

54
3%, mica: 0.5, and feldspar: 0.2-1 % and plant remains (0.2%), bivalves 0-0.5% (Fig. 4.3b).
Within <0.1 mm fraction, clay minerals are represented by illite, kaolinite, chlorite. The k/(k+i+c) ratio changes from 5% to 20%. The g/(g+k), c/(c+k+i) ratio are from 65% to 44%, is 18% to 10%, in ascending order. Peak area of illite, I/S ml is from 90 to 160 and 10, respectively, mostly illite poor-ordered. Non-claymineral includes gypsum with peak area value at 18.
ASM 14C age from shell material at depth 42.5 m is >49,000 cal. yr BP. It is may be reworked shell.
Interpretation: this facies is interpreted as supratidal flat clayey silt because of the ripple
and cross bedding, which is characteristic of those environments (REINECK and SINGH
1973). Sand is transported and deposited by currents whereas mud in suspension settles
onto the sand during slack-water periods (REINECK and WUNDERLICH 1968). Gypsum is
formed on low part of tidal flat. Shelly layers indicate a brackish-water environment.
Facies 1.6 (depth in core 36.6-39.6 m) displays an overall fining upward succesion from
silt to medium clayey silt with brown-grey coloured. The sediments are characterised by
massive silt, thinly interlayer laminated sand/mud bedding, flaser bedding, lenticular
bedding, organic material, mud clast (<1 cm), strong biotubation, scattered shells. Silt and
fine sand lenses regularly appear. Rootlets are abundant (Fig. 4.3a). Scattered pyrite
lenses and worm tubes are represented. Granulometry is characterised by fine grain size
(Md: 7.20 µm), well sorting (So: 1.93), symmetrical to fine skewness (Sk: 0.95).
Detrital minerals are main component in the fraction >0.1 mm (2-13% of sample) (Fig.
4.3b).
Within <2 µm fraction, clay minerals are represented by illite, kaolinite, chlorite like
facies 1.1. The differences are decreasing of g/(g+k) ratio from 40 to 30% and high illite
well-ordered content (70%). Non clay mineral includes high value of quartz and feldspar
(70, 10) and small amount of gypsum only in 37 m (11) (Fig. 4.3c).
Interpretation: this facies is interpreted as subtidal flat silt.
Facies 1.7 (depth in core 31.5-39.6 m) consists of fining upward laminated thin grey
brown sandy silt and organic layer, sandy lenses to greyish coloured medium clayey silt
(Fig. 4.3a). Sediment is characterised by fine mean grain size (Md: 6.56 µm), well sorting

55
(So: 1.84), symmetrical to fine skewness (Sk: 0.93).
The amount of the fraction >0.1 mm is from 2 to 13% weight of sample. Detrital minerals reduced to the smallest amount in the end of facies. Quartz is the lowest percentage 2-8%, mica, feldspar, plant remains are 0.5-1.5%, 0.5-2%, 0.5-1%, respectively. Fauna begins to appear with the low amount of bivalve, gastropda, and foraminifera in the upper of facies (Fig. 4.3b).
Clay mineral compound includes illite, kaolinite, chlorite with the k/(k+c+i) ratio is 15%, ratio g/(g+k) is 16% because small amount of gibbsite (7). Ratio of c/(c+k+i) is 10%. In the upper part of the facies, smectite appear with s/(s+k+i) ratio is 10%. Both quartz and feldspar show reduced contents compared with the facies before (Fig. 4.3c).
Interpretation: the facies is interpreted as estuarine silt. The sediment structure is represented by subparallel structure, grey silt laminated thin layers of brown fine sand. In the upper part, the presence of marine fauna complex and smectite show the expected transition from estuarine to shallow marine.
4.3.3. Unit 2 - shallow marine, deltaic sediments
Unit 2 consists of 10 facies as follow.
Facies 2.1 (depth in core 31.5-27 m) contains grey-coloured medium clayey silt, bioturbation structure plenty of spotted burrows with shell fragments and sand. Abundant foraminifers are scattered in clay at depth 31 m. The amount of shell reduces upward the core (Fig. 4.3a). Texture is characterised by very fine grain size (Md: 6.60 µm), medium sorting (So: 2.08), symmetrical skewness (Sk: 0.99).
The fraction of >0.1 mm (1- 30% wg. of sample) is enriched in in-situ composition. Sediment is plentiful of well-preserved bivalves (0.5-4.5%), gastropod (0-2.5%), hyaline, porcellaneous foraminifera (0-2%), agglutinated foraminifera. Most of them are Quinqueloculina sp., Pseudorotalia papuanensis, Textularia sp (TATEISHI et al. 2001) (PETER FRENZEL, NHUNG N., personal communication). The other fauna is represented by dinoflagellates, echinoids, sponges, echinozoans and the other types. The sediment includes low amount of quartz (1-14%), feldspar (0.1-3%), mica and rock fragment (0.1-3%), pyrite, calcareous concretion and no plant remain (Fig. 4.3b).
The clay mineral compound is presented by illite, kaolinite, chlorite and especially smectite. Compare with facies 1.3, the ratio of c/(k+c+i) continues to reduce (10%), s/(s+i+k+c) increases to 40%, peak area of illite rise from 150 to 250 in the upper part. In that illite well-ordered reduces. Gypsum reaches high value (peak area: 17) (Fig. 4.3c).
ASM 14C date from shell material at depth 31 m is >49,000 yr BP.
56
Interpretation: facies 2.1 of TB3 is the same like the above described facies 2.1 of TB1 and TB2 cores. A high content of smectite and a rich sea fauna complex in the sediment, indicate low sedimentation rate during formation and the facies is interpreted as shallow marine clayey silt.
Facies 2.2 (depth in core 27-20 m) consists of greenish medium clayey silt, homogeneous structure with massived clay, overall coarsing-upward succession from clay to medium silt. Grey massive layer (1-3 cm) with white line (1-2 mm) structures are speciality for this facies (white thin lines and calcareous concression are recognized only in the radiograph photo) (Fig. 4.3a). Texture is characterised by fine grain size (Md: 7.98 µm), well to medium sorting (So: 1.98), symmetrical to fine skewness (Sk: 0.92).
The fraction >0.1 mm occupied only 1-2% weight of sample, that why it is poor of quartz, mica and feldspar. Fauna almost disappeared. Plant remains content is 0-0.2% (Fig. 4.3b).
Clay mineral composition shows poor kaolinite, gibbsite and low ratio c/(c+k+i), but it increased in the upper part from 6 to 10%. Smectite disappears in the top of facies. I/S ml has low amount (peak area 9). Illite rapidly decreases from 240 to 56 in value of peak area, most of illite is well-ordered type. quartz and feldspar show low content, like trend in >0.1 mm fraction (Fig. 4.3c).
Interpretation: this facies is interpreted as prodelta clayey silt on the base of their structure, clay composition, accumulated after maximum flooding surface of Holocene transgression.
Facies 2.3 (depth in core 17-20 m) displays fine clayey silt with different convoluted massives, calcareous concretion (<4 cm). The massive are in reddish brown-colored layers. Chaotic and lenticular structure are speciality types of sediment (Fig. 4.3a).Texture is characterised by coarser grain size (Md: 8.36 µm), well sorting (So: 1.89), symmetrical to fine skewness (Sk: 0.95).
The fraction >0.1 mm (0-3% wg. of sample) is composed of quartz (0-2%), mica (0.4%), feldspar (0.2%) and pyrite (Fig. 4.3b).
Clay mineral composition is characterized by increase amount of kaolinite with ratio k/(k+i+c) from 15 to 20%, high amount of gypsum (34), low amount of illite (iw/(iw+ip) 60%) (Fig. 4.3c).
Interpretation: convoluted bedding structure and mineral composition of the facies shows high energy in slope part of RRD, low weathering of material rich supply source to RRD and a change of sedimentation process from transgression to regression. This facies is interpreted as delta front slope clayey silt.
This facies is passing to upperlying facies 2.4 with erosional surface at depth 16.9 m by

57
landslide, when supplying source was very high.
Facies 2.4 (depth in core 14-17 m) consists of greenish grey sandy clayey silt, rich mollusca, and agglutinated foraminifera. Special structure is wave cross-bedding type (Fig. 3.3a). Sediment is characterised by coarse grain size (Md: 26.03 µm), very bad sorting (So: 3.61), coarsely skewed (Sk: 1.11).
In fraction > 0.1 mm (14.5-75% wg. of sample), quartz percentage is 10.5-46%, feldspar and mica is 3-10%, 1-10%, respectively. These components are higher than in the facies 3.2. Calcareous concession is developed. The sediments include bivalves (0.1-5%), gastropod (0.1-1%), agglutinated foraminifera (0.1-0.5%), other foraminifera, dinoflagellates, echinoids, sponges, echinozoans and plant remain are small amount (Fig. 4.3b).
Clay mineral characteristic is high amount of I/S ml (peak area: 45), kaolinite, illite, chlorite, ratio of k/k+i+c), g/(g+k) are 20%, 16%, respectively. There is abundant of chlorite with highest ratio of c/(c+k+i) (45%). Gypsum rapidly decreases from the low to the top of facies (peak area: 20-0) (Fig. 4.3c).
ASM 14C date from shell material at depth 14.3 m is 6,432± 55 cal. yr BP. That is the time of beginning progradation (HORI et al. 2004).
Interpretation: this facies is interpreted as distributed channel lobe sandy clayey silt. Cross bedding structure, clayey silt rich in marine fauna complex, high amount of I/S ml indicated saline environment. Deposited environment near the supplied source or river created good condition to accumulate bad sorting coarse grain size.
Facies 2.5 (depth in core 10-14 m) is consisting of greenish grey fine clayey silt. Structure is interlaminated sand (at 13.7-13.8 m), silt lenticular bedding (12.8-12.9 m), cross bedding, ripple bedding and cracked (at depth 11.8-11.9 m), shell scattered. That means, structure is more complicated upward (Fig. 4.3a). Sediment is characterised by fine grain size (Md: 8.96 µm), well sorting (So: 1.93), fine skewness (Sk: 0.91).
In fraction >0.1 mm, amounts of quartz, feldspar, mica and rock grain, plant remain are 31.5-55%, 1-9.5%, 1-4%, 1-4%, respectively. From facies 3.3, this composition becomes richer. Fauna complex includes bivalves and gastropoda (0.1-0.2%), foraminiferas (0-0.1%) and pincer of a crab (Fig. 4.3b).
Clay mineral is characteristed by illite, kaolinite, chlorite with ratio of k/(k+i+c) is 17%, g/(g+k) is in the range of 36 to 18%. Chlorite has low amount (c/(c+k+i): 5%). Illite is enriched again (peak area: 70 to 150) with 60% of poor-ordered illite. I/S ml disappears in the top of facies (peak area: 29 to 3). Like illite, gypsum is abundant also (peak area: 8 - 22) (Fig. 4.3c).

58
Interpretation: based on multitype of sediment structures, mineral composition and fauna, this facies developing gradually from bar platform sandy can be interpreted as subtidal flat clayey silt.
Facies 2.7 (depth in core 6-10 m) consists of grey brown-coloured fine clayey silt with abundant organic materials and ripple bedding include thin laminated sand. Sediment is characterised by mean grain size (Md: 13.20 µm), well sorting (So: 2.09), fine skewness (Sk: 0.88).
The fraction >0.1 mm (74% wg. of sample) consists of quartz (49.5%), mica and rock grain (12.5%), feldspar (7.4%), plant remains (1%), bivalve and gastropod: 1% (Fig. 4.3b).
Clay mineral composition is similar as in facies 2.5 (Fig. 4.3c).
Interpretation: The facies is interpreted as intertidal flat clayey silt.
Facies 2.10 (depth in core 2.7-6 m) displays coarsening upward greenish grey fine sand. The sediment containing peaty laminations, rootlets, abundant organic material, rich in well preserves shell. The structure presents high degree in bioturbation in the lower part and greenish grey silty sand with cross bedding and convolute bedding in the upper portion of succession (Fig. 4.3a). Sediment is characterised by coarse grain size (Md: 17.55 µm), bad sorting (So: 2.74), coarsely skewness (Sk: 1.24).
The fraction >0.1 mm (24-64% wg. of sample) has the same detrital components as facies 3.5 This facies enrich in plant remain (1-3%), bivalve and gastropod (0.6-7%).
Clay mineral composition composed is same as facies 2.5. But increasing amount of gibbsite, chlorite and well-ordered illite (70%) with ratio g/(g+k), c/(c+k+i) are from 21 to 42% and 8 to15%, respectively.
ASM 14C date from shell material at depth 5.65 m is 4,740 ± 21 cal. yr BP.
Interpretation: This sediment can be determined as supratidal flat fine sand.
In short, due to good sample recovery (85%), Holocene succession in TB3 core can be divided into 11 sedimentary facies. In that, one facies 0.1 related to late Pleistocene, three facies are belong to estuarine sediments of trangressive stage, and seven last facies depended on deltaic sediments of regressive stage. The interesting of this core is two groups of fauna. The first one deposits in shallow marine and the second in distributary lobe. Both of them are variety as well as good preserved condition.

59
4.4. HT CORE
The HT core is located on high part of central RRD, where dominated by river- system (MATHERS and ZALASIEWICZ 1999). It is far from Hanoi 20 km (altitude: 5.3 ± 0.1; latitude: 20°48’49’’; longitude: 105°50’48’’) (Fig. 1.2). 40 m in length (samples recovery 90%) of core can be divided into two sedimentary units: unit 1-estuarine; and unit 2 - delta, and sedimentary facies. Detailed characteristic of these units and their facies from bottom to top are described below (Fig. 4.4.a-b-c).
4.4.1. Unit 1 - estuarine
Facies 1.1 (depth in core 39 -36.5 m) displays a reddish brown mottled sandy silt. Silt intercalated with very fine sand layers composing shell fragments and created parallel laminated. Furthermore, sediments are abundant mudclast, calcareous concession. Because sandy layers, the granulometry is characterised by coarse grain size (Md: 15.07 µm), bad sorting (So: 2.22), fine skewness (Sk: 0.89). Distribution curve is mesokurtic with one or two, three peaks of grain distribution.
Fraction >0.1 mm accounts 1-2% per weight of sample. In that, detrital composition increase i.e. quartz (0.5-1%) mica (0.1-0.2%), feldspar (0.3-0.8 %). In core, gypsum presented only in this facies (0.1-0.2%) is characterised by dark green colour, transparent rose-like-crystal (at depth 30 m). In addition, many limonite crust in the bottom of facies (36 m).
Clay mineral composition is characterised by high amount of kaolinite, illite, chlorite: the raito of k/(k+i+c) is range of 10-30%, the ratio of c/(c+k+i) is 10%. Illite (60% poor-ordered illite) has peak area of interval with 150 to 260. I/S ml appear with value of peak area of 4. The non clay minerals include high value of gibbsite (g/(g+k) 50%), and gypsum (3-7 in peak area).
Interpretation: This sediment can be determined as tidal influence channel fill sandy silt.
ASM 14C date from plant material at depth 39 m is 10,454 ± 54 cal. yr BP.
Facies 1.3 (depth in core 29.5 - 22 m) composes reddish brown mottled silt. This facie is started by brownish silt laminated grey, blackish peat or peaty silt and ended by massive brownish silt. The structure is laminated or massive, parallel with white brands (at 25.2-25.5 m). This facies is differenced by high amount of siderite that in radiograph photo appeares very clearly (at 29.7-30, 27.7-28 and 22.7 - 22.9 m). Sediment is characterised by Md: 10.79µm, medium sorting - So: 2.06, fine skewness- Sk: 0.86. Distribution curve is mesokurtic with one peak of grain distribution.
Siderite occupies 50% materials of fraction >0.1 mm. The left is quartz (0-3.5%), feldspar (0.2-0.5%) and mica (0-0.5%).
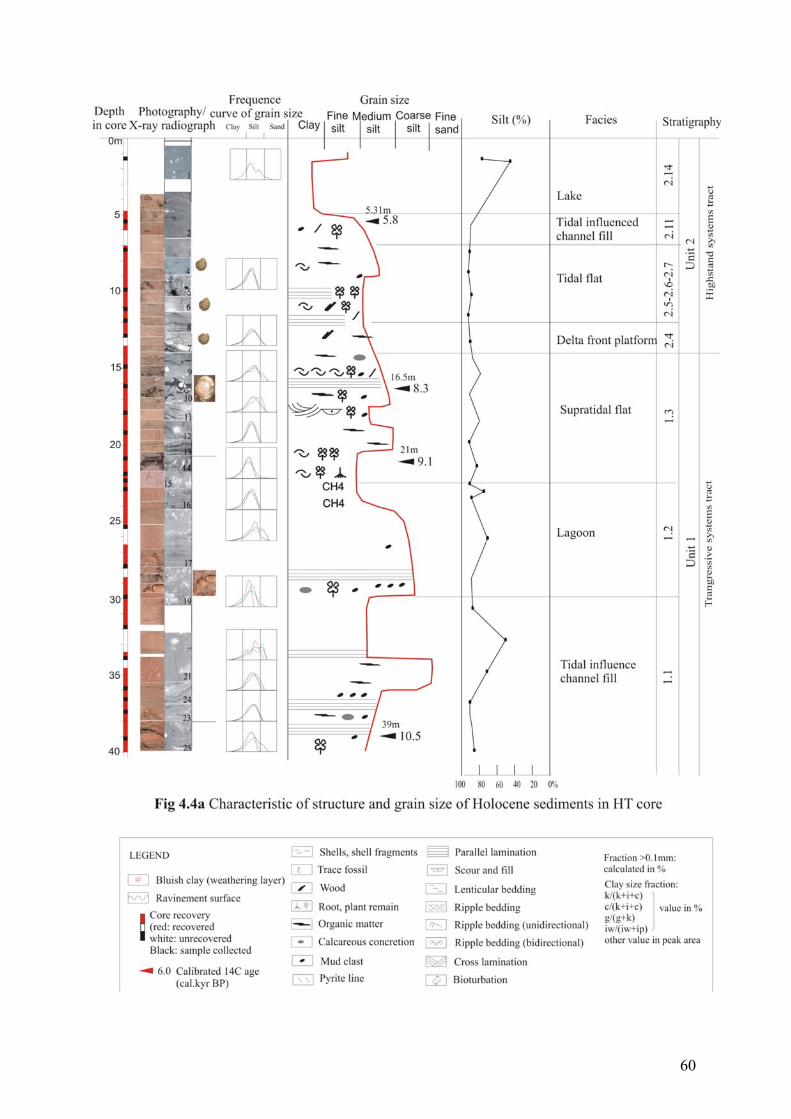
60

61
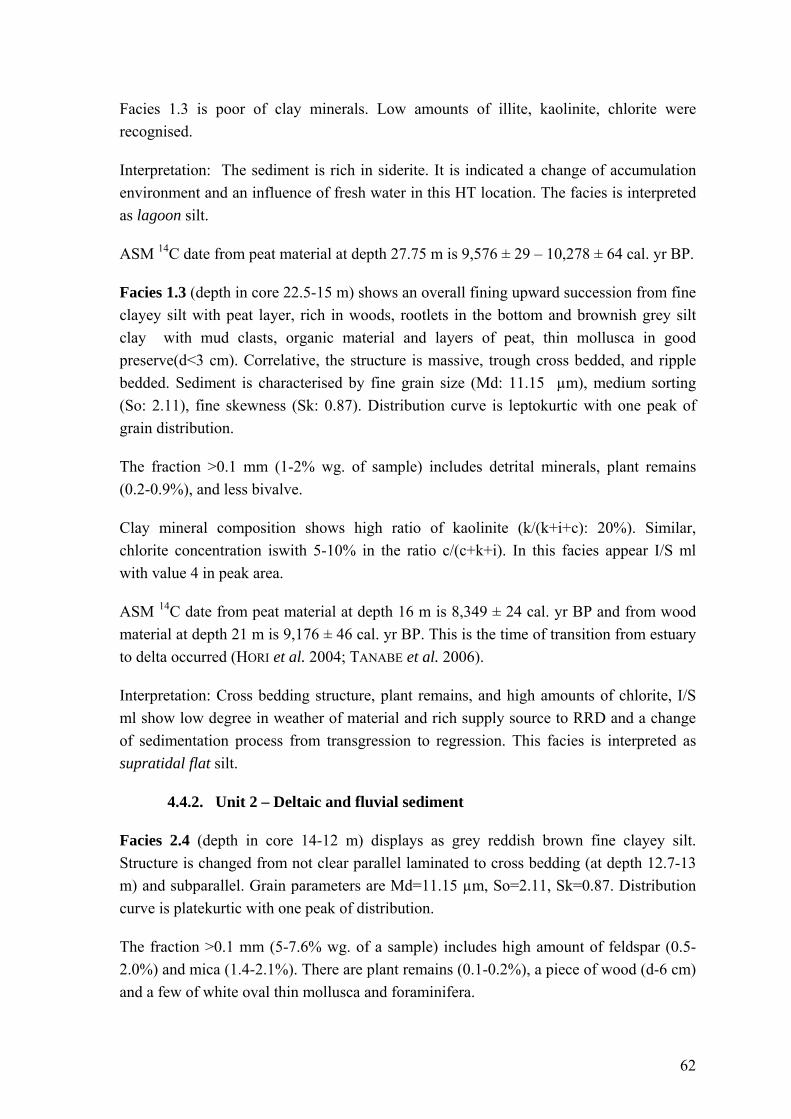
62
Facies 1.3 is poor of clay minerals. Low amounts of illite, kaolinite, chlorite were recognised.
Interpretation: The sediment is rich in siderite. It is indicated a change of accumulation environment and an influence of fresh water in this HT location. The facies is interpreted as lagoon silt.
ASM 14C date from peat material at depth 27.75 m is 9,576 ± 29 – 10,278 ± 64 cal. yr BP.
Facies 1.3 (depth in core 22.5-15 m) shows an overall fining upward succession from fine clayey silt with peat layer, rich in woods, rootlets in the bottom and brownish grey silt clay with mud clasts, organic material and layers of peat, thin mollusca in good preserve(d<3 cm). Correlative, the structure is massive, trough cross bedded, and ripple bedded. Sediment is characterised by fine grain size (Md: 11.15 µm), medium sorting (So: 2.11), fine skewness (Sk: 0.87). Distribution curve is leptokurtic with one peak of grain distribution.
The fraction >0.1 mm (1-2% wg. of sample) includes detrital minerals, plant remains (0.2-0.9%), and less bivalve.
Clay mineral composition shows high ratio of kaolinite (k/(k+i+c): 20%). Similar, chlorite concentration iswith 5-10% in the ratio c/(c+k+i). In this facies appear I/S ml with value 4 in peak area.
ASM 14C date from peat material at depth 16 m is 8,349 ± 24 cal. yr BP and from wood material at depth 21 m is 9,176 ± 46 cal. yr BP. This is the time of transition from estuary to delta occurred (HORI et al. 2004; TANABE et al. 2006).
Interpretation: Cross bedding structure, plant remains, and high amounts of chlorite, I/S ml show low degree in weather of material and rich supply source to RRD and a change of sedimentation process from transgression to regression. This facies is interpreted as supratidal flat silt.
4.4.2. Unit 2 – Deltaic and fluvial sediment
Facies 2.4 (depth in core 14-12 m) displays as grey reddish brown fine clayey silt. Structure is changed from not clear parallel laminated to cross bedding (at depth 12.7-13 m) and subparallel. Grain parameters are Md=11.15 µm, So=2.11, Sk=0.87. Distribution curve is platekurtic with one peak of distribution.
The fraction >0.1 mm (5-7.6% wg. of a sample) includes high amount of feldspar (0.5-2.0%) and mica (1.4-2.1%). There are plant remains (0.1-0.2%), a piece of wood (d-6 cm) and a few of white oval thin mollusca and foraminifera.

63
Clay mineral composition is characterised by low amounts of chlorite (c/(c+i+k): 6%). I/S ml raises amount to 5%. The ratio of k/(k+i+c), g/(g+k) is 13%, 20%, respectively. Beside, non-clay mineral gypsum appear (peak area: 6).
Interpretation: The subparallel lamination to cross bedding structure, a presence of mollusca, small foraminifera, an amount of detrital materials, gypsum, I/S ml amounts higher than in facies 2.1b show more supplied material and a change of the transgression to regression. Nevertheless, compared with TB1, this core is absent of prodelta and delta front slope facies. Hense, this facies can be interpreted as delta front platform sandy silt.
Facies 2.6-2.7 (depth in core 12- 7 m) composed of reddish brown clayey silt, occasionally with very fine sandy layers, lenticular bedding, biotubation bedding. There are scattered organic layers, big wood fragments (<5 cm), white thin shell fragment in the top. Texture parameter show as: Md=10.02 µm, So=1.99, fine skewness Sk=0.90. Distribution curve is mesokurtic with one peak of grain distribution.
Fraction >0.1 mm is very poor (0.3-0.5% wg. of sample). In that, reworked foraminifera are presented with mollusca in low amount.
Illite well-ordered, I/S ml and gibbsite (90% in 11 m) are dominant in mineral compound pf fraction <0.1 mm. This assemblage is the same with facies 3.4 in TB3 core.
Interpretation: The facies is interpreted as tidal flat clayey silt.
Facies 2.11 (depth in core 7-5 m) contents of brown massive clayey silt, occasional laminated sandy silt layer included wood fragments (<1 cm). The structures change from massive in the bottom to cross bedding in the top (at depth 5.3-5.6 m). Sediment is characterised by fine grain size (Md: 5.51 µm), well sorting (So: 1.88), symmetrical to fine skewness (Sk: 0.97). Distribution curve is platykurtic with three peaks.
The fraction >0.1 mm has components like in facies 3.2.
ASM 14C date from plant material at depth 27.75 m is 5,804 ± 99 cal. yr BP.
Interpretation: This facies is interpreted as tidal influenced channel fill silt.
Facies 2.14 (depth in core 5-0 m) is recent lake clay and silt. The sediment is characterised by fine grain size (Md: 2-5 µm), well sorted massive clay.
In brief, due to good recovery (90%) of the core, HT core can be interpreted as detailed as possible. During Holocene, the influence of marine is weak. In addition, HT located near the supplying source, the SW mountains. Hence, the sediments showing monotone colour are silt, clay and mostly were influenced by tidal. Holocene succession can be divided into 8 sedimentary facies. In that, four facies belong to estuarine sediments in trangressive

64
stage, one facies of delta front and the last of fluvial sediments in regressive stage. Compared with cores in the same location as CC, DT core (TANABE et al. 2003b; HORI et al. 2004), they also have hiatus of the delta low facies.
4.5. HN CORE
The HN core is located in river-dominated system (MATHERS and ZALASIEWICZ 1999) on high part of central RRD (Fig. 1.2). This core can be divided into three sedimentary units in upward ascending order: unit 0- later Pleistocene shallow marine; unit 1-estuarine; unit 2- shallow marine and delta, and 9 sedimentary facies. (Fig. 5.5a-b-c).
4.5.1. Unit 0 – shallow marine (late Pleistocene)
Facies 0.1 (depth in core 38-35.5 m) consists of massive monotonous red brownish motley colour clayey silt. The clayey silt sedimentary has patches of limonite (like facies 0.1-TB1). The texture is characterised by Md=6.15 µm, well sorting So=1.77, fine skewness (Sk=0.90). Frequency curve is leptokurtic with one population which is the same in whole core so that it will be not concern in other facies.
Fraction <0.1 mm is rich in smectite, kaolinite, chlorite, gibbsite, gypsum and has low peak area of quartz and feldspar. It can be further preferred in facies 0.1 in TB1 core.
Interpretation: Massive structure, high amount of smectite show this facies is saline environment likes shallow marine clayey silt.
4.5.2. Unit 1- estuarine sediments
Facies 1.2 (depth in core 35.5-33.5 m) consisted of massive grey clayey silt. The texture shows the fine grain size (Md=6.91 µm), well sorting (So=1.77), fine skewness (Sk=0.88).
Most of bulk sample (fraction >0.1 mm: 3-19%) is quartz (0.8-7.5%), limonite (1.4-2.2%) and siderite (0.3-10.6%). Small grain of limonite in this facies should be reworked from facies 0.1 that is very rich in primary limonite.
Fraction <0.1 mm shows the decrease of all clay minerals like kaolinite, chlorite, illite and the disappearance of smectite in sediment.
Interpretation: this facies is interpreted as lagoon clayey silt that is related to facies 1.3 of HT core with siderite component.
Facies 1.3 (depth in core 33.5-32.5 m) consists of grey brown-coloured fine clayey silt with wood fragments (<5 cm); lenses and thin peat layers (1-3 mm). They create laminated bedding. Sediment is characterised by fine grain size (Md: 7.44 µm), well sorting (So: 1.78) and symmetrical to fine skewness (Sk: 0.91).

65

34

34
Fractions >0.1 mm (3-7% wg. of sample) consists mostly of quartz (0.8-3.4%), mica (0.1-0.5%), and plant rest (3.0%).
In fraction <0.1 mm, kaolinite, chlorite and gibbsite have higher amounts than in facies 1.2. However, amount of illite and its components are stable.
ASM 14C date of plant materials from depth 33 m is 9,905±18 cal.yr BP.
Interpretation: like facies 1.2 – TB1 core, thin peat layer, brownish grey clay were interpreted as to supratidal flat clayey silt sediment.
Facies 1.4 (depth in core 32.5-25 m) displays brown grey loose mud. The sediments were lost during sampling process. In relation with facies 1.3, this facies can be interpreted as tidal muddy.
Facies 1.7 (depth in core 25- 22.6 m) includes grey brown massive clayey silt. The grain size is fine and well sorted.
The >0.1 mm fractions show high contents of quartz (18%) and feldspar (1%).
In fractions <0.1 mm appears smectite with low content. Furthermore, I/S ml has increasing trend. However, chlorite and gibbsite also rise (c/(k+i+c): 25%, g/(g+k): 50%)
Interpretation: this facies is interpreted as estuarine clayey silt. The massive clay was accumulated in quite environment without tidal influence, easy to enrich smectite and I/S mal content.
4.5.3. Unit 2 - deltaic and fluvial sediments
Unit 2 (23-0 m in depth) includes deltaic and fluvial sediments. Deltaic sediments compose prodelta, delta front slope and delta front platform facies. The boundary between unit 1 and unit 2 is translated and differenced by structure and composition of clay minerals.
Facies 2.2 (23 - 22.6 m depth) is characterised by the same sediments as in facies 1.3, but the structure is massive clay with thin white line. Clay mineral compound includes highest value of I/S ml (peak area: 30). Similarly, smectite counts to 8% in s/(k+i+c+s) ratio, poor ordered illite is major (80% of illite).
Interpretation: like facies 2.1 of the others cores, its can be interpreted this facies is prodelta.
Facies 2.3 (depth in core 22.6- 20.0 m) is composed of brownish grey silty clay with convoluted structures and calcareous concession in top part. The sediment is composed of poor detrital composition, but high in plant remains (3.9%). Smectite decreases and disappears in the top of facies. Also, gibbsite and chlorite reduce amounts.

35
Interpretation: Facies 2.3 can be interpreted as delta front slope clay.
Facies 2.4 (depth in core 20 - 14 m) displays as brown red clayey silt with slight laminated structures. Sediment mostly consist of quartz (1.5-6.1%), mica (0-6%), in fraction >0.1 mm (7.8-15.4% wg. of sample). The noticeable characteristics are the attaining of gypsum (0.3-0.5%) and siderite (0.1-9%) . Clay mineral absent smectite and showlow amount of I/S ml. In the same trend with facies 2.3, sediments are poor of chlorite, gibbsite, illite. Most illite is well-ordered illite.
Interpretation: it was indicated that this facies is delta front platform silt. The difference between this facies and other delta front platform is the appearance of siderite that was formed in quite environment with low organic material sediment.
Facies 2.6-2.7 (depth in core14.0-8 m) composed of grey brown silt and an overall fining upward succession from fine clayey silt to sandy silt. There are organic materials, rootlets (<7 cm) small shell fragments, incipient calcareous. Further, sediments have parallel or lenticular structures, fine grainsize (Md: 8.14 µm), well sorting (So: 1.77).
In fractions >0.1 mm rise amounts of detrital minerals e.g. quartz (1.6-12%), feldspar (0.1-0.5%), mica and rock grains (0.2-2.5%).
Fraction <0.01 mm shows high amounts of kaolinite (k/(k+i+c): 33%) but low percentage of gibbsite (g/(g+k): 14-20%) and chlorite. Gypsum has second catchable in core with peak area value at 46.
Interpretation: Described characteristics show that this facies relates to tidal flat sandy silt like facies 2.6-2.7 in HT core
Facies 2.10 (depth in core 8.0-5 m) displays a grey brown-coloured fine clayey silt with peat layers and lenses. In the lower portion, abundant rootlets are found. In the upper portion, laminated peat layers and peat lenses in silty clay are found. Grain parameters show very fine grain size (Md: 6.72 µm), well sorting (So: 1.69) and fine skewness (Sk:0.90).
Beside detrital mineral, fraction >0.1 mm rich in wood and plant remains
In fraction <0.01 mm, high amount of gibbsite (64%) is present in ratio g/(g+k). Moreover, chlorite attains 20% in ratio c/(c+k+i).
Interpretation: this facies is supratidal mangro marsh clayey silt, which is rich peat layer.
ASM 14C date of wood material from depth 7.25 m is 6,470±30 cal. yr BP.
Facies 2.14 (depth in core 5-2 m) displays brown-coloured massive clayey silt with organic lenses, rare rootlets. Sediment is characterised by fine grains (Md: 8.80 µm), well

36
sorting (So: 1.84, fine skewness (Sk: 0.91).
Fraction >0.1 (4-6% wg. of sample) composes a little of quartz, feldspar, mica and rock grain. Some gypsum and siderite have found at depth 4.7 m.
In fraction <0.1 mm, kaolinite enrich again with 30% in the ratio of k/(k+i+c). The same, well-ordered illite (64% of illite) is presented. On the contrary, gibbsite and chlorite decrease in amount.
Interpretation: This facies is interpreted as modern lake clayey silt in fresh water environment.
In short, although HN core is not long (38 m) it is composed 11 sedimentary facies. In that, one facies in bottom is related to late Pleistocene, following in top: 4 facies - to estuarine sediments of trangressive stage, and 6 upper facies - to deltaic and fluvial sediments of regressive stage.
4.6. YM CORE
The YM core is located in fluvial-dominated system (Mathers et al.,1998) on high part of central RRD. It is situated 50 km from SE Hanoi (Fig. 1.2). This core is 35 m in depth and sample recovery 48% of sediments. It can be divided into 8 facies in 3 units: unit 0- later Pleistocene fluvial; unit 1 - estuarine and unit 2 - delta and fluvial. Their detailed characteristic from bottom to top is described below (Fig. 4.6a, b and c).
4.6.1. Unit 0 -fluvial (late Pleistocene)
Unit 0 includes the following two facies of fluvial sediments.
Facies 0.1 (depth in core 35- 34 m) displays homogenous medium silty sand with plant remains and cross-bedding structure. Sediment is characterised by very high values of grain size (Md: 167.55 µm), bad sorting (So: 2.4), very fine skewness (Sk: 0.36). Frequency curve is very leptokurtic with two populations, especially 90% concerted in medium sand.
In fraction >0.1 mm (84% wg. of sample) quartz occupies 52%, feldspar, rock grain is 10.2%, 16.3%, respectively. Especially, limonite attains 10%.
Interpretation: This sediment can be determined as channel bed silty sand facies .
Facies 0.2 (depth in core 34-24.6 m): sample loss from 25 to 32 m. It is composed of red brown silty, fine sand intercalations. The structure is thin cross bedding in bottom and massive in top. Grain size is medium (Md: 14.50 µm), bad sorting (So: 2.21). Symmetrical to fine skewness (Sk: 0.98). Frequency curve is mesokurtic with two distribution peaks. A fining upward succession continues described for facies 0.1.

37
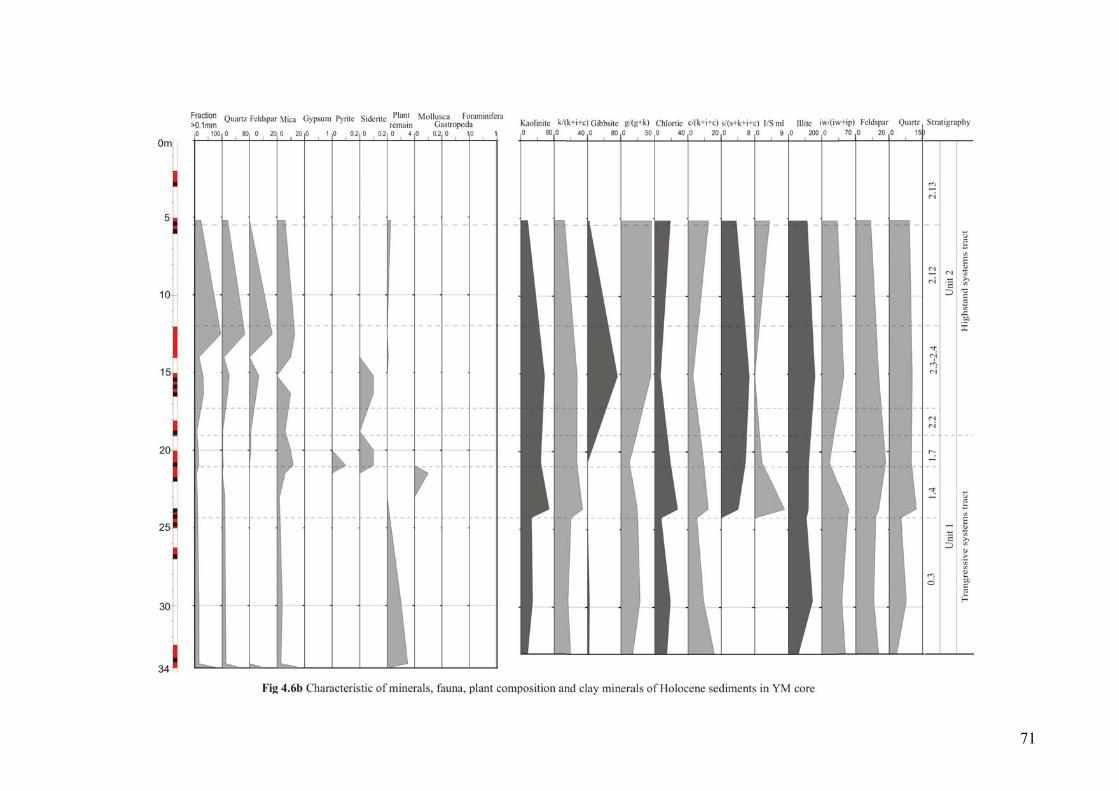
71

72
Fraction >0.1 mm (15-17% wg. of sample) includes mostly quartz (6-9%), mica and rock grain (1-3 %) and plant remains (2-3%).
In fraction <0.01 mm, the sediment includes high amount of illite with equal components.
Interpretation: based on the findings of Tanabe (2003), this facies is interpreted as channel infill sandy silt.
The facies is passing upward by erosional contact at 24.6 m with lateritic weathering surface and limonite incrustation (sample YM 17).
4.6.2. Unit 1- estuarine sediments
Facies 1.4 (depth in core 24.6-23.5 m) is represented by fining upward reddish brown fine clayey silt with plant remains. The structure alters from thin parallel to homogeneous (sample YM 15b). Sediment is characterised by mean grain size (Md: 9.12 µm), medium sorting (So: 2.05) and symmetrical to fine skewness (Sk: 0.92). Frequency curve is platykurtic with one or two distribution pick.
The fraction >0.1 mm (11.3% wg. of sample) composes of quartz (4.3%), feldspar (0.1%), and rock fragments (1%).
In fraction <0.1 mm, the k/(k+i+c) ratio is higher than the facies below 30% and the same with gibbsite (g/(g+k): up to 44%). There is abundant poor-ordered illite (87%). Beside that, gypsum appear with partical thickness is 72.
Interpretation: The facies is interpreted as tidal flat clayey silt.
Facies 1.7 (depth in core 23.5-21 m) displays brown silty clay in homogeneous structure composing shell fragments. The deposites have fine grain size (Md: 7.46 µm), medium sorting (So: 1.93), fine skewness (Sk: 0.89).
Mineral composition of fraction >0.1 mm shows the increasing of mica and rock grain from 1% to 6% upward the core.
The fractions <1 mm are rich in smectite, I/S ml, kaolinite, chlorite. The ratio of c/(c+k+i), s/(s+k+i+c) are 12% and 6%, respectively. Illite amount is stable in core. Poor-ordered illite concentrates in this facies (80% illite).
Interpretation: massive structure and a presence of smectite show that facies is estuarine silty clay which similar facies 1.7 in HN core.
4.6.3. Unit 2 - deltaic and fluvial sediments

73
Unit 2 consist of 5 sedimentary facies of deltaic and fluvial sediments as following. This core has no shallow marine facies.
Facies 2.2 (depth in core 20.5-18.5 m) includes grey brown clayey silt. Continuing from the top of unit 1, this facies has homogeneous structure. However, the deposits show very fine grain size (Md: 5.71 µm), well sorting (So: 1.79), and fine skewness (Sk: 0.85)
Fraction >0.1 mm has small percentage of quartz, feldspar, but is rich mica and mudrock. Moreover, sediment includes pyrite (0.1%) and siderite (0.1%).
Clay mineral compoudis characterised by high amount of smectite, kaolinite, illite.
Interpretation: facies 2.2 is interpreted as prodelta clayey silt in a very thin layer.
Facies 2.4 (depth in core 18.5-16 m) composes green brown sandy silt, clayey silt with convolve structure. In part of clay, sediment was sulphured in green colour. Grain size parameter include medium grains (Md: 10.62 µm), bad sorting (So: 2.15), symmetrically skewness (Sk: 0.96).
In fraction > 0.1 mm: 8.8-32.2% quartz amount is 2.-15%, feldspar 0-5%, rock grain 8.8-10% and little siderite.
Small fractions are rich in kaolinite (k/(k+i+c): 28%), gibbsite (g/(g+k): 45%) but poor of chlorite (c/(c+k+i): 5%).
Interpretation: the facies is interpreted by sedimentary composition and structure as delta front silt. In the top facies (thick 0.5 m), yellow red weathering clay layer means its erosional contact with upperlying sediment.
Facies 2.11 (depth in core 13 - 5.8 m) is presented by grey brown medium silty sand. Sediment is characterised by coarse grain size (Md: 262.42 µm), bad sorting (So: 2.51) and fine skewness (Sk: 0.56). Frequency curve is very leptokurtic with two populations, especially 90% concerted in.
Samples have high percentage of fraction >0.1 mm (96.5%), in that quartz (66.7%), feldspar (16.8%), mica and rock grain (13%) attain highest content in the whole core.
Most of samples were lost in drilling process.
Interpretation: this facies can interpreted as channel bed sand. That is the trace of historic river activity in this location. Due to erosion, this facies has unconformably boundary with facies 2.4 lower.
Facies 2.13 (depth in core 13 - 5.8 m) consists of brown grey-coloured fine clayey silt and fine sand intercalations with organic material, plant remains. Structure is laminated

74
bedding with interlayers silt and sand. Sediment has fine fraction (Md: 6.23 µm), well sorting (So: 1.84) and coarse skewed (Sk: 2.03). Frequency curve is mesokurtic with one population. Mineral component was dominated by detrital materials.
Interpretation: this facies is can interpreted as channel infill clayey silt.
In brief, although YM core was 35 m in length and composed 8 sedimentary facies. In that, two facies (0.1 and 0.2) in bottom is related to late Pleistocene, two facies next (1.4, 1.7) were estuarine sediments of trangressive stage and four last facies (2.2, 2.4, 2.11, 2.13) were deltaic and fluvial sediments of regressive stage. The upper facies (2.5, 2.10) of delta were eroded by river.
4.7. Discussion
The lithology of six studied cores in central RRD revealed the following characteristics.
- Silt and clay are the most abundant sediments while fine sand has little amount in Holocene succession in central RRD. That means, supply source was strong weathered and transport from far depositional centres or reworked from Pleistocene silty, clayey layers dominated.
- Main colour of Holocene sediments is reddish brown. This colour is characteristic suspension matter of RRD during Holocene and recent time. The grey or black colour is from sediment containing organic, plant, and peaty material. The green grey colour is especially for shallow marine silt, clay, where Fe+3 was changed to Fe+2.
- Grain size parameters were useful not only for sediment classification, but also for interpretation of facies, especially in distribution (frequency curves). Fourteen types of these curves show a change of lithodynamic conditions from bottom to the top of the Holocene succession in RRD. It is built up by tidal facies, estuary in transgression and shallow marine, prodelta, deltafront and tidal facies in regression. Estuary group has fine grain size, leptokurtic and symmatrical, monomodal or bimodal with rsmall>>rlarge. In transgression period, most facies had monomodal with mesokurtic frequency curve. But tidal facies in regression have bimodal, highly changing in short distance, rsmall~rlarge (Fig. 4.7). According to MATHERS (1999), it can be interpreted that in Holocene of RRD, when sea level was rising, the whole delta was controlled by tidal and small parts by wave dynamics with small energy. But during the regression with the development of the river, the deposition of sediment had influence on river, tide, and wave systems. Sediments were settled down immediately, what mean also high accumulation rate. In the estuary group, fine grain size, leptokurtic and well sorting pointed very low energy, slowly rate of deposition of middle Holocene.

75
Fig. 4.7 The types of frequence curvers and textural maturity of Holocene sediments in central RRD

76
Fig.4.8b Photographs, x-ray radiographs of typical sedimentary structure and facies in unit 2 in the central
RRD.
77
Fig.4.8a Photographs, x-ray radiographs of typical sedimentary structure and facies in unit 1 in the central
RRD
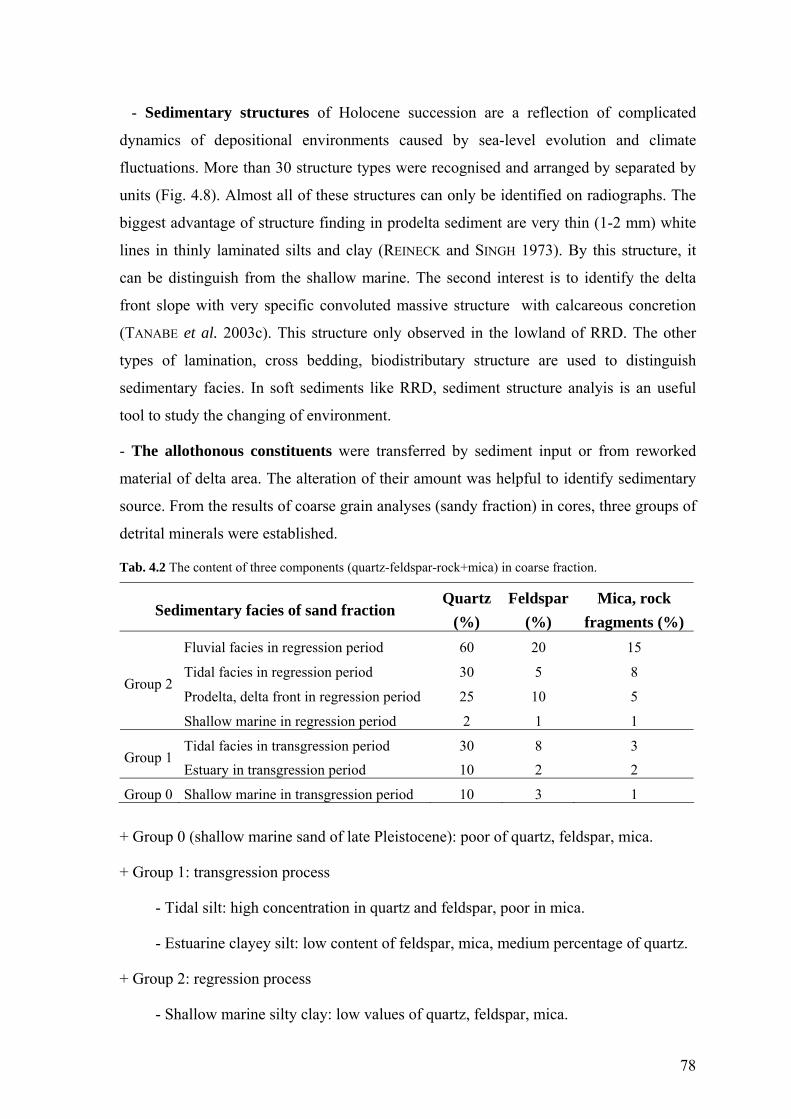
78
- Sedimentary structures of Holocene succession are a reflection of complicated
dynamics of depositional environments caused by sea-level evolution and climate
fluctuations. More than 30 structure types were recognised and arranged by separated by
units (Fig. 4.8). Almost all of these structures can only be identified on radiographs. The
biggest advantage of structure finding in prodelta sediment are very thin (1-2 mm) white
lines in thinly laminated silts and clay (REINECK and SINGH 1973). By this structure, it
can be distinguish from the shallow marine. The second interest is to identify the delta
front slope with very specific convoluted massive structure with calcareous concretion
(TANABE et al. 2003c). This structure only observed in the lowland of RRD. The other
types of lamination, cross bedding, biodistributary structure are used to distinguish
sedimentary facies. In soft sediments like RRD, sediment structure analyis is an useful
tool to study the changing of environment.
- The allothonous constituents were transferred by sediment input or from reworked
material of delta area. The alteration of their amount was helpful to identify sedimentary
source. From the results of coarse grain analyses (sandy fraction) in cores, three groups of
detrital minerals were established.
Tab. 4.2 The content of three components (quartz-feldspar-rock+mica) in coarse fraction.
Sedimentary facies of sand fraction Quartz
(%) Feldspar
(%) Mica, rock
fragments (%) Fluvial facies in regression period 60 20 15
Tidal facies in regression period 30 5 8
Prodelta, delta front in regression period 25 10 5 Group 2
Shallow marine in regression period 2 1 1
Tidal facies in transgression period 30 8 3 Group 1
Estuary in transgression period 10 2 2
Group 0 Shallow marine in transgression period 10 3 1
+ Group 0 (shallow marine sand of late Pleistocene): poor of quartz, feldspar, mica.
+ Group 1: transgression process
- Tidal silt: high concentration in quartz and feldspar, poor in mica.
- Estuarine clayey silt: low content of feldspar, mica, medium percentage of quartz.
+ Group 2: regression process
- Shallow marine silty clay: low values of quartz, feldspar, mica.

79
- Delta front clayey silt: medium content of quartz, feldspar.
- Tidal silt in regression: amount of quartz, feldspar is similar as tidal silt in group 1,
but higher contents of mica.
- Fluvial sand, sandy silt: very high percentage of quartz, feldspar, mica and rock fragments.
The contents of main sandy components varied during sea level change. The amounts of
sandy fraction, feldspar and mica, rock fragments in transgressive facies (group 1) is
lower than in regressive facies (group 2). This character has its origin in the sediment
sources: a dominance of reworked strong weathered later Pleistocene sandy silt and clay
for group 1- sediment deposited during Holocene transgression under warm seasonal
climate (11.5- 8.5 cal kyr BP). Group 2 – sediment contains high amount of destroyed
Palaeozoic, Precambrian rocks transferred especially from NW and NE of the delta,
deposited during the regression under seasonal warm-dryer (or cool -wet) climate (since
6.5 cal kyr BP - to present).
- The authochthonous minerals were formed in the accumulation stage or in the
beginning stage of diagenesis as gypsum, limonite, calcareous concression, siderite, and
pyrite had sedimentological and diagenesic origins. They developed in silt and clay of all
successions. The authigenetic minerals can be used for definition not only of sedimentary
environments, but also to correlate sedimentary facies from different cores (LIEU et al.
2005).
Gypsum was the first time interpreted in sediment of RRD. The forming process of
gypsum can be described by sea water flowing into lakes and tidal flats, during the high
tide. Then during low tide this area are exposed. The evaporation in the conditions of high
temperature (>30°C during some days, or 25-30°C for many days) let the soda salt
concentration of sea water increase by 3.5-5 times (JOHN 1999). In this condition, gypsum
is crystallized, forms crystals of twin types - “sandy rose” shape. After that the sediments
of the following flood will cover the lakes by a brown clay-mud and gypsum is buried
under this layer. The alteration of wet and dry season which relates to monsoon climate in
South Asia gives good condition for gypsum to develop (ELY et al. 1996; ENZEL et al.
1999). Furthermore, in environment of warm and long dry season, parts of gypsum
crystals are developed, forming nests of 2-3 mm in size; druses within fissures can be
formed (Fig. 4.10a). During the transportation, gypsum is not stable. Their colour change
from brown to brownish colour or solved a part, or has round shape. Hence, the polytypic
80
and content of gypsum could be used like basements to interprete the climate conditions
and sedimentary deposit.
Gypsum can be observed in the low land of recent delta. Especially in location of TB1,
TB2, rare in TB3, HT and absent in YM, HN core. In fraction >0.1 mm, four types of
gypsums can be observed (Fig. 4.10a):
1- Polycrystal druses crystals, opaque, brown-coloured, rose like crystal widely
distributed in prodelta and delta front of unit 2 on Thai Binh - Nam Dinh area.
2 - polycrystal druses crystals: d = 0.05 to 2 mm, transparent colour, 'rose’ shape. This
type commonly appears in estuarine, shallow marine clayey silt on Thai Binh area.
3 - The gypsum with crystal druses, d = 0.1-2.5 mm, greenish, opaque grains. This type is
distributed in lagoon, marsh clay and silt which rich in organic material, rythmytical dry
seasonal on Ha Tay area (Facies 1.3).
4 - Grain or prism shape, microcrystal druses, d = 0.2-2.0 mm, with brownish colour. This
type is located in tidal salt flat clay and silt where influenced of seawater in season.
The population of gypsum also can be detected in XRD with different concentration in
cores. The gypsum in the clay fraction had the same behaviours like gypsum in coarse
grain.
Based on the distribution of gypsum in Holocene sediment, previous climate can be
interpreted. During the transgression period, the appearance of gypsum with shapes
mostly a microcrystal reveal dry/wet season or high monsoon climate. In the beginning
regression, when recent delta was flooded, gypsum type (2) was abundant with
characteristics of transparent colour and erosion shape. Although they could be reworked
minerals, but the high concentrattion of them can be concluded by the higher influence of
monsoon. However, the distribution of gypsum, especially the type (1) is related with the
starting delta progradation. The behaviours of gypsum proved extension of dry periods in
warm climate when they can form the rose-like crystals. More over, it can be said that,
the shoreline become lower than before and gypsum was still kept in well shape after
transferred to the depositing location. In the upper part of deltaic sediment, there was only
few gypsum, that may be related with a cool climate or long wet seasons which prevented
the evaporating and accumulating process.

81
Fig. 4.10a. Four types of gypsum in Holocene sediment of central RRD

82
Fig. 4.10b. Siderite, limonite and fauna observed in Holocene sediment of RRD

83
Siderite is the synthetic mineral between Fe2O3, organic acid and carbonate (shell fragments) in reduced to feebly reduced of diagenetic stages (BERNER 1981). It is presented as greyish yellowish micrograin encrustment or tube, d = 0.1-1 mm and brown-greyish concretion, d = 0.2-2.0 mm. Siderite is distributed in lagoon, lake some time in delta front where poor of organic material such as in HN, HT, YM cores on Ha Noi, Ha Tay areas (Fig. 4.9) during early-middle Holocene. Siderite manifestations in sediments of the unit 2 can be caused by the destruction of lower-middle Holocene sediments in the redeposited delta margin.
Limonite displayed as brown-yellow iron encrustation, tubes or limonite grains. They
were found widespread in upper part of unit 0, in the weathering crust of the upper middle
Holocene. In low part of unit 2 also rich of limonite that were transformed from upper
part of weathering surface to delta plain by river.
Pyrite has microcrystal form with yellow colour inside, but black colour outside because
of low matureness. Their distribution was locally connected with environments rich in
organic material like lagoon, peaty swamp, marine like facies 1.1, 1.5a, 1.3 in HT, 1.3 in
YM core.
Clay minerals in Holocene deposits include two kinds: detrital and neoformed. The
mineralogical analyses of the <2 µm fraction, by X-ray diffraction, showed the
dominating phases of illite, kaolinite, chlorite accompanied with smectite, I/S ml, and
gibbsite. Among three main clay minerals i+k+c, illite was dominating. The average
amount of chlorite was varies 7-18%, usually 10-12%, the content of kaolinite was 5-41%
or 15-25%. The rest more than 50% belonged to illite. That means, illite is the most
abundant mineral. The next is kaolinite, and the less abundant is chlorite. The I/S ml
appeared in the same area of smectite but more widely. High amount of the smectite was
related to shallow marine sediments (Fig. 4.10). So that smectite, I/S ml, chlorite and
gibbsite are rather good environment-marker minerals. There are four most typical
assemblages in clay minerals.
Tab. 4.3 Four group of clay mineral in Holocene sediments in central RRD
Assemblage i/(i+k+c)
(%) k/(i+k+c)
(%) c/(i+k+c)
(%) s/(i+k+c+s)
(%) I/S ml
(peak area) Gibbsite
(peak area)
1 Gibbsite-kaolinite 62-73 15-21 12-17 0-1 1-10 120-70
2 Smectite 45-78 10-14 4-14 >20 (23-41) 5-10 7-20
3 I/S ml, Smectite, kaolinite 55-67 >25
(26-33) 7-12 10-23 100-120 16-50
4 Illite-chlorite 53-66 10-19 15-37 0-5 0-20 25-42
84
- Gibbsite-kaolinite assemblage is recognised in the LGM sediments (F.0.1, 0.2) and
fluvial facies of unit 2. The presence of this assemblage shows high chemical weathering
degree of supply source during LGM and fluvial activity of regression stage in the warm
and wet periods. In this case, modern climate condition is warmer and wetter again (LI et
al. 2006).
- Smectite, low amounts of kaolinite assemblage was characterised for facies F.2.1
shallow marine in TB3. The concentration of smectite in marine environments is
controlled not only by provenance (closely linked to climate) but also by particle size, and
neoformation. Due to the fact that smectite remains in suspension for long time it is
transported further offshore (RICHARD 2005) the sediment could be inherited from delta
plain soil and transferred to shallow marine. Furthermore, by the very high percentage of
smectite can be interpreted that the climate had long dry period. The enrichment of Si in
environment will slowly lead to the substitution of Al by Si and form illite-smectite ml
and smectite. After that, by transportation and segregation processes it it concentrated in
marine environment (CHAMLEY 1989). Nevertheless, according to MEUNIER (2005), the
replace of K+ by Na+ in structure in sea water leached illite transformed to I/S ml and
smectite was other explaination for the neoformation of smectite.
Gypsum appears in the same depth of the same cores. It can be observed that the facies
rich in smectite is also rich in gypsum. Because gypsum can not be formed in marine so it
mostly transported from the soil. Also, both, gypsum and smectite are indicators for dry
climate. Thus, the provenance of smectite was from neoforming and from soil.
- I/S ml, smectite , high amounts of kaolinite assemblage belonged to facies F.2.1 shallow
marine in TB1, 2 can be related to the transition from shallow marine into prodelta or to
the onset of delta evolution. Based on the grain size of clay mineral, kaolinite can not be
transported as far from land as smectite (GIBBS 1977). According to TAMURA (1955), the
ratio of kaolinite/smectite decreases typically from land to sea in front of a river. It is also
mentioned for New Orleans river by MANHEIM (1972) with the same distribution
(WEAVER 1989). It means that, sea level did fall and delta development started in RRD.
Furthermore, kaonilite and gibbsite also in this assemblage are related with high rainfall
in this period.
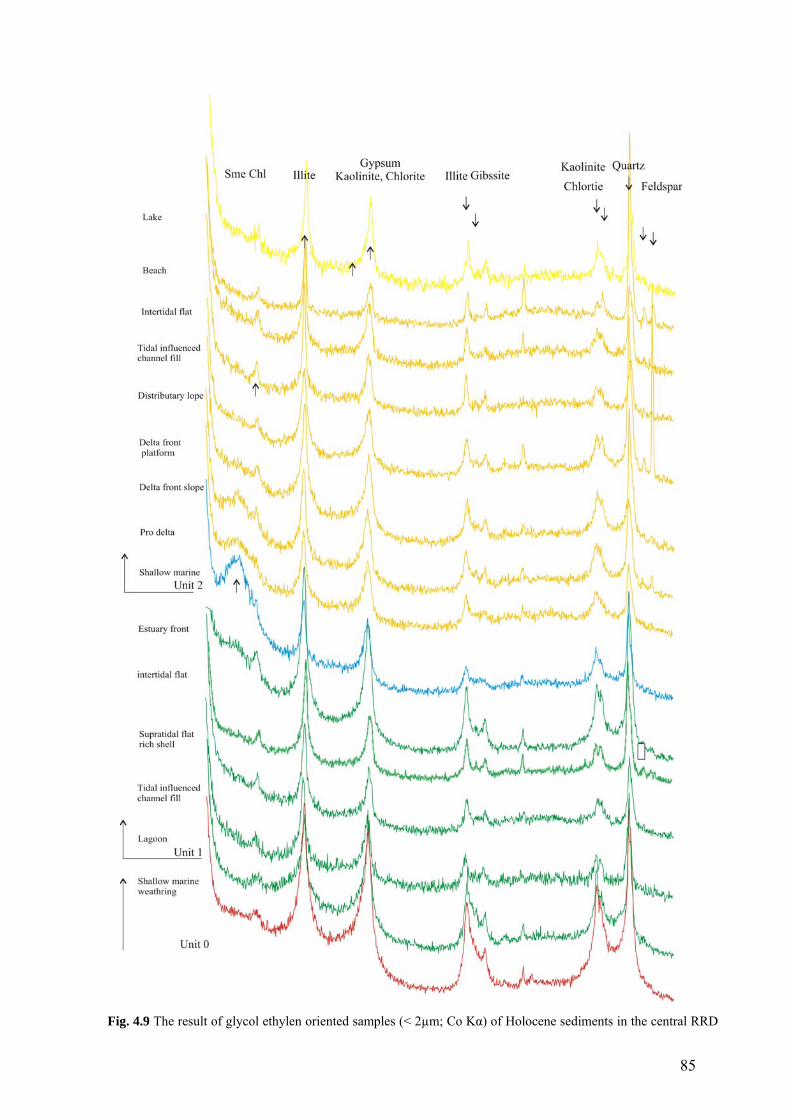
85
Fig. 4.9 The result of glycol ethylen oriented samples (< 2µm; Co Kα) of Holocene sediments in the central RRD

86
Fig. 4.9b. The distribution of clay mineral in sedimentary facies in central RRD
87
- Illite well-ordered, chlorite assemblage was widely spread in unit 2, from facies 2.3 to
2.5. It is characterised for high rate of supply source and accumulation. They are mostly
related with the cold and dry climate when physical weathering products are
predominating. Such a cool and dry period also affected South China between
approximately 5 and 1 cal kyr BP (YI et al. 2003).
Fauna complex: distributed in the lower part of unit 1, but the most abundant in the
lower part of unit 2. Fauna complex in tidal, delta front platform includes small or big
ones, or fragments of bivalves and gastropods. The marine fauna complex included
bivalve, gastropoda; hyaline, agglutinated foraminifera mostly appeared and concentrated
in facies 2.1 of TB1 core (depth: 30.5-34.5 m) and TB2 core (depth: 34-40.3 m), TB3
core (36.6-28.6 m in depth). After that they reduce amount in next deltaic facies.
Especially, in unit 2 of TB3 core (16.6-14.3 m in depth), the second occupation of it
(complex rich agglutinated foraminifera) were identified as delta front sandy bar (Fig.
4.10).
AMS 14C age data were presented in Tab. 5.1. From six cores, sixteen samples were
taken from shells, plant remains, peats and were analysed and calibrated. The samples are
located in bottom of unit 1 and bottom and top of unit 2. With most of them right date is
expected (14/16 samples) (Tab. 4.3). There are three groups of facies that were dated.
- Samples collected in the mangrove or supratidal facies in lowest part of Holocene have
ages about 10.5, 11.5, 12 cal.ky BP in HN, TB1, TB2 core, respectively.
- Samples collected in the shallow marine facies have difference ages from 8.5 (HT, VN,
ND1) to 3.3 cal.kyr BP (HV, GA).
- Samples collected in the delta facies have ages from 6.4 to 0.5.
These data are precious material to correlate stratigraphy in the next chapter.
In brief, above mentioned parameters or indicator elements are basement for a division of
sediments in each cores (Fig. 4.1a-4.6a). According to this data, the geological –facies
profiles will be established and used to correlation Holocene deposits from land to sea.

88
Tab. 4.4 AMS 14C dates from the sediment cores taken from the sediemtn of central RRD
Calibrated age
Sample ID 13C
Depth (m)
Sample Descrip-
tion Fraction Delta 13C Conventional
Age (cal. Yr BP) Probability
(%) Mean
(cal. Yr BP)
1. KIA27445 13 TB1-08 Wood, base residues
-28.79 +/- 0.12 5,609 ± 27 BP 5,687-5575 68.3 5,631 ± 56
2. KIA27446 30.5 TB1-42 Bivalve -5.78 +/- 0.13 3,887 ± 34 BP 3,955-3838 68.3 3,896 ± 59
3. KIA27447 46.1 TB1-67 Shell fragments -6.69 +/- 0.31 10,482 ± 58 BP 11,507-11,424 53.9 11,495 ± 42
12,303-12,230 13.7 12,142-11,920 42.3 12,031±111
4. KIA27448 62 TB2-74 Peat without fungi, base residues
-26.92 ±0.16 10,258 ± 37 BP
11,810-11,766 12.3
5. KIA27448 62 TB2-74 Peat without fungi, humic acids
-27.70 ± 0.13 10,281 ± 37 BP
6. KIA27449 5.65 TB3-05 Shell fragments -9.27 ± 0.36 4,535 ± 33 BP 4,761-4719 47.6 4,740 ± 21
7. KIA27450 14.3 TB3-11 Mollusca -3.65 ±0.29 5,985 ± 37 BP 6,487-6377 68.3 6,432 ± 558. KIA27451 31 TB3-25 Mollusca -1.21 ± 0.33 > 49,030 BP 9. KIA27452 42.47 TB3-34 Mollusca -12.49 ± 0.93 > 49,010 BP
5,903-5706 58.1 5,804 ± 9910. KIA27453 5.31 HT-02
Wood, base residues
5,040 ± 120 BP5,699-5662 10.2 8,373-8326 41.3 8,349 ± 248,308-8300 4.1 8,260-8248 6.8
11. KIA27454 16.05 HT-10 Peat, wood, base residues
-30.55 ± 0.21 7,507 ± 32 BP
8,240-8215 16.2 9,396-9393 0.7 9,275-9233 18.4 9,222-9130 46.4 9,176 ± 46
12. KIA27455 21 HT-15 Wood, bark, base residues
-30.30 ± 0.18 8,231 ± 34 BP
9,100-9092 2.7 9,678-9669 4.8 9,663-9648 8.9 9,630-9606 14.3
13. KIA27456 27.75 HT-18 Charcoal, acid residues
-28.22 ±- 0.19 8,653 ± 43 BP
9,605-9547 40.3 9,576 ± 2910,466-10,464 1.4 10,404-10,358 20.5 14. KIA27456 27.75 HT-18
A Sediment base residue
-28.32 ± 0.22 9,204 ± 48 BP10,351-10,244 46.4 10,287 ± 6410,552-10,521 11.6 10,508-10,400 53.3 10,454 ± 5410,316-10,314 1.4
15. KIA27457 39 HT-25 Plant material, base residue
-27.22 ± 0.09 9,274 ± 40 BP
10,298-10,292 2 6,546-6509 21 6,504-6445 44 6,474 ± 3016. KIA27458 7.25 HN-07
Wood, base residue
-27.10 ± 0.37 5,712 ± 36 BP6,420-6414 3.4
10,147-10,137 2 10,113-10,078 12.3 10,095 ± 1810,070-10,059 2.7 10,032-10,019 3.4 10,011-9995 4.1 9,954-9932 4.1 9,923-9887 13 9,905 ± 189,883-9863 6.1 9,852-9818 10.2 9,835 ± 17
17. KIA27459 33 HN-21 Bark, base residue
-27.20 ± 0.18 8,834 ± 41 BP
9,812-9776 10.2 9,794 ± 18
18. KIA27459 33 HN-21 Bark, base residue
-26.83 ± 0.19 8,908 ± 40 BP

89
5. SEQUENCE STRATIGRAPHY OF HOLOCENE SEDIMENT IN CENTRAL RED RIVER DELTA
In the process of deposition, especially in delta area, during the same time, different
facies were formed, from the upper part to lower part of delta (REINECK and SINGH 1973).
The stratigraphic division of Holocene deposits on time (age) and source (facies) in RRD
still is insufficient and this is the reason to analyis sequence stratigraphy. Furthermore, in
Holocene, the sediment deposited continuously and built full “strata units”. That are
sedimentary unit formed during a cycle of rise and lowering of sea level, there is no
depositional gap (VAN WAGONER et al. 1988), p. 110)
To analyse sequence stratigraphy, three profiles were established (Fig. 5.1-2a,b,c). The
correlations of sedimentary facies and stratigraphy of Holocene sediment were carried out
from not only from our studied cores TB1, TB2, TB3, HT, HN, YM but also from other
cores, e.g. DT, ND1, CC, HV, VN, NB, GA (TANABE et al. 2006) (Fig. 5.1). The
correlation was always based on sequence boundaries, ASM 14C, detrital and authigenic
mineral compositions, clay minerals and fauna assemblages.
From 14C age, the correlation of Holocene sediments in central RRD was carried out on
three profiles. First section - T1 - longitudinal profile, crossing cores: HN, YM, TB3,
TB1, and TB2 from Ha Noi to the near shoreline shown in Fig. 5.1. Second section - T2 -
situated SW in the first profile, has the same direction and links the following cores: HT,
DT, ND1, NV from Hoa Lam (Ha Tay) to the sea (Fig. 5.2c). Profile T3 is established
along coastal zone from Ninh Binh to Thai Binh (cores: ND1, NB and TB2) with SW-NE
direction (Fig. 5.2b).
5.1. Sequence stratigraphic boundaries
The content of this sequence stratigraphy was shortly introduced in chapter 3. The
sequence stratigraphy interpretation is based on lithology, facies interpretation, AMS 14C,
with the data of sea-level curve for the western coast of the South China Sea since the
LGM (TANABE et al. 2006). Holocene sediments of RRD are characterised by multifacies
of estuarine, shallow marine, deltaic and alluvial groups (TANABE et al. 2003b; LAM
2005) with twenty Holocene sedimentary facies covering the period from 11,500 yr BP to
today (Tab. 4.1). The following description of Holocene stratigraphy is based on
published contributions and data of our cores: TB1, TB2, TB3, HT, HN, YM.

90
5.1.1. The sequence boundary (SB)
A sequence boundary is an erosional surface that separates cycles of deposition. That
surface separates older sequences from younger ones (in this case, late Pleistocene and
Holocene), commonly an unconformity (indicating subaerial exposure), but in limited
cases a correlative conformable surface (VAN WAGONER et al. 1988; POSAMENTIER and
VAIL 1988b). In RRD, late Pleistocene - Holocene boundary is a strong lateritic
weathered and well consolidated layer. This layer consists of yellow-reddish-brown
shallow marine clay or silt, fine sand with brownish lateritic concretions. It composes
white kaolinite nests, revealed veins in x-ray radiographs high content of a gibbsite and
gypsum in mineral result. These sediments, that indicate widely subaerial exposure during
the sea-level lowstand of the LGM, cover the entire RRD surface during late Pleistocene
and can be traced to 90 m depth on the recent shelf (BIEU 2001). The boundary of this
layer with upperlying tidal channels, salt marshes, or lagoons displays an erosion surface
or non sedimentation stage. While this boundary is located on active river flood plain
marsh, or lake sediments (ND1, TB2 cores), it is characterised by an underlying weakly
weathered yellow-brownish layer, containing laterite nests. That is the unconformity
boundary between later Pleistocene and Holocene.
The calibrated age of this boundary was identified by 14C ages. In land, core HN (highest
distance from sea) has an age of 9.9 cal. kyr BP at 33 m for plant remains in mangrove.
But the cores TB1, TB2 at depths about 40-50 m are older (11.5, 12 cal. kyr BP) when
basic trangressive deposits were established, respectively. It evidents the conclusion that
the age of the boundary Pleistocene –Holocene in 10 covenened kyr BP is the same as in
RRD for the highland. But sea level was reached to recent delta at least 11,500 yr BP.
5.1.2. Transgressive surface (TS)
A transgressive surface (TS) is defined as a flooding surface separating a progradational
or aggradational lowstand systems tract (LST) from a retrogradational transgressive
systems tract (TST) (POSAMENTIER and VAIL 1988b). In the paleo-Changjiang incised-
valley fill, TS is at the boundary between sandy fluvial sediments and basal fluvial
gravels . The thick aggradational fluvial sediments of the upper part of the sequence were
dated to about 12 cal. kyr BP, which corresponds to the middle part of the last sea-level
rise after the LGM. They showed that a thick fluvial sequence was overlain by an
estuarine sequence later during the period of sea-level rise (TANABE et al. 2006)
91
In the RRD the age of sediment at the depth 56-70 m in the ND-1 core is ~14.8 or 14.9
cal. kyr BP. These dates fall within the sea-level lowstand of the LGM. On the other
hand, the age of the upper part (depth 36-56 m) must be before 11–12 cal. kyr BP,
because the overlying estuarine sediments (at depth 41.9 m) were dated to 11.4 cal. kyr
BP (the same date as is in TB1 core- at depth 46.1 m). As there is no erosional surface
between these intervals, the fine fraction floodplain sediments must have been deposited
between 14.8 and 11–12 cal. kyr BP. Based on C-14 data from the sediments, layed on
trangressive surface: 11.5 cal kyr BP at 46.1 m in TB2 core (near recent shoreline) 9.1
cal kyr BP at 16 m in HT core (near Ha Noi) we note that the shoreline moved landward
from TB2 core to HT core location about 170 km and a rise of 36.1 m (46.1-16.0 m)
between 11.5 and 8.3 cal kyr BP.
5.1.3. Maximum flooding surface (MxFS)
The Maximum Flooding Surface (MxFS), which is defined as the marine flooding surface
that separates the retrogradational transgressive systems tracts (TST) from the
progradational highstand systems tracts (HST) was identified between estuarine
sediments and downlapping deltaic sediments in the cores (VAN WAGONER et al. 1988) or
onlapping shallow marine sediments for central RRD. Below the MxFS, sedimentary
environments indicate a fining-upward succession. Mostly, the flood-tidal delta or estuary
environments before MxFS suddenly change to a shelf environment at the MxFS. On the
other hand, sedimentary environments indicate a coarsing-upward succession above the
MxFS.
The shallow marine deposits were eroded during regression when sea level was relatively
stable and shelly layers were formed. The shell layers overlie estuarine sediments with
sharp erosional surfaces and gradually coarsing-upward to the delta front sediments in the
TB1, TB2, VN, HV, NB, and GA cores. The ages of the shell layers just above the
erosional surface show 8.5 cal. kyr BP (ND1, VN), 6.2-6.5 cal. kyr BP (DT, TB3), 4.6-4.0
cal. kyr BP (TB1, HV), 3.3 cal. kyr BP(GA). Thus, there is to be realised a gap between
the oldest and youngest is about 5.0 cal. kyr BP in duration. This evidents also were
discussed in other works (HORI et al. 2004; TANABE et al. 2006).
After Posamentier (1988), the MxFS and the maximum paleo-water depth in a
sequence should occur at the same time. However, a time gap of about 5.0 kyr between
the MxFS and the maximum paleo-water depth was observed in RRD. The maximum
paleo-water depth and its age were ca. 16 m 8.3 cal. kyr BP at the HT core, ca. 10 m 8.1
92
cal. kyr BP at the CC core, at ca. 18 m 7 cal. kyr BP at the ND-1 core. In addition, the
maximum paleo-water depth was recorded approximately 2–3 kyr later than the time of
the MxFS at the VN site (Fig. 5.2a,b,c). The highest sea level occurred at 6.5 cal. kyr BP,
because accumulation rate was lower than the rate of sea-level rise. Thus, the time gap
between the MxFS and the maximum paleo-water depth depends on both the rate of
sediment accumulation and sea-level rise. The maximum paleo-water depth was reached
after the formation of the MxFS and before the time of the highest sea level (TANABE et
al. 2006). It means that the progradation began during the last phase of sea-level rise 6–7
cal. kyr BP in the RRD. The ages of the maximum paleo-water depth period in different
successions are not synchronous. It depends on the location and the relationship between
sedimentation rate and sea-level rise. Since at distal site the shallow marine was formed
during the rise of sea level at 8.5–6.5 cal. kyr BP mangroves developed in marginal areas
surrounding the river mouth (core HT).
Although there are many questions left about MxFS, by above reasons, MxFS was
established in RRD at 8.5 cal. kyr BP in this work. It is the time representing shallow
marine clays in TB3 core or supratidal flat silt in HT core on coastal zone.
5.2. Systems tracts
5.2.1. Lowstand systems tracts (LST)
Lowstand systems tracts usually consists of the coarse-fraction fluvial sediments
coinciding with the facies change from channel-fill sand (Facies 0.1) to floodplain sandy
silt (Facies 0.2) in HN, HT, TB2 and ND1 cores, having 14C age >11.5 cal. kyr BP - late
Pleistocene . These sediments are not presented in this chapter.
5.2.2. Transgressive systems tract (TST)-Unit 1
Transgressive systems tract consists of retrogradational estuarine sediments in RRD.
Retrogradational parasequence set (RTS) (unit 1-estuarine sediments) consists of 7
sedimentary facies that were described in chapter IV (Tab. 4.1). Transgressive estuarine
sediments are widely distributed and were recognized at 12 sites, excepting only the HV
site. Lagoonal facies are found at inner, landward parts. Because the transgressive
succession at ND-1 site is an upward- coarsening succession from lagoon to flood tidal
delta sediments, the transgressive system is interpreted as an estuarine system with an
estuary-mouth sand body.
93
Detrital composition is characterised by abundant reddish brown clays and silts and
mainly reworked materials of late Pleistocene weathering layers. Gypsum is represented
by small brown of microcrystal grains in tidal flat. It indicates seasonal climate and low
saline water during transgression period. High amount of illite, kaolinite, chlorite,
gibbsite shows good weathering condition in supply source area.
The sediments of unit 1 were created lense shaped with high thickness along central of
older pretrangession time valley. It is a zone where TB3, TB2, TB3 and ND1 cores
located.
Based on the ages of SB and MxFS, TST age is approximately 11.5-8.5 cal. kyr BP.
5.2.3. Highstand systems tract (HST) -Unit 2
High systems tract is characterised by abundant of sedimentary facies and is divided into
four subunits: aggradational-progradational parasequence set (APS); progradational
parasequence set (PPS) and fluvial parasequence set (FPS).
Aggradational-progradational parasequence set (APS): composes 2 facies: shallow
marine clays in TB3, HN, YM cores and tidal influenced channel fill silt in HT core. It
may be included the sediments of aggradational delta in Fig. 4 of TANABE et al. (2005).
This sediment was eroded in TB1, TB2, NV, NB and GA cores, located in recent coastal
zone. In fact, the sediment layers of subunit 2.1 covered all central RRD with thickness of
1-10 m, but a part of these layers was destroyed by tidal, long shore currents and storms,
when sea level was stabilised in long time. New edge of front delta was established. This
stabilization happened 5.5 cal. kyr BP and resulted from a balance between sea level
lowering and sediment supply in the coastal zone during dry season.
This subunit is rich in bivalve, gastropod, benthonic and foraminifera and other fauna,
transparency rose-like twin-crystal or druses fine gypsum and smectite, I/S ml. The AMS 14C age of the subunit is 8.5-6.5 k BP.
Progradational parasequence set (PPS) consists of progradational deltaic sediments
dated at 6.5–0 cal. kyr BP. HST corresponds to the period of falling sea level and the
deltaic sediments were prograded seaward.
During this process, because the temporary stability of sea level mostly caused by climate
alterration, a sub-progradational parasequence set (subset) was formed onlap
(POSAMENTIER et al. 1988). Thus, according to the proof of climate change in South East
Asia e.g. ice core record from Guiliya (THOMPSON et al. 1998), foraminifer record from
94
the South China Sea (YANG and LIN 1996), pollen records from lake sediments in
southeast China (JARVIS 1993) and pollen records from RRD (HAI and HARUYAMA 2004;
LI et al. 2006), the progradational parasequence set can be divided into three subsets by
an architecture of a succession with the time: (1) 6.5-4.0 cal. kyr BP, (2) 4.0-1.5 cal. kyr
BP and (3) 1.5-0.0 cal. kyr BP. Each subset is presented by ordered facies group from
coastal zone to open sea: beach sand tidal flat silt, sand delta front platform sand,
silt delta front lope sandy silt prodelta silty clay shallow sea clay.
Based on the result of radioactive mineral distributions (HOAN 1981) and the paleo
shorelines during the last 5 kyr of TANABE (2006), old shorelines were connected with
seaward clinoform of sequence. The subsets were established during Holocene regression
and created 6 seaward accretion clinoforms. One clinoform is reflecting seasonal cycle of
climate change. Each cycle is started by dry season when were deposited at shoreline
sands rich of heavy minerals at low sedimentation rate and ended by wet season with high
amount of sediment supply and high sedimentation rate. The visible evident is the low
accumulation rate in the beginning of stage (2) of NB core (Fig. 5.2b) from ca. 10 to 20
mm/year at time 4.5-1.5 cal. kyr BP. This will be discussed more detailed in chapter 6.
Fluvial parasequence set (FPS) includes 3 facies located in the top of Holocene
succession and formed during Holocene regression from 6.5 cal.kyr BP to today.
5.3. Discussion
Two systems tracts (TST and HST) with 5 parasequences sets of Holocene sediments
have been subdivided and described. Two systems tracts correspond to the presence of a
cycle of rise and fall of sea level.
The sequence boundary (late Pleistocene –Holocene) in RRD has an age of about 10 cal.
kyr BP in the uppermost part of delta. However, sea level rise effected earlier the recent
delta, at least from 11 cal. kyr BP. It is the same as in other deltas in Asia e.g. Mekong
delta, Changjiang delta (LAP et al. 2000; HORI et al. 2002).
During the first stage of sequence, the TST was formed with the 14C age of 11.5-8.5 cal.
kyr BP. The MxFS has the age of 8.5 cal. kyr BP. The HST occurred in the C14 age of 6.5
cal kyr BP. During the transgression period, the age of deposits becomes younger
landward (from 9.9 Kyr BP in the NB core to 9.3 Kyr BP in the HT core – about 600
years in gap). While in contrary during the sea regression it becomes younger seaward
(from 7.5 Kyr BP in the HT core to 2.6 Kyr BP in the NB core – about 4,900 years in
95
gap).
The first time the connecting with paleoclimate in South East Aisan and old shoreline in
RRD was carried out to build the sub - progradational parasequence set which is related
to the temporary stability of sea level. There are three progradational subsets with the
time: (1) 6.5-4.0 cal. kyr BP, (2) 4.0-1.5 cal. kyr BP and (3) 1.5-0.0 cal. kyr BP.
The analysis of systems tracts and parasequence sets in the sequence stratigraphy showed
the close relation of time (age) and space (facies). Based on this result, the evaluation
about the alteration of components the delta development will be interpreted in the next
chapter.

96

97
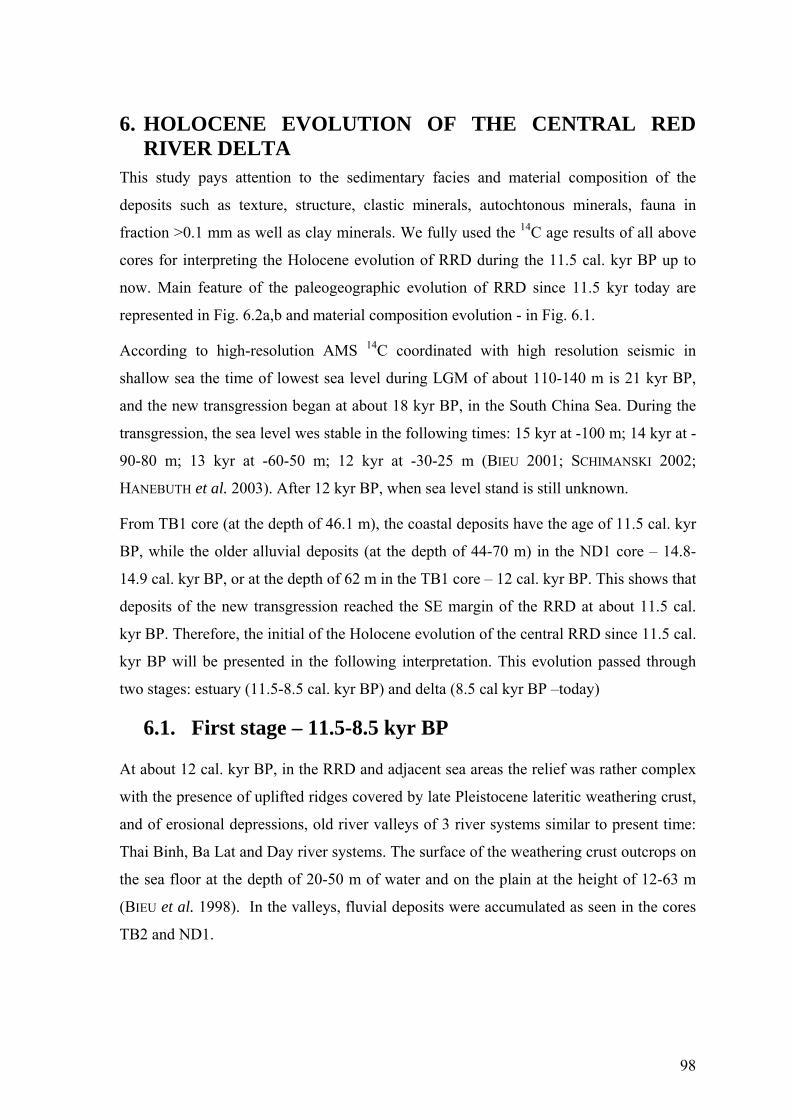
98
6. HOLOCENE EVOLUTION OF THE CENTRAL RED RIVER DELTA
This study pays attention to the sedimentary facies and material composition of the
deposits such as texture, structure, clastic minerals, autochtonous minerals, fauna in
fraction >0.1 mm as well as clay minerals. We fully used the 14C age results of all above
cores for interpreting the Holocene evolution of RRD during the 11.5 cal. kyr BP up to
now. Main feature of the paleogeographic evolution of RRD since 11.5 kyr today are
represented in Fig. 6.2a,b and material composition evolution - in Fig. 6.1.
According to high-resolution AMS 14C coordinated with high resolution seismic in
shallow sea the time of lowest sea level during LGM of about 110-140 m is 21 kyr BP,
and the new transgression began at about 18 kyr BP, in the South China Sea. During the
transgression, the sea level wes stable in the following times: 15 kyr at -100 m; 14 kyr at -
90-80 m; 13 kyr at -60-50 m; 12 kyr at -30-25 m (BIEU 2001; SCHIMANSKI 2002;
HANEBUTH et al. 2003). After 12 kyr BP, when sea level stand is still unknown.
From TB1 core (at the depth of 46.1 m), the coastal deposits have the age of 11.5 cal. kyr
BP, while the older alluvial deposits (at the depth of 44-70 m) in the ND1 core – 14.8-
14.9 cal. kyr BP, or at the depth of 62 m in the TB1 core – 12 cal. kyr BP. This shows that
deposits of the new transgression reached the SE margin of the RRD at about 11.5 cal.
kyr BP. Therefore, the initial of the Holocene evolution of the central RRD since 11.5 cal.
kyr BP will be presented in the following interpretation. This evolution passed through
two stages: estuary (11.5-8.5 cal. kyr BP) and delta (8.5 cal kyr BP –today)
6.1. First stage – 11.5-8.5 kyr BP
At about 12 cal. kyr BP, in the RRD and adjacent sea areas the relief was rather complex
with the presence of uplifted ridges covered by late Pleistocene lateritic weathering crust,
and of erosional depressions, old river valleys of 3 river systems similar to present time:
Thai Binh, Ba Lat and Day river systems. The surface of the weathering crust outcrops on
the sea floor at the depth of 20-50 m of water and on the plain at the height of 12-63 m
(BIEU et al. 1998). In the valleys, fluvial deposits were accumulated as seen in the cores
TB2 and ND1.

99
Fig. 6.1 The evolution of Holocene minerals, fauna composition in central RRD

100
After a stand at the depth of -25 m of present water during 12 cal. kyr BP, the sea level
continued to rise and penetrated into the land. The initial phase of the estuarine stage
differed from land to sea about 2 kyr which is from TB2 core (depth of 64 m) to 8.3 cal.
kyr BP in HT core (depth of 16 m) and 9.8 cal. kyr BP at HN core (depth of 33 m) with a
distance of 167 km and a thickness of ~13 m. The sedimentary facies of the estuarine
stage have younger ages towards N-NW of the RRD during the sea transgression.
The sedimentary facies formed during this time included: tidal channel flood tidal
delta lagoon salt marsh tidal flat estuary. They thickness depended on a late
Pleistocene rielef which shown in Fig. 6.2.
The structure of deposits of this stage is relatively simple, changing from slightly cross-
bedding in tidal-flood deposits, cross-bedding in tidal flat deposits to parallel, massive of
silt. They dominate with the brownish, reddish-brown colour and locally plant or peat
with the greyish, grey colours. The sediment has medium to well-sorting, and the curve of
grain size distribution is mostly monomodal and symmtrical.
Fractions >0.1 mm (usually smaller than 10%) are poor of mica, content of quartz is
increasing. In-situ minerals included fine-fraction, dark-brown, microcrystalline gypsum.
They had crystial shape or well rounded crystal, opaque or transparency. Like mentioned
above, in intertidal flat, where the salinity is high with the monsoon climate, gypsum was
formed. They are widely distributed in tidal deposits and estuarine deposits in low part of
TB3, TB1 and TB2. In addition, there is only one group of dark green colour and good
crystals in HT core. Also in this core siderite had been met with some pyrite patches that
could be of diagenic origin in lagoonal deposits. In the last period of estuary bivalves,
some gastropods and hyaline foraminifera were observed (Fig. 6.1).
In clay-size fraction, kaolinite, gibbsite, chlorite were enriched in the beginning and
decreased upward, nevertheless but illte was stable. Smectite and I/S ml appear in the end
of transgression. This indicates that sediments original from good chemical wethearing
redeposited material in warm climate, but in following time the content of chlorite,
kaolinite, gibssite was descreased and smectite, I/S ml appeared, because the climate
changed to dry season and supply source was limited.
In short, the deposits in estuarine stage were formed in the littoral zone, near estuary,
where in-situ decomposed materials play an important role. The sea level rapidly raised
with the accumulation rate reaching 13 mm/yr and decrease to 7-8 mm/yr after. The

101
climate of the stage was warm/wet in the beginning and after that dyer. It also observe in
pollen result with a slight cool/dry between 9.5 and 8.5 cal. kyr BP (LI et al. 2006). That
Holocene transgression sediment was established in one seasonal climate cycle
(warm/wet to cool/dry).
6.2. Second stage – 8.5-0 kyr BP
This stage is divided into 2 substages: A - shallow marine (8.5-6.5 cal. kyr BP) and B -
delta and fluvial (6.5 cal. BP to present)
A. Substage – shallow marine (8.5-6.5 cal. kyr BP)
TANABE et al. (2005) suggest that the flooding happened at 9 cal. Kyr BP instead of 6 cal.
kyr BP as observed by some other studies (TOAN 2004; LAM 2005). The 14C ages show
the estuarine deposits reached the south area of Hanoi City, possibly up to the present
basin of the Duong River (HAI and HARUYAMA 2004) from 8.5 cal. kyr BP. When
reaching the highest level, the sea level was stable for a short time. Therefore, there are
wave-cut notches left in the foot of limestone cliff of many limestone mountains in the Ha
Long Bay and Ninh Binh Province or plantation surfaces on loose pre-Holocene
terrigenous sediments at the present elevation of 5-5.5 m (BOYD and LAM 2004). The
initial point of sea regression is marked by the diminution of Rhizophora plant in
mangrove forest at about 6.6 cal. kyr BP (HAI and HARUYAMA 2004). Therefore, this
stage could correspond to the time of 8.5-6.5 cal. kyr BP.
During the time of stabled sea level, nearshore shallow-sea deposits were formed (facies
2.1) in areas of above 20 m of water depth, such as in TB3 and ND1 cores (?). That was
later covered by prodelta deposits. In the nearshore zone was developed subtidal flat and
such as in HT, and locally peat was formed, such as in HT core and HN.
Deposits of the substage occur only in TB3 core (at the depth of 27.5-29 m) and ND1
core (?) (at the depth of 17-18 m) with the thickness of 3-5 m and the main composition
are grey-brownish, grey-bluish biotubation clay. The curve of grain-size distribution is
monomodal (after eliminating organic debris) and the grain sorting is rather good.
The sediment very rich of organic assemblages of bivalves, gastropods, thin-shelled
benthonic foraminifera, echinoids in well preserved (0.6-10 %). Lagoonal deposits in the
HT core contain thin-shelled bivalves. Gypsum was absent in sand-size fraction but clay-
size fraction, it is still obseved in this facies at the start of substage and found both in
coarse and clay fraction. Sandy-size gypsum usually presented as “rose form” or druse

102
with yellow or non color, formed in tidal zone under influence of cool/dry climate in the
end of Holocene transgression with low rate of deposition and was in later due to higher
rainfall (warm/wet climate) destroyed, or transported to deltaic zone.
In clay-size fraction, the quantity of smectite, I/S ml increase in estuarine deposits, but
illite, gibbsite decreaed; the I/S ml are similar to the description of facies 2.1 in the
chapter IV. The ratio of s/(s+i+k+c) is highest, reaching 0.07-0.1. This proves that there is
a change in supplying source of accumulated materials. High amount of smectite shows
low accumulation rate and marine environment (HEROY et al. 2003).
Therefore, since the sea reached the highest level to its regression, prolonging in an
interval of 2 kyr, the rate of deposit accumulation was rather low, reaching about 4
mm/year (TANABE et al. 2006). Therefore, this viewpoint differs from previous ones, that
the age of the highest sea flood level is also that of the boundary between TST and HST,
or between sea transgression and regression (VAN WAGONER et al. 1988). It was
concluded that the described deposits were the junction between the lower part consisting
of aggradational deposits and the upper part – progradational regressive ones; they were
accumulated in the marine environment of moderate salinity that created good conditions
for the development of fauna, smectite. This substage is characterised by cool influence
climate cool in the beginning and subsequent warm tropical climate with monsoon
wetland components (LI et al. 2006).
B. Substage (6.5-0.0 cal. kyr BP)
This stage includes delta and fluvial sediment. During regression, the sea level fall and
stablelized during a certain time interval. Like mentioned in chapter 5, this substage has
been subdivided into 3 periods (B1)- 6.5-4.0 cal. kyr BP; (B2) 4.0-1.5 cal. kyr BP and
(B3) 1.5 cal. kyr BP - today.
B1. Period (6.5-4.0 cal. kyr BP)
This period started when the mangrove forest began to be degraded until the Rhizophora
family was extincted (4.5 cal. kyr BP). There were at least two times of sea level breaks.
The first one took place in 5.5 cal. kyr BP and the second – at the end of this substage (4
cal. Kyr BP). Two progradational clinoforms have established during this time.
The deposits of this substage occured in the ND1 (at the depth of 16-5.3 m) and TB3 (at
the depth of 27.5-0 m) cores with the following facies: prodelta delta front slope
delta front platform tidal flat beach, as described in the chapter IV. This is the first
103
sea invasion wedge.
The structure of sediments changed in time from parallel bedding (prodelta) to convoluted
(delta front slope), cross bedding or laminated (delta front platform) and trough cross
bedding, interlayer sand and silt accompanied by plant debris, traces of root (tidal flat).
The grain size and bad sorting degree have the tendency of increasing; the curve of grain
size distribution changes from the type of one peak to two peaks in ascending order on the
section and from the sea toward the shore.
The content of fraction >0.1 mm was increasing (1.2-75 %) and rich feldspar, rock
fragments. Gypsum was enriched both in coarse and clay-size fractions. Most of them is
type (2) which were transferred and erosion a part in coarse fraction. It is related with a
deposit location far from the supply source. In the TB3 core, the delta front platform
deposits contain nearshore fauna assemblage of the wave zone, among this there are many
agglutinated foraminifera.
Among the clay-size fraction, smectite and I/S ml occur at the same place with fauna
assemblage. Their contents decrease upward and disappear in the next part. Illite, chlorite
kaolinite, and gibbsite have the content increasing upward.
In brief, during this substage the depositional materials transported into the basin were of
great quantity, with the poorer maturity. A monsoon climte with long dry period was
dominated in the beginning. After that the rainfall gradually increased and the
temperature lowered and gypsum disapeared. Evidence of warm/dry-wet climate in the
start and cool/wet climate at the end of this period (LI et al. 2006) once more was
detected.
B2. Period (4.0-1.5 cal. kyr BP)
This period started with appearance of assemblages of marine organisms and ended when
the mangrove vegetation considerably diminished, brackish- and brackish - fresh-water
algae domination and the high content of illite, chlorite in the TB1 and TB2 cores. The
sea level was stable in a time interval of about 4.4-3.5 cal. kyr BP (at the depth of 27.5-
22.5 m in the HV core) or 3.9-3.3 cal. kyr BP (at the depth of 34-29 m in NB core), 3.9
cal. kyr BP (at the depth of 30.5 m in TB1 core; 40.3-34 m in TB2 core). It shows a slow
rate of accumulation with good conditions for the development of a marine organism
assemblage. This time of “stable sea level” previously has been interpreted as the second
sea transgression during Holocene, forming the Thai Binh Formation.

104
The deposits formed third progradational clinoforms during this period (at the depth of
34.5-26.3 in the core TB1; 40.2-29.2 m in the core TB2; 27.5-20 m in the core HV)
consist mainly of grey, grey-bluish, locally brownish clay and silt, belonging to the
shallow-sea facies, similar to facies 2.1, and the facies: prodelta delta front slope
delta front platform tidal flat beach, as described in the Chapter IV (second sea-
invasion wedge).
The time of “stable sea level” at the end of this period created conditions for the
differentiation of littoral deposits by weight and grain grade, especially tidal flat sand,
forming placers of heavy minerals, such as ilmenite, zircon, rutile, monazite, as in the
uppermost part of the TB3 core. Due to the presence of radioactive minerals, such as
monazite, zircon, placer bodies create radioactive anomalies. They have been discovered
long ago with 4 zones (HOAN 1981).
During this period, crystalline, twinned or rose-like druse, uncoloured or pinkish gypsum
was developed in the low part of TB1 core when cool/dry climate developed. After this
time the condition for gypsum accumulation was not favourable. The second placer band
in the RRD was formed during about 1.5 cal. kyr BP. Especially, an abundant in taxons
and quantity assemblage of organisms occurs, including bivalves (0.1-3%), gastropods
(0.1-1%), hyaline foraminifera (0.1-1%), agglutinated foraminifera (0.3%),
dinoflagellates, echinoids, sponges, echinozoans (0.4%) and their quantity gradually
diminished in time.
During this period, the content of quartz, feldspar and limonite concretions gradually
diminished in time. The content of illite, chlorte (assemblage 4) was very high.
This period had cool/dry climate condition at the beginning with a medium degree of
evaporation; later, following warm/dry conditions the rainfall increased, the sediment
supply increased, forming sedimentary wedges gradually invading into the sea. The
cool/wet climate was recognised in the end of the period. For this period the climate
development followed cycles with the time:4.53-2.29 kyr BP and 2.29-1.5 kyr BP,
because from 4.0 to 3.5 kyr BP gypsum has low amount and two deltaic clinoform
established.
From 2.5 to 1.5 cal. kyr BP the beginning of fourth progradational clinoforms is
presented above and its end was marked by the sudden diminution of chlorite content in
the TB1 (at the depth of 29.2-16 m) and TB2 (at the depth 20-14.5 m) cores. Two “stable
sea level” took place at about 2.5 cal. kyr BP and 1.5 cal. kyr BP. In each sea-invading

105
wedge, in the direction from the sea shoreward there are the lithological facies similar to
the previous substages: prodelta delta front slope delta front platform tidal flat
beach.
The third and fourth wedges (since the sea regression) correspond to the depth in the TB1
core as 29.2-16 m and 16-0 m, in the TB2 core – 30-25 m and 25-15 m (Fig. 5.2b,c).
During this period, the content of quartz, feldspar, mica, rock fragments and many
chromatic minerals, such as illite, chlorite increased in the beginning part, then decreased
again. There are some shell fragments of bivalves and foraminiferas. During the time of
“stable sea level”, placer bodies were formed and integrated into the second and third
radioactive anomaly zones (Fig. 5.1).
The content of illite strongly increases, while other clay minerals clearly decrease
compared with previous substages. The content of smectite is modest. The above
explained clay mineral association in NH core during the time of 1.5 cal. kyr BP is caused
by the change in supply source to the RRD.
This mineral association shows that previously chemical weathering products dominated,
then at this time physical weathering products played an important role; the vegetation
cover was less developed.
B3. Period (1.5 cal. kyr BP – today)
This is the last developing period of the present RRD, that begun since the time when in
the nearshore deposits the illite content increased, while the chlorite content strongly
decreased. Two clinoforms have established during this time with the age: 1.5-0.7 cal.kyr
BP and 0.7 cal.kyr BP-today.
Deposits in the TB2 (at the depth of 15-0 m), NV (at the depth 10-0 m), GA (20-0 m) and
NH (22.2-0 m) cores consist mainly of silt, fine-grained sand, and near the sea, of clay,
that are characterized by polymictic composition: beside quartz and feldspar sand fraction
still contains many small fragments of rocks distributed along the Red River sides. They
form present placers, such as in Con Den (Thai Binh Province), Ha Lan, Hai Hau (Nam
Dinh Province), along the two sides of the Day River.
Beside the above described characteristics, in the uppermost part of the TB2 core there is
rather much gibbsite, while in the NH core are high content of chlorite, poor-ordered
illite, gibbsite and kaolinite (NIEDERMEYER 2001). This deposits were formed in the hot-
humid climate conditions similar to the present ones, in the sea-increase tendency with

106
human impacts, such as embankment along rivers and seashore, embankment seaward
and destruction, then restoration of mangrove forests. The sediment had very high
accumulation rate 12-20 mm/yr (Fig. 6.5). In addition, a warming trend climate from 1.5
to 0.6 cal. kyr BP with a change to dry conditions at 0.8 cal. kyr BP; and a last cool period
during 0.6 –0.13 cal.kyr BP, which was dry at 360 cal. yr BP but then changed into the
present warm and wet climate (LI et al. 2006). That half climate cycle (warm/cool and
warm) can be established.
The regression has created good conditions for river activity. The stages of river activity
in time can be divided into 3 types: funnel-shaped (9-6 cal. kyr BP) straight (6-2 cal.
kyr BP) lobate (2-0 cal. kyr BP) with the rate changing from 4 m/yr to 24 m/yr. During
the last stage, there was condition to form 3 lobes (TANABE et al. 2006), but not many
lobes, as the viewpoint of LAM (2005). The change of sedimentary composition caused by
rivers during last 6.6 kyr can be similar to that presented above, but this work has not
conditions for detailed study on.
Tectonic
From the beginning, late Pleistocene erosion valley was described in Fig. 6.2a with two
the uplift blocks. In early Holocene (11-8 kyr BP), the sediment mostly accumulated in
the SW of RRD with the accumulation rates was 13.5 mm/year which larger than in other
side (2.5 mm/year) (Fig. 6.4). The rising sedimentary discharge in T2 can be caused by
the old valley in late Pleistocene. In the middle of Holocene (8-4 kyr BP) the
accumulation rate in two profiles is either small because the highstand of sea level. After
4 kyr BP, the subsidence of sediment in T1 is faster than T2 with higher accumulation
rate (Fig. 6.4) and richer silt, clay sediments of deltaic facies (prodelta, delta front) and
shallow marine facies. It prove that block between Chay River and Vinh Ninh fault are
the most subsidence in late Holocene. Also in late Holocene, the sedimentary discharge to
inland (YM, HN) is much smaller at than in coastal area (TB1, TB2). It is the results of a
rising of subsided rate by sedimentary thickness of blocks from land to sea.
More over, from 1.5 kyr BP up to now, the accumulation rate increased rapidly from 4.7
to 12.0 mm/yr. Especially, in the T1 profile (recent river mouth) it is 19.0 mm/yr while
5.6 mm/yr in the T2 profile (inside of dyke). It is evidences of the human impacted time,
especially after dyke system was build along the Red River.
Thus, the activities of tectonic in Holocene of RRD is visible and presented by difference
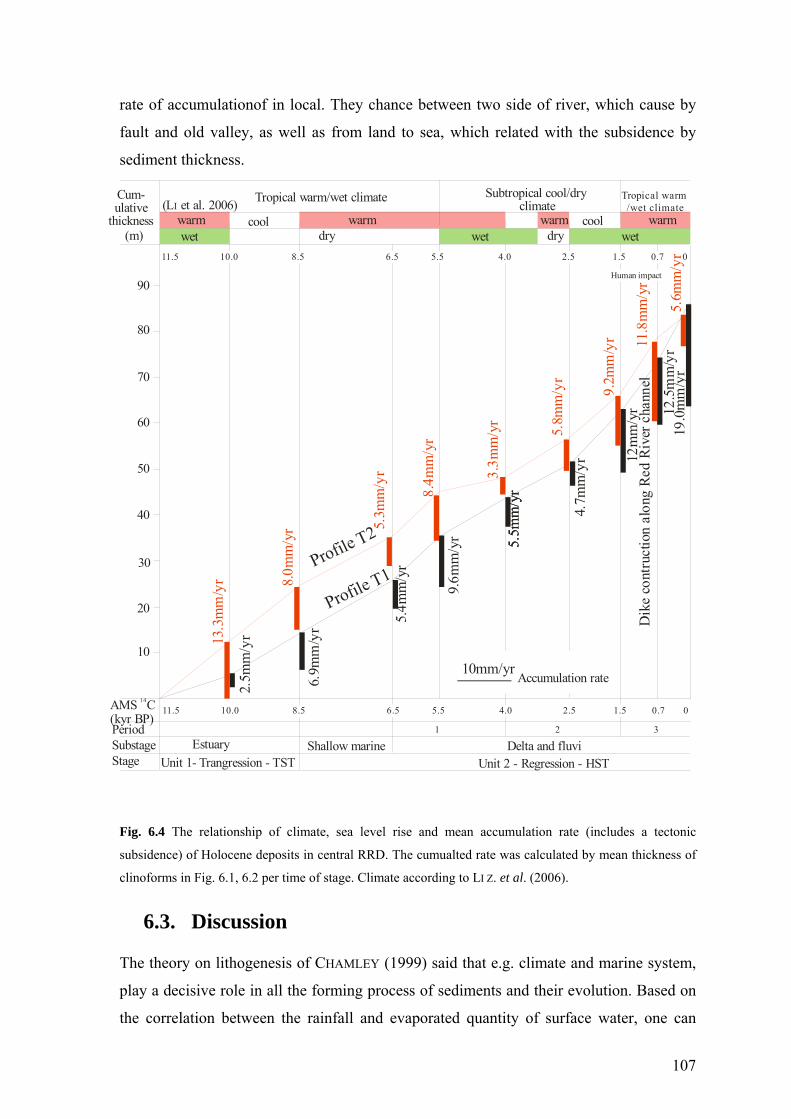
107
rate of accumulationof in local. They chance between two side of river, which cause by
fault and old valley, as well as from land to sea, which related with the subsidence by
sediment thickness.
Fig. 6.4 The relationship of climate, sea level rise and mean accumulation rate (includes a tectonic
subsidence) of Holocene deposits in central RRD. The cumualted rate was calculated by mean thickness of
clinoforms in Fig. 6.1, 6.2 per time of stage. Climate according to LI Z. et al. (2006).
6.3. Discussion
The theory on lithogenesis of CHAMLEY (1999) said that e.g. climate and marine system,
play a decisive role in all the forming process of sediments and their evolution. Based on
the correlation between the rainfall and evaporated quantity of surface water, one can
Human impact90
80
70
60
50
40
30
20
10
Shallow marine Delta and fluviEstuaryUnit 1- Trangression - TST Unit 2 - Regression - HST
SubstageStage
Period
AMS C(kyr BP)
14
11.5 10.0 8.5 6.5 5.5 4.0 2.5 1.5 0.7 0
1 2 3
2.5m
m/y
r
9.6m
m/y
r 5.5m
m/y
r
4.7m
m/y
r 12m
m/y
r
Profile T2
Profile T1
19.0
mm
/yr
12.5
mm
/yr
Dik
e co
ntru
ctio
n al
ong
Red
Rive
r cha
nnel
10mm/yrAccumulation rate
Cum-ulative
thickness (m)
Subtropical cool/dry climate
11.5 10.0 8.5 6.5 5.5 4.0 2.5 1.5 0.7 0
Tropical warm/wet climate Tropical warm/wet climate
warm coolwet dry drywet
warm cool warm warmwet
5.5m
m/y
r
6.9m
m/y
r
5.4m
m/y
r
13.3
mm
/yr 8.
0mm
/yr 5.
3mm
/yr 3.
3mm
/yr
5.8m
m/y
r
9.2m
m/y
r
5.6m
m/y
r
11.8
mm
/yr
8.4m
m/y
r
( et al. 2006)IL

108
distinguish at least two basic lithogenetic regions: humic (warm/wet) and arid (cool/dry).
However, a humid region having varried of monsoon type as in the RRD is not yet
studied in details.
First of all, many researchers have concluded the evolution history of sediments in the
RRD depends on transgression and regression during the last 15 kyr (NGHI et al. 2002;
TOAN 2004; LAM 2005; TANABE et al. 2006). Some recent results of 14Cage analysis of
bivalve shells at the depth of -30 m in shallow sea gave the values of 10-13 kyr (data from
the Symposium of the Project 09.17 in 2004). To combine with 14C age of the TB1
reveals that, about 11.5 cal. kyr BP is the time the seawater begun to invade recent delta.
Since then, the processes of transgression and regression controlled the formation of
lithological facies, creating 17 different ones (LAM 2005).
On the Fig. 4.4 (TANABE et al. 2006) present the changes of climate of regional character,
and from 11.5 kyr BP to present, according to glacial pillars in Tibet and planktonic
foraminiferas. There was only one cold wave taking place in 4.1-2.8 Kyr BP, while
according to spores and pollen the hot and cool seasons changed. In addition, according to
investigation of sediments from volcanic lakes in Cambodia (TANABE et al. 2006) the
period of 6.3-4.0 kyr BP was a dry and hot one, as before that the climate bears the
summer monsoon character, and after that the climate strongly changed to cool/dry. The
data presented in the first part of this chapter showed a conforming. That means, from
11.5 to 6.5 cal. kyr BP the climate was warm/wet, a slight cooling stage: 9.3- 8.5 cal. yr
BP and from 6.5 cal. kyr BP to 1.5 cal. kyr BP the climate was cool/dry, with cycles of
intercalation between wetter and dryer seasons. Then, about 1.5 cal. kyr BP to present the
climate becomes warm/wet again.
The formation of sea-invasion wedges associated with dry and wet periods. During the
dry season, the transport of materials to the sea is limited. In the shore zone, the wave and
tidal currents are stronger than river flow causing the unbalanced litho-hydrodynamic and
the destruction of nearshore deposits. The newly transported materials form bars and sand
dunes on the shoreline. After that the the shoreline is eroded in season of rain. During
regression with seasonal precipitation, when the rain is heavy, the destruction force in the
material-supply areas becomes strong and rainy water is capable of transporting much
alluvial to the RRD, and so, the plains gradually invades into the sea. These processes
take place on the background of sea regression with dry and wet regional climate
(REINECK 1972).
109
The change of climate described above directly influenced also to materials accumulated
in the RRD. From 11.5 to 6.5 cal kyr BP and 1.5 cal kyr BP to present, the high monsoon
activity climate leached the accumulated products have high maturity: oligomictic clastic
composition, rich in kaolinite, and gibbsite, developed mangrove vegetation. During the
time interval of 6.5-1.5 kyr BP, due to the cold/wet climate, illite, chlorite, kaolinite
dominated.
Shallow-sea organisms were abundant, accompanied by smectite, I/S ml that were developed
in the period when the climate was warm/dry and the accumulation rate was slow.
The tectonic movement in Holocene was characterised by block subsided movement with
different velocities. It has influence to the sediment discharge, accumulation rate (NGOI
2000; LAM 2005).
To compare the Holocene evolution with other location, Mekong delta and Changjiang
were chosen. In the South of Vietnam the former coastlines were mainly marked in the
four periods of 6-5; 4.5; 4-3 and 3-2 kyr BP in Mekong delta (LAP et al. 2000). Last
studies for this delta shows similar Holocene evolution as RRD (SAITO et al. 2004).
The evolution of the Changjiang delta for the last 8 kyr was developed in a funnel shaped
bay. The delta mainly consisted of an aggradational system while sea level was rising
from 8 to 6 kyr BP and aggradational system under the stable sea level of the last 6 kyr.
The progradational delta changed from a bayhead type delta into a delta facing a shallow
shelf, around 2 kyr BP. The evolution of distributary channels and related river-mouth
sand bars is a key process of delta migration or progradation (HORI et al. 2002). Thus, a
transgression in this delta began later than in RRD 3.5 kyr.
In short, based on lithological facies and 14C dating the Holocene evolution in the RRD
has been approached by main features. General interpretation can be set as follows:
1) Holocene deposits in the central RRD have been passing through 2 evolutionary
stages: firstly, estuarine stage (11.5-8.5 cal. kyr BP), and the secondly, aggradational -
progradational stage (8.5 cal kyr BP- today). The last stage was passed aggradational-
progradational (8.5-6.5 cal. kyr BP), progradational (deltaic and alluvial sediments) stages
(6.6-0 cal. kyr BP) . The deltaic stage comprises 4 substages, forming 6 sea-invading
wedges: first (6.6-4.0 cal. kyr BP), second (4.0-1.5 cal. kyr BP), and third (1,5 cal. kyr BP
- present). Each invading wedge was formed in a time interval of about 1,000 year,
expressing a cycle of heavy rainy season and dry season during the sea regression

110
process.
2) The source of material supply to the RRD during Holocene changed: at the
beginning (transgression period) abundant in autochthonous material, during warm and
hot climate, had high degree of chemical weathering. Later (regression period) materials
mainly transported from surrounding mountainous areas and from the NW region during
cool and dry climate, therefore, their maturity is still low, suffering mainly physico-
mechanical weathering;
3) The evolution of Holocene deposits is controlled mainly by sesonal climate on
the background of sea transgression and regression with 6 times of sea level temporary
were stabled, forming sea-invading wedges and deltaic lobes. The tectonic role expresses
mosly in the subsidence with diffirence accumulation rate. The subsidence was caused
bythe increase of thickness in favourable areas for the deposition, such as in old valleys
and in front of river mouths.

111
Fig. 6.2 Paleogeographic maps illutraiting the evolution of RRD during the past 8.5 kyr BP (modified after
Tanabe, 2005)

112
7. CONCLUSIONS
Analysis of the lithology, mineralogy, stratigraphy of six cores in RRD allows an
understanding of Holocene sediments evolutional process and depositing condition
reflecting changing climate and sea level.
1- Holocene sediments in central RRD is characterised by monotone reddish brown
colour and unconsolidated silt and clay. Therefore, a complex of modern and traditional
methods was used in this study: detailed core description in field, X-ray radiograph, laser
diffraction grain size analysis, detrital and in-situ minerals, fauna, plant applied in >0.1
mm fraction under microscopy, X-ray diffraction applied in <2 µm fraction and ASM 14C
age. By used data were recognised detailed characteristics of sedimentary types and could
be evaluated their evolution. This complex of method should be applied for
unconsolidated sediments in other areas as RRD, too.
2- Sedimentary facies of investigated area are classified into 2 units which resemble
to one of transgression and one of regression. First unit includes trangressive facies as
tidal influenced channel fill sandy silt, supratidal marsh silt, lagoonal silt, flooding tidal
delta sand, tidal flat sand and silt, intertidal silt and estuarine silt. Second unit is
composed of facies: shallow marine silt, tidal influenced channel fill silt and regressive
deltaic and fluvial facies like prodelta silty clay, delta front slope silt, delta front platform
sandy silt, distributary lobe silty sand, intertidal flat silt and sand, swamp clayey silt, tidal
and beach sandy silt, and fluvial facies channel infill sand, flood plain silt and clay and
lake clay and silt.
3 - Evaporited gypsum is the mineral easy to be formed in coastal environment,
such as tidal flat, salt marsh, in monsoon dry season. It is a good index for distinguishing
the deposits formed in dry season of monsoon regions. Based on the shape, size and
content of gypsum in sucsession the climate from 10.5 cal. kyr BP to day can be divided
into four long dry - wet climate cycles with the time: 10.5- 8.5 cal kyr BP, 8.5- 4.0 cal
kyr BP, 4.0- 1.5 cal kyr BP and 1.5 cal kyr BP – today.

113
4 - Clay-size minerals in Holocene deposits on the central RRD are multi-
assemblage. Apart from main minerals as quartz and feldspar, illite, kaolinite, chlorite,
there is the presence of smectite, I/S ml as well as gibbsite, gypsum. It can be divided into
four clay-size mineral assemblages: gibbsite-kaolinite, smectite, smectite-I/S ml-kaolinite,
and illite-chlorite. The illite dominates in Holocene sediments. From the dominant of
assemblages in each period, the supply source material, transporting process and
monsoon climate were interpreted. The distribution of clay-size minerals in unit 2
(regression time) veries, because of during their formation the supply source was strong
changed resulting in a climate variation (warm/dry or wet and cool/dry or wet seasonal).
Among them smectite is good index for shallow sea environment which mostly related
with the transference and low accumulation, kaolinite-gibbsite is an indicator of strong
chemical wethearing supply source in transgression start and recent time.
5- Since 11.5 cal. kyr BP, a sequence stratigraphy of Holocene sediments in central
RRD includes: transgressive systems tract - retrogradational parasequence set (RTS)
(11.5-8.5 cal. kyr BP) - unit 1 (estuarine sediments) and highstand systems tract (HST) -
unit 2 with aggradational-progradational parasequence set (ATS) (8.5-6.5 cal. kyr BP)
and progradational parasequence set (PRS) (6.5 cal. kyr BP-today). In particular, for the
first time an aggradational-progradational parasequence set is described for RRD
research in this study.
The progradational parasequence set in RRD area can be divided into three subsets based
on the architecture of a succession with time: 6.5-4.0 cal. kyr BP, 4.0-1.5 cal. kyr BP, and
1.5-0.0 cal. kyr BP. Each subset is characterised in ordered of group of facies from
coastal zone to sea i.e. beach sand tidal flat silt, sand delta front platform sand,
silt delta front lope sandy silt prodelta clay shallow sea clay. A boundary of these
subsets was differentiated by detrital, in-situ and clay-size mineral assemblages and fauna
complexes. AMS 14C data are very important for linking the same-age boundaries.
6- The Holocene evolution of RRD is controlled mainly by Holocene transgression
and regression as well as monsoon climate. In transgression, the source of material
included abundant autochtonous components that had high degree of chemical weathering
and deposit during warm/dry and wet climate. Later, in regression period materials were
mainly transported from surrounding mountains and NW region during 3 warm/dry or
wet - cool/dry or wet big climate cycles. Therefore, they had low maturity, and mainly
suffered physico-mechanical weathering. The climate cycle is represented not only in

114
detrital supply sources but also in the formation of authigenic minerals as gypsum and
neoformed clay minerals. Here a point of periodical climate role in the sedimentary
formation in monsoon deltas have been emphasized.
7- Tectonic activity had influence on accumulation rate and volume of sediment in
RRD. By calculating the accumulate rate in two side of recent river form land to sea, it
can be concluded the change of supply source (may be a change of river current),
increased sedimentary thickness depends mostly on subsidence. Furthermore, human
impact- dyke build along the Red River in model time led to the high accumulation rate in
front of river mouth.
Thus, there are some following tasks were high recommened to the future study about
evolution of RRD.
- Analysis of more samples in other detla to fully describe behaviour of gypsum in soft
sediments; especially in monsoon area.
- It is need detailed study new profiles along recent coastal zone- from Thai Binh to Hai
Hau and Kim Son and mineralogical terms of cores in profile T2 and 14C dating to answer
the following question:
How many sea level rise cycles exited in RRD?
Because some reports claimed two cycles but in this work and other newest research
mentioned only one times of transgression (LAM 2003; TANABE et al. 2006).
- Extention the studied area in whole RRD to reconstruct the relationship of climate,
supply source materials, tectonic, litho-hydro dynamic during sea level rise base on high
resolution study of pollen, spore and fauna and the formation and distribution of
authigenic minerals, especially gypsum and neoformed clay minerals.
115
REFERENCE
Berner, R. A. (1981). A new geochemical classification of sedimentary environments. Journal of Sedimentary Petrology 51(2): 359-365.
Bieu, N., et. al. (2001). Geology and mineral resources on nearshore shallow sea(0-30m water depth) of Vietnam. Servey and mapping at scale 1:500 000(1991-2001). Research and survey in nearshore (0-30m water depth) in Ngason-Haiphong, Vietnam. Hanoi, Department of Geology and Minerals of Vietnam.
Bieu, N., L. T. Phuc, N. C. Hoat, H. V. Thuc, L. V. Hoc and N. T. Cuong (1998). Late Pleistocen weathering surface in Red River delta. Journal of Geology, Vietnam 249: 9-16.
Bieu, N., H. V. Thuc and T. T. Minh (1999). Early Holocene sediments in nearshore of Vietnam (0-30m water depth). Marine conference, Hanoi, Vietnam.
Biscaye, P. E. (1965). Mineralogy and sedimentation of recent deep-sea clay in the Atlantic Ocean and adjacent seas and oceans. Geol. Soc. Am. Bull 76: 803-832.
Boyd, R., J. Suter and S. Penland (1989). Relation of sequence stratigraphy to modern sedimentary environments. Geology 17(10): 926-929.
Boyd, W. E. and D. D. Lam (2004). Holocene elevated sea levels on the north coast of Vietnam. Australian Geographical Studies 12(1): 77-88.
Chamley, H. (1989). Clay Sedimentology. Berlin, Springer.
Chamley, H. (1990). Sedimentology. Berlin, Springer.
Chuong, V. D. (1991). Basin structure pre-Kainozoi in Ha Noi. Geological Journal (Vietnamese) A(202-203): 11-16.
Coleman, J. M. (1981). Deltas: Processes of deposition and models for exploration. Burgess, Minneapolis.
Elliott, T. (1986). Sedimentary environments and facies. Oxford, Blackwell.
Ely, L. L., Y. Enzel, V. R. Baker, V. S. Kale and S. Mishra (1996). Changes in the magnitude and frequency of Holocene monsoon floods on the Narmada River, Central India. Geological Society of America Bulletin(108): 1134-1148.
Enzel, Y., L. L. Ely, S. Mishra, R. Ramesh, R. Amit, B. Lazar, S. Rajaguru, B. .N. and S. V.R. (1999). High-resolution Holocene environmental changes in the Thar Desert, northwestern India. Science 284: 125-128.
Eshel, G., G. J. Levy, U. Mingelgrin and M. J. Singer (2004). Critical Evaluation of the Use of Laser Diffraction for Particle-Size Distribution Analysis. Soil Science Society America Journal 68(3): 736-743.
Galloway, W. E. (1989). Genetic stratigraphic sequences in basin analysis 1: Architecture and genesis of flooding-surface bounded depositional units. American Association of Petroleum Geologists Bulletin 73(2): 125-142.
Gibbs, R. J. (1977). Clay mineral segregation in the marine environment. J. Sediment. Petrol 47: 237-243.
Goodbred, S. L. (2003). Response of the Ganges dispersal system to climate change: a source-to-sink view since the last interstade. Sedimentary Geology 162: 83-104.

116
Goodbred, S. L. and S. A. Kuehlb (2000). The significance of large sediment supply, active tectonism, and eustasy on margin sequence development: Late Quaternary stratigraphy and evolution of the Ganges–Brahmaputra delta. Sedimentary Geology 133: 227–248.
Grothe, S. (2003). Zur holozänen Entwicklung des Red River Delta (Vietnam). Geografisches Institut, Greifswald, Ernst Moritz Arndt Universität Greifswald.
Grothe, S., R. Lampe, J. Kasbohm, M. T. Nhuan and a. N. T. (2005). Late quaternary environmental changes in the song hong delta (Red River delta) (Vietnam) indicated by clay mineral distribution xrd and TEM-EDX investigations on the Nam Phu core. International Conference on deltas (Mekong venue): geological modeling and management, Ho Chi Minh City, Vietnam.
Hai, P. V. and S. Haruyama (2004). Palaeontological data in Holocene evolution of the Red River delta. Stratigraphy of Quaternary system in deltas of Vietnam, Hanoi, Vietnam, Department of Geology and Minerals of Vietnam.
Hamblin, W. M. and Kenneth (1962). X-ray radiography in the study of structures in homogeneous sediments. Journal of Sedimentary Research 32(2): 201-210.
Hanebuth, Till J.J., Y. Saito, S. Tanabe, Lan V.Q and Q. N. Toan (2006). Sea levels during late marine isotope stage 3 (or older?) reported from the Red River delta (northern Vietnam) and adjacent regions. Quaternary International 145-146: 119-134.
Hanebuth, T. J. J., K. Stattegger, A. Schimanski, T. Ludmann and H. Wong (2003). Late Pleistocene forced-regressive deposits on the Sunda Shelf (Southeast Asia). Marine Geology 199(1-2): 139-157.
Haruyama, S., D. D. Lam and N. D. Dy (2001). On the Pleistocene/Holocene boundary and Holocene stratigraphy in the Bac Bo plain. Tap chi Dia chat (Journal of Geology) Series B, No.17 / 18-1: 1-9.
Hay, R. L., S. G. Guldman, J. C. Matthews, R. H. Lander, M. E. Duffin and T. K. Kyser (1991). Clay Mineral Diagenesis in Core KM-3 of Searles Lake, California. Clays and Clay Minerals 39: 84-96.
Heroy, D. C., S. A. Kuehl and J. R. Goodbred (2003). Mineralogy of the Ganges and Brahmaputra rivers: implications for river switching and late Quaternary climate change. Sedimentary Geology 155: 343-359.
Hoan, N. T. K. (1981). Location of radioactive minerals in North Vietnam interpreted by spectrum anomalies. Geological Journal, Vienam 10: 34-37.
Hori, K., Y. Saito, Q. Zhao and P. Wang (2002). Architecture and evolution of the tide-dominated Changjiang (Yangtze) River delta, China. Sedimentary Geology 146(3-4): 249-264.
Hori, K., S. Tanabe, Y. Saito, S. Haruyama, N. Viet and A. Kitamura (2004). Delta initiation and Holocene sea-level change: example from the Song Hong (Red River) delta, Vietnam. Sedimentary Geology 164.
Jackson, M. L. (1964). Chemical composition of soils. Chemistry of the soil. In: F. E. BEAR(eds.). New York, Reinhold Publishing Corp: 71-141.
Jarvis, D. I. (1993). Pollen evidence of changing Holocene monsoon climate in Sichuan Province, China. Quaternary Research 39: 325–337.

117
JCPDS International Center for Diffraction Data (1979). Power diffraction file: alphabetical index inorganic materials, USA.
John, W. (1999). Evaporites: their evolution and economics. Oxford, Blackwell Science.
Kasbohm, J., L. T. Lai, M. T. Schafmeister, Hue T.T. and K. H. Henning (2003). Mineralogical investigations of soils in selected settlements of the Nam Dinh region, Viet Nam. Journal of Geology, Vietnam Series B - No 21.
Kidwell, S. (1993). Influence of subsidence on the anatomy of marine siliciclastic sequences and on the distribution of shell and bone beds. Journal of the Geological Society 150(3): 165-167.
Krumm, S. (1994). Winfit 1.0. A Computer Program for X-ray Diffraction Line Profile Analysis. Conference on Clay Mineralogy and Petrology, Praha, Acta Universitatis Carolinae Geologica.
Ky, H. N. (1976). Tram tich nhan sinh va su hinh thanh dong bang Bac Bo (Quaternary sediments and the development of Bac Bo plain). Geological Journal 3: 3-8 (Vietnamese).
Lam, D. D. (2003). Tien hoa tram tich Holocen chau tho Song Hong (The evolution of Holocene sediments in Red River Delta). Faculty of Geology, Hanoi, Hanoi University.
Lam, D. D. (2005). Tien hoa tram tich Holocen chau tho Song Hong (The evolution of Holocene sediments in Red River Delta). Geological Journal 288(A): 7-21.
Lam, D. D. and W. E. Boyd (2001). Some facts of sea-level fluctuation during the late Pleistocene –Holocene in HaLong Bay and Ninh Binh area. Journal of Sciences of the Earth 23: 86– 91.
Lan, V. Q. (2000). Changes of coastal line in the Red River delta during Holocene. CCOP Technical Publication 27: 67-73.
Lap, N. V., T. T. K. Oanh and M. Tateishi (2000). Late Holocene depositional environments and coastal evolution of the Mekong River Delta, Southern Vietnam. Journal of Asian Earth Sciences 18: 427–439.
Li, Z., Y. Saito, E. Matsumoto, Y. Wang, S. Tanabe and L. V. Q. (2006). Climate change and human impact on the Song Hong (Red River) Delta, Vietnam, during the Holocene. Quaternary International 144(1): 4-28.
Lieu, N. T. H., R. Lampe and N. Bieu (2005). Authigenic minerals in Holocene sediments in some Red River Delta cores and intepretations. Geological and mineral, Hanoi, Vietnam, Geological and Mineral Institute.
Mathers, S. J., J. Davies, A. McDonald, J. A. Zalasiewicz and S. Marsh (1996). The Red River Delta of Vietnam. British Geological Survey Technical Report No. WC/96/2, Oxon, British Geological Survey.
Mathers, S. J. and J. A. Zalasiewicz (1999). Holocene sedimentary architecture of the Red River delta, Vietnam. Journal of Coastal Research 15: 314–325.
Meade, R. H. and R. S. Parker (1985). Sediment in rivers of the United States: U.S. Geological Survey Water-Supply Paper 2275. National Water Summary 1984.
Meunier, A. (2005). Clays. Heidelberg, Springer.
Milliman, J. D., C. Rutkowski and M. Meybeck (1995). River Discharge to the Sea: a
118
Global River Index. LOICZ Core Project Office.
Minh, T. and N. V. Dan (1991). Groundwater resources in Hanoi area.
Moon, J. W., Y. Song, H. S. Moon and G. H. Lee (2000). Clay minerals from tidal flat sediments at Youngjong Island, Korea, as a potential indicator of sea-level change. Clay Minerals 35(5): 841-855.
Moore, D. M. and R. C. Reynolds (1997). X-Ray diffraction and the identification and analysis of clay minerals. Oxford, Oxford University Press.
Mutti, E., R. Tinterrj, E. Remacha, N. Mavilla, S. Angella and L. Fava (2002). An introduction to the analysis of ancient turbidite basins from an outcrop perspective. Tulsa, Okla, American Association of Petroleum Geologists.
Nadeau, M. J., P. M. Grootes, M. Schleicher, P. Hasselberg, A. Rieck and M. Bitterling (1998). Sample Throughput and Data Quality at the Leibniz-Labor AMS Facility. Radiocarbon 40(1-2): 239-245.
Nghi, T. and T. N.Q., Eds. (1999). The evolution of Quaternary sediments in Vietnam. Geology and Minerals Department, Vietnam. Hanoi, Northern Geological mapping Division, Department of Geology and Minerals of Vietnam.
Nghi, T., M. T. Nhuan, C. V. Ngo, P. Hoekstra, T. Van Weering, J. H. Van Den Bergh, R.-O. Niedermeyer, J. Kasbohm, R. Lampe, M.-T. Schafmeister, D. X. Thanh, N. D. Nguyen, V. V. Phai and L. T. Lai (2002). Holocene sedimentary evolution, geodynamic and environmental control of the Red-River-Delta. Z.geol.Wiss Berlin 30(3): 157-172.
Nghi, T. and N. Q. Toan (2000). Development history of deposits in the Quaternary of Vietnam. The Weathering Crust and Quaternary Sediments in Vietnam. In: T. V. Nguyen, Saito, Y., Nguyen, V.Q., Ngo, Q.T.(eds.). Ha Noi, Department of Geology and Minerals of Vietnam: 177–192.
Nghi, T., N. Q. Toan, D. T. V. Thanh, N. D. Minh and N. V. Vuong (1991). Quaternary sedimentation of the principal deltas of Vietnam. Journal of Southeast Asian Earth Sciences 6(2): 103-110.
Ngoi, C. V. (2000). Geodynamic Characteristics of Red river delta in Holocene. Geological Journal, Vietnam Special(A): 40-45.
Niedermeyer, R. O. (2001). Sedimentologische Charakterisierung von Event-Prozessen in holozänen Sedimenten des Roten Fluss Deltas (Nord-Vietnam).
Nielsen, L. H., A. Mathiesen, T. Bidstrup, O. V. Vejbaek, P. T. Dien and P. V. Tiem (1999). Modeling of hydrocarbon generation in the Cenozoic Song Hong Basin, Vietnam: a highly prospective basin. Journal of Asian Earth Science 17: 269–294.
Pirazzoli, P. A. (1991). World Atlas of Holocene Sea-level Changes. Amsterdam, Elsevier.
Plas, L. and A. C. Tobi (1965). A chart for judging the reliability of point counting results. American Journal of Science 263: 87-90.
Posamentier, H. W., M. T. Jervey and P. R. Vail, Eds. (1988). Eustatic controls on clastic deposition I-conceptual framework. Sea-Level Changes-An Integrated Approach, The Society of Economic Paleontologists and Mineralogists. SEPM.
Posamentier, H. W. and P. R. Vail, Eds. (1988b). Eustatic controls on clastic deposition II-Sequence and systems tract models. Sea-Level Changes-An Integrated

119
Approach, The Society of Economic Paleontologists and Mineralogists. SEPM.
Reading, H. G. and J. D. Collinson, Eds. (1986). Clastic coast. Sedimentary Environments: Processes, Facies and Stratigraphy. Oxford, Blackwell Science.
Reineck, H. E. (1972). Tidal flats; In: Recognition of ancient sedimentary environments. In: J. K. Rigby and W. K. Hamblin, Soc. Econ. Palaeont. Mineral. Spec. Publ. 17: 146–159.
Reineck, H. E. and I. B. Singh (1973). Depositional Sedimentary Environments. Würzburg, Springer-Verlag Berlin - Heidelberg.
Reineck, H. E. and F. Wunderlich (1968). Classification and origin of flaser and lenticular bedding. Sedimentology 11: 99–104.
Richard, C. S. (2005). Encyclopedia of geology. Amsterdam ; Boston, Elsevier Academic.
Saito, Y., H. Katayama, K. Ikehara, Y. Kato, E. Matsumoto, K. Oguri, M. Oda and M. Yumoto (1998). Transgressive and highstand systems tracts and post-glacial transgression, the East China Sea. Sedimentary Geology 122(1-4): 217-232.
Saito, Y., S. Tanabe, Q. L. Vu, T. J. J. Hanebuth, A. Kitamura and Q. T. Ngo, Eds. (2004). Stratigraphy and Holocene evolution of the Song Hong (Red River) delta, Vietnam. Stratigraphy of Quaternary system in deltas of Vietnam. Hanoi, Vietnam, Department of Geology and Minerals of Vietnam.
Saito, Y., Z. Yang and K. Hori (2001). The Huanghe (Yellow River) and Changjiang (Yangtze River) deltas: a review on their characteristics, evolution and sediment discharge during the Holocene. Geomorphology 41: 219–231.
Scheffer, F. and P. Schachtschabel (1998). Lehrbuch der Bodenkunde. Stuttgart: 493.
Schimanski, A. (2002). Holocene sedimentation on the Vietnamese shelf: from source to sink. Mathematisch-Naturwissenschaftlichen Fakultät, Kiel, Christian-Albrechts-Universtität zu Kiel.
Schimanski, A. and K. Stattegger (2005). Deglacial and Holocene evolution of the Vietnam shelf: stratigraphy, sediments and sea-level change. Marine Geology 214(4): 365-387.
Schroeder, D. (1992). Bodenkunde in Stichworten. Berlin, Stuttgart: 175.
Sinsakul, S. (1992). Evidence of Quaternary sea level changes in the coastal areas of Thailand: a review. Journal of Southeast Asian Earth Sciences 7: 23–37.
Srodon, J. (1999). Use of clay minerals in reconstrueting geological processes: recent advances and some perspectives. Clay Minerals 34(1): 27-28.
Steinke, S., M. Kienast and T. Hanebuth (2003). On the significance of sea-level variations and shelf palaeo-morphology in governing sedimentation in the southern South China Sea during the last deglaciation. Marine Geology 201(1-3): 179-206.
Stuiver M., Reimer P., Bard E., Beck J., Burr G., Hughen H., Kromer B., McCormac G., Van der Plicht J. and S. M. (1998). Intcal98 radiocarbon age calibration, 24,000-0 cal.BP. Radiocarbon 40(3): 1041-1083.
Tam, N. D. (1991). Marine Terraces of Indochina. Mineral Resources Development Series 60(United Nations, New York): 47–50.
120
Tam, N. D. (1991). Quaternary sediments and evolution of the plains in Vietnam. Quaternary Stratigraphy of Asia and the Pacific IGCP 296 (1990), United Nations Mineral Resources Development.
Tanabe, S., K. Hori, Y. Saito, S. Haruyama, L. Q. Doanh and S. Hiraide (2003c). Sedimentary facies and radiocarbon dates of the Nam Dinh-1 core from the Song Hong (Red River) delta, Vietnam. Journal of Asian Earth Sciences 21(5): 503-513.
Tanabe, S., K. Hori, Y. Saito, S. Haruyama, V. V. Phai and A. Kitamura (2003b). Song Hong (Red River) delta evolution related to millennium-scale Holocene sea-level changes. Quaternary Science Reviews 22(21-22): 2345-2361.
Tanabe, S., T. T. K. Oanh, N. V. Lap, M. Tateishi, I. Kobayashi and Y. Saito, Eds. (2003a). Delta evolution model inferred from the Mekong delta, southern Vietnam. Tropical Deltas of Southeast Asia-Sedimentology, Stratigraphy, and Petroleum Geology, Society of Economic Paleontologists and Mineralogists. SEPM.
Tanabe, S., Y. Saito, V. Q. Lan, Hanebuth, Till J.J., N. Q. Toan and A. Kitamura (2006). Holocene evolution of the Song Hong (Red River) delta system, northern Vietnam. Sedimentary Geology 187: 29-61.
Tateishi, M., I. Kobayashi, Y. Saito, T. T. K. Oanh and L. N. V. (2001). Sedimentary facies, diatom and foraminifera assemblages in a late Pleistocene-holocene incised-valley sequence from the Mekong River Delta, Bentre province, Southern Vietnam. Asian Earth Science 20: 83-94.
Thanh, N. H. and E. Kazuhiko (2000). Clay mineralogical composition of some fluvisols in Vietnam. Clay Science 11(3): 205-218.
Thompson, L. G., M. E. Davis, E. Mosley-Thompson, T. A. Sowers, K. A. Henderson, Zagorodnov, V.S., Lin, P.-N., Mikhalenko, V.N., and R. K. Campen, Bolzan, J.F., Cole-Dai, J., Francou, B., (1998). A 25,000 year tropical climate history from Bolivian ice cores. Science 282: 1858–1864.
Toan, N. Q. (1995). Dac diem tram tich va cac thanh tao he De tu o phan dong bac dong bang song Hong (Characteristic of Quaternary deposits in the northern of Red River Delta). Geology Department, Hanoi, Hanoi University.
Toan, N. Q. (2004). Quaternary paleoecology in Red River delta. Stratigraphy of Quaternary system in deltas of Vietnam, Hanoi, Vietnam, Department of Geology and Minerals of Vietnam.
Tra, H. T. L., N. H. Thanh and E. Kazuhiko (2000). Clay mineralogical composition of Vietnam soils derived from different parent rocks. Clay Science 11: 285-297.
Van Maren, D. S. and P. Hoekstra (2004). Seasonal variation of hydrodynamics and sediment dynamics in a shallow subtropical estuary: the Ba Lat River, Vietnam. Estuarine, Coastal and Shelf Science 60(3): 529-540.
Van Maren, D. S. and P. Hoekstra (2005). Dispersal of suspended sediments in the turbid and highly stratified Red River plume. Continental Shelf Research 25(4): 503-519.
Van Wagoner, J. C., H. W. Posamentier, R. M. Mitchum, P. R. Vail, J. F. Sarg, T. S. Loutit and E. J. Hardenbol, Eds. (1988). An overview of the fundamentals of sequence stratigraphy and key definitions. Sea-Level Changes-An Integrated Approach, Society of Economic Paleontologists and Mineralogists. SEPM.
121
Velde, B. (1985). Clay minerals. A physico-chemical explaination of their occurrence. Netherland, Elsevier science publishers B.V.
Wang Z., Z. Chen and T. J. (2005). Clay mineral analysis of yangtze delta, china, to interpret the late Quaternary sea-level fluctuations, climate change and sediment provenance. Journal of Coastal Research.
Weaver, C. E. (1989). Clays, muds and shales. Amsterdam, Elsevier.
Yang, Z. and H. Lin (1996). Correlation of Quaternary event - stratigraphy of shelf area in the asia - pacific region. Geological hazards and environmental studies of china offshor areas. 14th INQUA Congress, Berlin, Qingdao Ocean University Press.
Yi, S., Y. Saito, Q. Zhao and P. X. WANG (2003). Vegetation and climate changes in the Changjiang (Yangtze River) Delta, China, during the past 13,000 years inferred from pollen records. Quaternary Science Reviews 22(14): 1501 -1519.
Zbigniew, P., P. V. Ninh, Marek S., N. M. Hung and O. Rafal (2005). Hydrology and morphology of two river mouth regions (temperate Vistula Delta and subtropical Red River Delta). Oceanologia 47(3): 365–385.
Zbigniew P., P. V. Ninh, H. Marek S., N. M., and R. O. (2005). Hydrology and morphology of two river mouth regions (temperate Vistula Delta and subtropical Red River Delta). Oceanologia 47(3): 365–385.
![[Nguyen Thi Minh Anh] Curriculum Vitae](https://static.fdocuments.us/doc/165x107/587b653b1a28ab38258b6571/nguyen-thi-minh-anh-curriculum-vitae.jpg)