Thi Truc Minh Nguyen A Thesis in of
150
Curation and analysis of tRNA and aminoacyl-tRNA synthetase genes in the nuclear genome of Myceliophthora thermophila Thi Truc Minh Nguyen A Thesis in The Department of Biology Presented in Partial Fulfillment of the Requirements for the Degree of Master of Science (Biology) at Concordia University Montreal, Quebec, Canada December 2012 © Thi Truc Minh Nguyen, 2012
Transcript of Thi Truc Minh Nguyen A Thesis in of

Curation and analysis of tRNA and aminoacyl-tRNA synthetase genes in the nuclear
genome of Myceliophthora thermophila
Thi Truc Minh Nguyen
A Thesis
in
The Department
of
Biology
Presented in Partial Fulfillment of the Requirements
for the Degree of Master of Science (Biology) at
Concordia University
Montreal, Quebec, Canada
December 2012
© Thi Truc Minh Nguyen, 2012

CONCORDIA UNIVERSITY
School of Graduate Studies
This is to certify that the thesis prepared:
By: Thi Truc Minh Nguyen
Entitled: Curation and analysis of tRNA and aminoacyl-tRNA synthetase genes in
the nuclear genome of Myceliophthora thermophila
and submitted in partial fulfillment of the requirements for the degree of
Master of Science (Biology)
complies with the regulation of the University and meets the accepted standards with
respect to originality and quality.
Signed by the final Examining Committee:
Dr. Selvadurai Dayanandan ______________ Chair
Dr. David Walsh ______________________ External examiner
Dr. Gregory Butler _____________________ Examiner
Dr. Justin Powlowski ___________________ Examiner
Dr. Adrian Tsang ______________________ Supervisor
Approved by ___________________________________________________
Chair of Department or Graduate Program Director
January 17th
2013 ___________________________________________________
Dean of Faculty

iii
ABSTRACT
Curation and analysis of tRNA and aminoacyl-tRNA synthetase genes in the nuclear
genome of Myceliophthora thermophila
Thi Truc Minh Nguyen
Transfer ribonucleic acids (tRNAs) and aminoacyl-tRNA synthetases (AARSs) have
long been known for their indispensable roles in the translational process to synthesize
proteins in living cells. Therefore, detecting and analyzing the comprehensive sets of
tRNA and AARS genes would enhance understanding of the translation system and the
results could potentially be used to optimize the translation efficiency for the protein
production in the organisms of interest. This research aims to detect the complete sets of
cytoplasmic tRNA genes and AARS genes from the nuclear genome of Myceliophthora
thermophila, a filamentous fungus used in the enzyme production industry and the first
thermophilic eukaryote with a finished genome sequence. In this study, 194 cytoplasmic
tRNA genes and 35 aminoacyl-tRNA synthetase genes in M. thermophila were
determined by comparing the gene models predicted from the genome with the sequenced
RNAs and the experimentally characterized tRNA and AARS genes. The experimentally
verified tRNA genes in M. thermophila can encode all of the 20 universal amino acids.
The 35 AARS genes code for cytoplasmic and mitochondrial AARS enzymes of all of the
20 amino acid specificities except for the mitochondrial glutaminyl-tRNA synthetase.
Four commonly used tools – tRNAscan-SE, SPLITSX, ARAGORN and tRNAfinder –
were deployed for the tRNA gene prediction, and we showed that tRNAscan-SE and
SPLITSX give more accurate results than ARAGORN and tRNAfinder. Analysis of the

iv
tRNA genes showed that there are significant correlations between tRNA gene number in
the genome and tRNA abundance in the cell, as well as between tRNA gene number and
codon usage bias of protein-encoding genes in M. thermophila. Based on the complete
tRNA gene set and the codon frequencies in the protein-encoding gene set, a set of
preferred codons in M. thermophila was determined. The manually curated tRNA and
AARS genes of M. thermophila, as well as the experimentally characterized ones
collected from tRNA and protein databases along with the supporting literature provided
in this study, can be used as reliable datasets for tRNA and AARS gene annotation
processes.

v
ACKNOWLEDGEMENTS
I would like to express my deepest gratitude to my supervisor, Dr. Adrian Tsang,
who gave me the opportunity to work and study in Montreal and obtain great experience
in research. I am sincerely thankful for his support, patience and guidance over the years.
I highly appreciate his precious suggestions and time that he dedicate for helping me to
finish my thesis.
I would like to thank Dr. Gregory Butler and Dr. Justin Powlowski for being my
committee members, for their patience and their valuable advice.
It is a great pleasure to express my sincere thanks to Dr. Wendy Findlay for the
valuable suggestions and discussions.
This thesis would not have been possible without the great help from Nadeeza
Ishmael for providing the sequenced short RNA data, from Dr. Ian Reid for the mapping
sequenced short RNA sequences onto the genome and from Dr. Emmet A. O’Brien for
displaying the predicted and sequenced data on GBrowse. Also, I would like to thank
people in the Genozyme Project.
I would like to thank the Department of Biology at Concordia University for
providing me the fellowship and opportunity to work as a teaching assistant here.
I cannot find words to express my gratitude to Min Wu, Yu Lan Jin and my beloved
labmates – Sherry Wu, Vanessa Blandford, Caitlin Murphy, Carolina Cantu and Christina
Sawchyn - for their help, encouragement and priceless advice over the years.
I would like to take this opportunity to acknowledge people in the Bioinformatics
Laboratory for all of their help in completing my research project.

vi
Lastly, it would like to thank my family, especially my parents, my sister and my
husband. All of my work would have been impossible without their hard work, love and
care. This thesis is dedicated to my grandmother who passed away one week before the
completion of this thesis and who had always believed in me.

vii
TABLE OF CONTENTS
LIST OF FIGURES ................................................................................................................ xi
LIST OF TABLES ................................................................................................................xiii
LIST OF ABBREVIATIONS ............................................................................................... xv
CHAPTER 1. INTRODUCTION ........................................................................................... 1
1.1. Overview of tRNAs and tRNA genes ........................................................................ 1
1.1.1. Roles of tRNAs in the cell................................................................................... 1
1.1.2. Features of tRNA and tRNA gene structures ..................................................... 3
1.1.3. Synthesis of tRNA in the cell ............................................................................ 11
1.1.4. Two special tRNAs: tRNASeC
and tRNAPyl
...................................................... 13
1.2. Relationships between tRNA gene number, tRNA abundance and codon
usage ........................................................................................................................... 15
1.3. tRNA gene prediction methods................................................................................. 17
1.3.1. The tRNAscan-SE algorithm ............................................................................ 17
1.3.2. The SPLITSX algorithm ................................................................................... 25
1.3.3. The ARAGORN algorithm ............................................................................... 26
1.3.4. The tRNAfinder algorithm ................................................................................ 26
1.4. Algorithm of Bowtie, an efficient short-read mapping tool.................................... 27
1.5. Overview of aminoacyl-tRNA synthetases .............................................................. 33
1.5.1. Functions of aminoacyl-tRNA synthetases ...................................................... 33
1.5.2. General characteristics of aminoacyl-tRNA synthetases and their
genes ................................................................................................................... 36

viii
1.6. Rationale for this study.............................................................................................. 40
CHAPTER 2. MATERIALS AND METHODS .................................................................. 41
2.1. tRNA gene prediction, curation and annotation procedure ..................................... 41
2.1.1. Predicting tRNA genes ...................................................................................... 42
2.1.2. Processing and mapping sequenced short RNA data ...................................... 43
2.1.3. Collecting and analyzing experimentally characterized fungal tRNAs
and tRNA genes ................................................................................................. 46
2.1.4. Manual curation and annotation of tRNA genes in M. thermophila .............. 51
2.2. AARS gene curation and annotation procedure ...................................................... 54
2.2.1. Collecting and analyzing reliable aminoacyl-tRNA synthetases .................... 55
2.2.2. Manual curation and annotation of AARS genes in M. thermophila ............. 57
2.3. Calculating the effective number of codons (Nc) .................................................... 59
2.4. Determining preferred codons .................................................................................. 60
2.5. Analyzing relationships between tRNA gene number, tRNA abundance
and codon usage ......................................................................................................... 62
2.5.1. Relationship between tRNA gene number and tRNA abundance .................. 62
2.5.2. Relationship between tRNA gene number, tRNA abundance and
codon usage ........................................................................................................ 63
CHAPTER 3. RESULTS ....................................................................................................... 66
3.1. tRNA gene prediction results .................................................................................... 66
3.1.1. tRNAscan-SE ..................................................................................................... 66
3.1.2. SPLITSX ............................................................................................................ 66
3.1.3. ARAGORN ........................................................................................................ 66

ix
3.1.4. tRNAfinder ......................................................................................................... 68
3.1.5. Compare predicted tRNA genes from the four tools ....................................... 68
3.2. Mapping of short RNAs ............................................................................................ 69
3.3. Summary of characterized fungal tRNAs and tRNA genes .................................... 70
3.4. Results from the manual curation and annotation of tRNA genes in M.
thermophila ................................................................................................................ 75
3.5. Characteristics of experimentally characterized fungal tRNA genes and
tRNA genes found in M. thermophila ...................................................................... 81
3.6. Results from collecting and analyzing reliable AARSs .......................................... 86
3.6.1. Summary of characterized AARSs ................................................................... 86
3.6.2. Results from analyzing the characterized AARS sequences........................... 88
3.7. Results from the manual curation and annotation of AARS genes in M.
thermophila ................................................................................................................ 95
3.8. Preferred codons in M. thermophila ....................................................................... 100
3.9. Correlation between tRNA gene number, tRNA abundance and codon
usage in M. thermophila .......................................................................................... 102
CHAPTER 4. DISCUSSION .............................................................................................. 106
4.1. Reliable tRNA gene detection in M. thermophila ................................................. 106
4.2. Reliable tRNA data for the tRNA gene annotation in fungal genomes ............... 107
4.3. Comparing different tRNA gene predictors ........................................................... 108
4.4. Reliable AARS gene detection in M. thermophila ................................................ 109
4.5. Genes encoding both mitochondrial and cytoplasmic AARSs ............................. 110

x
4.6. Correlation between tRNA gene number, tRNA abundance and codon
usage ......................................................................................................................... 110
4.7. Potential of codon optimization in M. thermophila and a quick method for
determining preferred codons ................................................................................. 111
CHAPTER 5. CONCLUSIONS .......................................................................................... 112
REFERENCES ..................................................................................................................... 114
APPENDICES ...................................................................................................................... 124

xi
LIST OF FIGURES
Figure 1. Adaptor function of tRNAs in the translation process ........................................... 1
Figure 2. Cloverleaf structure of tRNAs ................................................................................. 6
Figure 3. Structures of BHB and HBh' motifs........................................................................ 9
Figure 4. Tertiary structure of tRNAs ................................................................................... 10
Figure 5. Synthesis of tRNA in a yeast cell .......................................................................... 12
Figure 6. Secondary structure of an eukaryotic tRNASeC
.................................................... 14
Figure 7. Schematic description of the algorithm implemented by EufindtRNA .............. 20
Figure 8. Example of an RNA structure and its presentation in an ordered tree ............... 22
Figure 9. Description of tRNAscan-SE's algorithm ............................................................. 24
Figure 10. Overview of the short-read mapping using Bowtie ........................................... 29
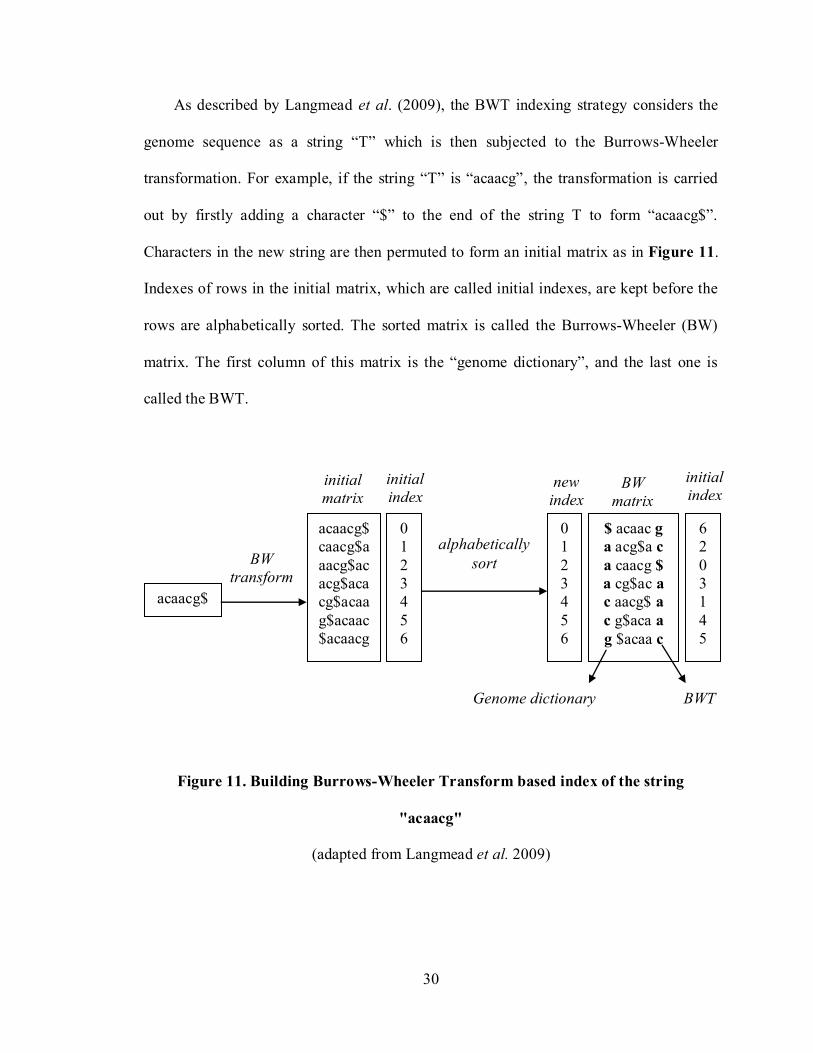
Figure 11. Building Burrows-Wheeler Transform based index of the string "acaacg" ..... 30
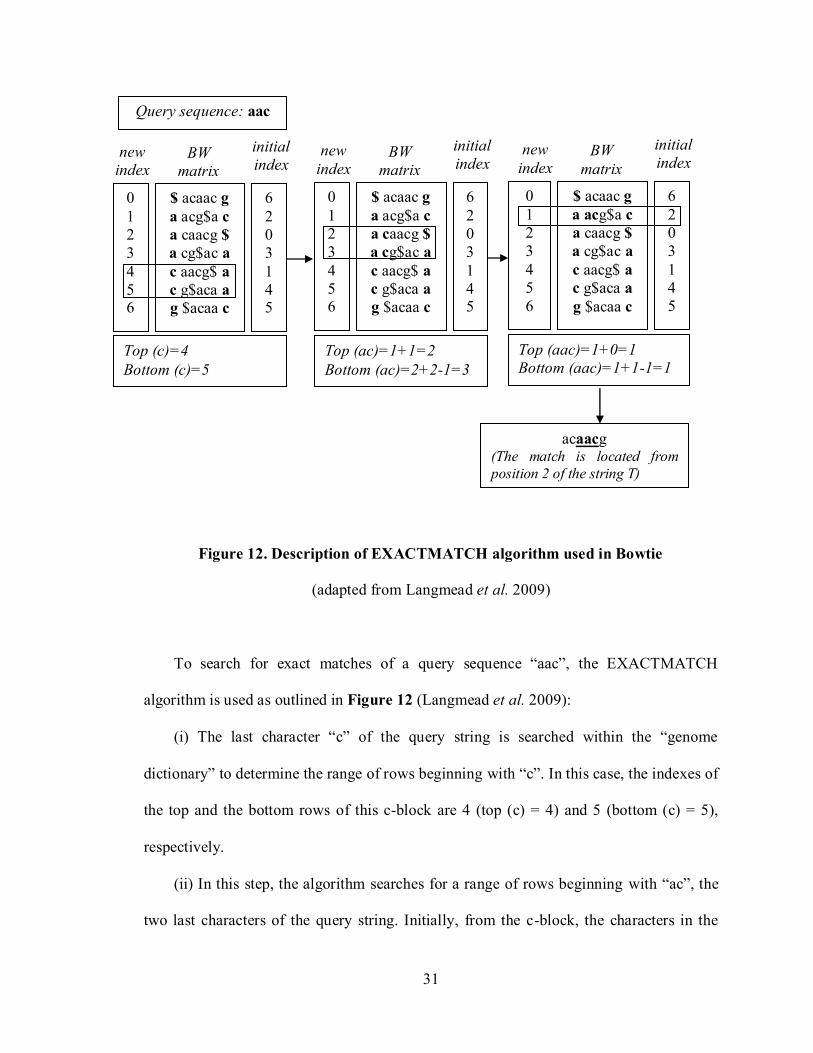
Figure 12. Description of EXACTMATCH algorithm used in Bowtie .............................. 31
Figure 13. The two-step aminoacylation reaction ................................................................ 34
Figure 14. Indirect aminoacylation pathways ...................................................................... 35
Figure 15. The tRNA gene prediction, curation and annotation workflow ........................ 41
Figure 16. Overview of the short RNA sequencing process ............................................... 44
Figure 17. GO evidence code decision tree .......................................................................... 49
Figure 18. Comparing predicted tRNA gene models and sequenced short RNA data
on GBrowse ........................................................................................................... 53
Figure 19. Overall procedure of the AARS gene detection in M. thermophila ................. 55
Figure 20. Comparing AARS gene models and transcriptome data on GBrowse ............. 58
Figure 21. Secondary structure of a pseudogene predicted by ARAGORN ...................... 67
xii
Figure 22. Numbers and percentages of tRNA genes predicted by different tools in
the non-redundant predicted tRNA gene set ....................................................... 69
Figure 23. The short read mapping was improved when using BLAT ............................... 70
Figure 24. Phylogenetic tree built from the experimentally characterized fungal
tRNA sequences .................................................................................................... 74
Figure 25. Comparing results from the four tRNA gene prediction tools .......................... 78
Figure 26. Example of a tRNA gene from ARAGORN having incorrect ending and
intron positions ...................................................................................................... 78
Figure 27. The amount of short reads mapped onto the reliable tRNA genes ................... 80
Figure 28. Example of a genomic region highly covered by the short reads and
having no predicted tRNA gene ........................................................................... 81
Figure 29. Conserved and semi-conserved nucleotides as well as the intron position
of the fungal tRNAs in this study ........................................................................ 83
Figure 30. Examples of poly-T regions found downstream of the tRNA genes ................ 84
Figure 31. Phylogenetic tree built from the characterized AARS protein sequences ........ 91
Figure 32. Multiple sequence alignment profiles of the signature motif sequences of
the characterized AARSs ...................................................................................... 93
Figure 33. The numbers of correct gene models from JGI and the Genozymes
project when comparing the gene models of 36 AARS candidates and the
transcriptome data ................................................................................................. 95
Figure 34. Correlation between tRNA gene number and amino acid frequency ............. 104
Figure 35. Correlation between tRNA gene number and codon frequency ..................... 105

xiii
LIST OF TABLES
Table 1. Databases used in the search for experimentally characterized fungal
cytoplasmic AARSs .............................................................................................. 56
Table 2. The synonymous families and the amino acids in each family ............................ 59
Table 3. Base pairing at the third position of the codon according to Wobble theory ...... 65
Table 4. Calculating tRNA usage values for three tRNA gene families specific for
the anticodons AGC, CGC and TGC ................................................................... 65
Table 5. Number of sequences of each fungal species in the experimentally
characterized tRNA sequence data set ................................................................. 71
Table 6. Number of experimentally characterized fungal tRNAs in the isoacceptor
families and anticodon-specific families ............................................................. 72
Table 7. Number of correctly and incorrectly predicted tRNA genes as revealed by
manual curation and annotation ........................................................................... 77
Table 8. Number of tRNA genes of M. thermophila in isoacceptor families and
anticodon specific families ................................................................................... 79
Table 9. Numbers of the four TEs found in the genomes of S. cerevisiae and C.
albicans .................................................................................................................. 86
Table 10. Number of characterized AARSs collected in this study.................................... 87
Table 11. Sequence similarity between the reliable AARSs of M. thermophila and
the experimentally characterized AARSs from the BLASTP search
result....................................................................................................................... 99

xiv
Table 12. Preferred codons in M. thermophila found from the three methods which
are based on the tRNA genes, the highly expressed genes and the genes
having Nc values lower than 31.......................................................................... 102

xv
LIST OF ABBREVIATIONS
AARS : Aminoacyl-tRNA synthetase
AMP : Adenosine monophosphate
ATP : Adenosine triphosphate
BHB : Bulge - Helix – Bulge
BLAT : BLAST-like alignment tool
BW : Burrows-Wheeler
BWT : Burrows-Wheeler Transform
CAI : Codon Adaptation Index
CBI : Codon Bias Index
FPKM : Fragments Per Kilobase of exon per Million fragments mapped
GBrowse : Generic Genome Browser
GDP : Guanosine 5′-diphosphate
GO : Gene Ontology
GTP : Guanosine-5'-triphosphate
GtRNAdb: Genomic tRNA database
HMM : Hidden Markov Model
JGI : Joint Genome Institute
kb : Kilobase
mRNA : messenger ribonucleic acid
MSA : Multiple Sequence Alignment
mTP : mitochondrial targeting peptide
Nc : Number of effective codons

xvi
ORF : Open reading frame
Pyl : Pyrrolysine
RSCU : Relative Synonymous Codon Usage
SeC : Selenocysteine
SECIS : SeC insertion sequence
SF : synonymous family
tAI : tRNA Adaptation Index
TE : Transposable Element
tRNA : transfer ribonucleic acid
tRNAdb : Transfer RNA database

1
CHAPTER 1. INTRODUCTION
1.1. Overview of tRNAs and tRNA genes
1.1.1. Roles of tRNAs in the cell
Transfer ribonucleic acid, or tRNA, has been known for its crucial role in protein
synthesis since 1962 when it was identified as an adaptor molecule to convert the genetic
code in a messenger RNA (mRNA) into a polypeptide chain (Chapeville et al. 1962).
Each tRNA attaches to its conjugate amino acid by an aminoacylation reaction catalyzed
by an appropriate aminoacyl-tRNA synthetase enzyme. Each tRNA has three consecutive
nucleotides called an anticodon, which can form base pairings with the corresponding
codon consisting of three successive nucleotides in the mRNA (Figure 1). By having
these special features, tRNA molecules can specifically recognize codons in an mRNA
and decode them into amino acids.
Figure 1. Adaptor function of tRNAs in the translation process
(reproduced from Britannica Encyclopædia 2012)

2
There are two classes of tRNAs in eukaryotic cells: organelle tRNAs and
cytoplasmic tRNAs. Transfer RNAs in mitochondria and chloroplasts are encoded by
their own genomes and they function as adaptors of the translational system of their
corresponding organelles (Parks et al. 1984; Marechal-Drouard, Weil and Dietrich 1993).
The cytoplasmic tRNAs are encoded by the nuclear genome and function in the synthesis
of a majority of proteins in the cell; therefore, they play a crucial role in the cell’s growth
(Schmidt and Söll 1981). This study focuses on cytoplasmic tRNAs, and the tRNAs
mentioned hereafter refer to cytoplasmic tRNAs unless otherwise specified.
There are two types of tRNAs, the initiators and the elongators, functioning in
different stages of the translation process. The initiator tRNA ( ) plays an
important role in the initiation step. After being charged with Met, binds to the
guanosine-5'-triphosphate (GTP) molecule, initiation factors and the small ribosomal
subunit to form a complex which subsequently scans through the mRNA to search for the
start codon (AUG). Additionally, unlike in bacteria, a formyl group is not added to the
aminoacylated initiator tRNA in eukaryotes. However, it can be formylated by bacterial
methionyl-tRNA transformylase while the elongator methionyl-tRNA cannot, and this
special feature has been used to distinguish between initiator and elongator Met-tRNAs
during the purification procedure (RajBhandary and Ghosh 1969; Gillum et al. 1977;
Yamashiro-Matsumura and Takemura 1979). Elongator tRNAs are responsible for
decoding the codons located downstream of the start codon. They code for all amino
acids and can be classified into isoacceptor families according to their amino acid
specificity. Within each family, tRNAs can also be divided into subgroups according to
their anticodons. During the elongation step, each elongator tRNA is specifically charged

3
with an appropriate amino acid. Subsequently, the aminoacyl-tRNA is delivered to the
“A” (aminoacyl) site of the ribosome by a complex consisting of an elongation factor and
a GTP molecule. When correct base pairings are established between nucleotides of the
anticodon and the codon, the GTP is hydrolysed to a guanosine diphosphate (GDP)
molecule, and the complex of GDP and elongation factor is released from the ribosome.
Next, the polypeptide chain attached to the tRNA at the “P” (peptidyl) site, which is
directly upstream of the “A” site, is transferred to the amino acid attached the tRNA at
the “A” site by a peptide linkage (Figure 1). The elongation procedure is repeated while
the ribosome keeps moving forward to the 3’ end of the mRNA. The translation process
is finished when a stop codon (UAA, UAG or UGA) is located at the A site. Finally, a
complete polypeptide chain is synthesized.
As reviewed by Goldman (2008), in addition to its primary function as an adaptor in
protein synthesis, tRNA is involved in other processes of the cell including transcription,
gene regulation and synthesis of the bacterial cell membrane and cell wall. For example,
tRNAs play a role in the transcriptional regulation of bacterial amino acid biosynthesis
operons and several genes coding for aminoacyl-tRNA synthetases, and tRNALeu
functions as a transcription factor of the RNA polymerase III in silkworm.
1.1.2. Features of tRNA and tRNA gene structures
Lengths of most known tRNAs range from 74 to 98 nucleotides (Westhof and
Auffinger 2001). Before becoming a mature tRNA, the precursor tRNA is subjected to
modification steps in which its 5’ leader, 3’ trailer and intron are removed (Phizicky and
Hopper 2010). Hence, lengths of tRNA genes are much longer than their functional
products. However, in most tRNA genes that have been reported so far, the regions

4
encoding the extra sequences at both ends of the precursor tRNAs are excluded. In this
thesis, tRNA genes do not include sequences coding for the 5’ leader and 3’ trailer.
The last three nucleotides at the 3’ end of all mature tRNAs are always “CCA”. This
3’ end CCA is encoded by tRNA genes in prokaryotes while it is added by the enzyme
tRNA nucleotidyltransferase after transcription in eukaryotes (Schmidt and Söll 1981;
Mohan et al. 1999). This CCA-terminus functions in the binding between a tRNA
molecule and an amino acid. It has been reported that substitutions of these nucleotides
affect the aminoacylation reaction (Zhou et al. 2011).
In a tRNA gene, there are two signature sequences to recognize the internal
promoters. They are called box A and box B, and located within the coding region.
Moreover, like protein-coding genes, tRNA genes also contain intervening sequences,
that is, introns. In S. cerevisiae, approximately 20% of the tRNA genes contain introns
(Goldman 2008). All characterized, intron-bearing tRNA genes of eukaryotes have a
single intron which is frequently located one nucleotide downstream of the anticodon
(Schmidt and Söll 1981; Sugahara et al. 2007; Goldman 2008). In archaeal species, it has
been reported that tRNA genes can have multiple introns which are located at various
locations in the tRNA (Sugahara et al. 2007; Randau and Soll 2008). The lengths as well
as the nucleotide composition of tRNA introns are diverse (Schmidt and Söll 1981).
In mature tRNAs, there are a number of unusual nucleotides derived from the
modification of the normal ones. There have been 92 types of modified nucleotides found
in tRNA sequences from different organisms (Cantara et al. 2011). The average number
of these nucleotides in each tRNA sequence is 12.6 in S. cerevisiae (Phizicky and Hopper
2010). Although they are not crucial for the viability of the cells, they have an important

5
role in maintaining the stability of tRNA structure as well as in the decoding property of
tRNAs (Bjork et al. 1987; Toh et al. 2001).
In the flanking regions of tRNA genes, several repeated sequences have been found
and may have some relationship with these genes. In S. cerevisiae, the three transposable
elements, sigma, delta and tau, are often found to be located adjacent to the tRNA genes
in their upstream sequences (del Rey, Donahue and Fink 1982; Eigel and Feldmann 1982;
Genbauffe, Chisholm and Cooper 1984). Among them, the sigma element frequently
shows a constant distance from 16 to 18 base pairs to the tRNA gene (del Rey et al.
1982). Moreover, in Candida albicans, another transposable element called beta is found
to be positioned close to the tRNA genes (Perreau, Santos and Tuite 1997). In the
downstream region, a stretch of thymidines is usually found. This poly-T is proposed to
be the termination site of the tRNA transcription process (Schmidt and Söll 1981; Pavesi
et al. 1994; Hamada et al. 2000).
The most typical feature of tRNAs is their ability to form a cloverleaf model
including four stems and four loops formed from the base pairings of residues in the
tRNA sequence. Nucleotides in this secondary structure are numbered from 0 to 76 with
the letter suffixes added for the additional nucleotides as shown in Figure 2. The residue
0 is only found in tRNAs specific for histidine (Westhof and Auffinger 2001).

6
Figure 2. Cloverleaf structure of tRNAs
(reproduced from Westhof and Auffinger 2001)
(The positions highlighted in grey colour within the D stem and loop region as well as
within the T stem and loop region represent the box A and box B, respectively)

7
The following details of the stems and loops of the cloverleaf structure are reviewed by
Goldman (2008). The acceptor stem, or the A-stem, consists of seven base pairs. The two
strands of this hairpin structure are from nucleotides at both ends of the tRNA sequence
except for the 3’ CCA terminus and the residue 0. The A-stem is involved in attaching
the amino acid to the tRNA; hence, it is called acceptor stem. The hairpin shown on the
left hand side of the cloverleaf comprising three to four base pairs is called the D-stem
since it usually contains the modified nucleotide dihydrouridine (D). The loop next to this
stem is the D-loop, which often comprises 8-11 nucleotides. The anticodon hairpin, also
called the AC-stem or C-stem, consists of five base pairs and is followed by a loop of
seven nucleotides harbouring the anticodon in the middle. Downstream of the anticodon
stem and loop is the variable loop (V-loop). The variable loops of different tRNAs are
highly diverse in their lengths which classify tRNAs into two classes. The class I tRNAs
have a short V-loop, which spans four to five nucleotides in length, while the class II
tRNAs have a much longer V-loop, from 10 to 24 nucleotides in length. In eukaryotic
organisms, the class II tRNAs consist of those coding for leucine and serine (Söll and
RajBhandary 1995). The T-stem and T-loop are at the right hand side of the cloverleaf
model. They are also called the TѰC- stem and loop due to the presence of the unusual
nucleotides including ribothymidine (T) and pseudouridine (Ѱ). These stem and loop
structures contain five base pairs and seven nucleotides, respectively. The two internal
promoter signal sequences, box A and box B, are located within the D- and T- regions, at
positions 8-19 and 52-62, respectively.
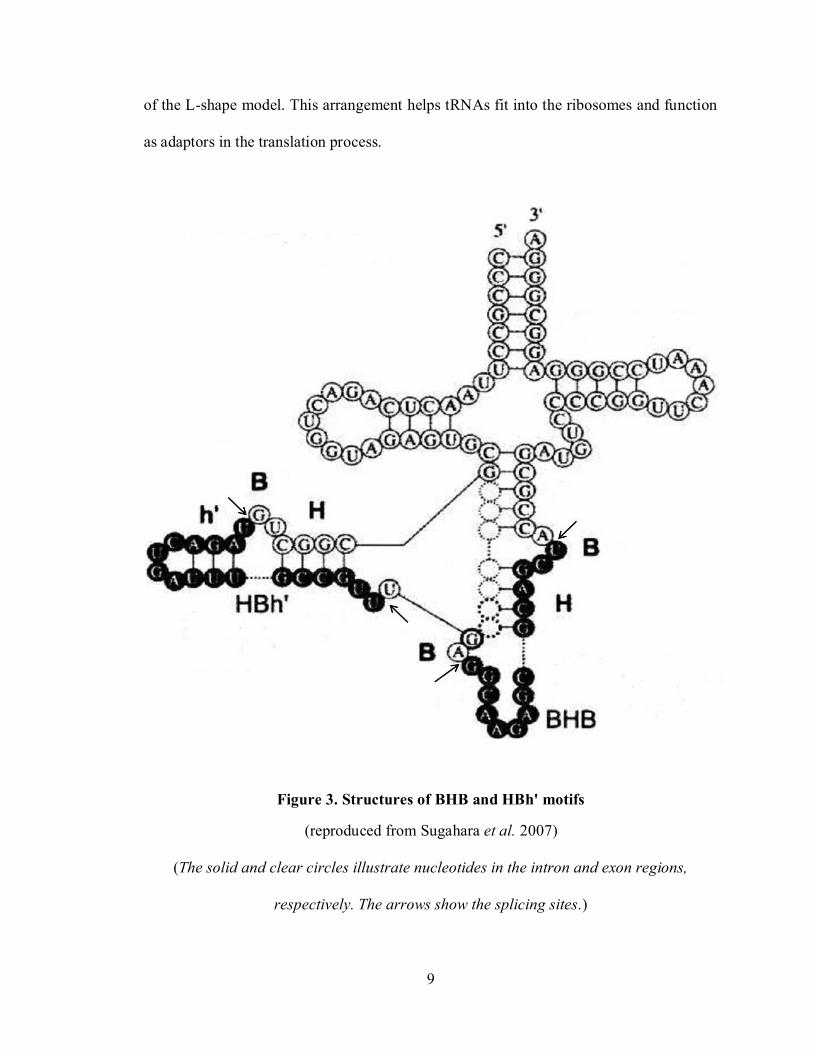
The locations and structures of tRNA introns were reported by Randau and Soll
(2008) as well as Sugahara et al. (2007). Before the splicing process, the intervening

8
sequence is frequently located in the C-loop of the precursor tRNA, between position 37
and 38. In addition to this canonical location, tRNA introns can be found in other non-
canonical positions such as D-, T- loops and C-stem. Both of the canonical and non-
canonical introns have been found in archaeal organisms. Most archaeal tRNA introns
have a structurally conserved motif at the junctions between exon and intron regions. It
consists of a central helix (H) comprising four base pairs and two bulges (B), each of
which contains three nucleotides; thus, it is widely known as the BHB motif. Moreover,
for introns not located between positions 37 and 38, this motif is often simplified into
HBh’ as shown in Figure 3. In either the BHB motif or the HBh’ motif, the splicing sites
are positioned right after two nucleotides downstream of the two strands of the central
helix. Based on these motifs, the archaeal splicing endonuclease enzymes can identify
and remove the intron sequences.
There has been no mention of the BHB motif in eukaryotic tRNA genes containing
introns; however, it was reported that the splicing endonuclease enzyme in eukaryotes
could recognize this motif and excise the intervening sequence in vitro as well as in vivo
(Randau and Soll 2008). Therefore, it is worth considering these motifs in the detection
of tRNA introns in eukaryotic species, especially the ones not located at the canonical
intron position.
As described by Goldman (2008), all tRNAs have similar tertiary structures, which
have a typical L-shape pattern (Figure 4). The base pairings in the cloverleaf model are
maintained in this three-dimensional structure. The CCA-terminus and the anticodon,
which respectively bind to the corresponding amino acid and codon, are at the two ends
9
of the L-shape model. This arrangement helps tRNAs fit into the ribosomes and function
as adaptors in the translation process.
Figure 3. Structures of BHB and HBh' motifs
(reproduced from Sugahara et al. 2007)
(The solid and clear circles illustrate nucleotides in the intron and exon regions,
respectively. The arrows show the splicing sites.)

10
Figure 4. Tertiary structure of tRNAs
(reproduced from Goldman 2008)

11
1.1.3. Synthesis of tRNA in the cell
The synthesis of a functional tRNA in eukaryotic cells is illustrated in Figure 5.
First, a tRNA gene is transcribed in the nucleolus by the enzyme RNA polymerase III. In
this step, two transcriptional factors, TFIIIB and TFIIIC, recognize and bind to the
internal promoter sequences (box A and box B) of the tRNA gene to initiate the
transcription process (Toh et al. 2001). The product from the transcription harbours
extended sequences at both ends, which are removed in the subsequent steps as described
by Phizicky and Hopper (2010). The removal of the 5’ leader takes place before the
elimination of the 3’ trailer and is carried out by endonuclease RNase P. The 3’ end
processing is catalyzed by multiple endonucleases and exonucleases. Next, CCA is added
to the 3’ end of the precursor tRNA by the enzyme tRNA nucleotidyltransferase in the
nucleus. Also, several nucleotides in this pre-tRNA sequence are modified. This
modification process is carried out at the inner nuclear membrane. Subsequently, the pre-
tRNA is exported to the cytoplasm by a protein called Los1. If the pre-tRNA contains an
intervening sequence, this intron is removed during the splicing process that takes place
at the cytoplasmic surface of the mitochondria. In the cytoplasm, more nucleotides are
modified. The modification process requires various enzymes since there are a large
number of different tRNA modifications. Finally, the mature tRNA is available in the
cytoplasm and can be charged with its corresponding amino acid. The aminoacyl-tRNA
formed by the aminoacylation reaction can then be used in the translation process.

12
Figure 5. Synthesis of tRNA in a yeast cell (reproduced from Phizicky and Hopper 2010)
(Abbreviation: INM, inner nuclear membrane)

13
1.1.4. Two special tRNAs: tRNASeC
and tRNAPyl
1.1.4.1. Selenocysteine and tRNASeC
The biosyntheses of selenocysteine (SeC) and SeC-containing enzymes as
well as functions of tRNASeC
in these processes were reviewed by Turanov et al. (2011)
and Böck (2001). Although this 21st amino acid is not commonly present in protein
sequences as compared to the 20 universal amino acids, this special residue has been
found in various enzymes from a number of species belonging to all three domains of
life: bacteria, archaea and eukarya. Many enzymes involved in methanogenesis in
Methanococcus jannaschii are SeC-containing proteins. Morever, enzymes involved in
the synthesis of thyroids hormones in some mammals have been found to contain SeC. In
addition, it has been reported that when knocking out the gene encoding tRNASeC
in
mouse, this organism cannot survive in embryogenesis stage. The codon coding for SeC
is UGA, which is generally a stop codon. To distinguish between the UGA codon coding
for SeC and the one terminating the translation process, there is a signal element named
SECIS (SeC insertion sequence) in the 3’-untranslated region of the corresponding gene.
The distance between SECIS and the SeC-encoding UGA codon is at least 55 bases and
can be up to 2.7 kb (Commans and Böck 1999; Böck 2001). The SeC insertion sequence
has a stem-loop structure that can be recognized and bind to proteins specific for the
integration of SeC into the polypeptide chain. In addition to these proteins, tRNASeC
plays an important role in the synthesis of SeC-containing enzymes since it is an adaptor
carrying SeC to the polypeptide chain. Moreover, tRNASeC
is involved in the SeC
biosynthesis process which consists of two steps. Initially, serine is attached to tRNASeC
by an aminoacylation reaction catalyzed by seryl-tRNA synthetase. Then, seryl-tRNASeC
14
is converted into selenocysteinyl-tRNASeC
by different reactions catalyzed by seryl-tRNA
synthetase as well as several other enzymes.
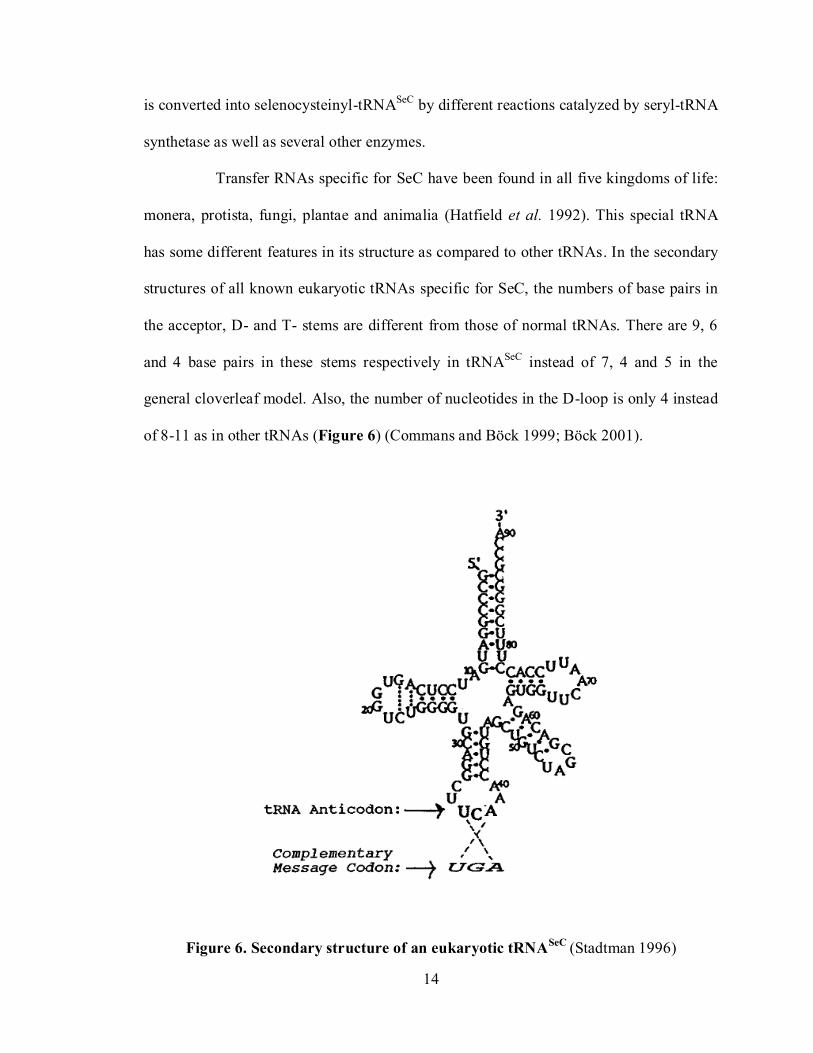
Transfer RNAs specific for SeC have been found in all five kingdoms of life:
monera, protista, fungi, plantae and animalia (Hatfield et al. 1992). This special tRNA
has some different features in its structure as compared to other tRNAs. In the secondary
structures of all known eukaryotic tRNAs specific for SeC, the numbers of base pairs in
the acceptor, D- and T- stems are different from those of normal tRNAs. There are 9, 6
and 4 base pairs in these stems respectively in tRNASeC
instead of 7, 4 and 5 in the
general cloverleaf model. Also, the number of nucleotides in the D-loop is only 4 instead
of 8-11 as in other tRNAs (Figure 6) (Commans and Böck 1999; Böck 2001).
Figure 6. Secondary structure of an eukaryotic tRNASeC
(Stadtman 1996)

15
1.1.4.2. Pyrrolysine and tRNAPyl
In addition to SeC, pyrrolysine (Pyl) is another new residue added to the
genetically encoded amino acid list. While diverse SeC-containing proteins have been
found in various organisms of three domains of life, Pyl has only been found in
methylamine methyltransferase and some transposase enzymes in a few archaeal and
bacterial species. This 22nd
amino acid is encoded by UAG, a stop codon, and Pyl-
utilizing species use UAG as a Pyl-encoding codon more effectively than a stop codon
(Zhang et al. 2005). The biosynthesis of Pyl is dissimilar from SeC since it is
independent of tRNAPyl
. In the Pyl biosynthesis process, two lysine residues are
converted to one Pyl molecule by using several enzymes including PylB, PylC and PylD.
Subsequently, tRNAPyl
is charged with Pyl in an aminoacylation reaction catalyzed by
pyrrolysyl-tRNA synthetase. The Pyl-tRNAPyl
complex can be recognized by the normal
translational elongator factor and carried to the ribosome for incorporating Pyl into the
polypeptide chain. When considering the secondary structures of tRNAs specific for Pyl
found in bacterial and archaeal organisms, there are some differences from the general
cloverleaf model since these Pyl specific tRNAs have three nucleotides in the V-loop, an
anticodon-stem containing six base pairs, a short D-loop and only one nucleotide between
D-stem and acceptor-stem (Gaston, Jiang and Krzycki 2011).
1.2. Relationships between tRNA gene number, tRNA abundance and codon usage
According to the universal genetic code, each amino acid, except for Met and Trp, is
encoded by multiple codons. However, these synonymous codons are not used equally in
most genomes (Plotkin and Kudla 2011). As reported by Ikemura (1981, 1982, 1985),
codon usage bias is not a random event. In fact, protein-encoding genes from the same
16
species tend to use similar codon usage systems, and the codon usage patterns from
different kinds of organisms do not follow the same manner. For instance, the codon
usage patterns of S. cerevisiae and E. coli are very different. Thus, each genome has its
own organism-specific codon-choice pattern. Moreover, the codon selection is highly
affected by the tRNA availability. There is a strong correlation between the abundances
of tRNAs and the occurrences of the corresponding codons in S. cerevisiae as well as in
E. coli. It is believed that this relationship is found not only in these two species but also
in many other organisms. On the other hand, it has been reported that the amount of
tRNA in the cell is closely related to the number of tRNA genes. In S. cerevisiae and B.
subtilis, the correlation coefficient values (r) of this relationship are 0.91 and 0.86,
respectively (Percudani, Pavesi and Ottonello 1997; Kanaya et al. 1999). Thus, the tRNA
gene number can be used to estimate the tRNA content in the cell. Furthermore, in S.
cerevisiae, a strong correlation was found between the tRNA gene number and the
synonymous codon occurrence (r = 0.91) (Percudani et al. 1997). Also, the number of
tRNA genes was shown to have significant relationship with the amino acid frequency in
S. cerevisiae (r = 0.84) and in C. elegans (r = 0.82) (Percudani et al. 1997; Duret 2000).
Considering individual genes, the correlation between the tRNA availability and the
codon-choice pattern is clearly found in the highly expressed genes as well as the ones
encoding abundant proteins. Codons well-matched with the anticodons of the most
abundant tRNAs are used more frequently than the other synonymous ones in these
genes; therefore, based on the amount of tRNAs and the interaction between codon and
anticodon, the most preferred codon, or optimal codon, of each amino acid can be
deduced. Since the gene numbers of different tRNAs are correlated with their

17
abundances, tRNA gene numbers in a genome sequence can be used to infer the optimal
codons for the corresponding species (Ikemura 1981, 1982; Percudani et al. 1997).
1.3. tRNA gene prediction methods
Developed in 1997, tRNAscan-SE has been the most widely used tRNA gene
prediction tool for many genome projects due to its high accuracy (Lowe and Eddy
1997). However, this tool cannot deal with genes harbouring non-canonical introns or
long introns. Hence, to improve the prediction performance, other predictors have been
created. Among them, SPLITSX shows a unique ability to detect tRNA genes containing
multiple introns (Sugahara et al. 2007). ARAGORN has an advantage in predicting tRNA
genes having long introns, which could be thousands of nucleotides (Laslett and Canback
2004). When using tRNAfinder, the intron lengths can be set by users (Kinouchi and
Kurokawa 2006). Algorithms of the four most commonly used tRNA gene prediction
programs are described below.
1.3.1. The tRNAscan-SE algorithm
tRNAscan-SE predicts tRNA genes by combining three different predictors
including tRNAscan (Fichant and Burks 1991), EufindtRNA (Pavesi et al. 1994; Lowe
and Eddy 1997), and a tRNA gene search tool using probabilistic models (Eddy and
Durbin 1994).
The first program, tRNAscan, was developed by Fichan and Burks (1991). It runs
the prediction in sequential steps, each of which examines a common feature of either
primary or secondary structure of tRNAs. If the scanning fails at any step, the prediction
will initiate in the next windowed region of the input sequence. Firstly, tRNAscan begins
by searching for T stem and loop regions from position 44 of the examined sequence. The

18
scanning is based on some conserved and semi-conserved nucleotides within the T
regions and the ability to form a loop of seven nucleotides and a stem of 4-5 base pairs.
Secondly, it scans for D-stem and D-loop in the upstream area of the identified T region.
Thirdly, sequences at the 5’end of the D-region and the 3’end of the TΨC-region are
considered to see if they can form base pairings in order to examine the aminoacyl stem
which consists of six or seven base pairings. Fourthly, the anticodon stem, which includes
four or five base pairings, is inferred from the last position at the 3’ end of D-stem. The
two stems are separated by one nucleotide. Also, the 7-nucleotide anticodon loop is
deduced from the 5’-half of the anticodon stem. In case where the four or five nucleotides
downstream of the anticodon loop cannot form base pairings with the 5’-half of the
anticodon stem, the tRNA is considered to contain an intron, which is located one
nucleotide downstream of the anticodon. The initial length of the intron is eight
nucleotides. This length is then increased one nucleotide at a time iteratively while the
program proceeds to find an appropriate 3’-half of the anticodon stem. While the size of
the intron is increased, the length of the variable loop is also considered so that it should
not be less than three nucleotides. Once the anticodon stem is found, the nucleotide
upstream of the intron, which can only be either A or G, is tested. Finally, the tRNA gene
candidate is checked for the presence of T at the 5’ end adjacent to the anticodon.
The second program, EufindtRNA, was developed by Pavesi et al. (1994).
EufindtRNA utilizes an algorithm which is based on the weight matrices and weight
vectors established from four features of a tRNA gene. These features include the A and
B boxes of the internal promoter, the distance between them and the distance between the
B box and the transcriptional termination site. The training data set used in this algorithm

19
comprises 231 tRNA genes obtained from Sprinzl (Gauss and Sprinzl 1983a, 1983b),
GenBank (Burks et al. 1992), and EMBL (Higgins et al. 1992) databases. Each value in
the matrices is calculated from the frequency of nucleotides at different positions in the A
box and B box regions. On the other hand, distances between the A box and B box and
between B box and transcription termination site are calculated for each sequence in the
training set to build the two corresponding weight vectors. Based on the weight vectors
and weight matrices, the tRNA gene search from a query sequence is carried out in
sequential steps (Figure 7). In the first step, the algorithm searches for the B box region
by calculating a B-box score which is the sum of the values from the corresponding
weight matrix of the nucleotides in the B box candidate. If the score is equal or higher
than the cut-off value, the process is subjected to the second step in which the A box
region is searched in the region of 24-139 nucleotides upstream the previously identified
B box. The A-box score is then calculated in a similar way and added to the first score to
obtain the intermediate score. If this score is higher than the threshold, the third step is
done by searching for the transcriptional termination site which contains at least four
thymidines in the region of 133 nucleotides downstream the 3’ end of the B box. In the
fourth step, the boundaries of the candidate tRNA are identified by considering six
nucleotides upstream of the A box region and 11 nucleotides downstream of the B box
region. The anticodon is identified by considering the subsequent three nucleotides of the
8-nucleotide region downstream of the A box. When using the selected cut-off values, all
of the tRNA genes in the training set are correctly detected except for those of tRNASeC
.
These special tRNAs are also detected by the algorithm with some modifications in the
threshold values and rules which are specific for the tRNASeC
in the training set.

20
Figure 7. Schematic description of the algorithm implemented by EufindtRNA
(Pavesi et al. 1994)

21
The third algorithm used in the tRNAscan-SE program was established by Eddy and
Durbin (1994). It utilizes a probabilistic model to predict tRNA genes. The probabilistic
model is built from the structural sequence alignment profile of 1415 non-redundant
tRNA sequences obtained from the Sprinzl database (Steinberg, Misch and Sprinzl 1993).
This model can present both primary and secondary structures of the tRNAs; therefore, it
is also called a covariance model. The covariance model is based on an ordered tree. To
describe an RNA structure in this tree, the base pairs are represented by the pairwise
nodes, and the nucleotides in the single strand are represented by the single nodes
(Figure 8). To describe a RNA multiple sequence alignment, each node in the tree
represents a column in the profile. The probabilistic model, or the covariance model, built
from the alignment profile is a hidden Markov model represented in the tree structure.
Therefore, a covariance model can show not only the primary structure of the sequences
in the training set but also their secondary structures. To predict a tRNA gene, an
alignment is made between the query sequence and the covariance model to obtain a
probabilistic score, which is then used to identify the prediction result. The score is
reported in bits. If it is above zero, the matching between the predicted tRNA and the
profile is more likely than a random matching. The higher the score is, the more
significant the matching is. For the intron prediction, intron sequences were manually
inserted into the Sprinzl alignment for the 38 intron-containing tRNA genes in the
training set. Therefore, a covariance model can also predict tRNA genes containing
intervening sequences.

22
Figure 8. Example of an RNA structure and its presentation in an ordered tree
(reproduced from Eddy and Durbin 1994)
((A) RNA structure; (B) Presentation of the RNA structure as an ordered tree)
Using the three described algorithms, Lowe and Eddy (1997) developed tRNAscan-
SE which predicts tRNA genes from the whole genome in different stages (Figure 9).
Firstly, tRNAscan 1.4 and EufindtRNA are used to initially detect the tRNA genes. There
was a little modification in the algorithm of EufindtRNA when it was integrated into
tRNAscan-SE. The intermediate score was decreased from -31.25 to -32.10, and the
transcriptional termination site was not searched as in the algorithm described above.

23
Moreover, the introns predicted by tRNAscan 1.4 were discarded since this program did
not report reliable introns. The transfer tRNA genes specific for SeC are predicted by
EufindtRNA. Secondly, predicted results from the two programs are combined and
subjected to the next prediction stage using the previously described tRNA covariance
model. There is a covariance model specific for tRNASeC
genes. Each of the tRNA gene
candidates from the first stage is aligned to its corresponding covariance model and gets a
probabilistic score, or the “complete tRNA” score. Those having “complete tRNA” scores
less than the threshold (20 bits) are eliminated. The others are checked to see if they are
true tRNA genes or pseudogenes. In addition, there was a hidden Markov model (HMM)
built from the same tRNA alignment profile, which was used to build the covariance
model. Unlike the covariance model, this HMM only describes the primary structures of
the tRNAs. When aligning a tRNA candidate sequence to this HMM, a “primary
structure-only” score is obtained, and the “secondary structure-only” score is calculated
as followed:
“secondary structure-only” score = “complete tRNA” score - “primary structure-only” score
The candidates having “primary structure-only” and “secondary structure-only” scores
less than the cut-off values are considered as the pseudogenes. Lastly, the secondary
structure prediction is carried out by the global structure alignments to the tRNA
covariance models. If there are more than four consecutive non-consensus nucleotides in
the anticodon loop, these are considered as those of the intron.

24
Figure 9. Description of tRNAscan-SE's algorithm
(Lowe and Eddy 1997)

25
1.3.2. The SPLITSX algorithm
Unlike other tRNA gene predictors, SPLITSX, which was developed by Sugahara et
al. (2007), can detect tRNA genes containing multiple introns which can be located in
either canonical or non-canonical locations. Firstly, it searches for BHB motifs, which
include either the canonical motif (BHB) or the non-canonical one (HBh’), in the
genomic sequences (Figure 3). The splicing sites are recognized at the two nucleotides
downstream of each strand of the central helix (H). Secondly, the intron sequences are
removed. Finally, different patterns of genomic sequences created from all possible
combinations of intron removals are subjected to the tRNAscan-SE program. The original
genomic sequences in which the predicted introns are not eliminated are also used in the
input of tRNAscan-SE. For the genes predicted in overlapping regions, the one having
the highest score, which is obtained from the covariance model, is selected.
As described by Sugahara et al. (2007), the search for BHB motifs is carried out by
using sequence homology and structure-based methods. The sequence homology search
uses several position weight matrices for sequences of the helices and bulges within the
motif structure to scan for the motif regions. These matrices were built from documented
BHB motifs. The initial candidates detected by using the position weight matrices are
then screened for the minimal BHB secondary structure which should have a four base
pair central helix (H) not having more than two mismatches, the 5’ bulge (B), and the
outer helix (h’) having length longer than one base pair. Finally, predicted BHB
structures are subjected to the RNAeval program (Schuster et al. 1994) to estimate the
free energies. Only those having free energies less than the threshold (3 kcal/mol) are
selected.

26
1.3.3. The ARAGORN algorithm
ARAGORN was developed by Laslett and Canback (2004). First, it searches for the
T-loop region by looking for the conserved sequence “GTTC” in the B box. When a non-
gapped hit is found, the flanking sequences around it are scanned to build the T-loop and
T-stem structures which are about 5-9 nucleotides and 4-5 base pairs in length,
respectively. Subsequently, the consensus sequence of a part of the A box (TRGYNAA)
is searched in the region of 28-85 nucleotides upstream of the T-stem. The region around
the A box is then considered to form a D-loop which was 5-11 nucleotides in length and
contained the sequence A-----GG-R. The A-stem from seven to nine nucleotides in length
is then formed from the regions of 2-3 nucleotides upstream of the D-stem and
immediately downstream of the T-stem. Also, the 5’-end sequence of the C-stem is
formed in the location one nucleotide downstream of the D-stem. When this 5’-half of
anticodon stem, or the C-stem, is found, its complementary strand is searched in the
region downstream of the T-stem. The V-loop is constructed from the sequence
downstream of the T-stem and upstream of the C-stem. Its length is from 3 to 25
nucleotides. Finally, the C-loop is found from the sequence between the two
complementary strands of the C-stem. Introns predicted by ARAGORN are all located in
the C-loop and could be up to 3000 nucleotides in length. Like tRNAscan-SE,
ARAGORN can also predict pseudogenes.
1.3.4. The tRNAfinder algorithm
tRNAfinder, developed by Kinouchi and Kurokawa (2006), consists of a set of
programs written in the C language to detect tRNA genes in sequential stages. First, it
searches for all possible regions that could form the secondary structure specific for

27
tRNA genes. This work is carried out in the following steps: (i) The A-stem containing
seven base pairs is identified, and those having a loop of 56-80 nucleotides between the
two 7-nucleotide complementary strands are selected. (ii) The sequence upstream of the
3’ half of the acceptor-stem is considered to see if it could form the T-loop of seven
nucleotides and a T-stem of five base pairings. (iii) The region from two nucleotides
downstream of the 5’ half of the A-stem is checked for its ability to form a D-loop of 7-
11 nucleotides, and a D-stem of 3-4 base pairings. (iv) The sequence from one nucleotide
downstream of the D-stem is checked for the ability to form a C-stem of five base
pairings and a C-loop of seven nucleotides. The V-loop is located upstream the T-stem.
When scanning for the cloverleaf structure, the base pairing between “G” and “T” is also
acceptable in addition to the two normal ones (“A-T” and “G-C”). Secondly, tRNAfinder
selects one candidate having the highest mismatch score among the overlapping ones.
This score is based on the number of mismatches found in the stems in which the score
assigned for “A-T” and “G-C” is 0, those of “G-T” and other base pairings are -1 and -5,
respectively. Thirdly, the nucleotides which are found to be conserved in experimentally
identified tRNAs from the Sprinzl database (Sprinzl et al. 1998) are checked to select
more reliable candidates. Lastly, the number of mismatches is checked again, and those
less than the threshold value are eliminated. tRNAfinder predicts only tRNA genes
containing one intron. The intron length can be set by the user.
1.4. Algorithm of Bowtie, an efficient short-read mapping tool
Bowtie is one of the most widely used tools for aligning millions of short nucleotide
sequences, or short reads, to large genomes since it is much faster and more memory-
efficient than the other alignment programs (Trapnell and Salzberg 2009). By using a
28
different indexing scheme, named Burrows-Wheeler Transform (BWT) and Index,
Bowtie has demonstrated its advantages over other short-read mapping tools. According
to Langmead et al. (2009), an index is generally built from oligomers originating from
either the query sequence or the reference genome. Therefore, for a large genome and a
huge number of query sequences, it requires much memory for storing the index and time
for searching within it. The BWT-based index used in Bowtie does not contain this large
number of oligomers. Thus, it uses much less memory space. Also, there is an efficient
algorithm helping Bowtie to search for the matches within this index in much less time
than other mapping tools. The procedure to create a BTW-based index from a reference
genome, and how to search for location of a short RNA sequence in the genome are
illustrated in Figure 10.

29
Figure 10. Overview of the short-read mapping using Bowtie
(reproduced from Trapnell and Salzberg 2009)
30
As described by Langmead et al. (2009), the BWT indexing strategy considers the
genome sequence as a string “T” which is then subjected to the Burrows-Wheeler
transformation. For example, if the string “T” is “acaacg”, the transformation is carried
out by firstly adding a character “$” to the end of the string T to form “acaacg$”.
Characters in the new string are then permuted to form an initial matrix as in Figure 11.
Indexes of rows in the initial matrix, which are called initial indexes, are kept before the
rows are alphabetically sorted. The sorted matrix is called the Burrows-Wheeler (BW)
matrix. The first column of this matrix is the “genome dictionary”, and the last one is
called the BWT.
Figure 11. Building Burrows-Wheeler Transform based index of the string
"acaacg"
(adapted from Langmead et al. 2009)
acaacg$
BW
transform
acaacg$
caacg$a
aacg$ac
acg$aca
cg$acaa
g$acaac
$acaacg
0
1
2
3
4
5
6
0
1
2
3
4
5
6
6
2
0
3
1
4
5
$ acaac g
a acg$a c
a caacg $
a cg$ac a
c aacg$ a
c g$aca a
g $acaa c
alphabetically
sort
initial
matrix
initial
index BW
matrix
initial
index new
index
Genome dictionary BWT
31
Figure 12. Description of EXACTMATCH algorithm used in Bowtie
(adapted from Langmead et al. 2009)
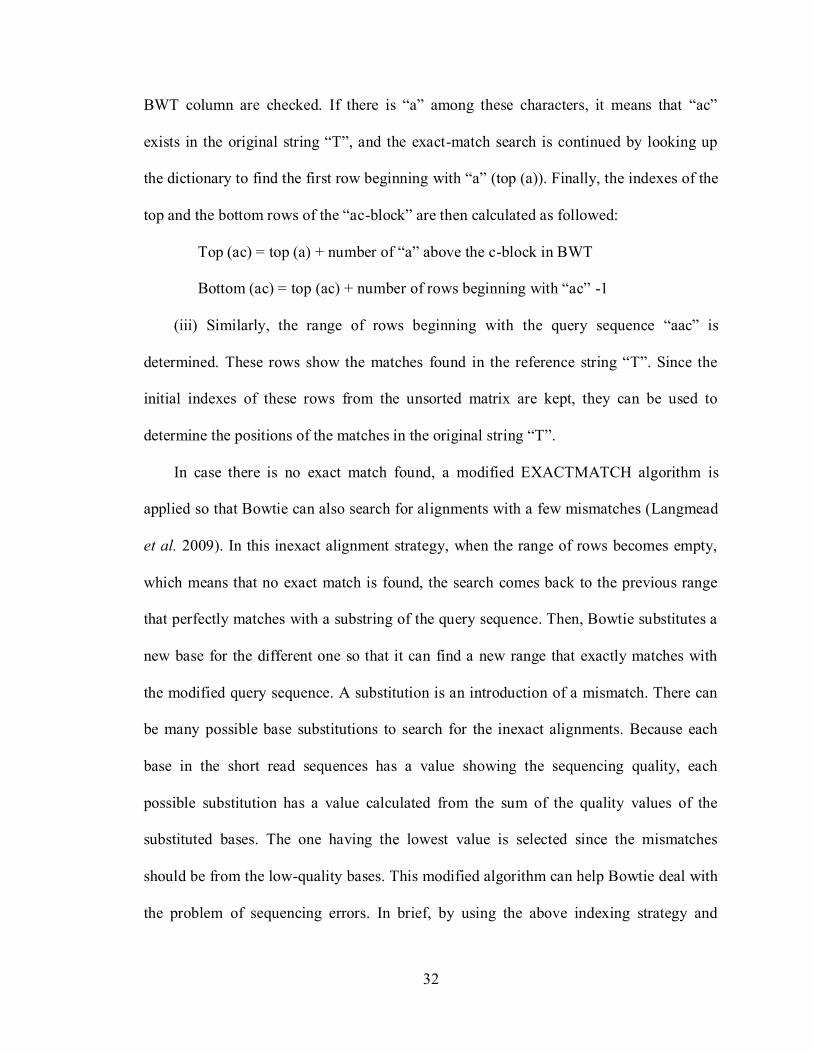
To search for exact matches of a query sequence “aac”, the EXACTMATCH
algorithm is used as outlined in Figure 12 (Langmead et al. 2009):
(i) The last character “c” of the query string is searched within the “genome
dictionary” to determine the range of rows beginning with “c”. In this case, the indexes of
the top and the bottom rows of this c-block are 4 (top (c) = 4) and 5 (bottom (c) = 5),
respectively.
(ii) In this step, the algorithm searches for a range of rows beginning with “ac”, the
two last characters of the query string. Initially, from the c-block, the characters in the
Query sequence: aac
0
1
2
3
4
5 6
6
2
0
3
1
4 5
$ acaac g
a acg$a c
a caacg $
a cg$ac a
c aacg$ a
c g$aca a
g $acaa c
BW
matrix
initial
index new
index
Top (c)=4
Bottom (c)=5
0
1
2
3
4
5 6
6
2
0
3
1
4 5
$ acaac g
a acg$a c
a caacg $
a cg$ac a
c aacg$ a
c g$aca a
g $acaa c
BW
matrix
initial
index new
index
Top (ac)=1+1=2
Bottom (ac)=2+2-1=3
acaacg (The match is located from
position 2 of the string T)
0
1
2
3
4
5
6
6
2
0
3
1
4
5
$ acaac g
a acg$a c
a caacg $
a cg$ac a
c aacg$ a
c g$aca a
g $acaa c
BW
matrix
initial
index new
index
Top (aac)=1+0=1
Bottom (aac)=1+1-1=1
32
BWT column are checked. If there is “a” among these characters, it means that “ac”
exists in the original string “T”, and the exact-match search is continued by looking up
the dictionary to find the first row beginning with “a” (top (a)). Finally, the indexes of the
top and the bottom rows of the “ac-block” are then calculated as followed:
Top (ac) = top (a) + number of “a” above the c-block in BWT
Bottom (ac) = top (ac) + number of rows beginning with “ac” -1
(iii) Similarly, the range of rows beginning with the query sequence “aac” is
determined. These rows show the matches found in the reference string “T”. Since the
initial indexes of these rows from the unsorted matrix are kept, they can be used to
determine the positions of the matches in the original string “T”.
In case there is no exact match found, a modified EXACTMATCH algorithm is
applied so that Bowtie can also search for alignments with a few mismatches (Langmead
et al. 2009). In this inexact alignment strategy, when the range of rows becomes empty,
which means that no exact match is found, the search comes back to the previous range
that perfectly matches with a substring of the query sequence. Then, Bowtie substitutes a
new base for the different one so that it can find a new range that exactly matches with
the modified query sequence. A substitution is an introduction of a mismatch. There can
be many possible base substitutions to search for the inexact alignments. Because each
base in the short read sequences has a value showing the sequencing quality, each
possible substitution has a value calculated from the sum of the quality values of the
substituted bases. The one having the lowest value is selected since the mismatches
should be from the low-quality bases. This modified algorithm can help Bowtie deal with
the problem of sequencing errors. In brief, by using the above indexing strategy and

33
algorithms, Bowtie can considerably reduce computational cost and efficiently map
billions of short reads.
1.5. Overview of aminoacyl-tRNA synthetases
1.5.1. Functions of aminoacyl-tRNA synthetases
Aminoacyl-tRNA synthetases (AARSs) are indispensable enzymes in the translation
process since they play a crucial role in the attachment between the tRNA adaptors and
their corresponding amino acids. These enzymes are also called tRNA ligases (e.g.,
leucine tRNA ligase, serine tRNA ligase, etc.) or translases (e.g., leucine translase, serine
translase, etc.). There should be at least 20 types of AARS proteins corresponding to the
20 standard amino acids (Arnez and Moras 2009). Moreover, in eukaryotic cells, some
organelles such as the chloroplasts in plants and the mitochondria have their own AARS
enzymes functioning in their translation systems (Sissler et al. 2000). The main role of all
aminoacyl-tRNA synthetases is to catalyze the aminoacylation reaction, which is specific
for each amino acid. As reviewed by Arnez and Moras (2009), the aminoacylation
reaction generally occurs in two steps (Figure 13). First, the amino acid activation is
carried out with the participation of the adenosine triphosphate (ATP) molecule and Mg2+
ions to form aminoacyl-adenylate (AA-AMP) and pyrophosphate (PPi). The latter is
released while the former is still bound to the active site of AARS. The role of Mg2+
ions
is to stabilize the conformation of the ATP molecule. It is also involved in the formation
of AA-AMP (Arnez and Moras 1997). Second, the amino acid from the AA-AMP
molecule is transferred onto either the 2’ or 3’ sugar hydroxyl group of the adenosine
nucleotide at the 3’terminal of its cognate tRNA. After the second step, an adenosine

34
monophosphate (AMP) molecule and the amino acid charged tRNA are released from the
AARS enzyme.
Figure 13. The two-step aminoacylation reaction
(reproduced from Antonellis and Green 2008)
Generally, amino acids are bound to their corresponding tRNAs directly after the
aminoacylation reaction. However, in several archaeal and bacterial species, an

35
alternative way, which is called the indirect aminoacylation pathway, is used for Asn and
Gln (Figure 14) (Ibba et al. 2000; Arnez and Moras 2009). In the indirect aminoacylation
pathway, Glu and Asp are first attached to tRNAGln
and tRNAAsn
by the activities of
glutamyl-tRNA synthetase and aspartyl-tRNA synthetase, respectively. Then, these
incorrect attachments are recognized and repaired by the enzymes glutamyl-tRNAGln
aminotransferase and aspartyl-tRNAAsn
aminotransferase respectively to form the correct
aminoacylated tRNAs (Ibba et al. 2000).
Figure 14. Indirect aminoacylation pathways
(reproduced from Ibba et al. 2000)
((a) formation of Asn-tRNAAsn; (b) formation of Gln-tRNAGln)
(GluRS and AspRS: glutamyl- and aspartyl-tRNA synthetases;
GluAdT and AspAdT: glutamyl-tRNAGln and aspartyl-tRNAAsn aminotransferases)

36
In addition to their primary function in protein synthesis, aminoacyl-tRNA
synthetases are also involved in many other activities of the cell. Some of those include
the tRNA processing, RNA splicing, RNA trafficking, rRNA synthesis, apoptosis,
transcriptional and translational regulation (reviewed by Szymanski, Deniziak and
Barciszewski 2000; Ibba and Soll 2001).
1.5.2. General characteristics of aminoacyl-tRNA synthetases and their genes
Like the cytoplasmic AARS genes, the ones encoding organellar AARSs are also
located in the nuclear genome (Sissler et al. 2000). Due to the indirect aminoacylation
pathway, some bacterial and archaeal species do not have a complete set of 20 canonical
types of AARSs. In contrast, in eukaryotic species, it is reported that cytoplasmic AARS
enzymes of the 20 specificities are found in all of these organisms (Ibba and Soll 2001).
However, similar to prokaryotic species, their set of organellar AARSs may lack some
enzymes. For example, the mitochondrial glutaminyl-tRNA synthetase is not found in S.
cerevisiae, it is likely that Gln is attached to tRNAGln
through the aminoacylation
utilizing the amidotransferase enzyme (Sissler et al. 2000). This observation is consistent
with the endosymbiosis hypothesis in which the mitochondrion had a bacterial origin
(Arnez and Moras 1997). Moreover, there may be multiple genes encoding AARS
enzymes of the same specificity. For instance, two cytoplasmic glycyl-tRNA synthetases
were detected in S. cerevisiae (Turner, Lovato and Schimmel 2000). In addition, there are
genes encoding both cytoplasmic and mitochondrial AARSs of the same specificity or
coding for bifunctional enzymes specific for two amino acids (Ibba and Soll 2001). Also,
in different organisms, organellar and cytoplasmic AARSs of the same amino acid can be

37
encoded by either the same gene or separate genes (Sissler et al. 2000). Therefore, the
number of cytoplasmic and organellar AARS genes varies across different organisms.
For the genes encoding both cytoplasmic and mitochondrial AARSs of the same
specificity, they are usually found to contain two open reading frames (ORFs) in the
same reading frame and only differing in their start codon positions. The longer ORF
encodes the mitochondrial enzyme while the shorter one encodes the cytoplasmic
enzyme. The extra sequence at the 5’ end of the mitochondrial ORF codes for the
mitochondrial targeting peptide which is necessary for the gene product to be imported
into the mitochondrion. One example of these genes is the one encoding cytoplasmic and
mitochondrial histidyl-tRNA synthetase in S. cerevisiae (Natsoulis, Hilger and Fink
1986). Moreover, there is another type of these bifunctional AARS genes, e.g. the
cytoplasmic and mitochondrial lysyl-tRNA synthetase gene in human, which forms the
two enzymes by alternative splicing patterns from the same primary transcript. Protein
products from these different splicing processes only differ by their short regions at the
amino terminus (Ambrogelly et al. 2010).
Protein sequences of AARSs of the 20 specificities vary in their lengths and amino
acid compositions (Arnez and Moras 2009). Aminoacyl-tRNA synthetases of the same
amino acid in eukaryotic organisms are usually larger than those of prokaryotic species
since they often have extended sequences at both the N- and C- termini. Functions of
these extra sequences are not fully understood. It has been shown that they play a role in
increasing the enzyme stability and are not involved in the aminoacylation reaction
(Szymanski et al. 2000).

38
When considering the primary structures of aminoacyl-tRNA synthetase enzymes,
the mitochondrial AARSs show low similarities with their cytoplasmic counterparts
while they are highly similar to those in prokaryotes. Moreover, the mitochondrial signal
peptides of mitochondrial AARSs have various lengths and amino acid compositions
(Sissler et al. 2000).
The quaternary structures of different AARSs are also diverse since some have a
single subunit while others have multiple ones, including homodimers (α2),
homotetramers (α4) and heterotetramers (α2β2) (Arnez and Moras 2009). The similar
oligomeric structures are found from AARSs of the same specificities. However, there
are some exceptions. For example, both cytoplasmic and mitochondrial glycyl-tRNA
synthetases in eukaryotic organisms contain two identical subunits (α2) while those in
prokaryotic species consist of four polypeptide chains (α2β2). Also, cytoplasmic
phenylalanine-tRNA ligases in eukaryotes are composed of four subunits (α2β2) while
those from mitochondria comprise only a single subunit (α) (Sissler et al. 2000).
As reported by Guo et al (2010), AARS enzymes are composed of multiple domains.
The central one, also called the active-site domain or the aminoacylation domain, is
present in all of the enzymes and functions in specifically identifying and binding to
amino acids, tRNAs and ATP molecules. Some AARSs have editing domains, which can
recognize the inappropriate attachment between an amino acid and a tRNA, then remove
the incorrect amino acid. It is also reported that some novel domains, which are not
related to the aminoacylation reaction, have been gradually added to eukaryotic AARSs
during evolution. These new domains are involved in various functions of AARSs in
addition to their role in protein synthesis.

39
According to the review of Arnez and Moras (2009), AARSs are classified into two
classes according to the difference in the structures of their active-site domains. Each
class includes 10 enzymes. The only exception is LysRS, which is generally a class I
AARS; however, those in archaea belong to class II (Sissler et al. 2000). The class I
enzymes share the same active site structure, which is a conventional nucleotide binding
fold, namely the Rossmann fold, and consists of parallel β sheets surrounding α helices.
Within the active site, two highly conserved motifs, “HIGH” and “KMSKS”, are found in
the ATP-binding region (Arnez and Moras 1997). The histidines (H) and lysines (K) in
these two signature sequences are important since they interact with the triphosphate of
the ATP molecule. In the aminoacylation reactions catalyzed by class I AARSs, amino
acids are transferred to the 2’OH of the 3’ terminal adenosine of the tRNA. Most of the
class I enzymes are monomeric, and only two of them have homodimers in their
quaternary structures. In contrast to class I AARSs, all class II enzymes contain multiple
subunits, which are mostly homodimers. Two of them, alanyl-tRNA synthetase and
phenylalanyl-tRNA synthetase are homotetrameric and heterotetrameric, respectively.
Most of them attach amino acids to their cognate tRNAs at the 3’OH group of the 3’
terminal adenosine. Only phenylalanyl-tRNA synthetase forms the bond between the
amino acid and tRNA at the 2’OH group. The active site structure of the class II AARSs
include seven-stranded antiparallel β sheets surrounded by α helices. Within this
structure, three conserved motifs are found. The motif 1 sequence, which contains a
strictly conserved proline (P), primarily forms the dimer interface. The motif 2 and motif
3 also contain some conserved amino acids and are involved in positioning the amino
acid and the ATP molecule.

40
1.6. Rationale for this study
Myceliophthora thermophila has drawn much attention because its ability to work
efficiently at elevated temperatures, an environment suitable for many industrial
processes. This organism is currently being used as a protein-production host in the
enzyme manufacturing industry (Hans et al. 2011). Moreover, M. thermophila is the first
filamentous fungus with a finished genome sequence and the first thermophilic eukaryote
sequenced (Berka et al. 2011). The availability of a complete genome sequence provides
us with the opportunity to study the gene complements related to specific cellular
processes systematically. To gain insights into the translation system of M. thermophila
and find out why this fungus is such a good host organism for protein production, this
study focuses on analyzing the genes encoding tRNAs and AARS enzymes, two
indispensable components of the protein synthesis machinery in all organisms. Firstly,
these genes are predicted in the genome sequence by different bioinformatics tools. Then,
the reliability of the prediction is evaluated by comparing the predicted gene models to
the sequenced transcriptome data as well as to sequences of experimentally characterized
tRNAs and AARSs collected from the literature. From the complete set of reliable
cytoplasmic tRNA genes, the optimal codons encoding each amino acid can be deduced,
which can potentially be used for the codon optimization process to improve the protein
production capacity of M. thermophila. Moreover, when the complete set of tRNA genes
is found, its relationship with the tRNA abundance as well as the codon usage can be
examined. Furthermore, genes detected from the nuclear genome of M. thermophila in
this study can be added to the reliable data sets of tRNA and AARS genes.
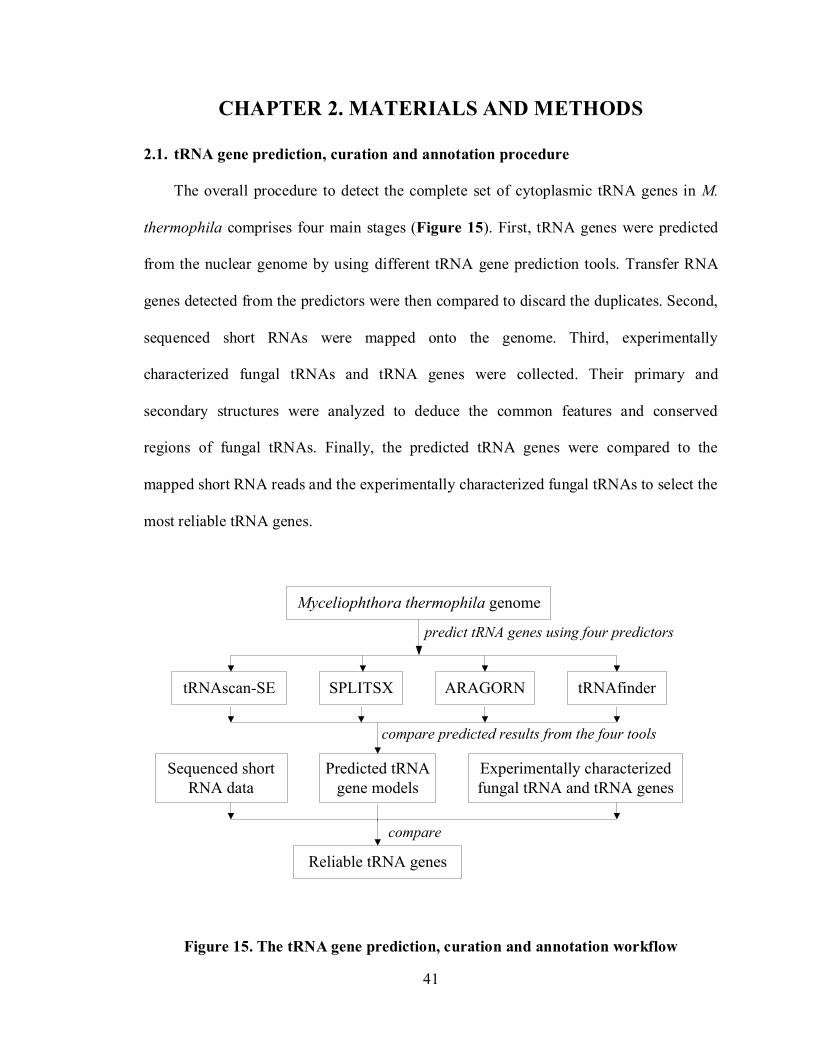
41
CHAPTER 2. MATERIALS AND METHODS
2.1. tRNA gene prediction, curation and annotation procedure
The overall procedure to detect the complete set of cytoplasmic tRNA genes in M.
thermophila comprises four main stages (Figure 15). First, tRNA genes were predicted
from the nuclear genome by using different tRNA gene prediction tools. Transfer RNA
genes detected from the predictors were then compared to discard the duplicates. Second,
sequenced short RNAs were mapped onto the genome. Third, experimentally
characterized fungal tRNAs and tRNA genes were collected. Their primary and
secondary structures were analyzed to deduce the common features and conserved
regions of fungal tRNAs. Finally, the predicted tRNA genes were compared to the
mapped short RNA reads and the experimentally characterized fungal tRNAs to select the
most reliable tRNA genes.
Myceliophthora thermophila genome
tRNAscan-SE SPLITSX ARAGORN tRNAfinder
Sequenced short
RNA data
Predicted tRNA
gene models
Experimentally characterized
fungal tRNA and tRNA genes
Reliable tRNA genes
predict tRNA genes using four predictors
compare predicted results from the four tools
compare
Figure 15. The tRNA gene prediction, curation and annotation workflow

42
2.1.1. Predicting tRNA genes
Transfer RNA genes were detected from the nuclear genome of M. thermophila
which was the unmasked genome assembly version 2 and was downloaded from the
website of the United States Department of Energy (DOE) Joint Genome Institute (JGI)
(http://genome.jgi.doe.gov/Spoth2/Spoth2.download.html). To reduce the possibility of
missing true tRNA genes, all of the four most widely used tRNA gene predictors –
tRNAscan-SE version 1.3 (Lowe and Eddy 1997), SPLITSX (Sugahara et al. 2007),
ARAGORN (Laslett and Canback 2004) and tRNAfinder (Kinouchi and Kurokawa 2006)
– were used in this study. Since tRNAscan-SE program can predict tRNA genes in
eukaryotic, prokaryotic and archaeal genomes, the parameter specific for eukaryotic
genomes was used when predicting tRNA genes from M. thermophila. All of the other
parameters were set to default values. When running SPLITSX, the default values for
parameters were selected except for “-d”, the possible number of introns in each tRNA
gene. In this study, “-d” was set to 3, which was the maximal number of introns that
SPLITSX could detect. The parameters used when running ARAGORN were as
followed:
“–t –gcstd –i –io –rp –seq –br”.
where –t : search for tRNA genes
–gcstd : use standard genetic code
–i : search for tRNA genes containing introns (When this parameter is
selected, ARAGORN detects tRNA genes having intron lengths from
0 to 3000 nucleotides. Otherwise, ARAGORN only predicts tRNA
genes not containing introns.)

43
–io : allow tRNA genes with long introns to overlap the shorter ones
–rp : report possible pseudogenes
–seq : print out primary sequence
–br : show secondary structure of the tRNA genes using round brackets
When running tRNAfinder, the parameters were set to default values except for the
maximum length of introns. The default value of intron length parameter is zero.
Therefore, it is necessary to increase this value so that tRNAfinder can detect intron-
containing tRNA genes. The intron length parameter strongly affects the time of the
prediction process as well as the memory for storing output data. The cost of time and
memory increases with the length of introns. Since intron lengths of the fungal
cytoplasmic tRNA genes in tRNAdb database do not exceed 100 nucleotides (Juhling et
al. 2009), the maximum intron length parameter was set to 100. Finally, tRNA genes
predicted from the four programs were compared by using a Perl script to discard
identical results. The final predicted data set contains unique tRNA genes which may
differ in their gene positions, intron positions, anticodons or assigned amino acids. The
pseudogenes reported from the tools were also included in the predicted data set for
further analyses.
2.1.2. Processing and mapping sequenced short RNA data
2.1.2.1. Processing the sequenced short RNA data
To obtain the tRNA transcripts for sequencing, 2.5µg of total RNAs extracted
from M. thermophila were resolved by gel electrophoresis, and short RNA molecules (~
40-114 base pairs) were excised. This sample containing short RNAs was sequenced by

44
using the Illumina RNA-Seq sequencing method in the University of Missouri DNA Core
Facility (http://biotech.rnet.missouri.edu/dnacore/).
Figure 16. Overview of the short RNA sequencing process
((N): sequence of the short RNA; (N’): complementary sequence of the short RNA)
5’-adapter 5' AATGATACGGCGACCACCGACAGGTTCAGAGTTCTACAGTCCGACGATC
3’-adapter ATCTCGTATGCCGTCTTCTGCTTG 3’
RNA sequence (N)
ligate ligate
Creating cDNA library
Final construct of cDNA library
5' AATGATACGGCGACCACCGACAGGTTCAGAGTTCTACAGTCCGACGATC (N) ATCTCGTAT GCCGT CTTCTGCTT G 3’
3' TTACTATGCCGCTGGTGGCTGTCCAAGTCTCAAGATGTCAGGCTGCTAG (N’) TAGAGCATACGGCAGAAGACGAAC 5'
Denature the double stranded cDNA molecules
5' AATGATACGGCGACCACCGACAGGTTCAGAGTTCTACAGTCCGACGATC (N) ATCTCGTATGCCGT CTT CT GCTT G 3’
3' TTACTATGCCGCTGGTGGCTGTCCAAGTCTCAAGATGTCAGGCTGCTAG (N’) TAGAGCATACGGCAGAAGACGAAC 5'
3' TTACTATGCCGCTGGTGGCTGTCCAAGTCTCAAGATGTCAGGCTGCTAG (N’) TAGAGCATACGGCAGAAGACGAAC 5'
CTTCTGCTTG
flowcell
Binding to the flowcell’s surface
3' TTACTATGCCGCTGGTGGCTGTCCAAGTCTCAAGATGTCAGGCTGCTAG (N’) TAGAGCATACGGCAGAAGACGAAC 5'
CCGACAGGTTCAGAGTTCTACAGTCCGACGATC CTTCTGCTTG
(sequencing primer) (sequencing direction)
Sequencing
120-base read sequences

45
Figure 16 illustrates an overview of the sequencing process. First, 5’-adapters and 3’-
adapters were ligated at the two endings of short RNAs. After the cDNA library was
established, each double stranded DNA molecule in the library was denatured to form
two single stranded DNAs. The strand complementary to the original short RNA
sequence bound to the flowcell while the other strand was discarded. The flowcell
contained a short oligonucleotide that hybridized to a part of the 3’ adapter. The
sequencing was carried out by using a sequencing primer complementary to a fragment at
the 3’ end of the 5’-adapter. Next, the sequence of 120 nucleotides downstream of the 5’
adapter was sequenced. Therefore, the short read data contained sequences of short RNAs
and 3’-adapters. For example, if the length of the short RNA was 100 nucleotides in
length, and we obtain a 120-nucleotide read, the extra 20 nucleotides at the 3’ end of the
read are from the 3’-adapter. Accordingly, sequences of the 3’-adapters and any
nucleotides downstream of them were trimmed from the sequenced RNAs before using
the sequenced short RNA data for the tRNA gene curation and annotation.
2.1.2.2. Mapping short RNA data to the genome of M. thermophile
After trimming the adapter sequences, the short reads were aligned to the
genome of M. thermophila using Bowtie (Langmead et al. 2009) and BLAT (Kent 2002)
programs successively. Reads already mapped to the genome by Bowtie were not used in
the mapping using BLAT. Since Bowtie can map millions of short reads to a large
genome much faster than the other sequence alignment programs, it is used in the first
stage of the mapping. However, since the version of Bowtie used in this study does not
support gapped alignment, many of the reads containing the splice-junctions between

46
introns and exons may not be mapped correctly. For that reason, BLAT is used in the
second stage of the mapping because this tool can deal with the gapped alignment.
BLAT uses an index comprising non-overlapping oligomers from the
reference genome and linearly scans the query sequence to find the matching regions.
Then, it extends these matches to obtain larger alignments (Kent 2002). Compared to the
index building strategy and method used for searching the matches from Bowtie, BLAT
requires more memory space and time. However, since the majority of the reads were
mapped by Bowtie, the number of the remaining reads was small enough for BLAT to
work well. The advantage of BLAT is that it allows alignments with large gaps, which is
helpful for the identification of intron regions.
2.1.3. Collecting and analyzing experimentally characterized fungal tRNAs and
tRNA genes
2.1.3.1. Selecting databases to collect experimentally characterized fungal
tRNAs and tRNA genes
Several databases of tRNA and tRNA gene sequences have been published
and used in the study of tRNAs. Those include the “Compilation of tRNA sequences and
sequences of tRNA genes”, also called Sprinzl database (Sprinzl and Vassilenko 2005),
the Genomic tRNA database (GtRNAdb) (Chan and Lowe 2009), the tRNA gene
database curated manually by experts (tRNADB-CE) (Abe et al. 2011), and the transfer
RNA database (tRNAdb) (Juhling et al. 2009). First established in 1978, many updated
versions of the Sprinzl database have been published (Sprinzl et al. 1982; 1983a, 1983b;
1984; 1985; 1987; 1989; 1991; 1993; 1996; 1998; 2005), and this database has been
widely used as a reliable dataset of “true positives” in tRNA gene detection research

47
(Eddy and Durbin 1994; Pavesi et al. 1994; Lowe and Eddy 1997; Laslett and Canback
2004; Kinouchi and Kurokawa 2006). However, the website provided in the publication
of the latest release of this compilation, which was published in 2005, is not accessible.
For the GtRNAdb, tRNA genes from this database are all automatically predicted by
tRNAscan-SE program (Chan and Lowe 2009). Similarly, most of the tRNA genes from
tRNADB-CE are predicted by tRNAscan-SE, ARAGORN and tRNAfinder. Only tRNA
genes that are differently predicted by the three tools are curated manually by experts;
however, they are still predicted genes (Abe et al. 2011). Therefore, GtRNAdb and
tRNADB-CE are not good resources for experimentally identified tRNAs. The tRNAdb
database is, in fact, a new version of the Sprinzl compilation updated in 2009 (Juhling et
al. 2009). It contains both experimentally and automatically identified tRNA and tRNA
gene sequences. The sequences in this database are phylogenetically categorized so that
users can easily select those belonging to fungi as well as other group of species for
further study. For these reasons, tRNAdb (http://trnadb.bioinf.uni-leipzig.de/) is selected
as a good source for the experimentally characterized fungal tRNAs and tRNA genes.
Each entry in tRNAdb provides the literature on the identification of the
corresponding tRNA sequence. Hence, from these papers, along with the related ones
from the PubMed database (http://www.ncbi.nlm.nih.gov/pubmed/), the fungal tRNA
sequences were examined to determine which ones are the most reliable and can be used
in the “true positive” dataset for the tRNA gene annotation.
2.1.3.2. Assigning GO evidence codes
Properties of each tRNA gene product collected from the literature were
assigned by using the terminologies established from the Gene Ontology (GO) Project

48
(Ashburner et al. 2000). These properties refer to three aspects: the Molecular Function,
the Biological Process and the Cellular Component. When a GO term is assigned, a GO
evidence code is given to show the available evidence supporting the assignment. The
terms deduced from experimental assays are the most reliable. Their GO evidence codes
are usually IDA (Inferred from Direct Assay), IMP (Inferred from Mutant Phenotype),
IGI (Inferred from Genetic Interaction), IEP (Inferred from Expression Pattern) and IPI
(Inferred from Physical Interaction). For those inferred from computational experiments
and statements from the authors in the literature, the ones having the GO evidence codes
TAS (Traceable Author Statement) and IGC (Inferred from Genomic Context) are
considered to be reliable. For those having the code ISS (Inferred from Sequence
Similarity), the reference sequence is checked to see whether it is trusted or not. The GO
evidence codes determined in this study were according to the decision tree in Figure 17.
Based on the GO terms for the three aspects, and their corresponding GO evidence codes,
each tRNA gene collected from the literature was determined whether it is experimentally
characterized or not. For example, if a tRNALys
gene has the GO terms “AAG codon-
amino acid adaptor activity” for the Molecular Function aspect, “Lysyl-tRNA
aminoacylation” for the Biological Process aspect and “cytoplasm” for Cell Component
aspect, and the corresponding evidence codes are IDA, IDA, IGC respectively, it is
considered to be a reliable gene since the three GO terms demonstrate the properties of a
cytoplasmic tRNALys
gene and the evidence codes indicate that these properties are
supported by experimental data. After collecting the fungal tRNA genes from the
literature, only the experimentally characterized ones which were located in the
cytoplasm were kept in the “true positive” dataset.

49
Figure 17. GO evidence code decision tree (reproduced from The Gene Ontology 1999)
Curator reviewed annotations Annotation NOT reviewed by a curator
yes
Computational method
Will each annotation be
individually reviewed and
confirmed by a human curator?
yes
Is the computation based purely on the sequence of the gene product (or
sequence-based mapping files)?
no
Does the computation include consideration of the genomic context
of the gene?
no
Is the computation an integrated analysis, typically including
experimental data sets, and often including multiple data types?
IEA
ISS yes
IGI yes
ICA
no
yes
yes
no
Is annotation based on a direct assay for the function, process, or component of the
gene product?
yes IDA
IEP
Experimental (wet lab)
Is annotation based on genetic mutations or allelic variation?
yes no
Is a single gene being mutated or compared
to other allelic of the same gene?
Is more than one gene being
mutated in the same strain?
Is annotation based on a direct 1 to 1 physical
interaction with another gene product?
no
IGI
yes IPI
yes IMP
yes
no
No evidence available
Is there a GO annotation in another aspect that
allows you to make an inference based on that
GO term for an aspect without evidence?
Have you been able to find any evidence to
support a GO annotation in a given GO aspect?
ND
IC
Author statement from publication
Is annotation based on an author statement that cites a published reference as the
source of information?
no
Is annotation based on an author statement that does not cite a published reference as
the source of information?
NAS yes
TAS yes
Is annotation based on the expression
pattern of the gene product?
no
no

50
2.1.3.3. Collecting and analyzing primary and secondary structures of the
experimentally characterized tRNAs and tRNA genes
Transfer RNA sequences in tRNAdb contain modified nucleotides represented
by the characters such as K, L, D, I, etc., which are different from the normal nucleotides
(A, U, G, C). Therefore, the unmodified tRNA sequences obtained from GenBank
database (http://www.ncbi.nlm.nih.gov/genbank/) were collected and used in the
sequence analysis. After removing CCA at the 3’end, the collected tRNA sequences were
used as query sequences in the BLAST searches against the corresponding fungal
genomes to find their gene locations and their paralogs. The genomes used in this
analysis were from the following fungal organisms: Saccharomyces cerevisiae S288c,
Candida albicans SC5314, Neurospora crassa OR74A, Candida guilliermondii,
Podospora anserina S mat+ and Schizosaccharomyces pombe 972h-. These genome
sequences were downloaded from the GenBank database, the Broad Institute’s website
(http://www.broadinstitute.org/) and the Candida Genome Database (CGD)
(http://www.candidagenome.org/). From the gene locations found in the BLAST search
results, the regions downstream of the genes were manually examined to determine the
transcriptional termination sites, which should contain at least four consecutive
thymidines.
For the primary sequence analysis, unique tRNA gene sequences were
subjected to the multiple sequence alignment (MSA) to create an MSA profile which was
then used to build a phylogenetic tree to show the relationships between the same type of
tRNA genes from different fungal species, and between different types of tRNA genes
from the same species. The ClustalW program integrated in the MEGA (Molecular
51
Evolutionary Genetics Analysis) program was used for the alignment (Thompson, Gibson
and Higgins 2002; Tamura et al. 2011). The tree was constructed and evaluated by using
the Maximum Likelihood method and the bootstrap analysis (Felsenstein 1981, 1985).
The number of bootstrap replications was 500. Moreover, sequences of the two internal
promoters of the characterized tRNA genes were compared to determine the consensus
sequences by running the Weblogo program (Crooks et al. 2004). The A box and B box
sequences were trimmed from position 8 to 19 from the 5’ end, and from position 12 to
22 from the 3’ end of each tRNA gene, respectively.
For the secondary structure analysis, cloverleaf models of the experimentally
identified tRNAs were collected from the literature. Subsequently, separate sets of
oligonucleotides of each of the stems and loops were extracted from the cloverleaf
structures and subjected to the Weblogo program (Crooks et al. 2004) to find conserved
positions and consensus sequences.
To investigate the relationship between the four transposable elements (TE)
(delta, sigma and tau elements) and tRNA genes, these TEs were used as query
sequences in the BLAST search against the six fungal genomes mentioned above. Next,
all of the TE locations reported from the BLAST search results were analyzed to examine
how many of the tRNA genes were located adjacent to them. If a majority of the tRNA
genes are close to the TE regions in the genomes, these elements can be used as good
indicators for the tRNA gene annotation.
2.1.4. Manual curation and annotation of tRNA genes in M. thermophila
The manual curation and annotation procedure consists of three main stages in which
the gene models, the primary and secondary structures of predicted tRNA genes are

52
examined. In the first stage, tRNA gene models predicted by the four tRNA gene
prediction tools were compared with the sequenced short RNAs that were mapped onto
the genome. To visualize the gene models and short read data, the Generic Genome
Browser (GBrowse) (https://reviewers.fungalgenomics.ca/gene_model_pages/tRNA_
Table.html), a web-based application commonly used for showing features and
annotations of genomes (Stein et al. 2002), was employed (Figure 18). A tRNA gene is
more likely to be correctly predicted if its gene model is well-matched with the read
coverage. Besides, the more reads mapped onto a predicted tRNA gene region, the higher
likelihood that this gene is a true tRNA gene. Also, the number of reads mapped onto the
exons should be much higher than those mapped onto the introns. In addition to the read
coverage, sequences of the reads aligned to the predicted tRNA genes are also examined.
If the 3’-CCA tail is found in the short RNA sequences, it is a good indicator for a true
tRNA gene since CCA is added at the 3’ end of tRNAs after the transcription process
(Phizicky and Hopper 2010). Moreover, some genes predicted from the four tools are
different only from their ending positions. The 3’-CCA tail indicator can help to
determine which tool reports the most accurate results in these cases. After the first stage,
tRNA genes that have gene models matching with the short RNA coverage are selected
for further analyses. For the gene models that do not perfectly match with the short read
coverage, they are subjected to the second stage of the tRNA gene annotation if there is
evidence found for the expression of these genes in the transcriptome data such as the
high number of mapped reads or the presence of the 3’-CCA tail.

53
Figure 18. Comparing predicted tRNA gene models and sequenced short RNA data on GBrowse
(Nucleotides highlighted in red color are mismatches when mapping short RNA sequences onto the genome. Since nucleotides of the
3’-CCA tail are not encoded by the genome, they are frequently found as mismatches in the mapped read sequences.)

54
In the second stage, the primary structures of tRNA genes were examined by comparing
sequences of the A box and B box with the consensus ones deduced from the
experimentally characterized fungal tRNA genes. Moreover, the genomic region
downstream of each tRNA gene is checked to see if the transcriptional termination site
can be found within this region. In the third stage, the predicted secondary structure of
each tRNA gene was examined by checking the conserved and semi-conserved positions
in stems and loops of the cloverleaf model. These conserved and semi-conserved
nucleotides were found from the secondary structure analysis of the experimentally
identified fungal tRNAs. The predicted intron regions were also considered in this step.
The tRNA genes having introns, which are located one nucleotide downstream of the
anticodon, are likely to be more reliable since all of the introns in the fungal tRNA genes
collected from the literature in this study are located in this position. Finally, by
combining evidence from the transcriptome data, the primary and secondary structure
analyses, the data set of reliable tRNA genes from the M. thermophila genome was
obtained.
2.2. AARS gene curation and annotation procedure
An overview of the AARS gene detection procedure is illustrated in Figure 19. First,
reliable aminoacyl-tRNA synthetases from different databases were collected and
analyzed to determine the common features of the AARS gene family. Then, the
collected AARSs were used as query sequences in the BLASTP search against the 11,342
protein sequences which were predicted from the nuclear genome of M. thermophila and
were provided by the Genozymes project. Significant hits found from the BLASTP
search were considered as AARS gene candidates. Next, the gene models of these

55
candidates were examined and compared to the transcriptome data on GBrowse.
Moreover, protein sequences of the AARS candidates were analyzed to see whether they
satisfied features specific for either cytoplasmic or mitochondrial AARSs. Finally, by
combining results from the BLASTP search, transcriptome data analysis and protein
sequence analysis, the most reliable AARS genes of M. thermophila were determined.
Figure 19. Overall procedure of the AARS gene detection in M. thermophila
2.2.1. Collecting and analyzing reliable aminoacyl-tRNA synthetases
2.2.1.1. Collecting experimentally characterized fungal cytoplasmic AARSs
The experimentally characterized fungal cytoplasmic AARSs were collected
from various databases presented in Table 1. References related to each of the collected
Collecting well-documented AARSs
Reliable AARSs Predicted proteins from M.thermophila
BLASTP
AARS gene candidates
Transcriptome data
Protein sequence analysis
Manual curation and annotation
Reliable AARS genes
from M.thermophila

56
AARS sequences were examined to select only the AARSs that were experimentally
characterized.
Table 1. Databases used in the search for experimentally characterized fungal
cytoplasmic AARSs
Database name Websites
Saccharomyces Genome Database (SGD) http://www.yeastgenome.org/
Candida Genome Database (CGD) http://www.candidagenome.org
UniProt http://www.uniprot.org/
GenBank and GenPept databases from NCBI (National Center for Biotechnology Information)
http://www.ncbi.nlm.nih.gov/
GeneDB http://www.genedb.org/
BRENDA http://www.brenda-enzymes.info/
Aminoacyl-tRNA synthetase database http://biobases.ibch.poznan.pl/aars/
2.2.1.2. Collecting other reliable AARSs
Since there were few fungal cytoplasmic AARSs experimentally identified in
the databases, it was necessary to search for other reliable AARSs. This second search
was done within the UniProt database. Entries of all aminoacyl-tRNA synthetases in
UniProt were downloaded. The GO terms and GO evidence codes of these AARSs were
checked. Only the ones having GO terms specific for AARSs and having reliable GO
evidence codes at the three aspects (Molecular Function, Biological Process and
Component) were selected. This search included both cytoplasmic and mitochondrial
AARSs from all organisms.
2.2.1.3. Sequence analysis of the characterized AARSs

57
Sequences of all characterized AARSs were subjected to the multiple
sequence alignment using ClustalW (Thompson et al. 2002). The MSA profile was then
used to build a phylogenetic tree which showed the similarity between different types of
AARSs from various species. The Neighbor–Joining method (Saitou and Nei 1987) and
the bootstrap analysis (Felsenstein 1985) were applied for constructing and evaluating the
tree.
To search for the signature motif regions of the characterized AARSs, amino
acid sequences of the same AARS type were aligned to obtain MSA profiles of different
specificities. Then, based on these MSA profiles and the AARS signature motifs found
by Eriani et al. (1995), the motifs of the characterized AARSs were inferred.
To check if all of the characterized mitochondrial AARSs contain the
mitochondrial targeting peptide (mTP) at the N-terminus of their amino acid sequences,
the mTP detection was performed on all characterized mitochondrial AARS sequences by
the TargetP program (Nielsen et al. 1997; Emanuelsson et al. 2000)
2.2.2. Manual curation and annotation of AARS genes in M. thermophila
Significant hits found from the BLASTP search which used the characterized AARSs
as queries and searched against predicted protein sequences of M. thermophila were
manually examined by checking their transcriptome data and their sequence
characteristics. First, the gene models of these hits were compared to the sequenced
mRNAs that were previously mapped onto the genome (Figure 20). The gene models
and the mapped mRNA data were provided by the Genozymes project and were
displayed on GBrowse (https://reviewers.fungalgenomics.ca/gene_model_pages/AARS_
Table.html). The gene models from the Joint Genome Institute (JGI) were also used in

58
this manual curation. Only gene models well-matched with the transcript coverage were
selected. There should be many more mRNA sequences mapped to the exon regions as
compared to those mapped to the intron regions.
Figure 20. Comparing AARS gene models and transcriptome data on GBrowse
Secondly, the nucleotide sequences of these gene models were examined by checking
their start and stop codons as well as the intron splicing sites. There should not be any
stop codons present within the exon regions. Also, the introns should begin with “GT” at
the 5’ end and end with “AG” at the 3’end according to the “GT-AG” rule suggested by
Chambon (Breathnach and Chambon 1981). Next, protein sequences of the genes
selected from the first two steps were checked to see whether they had the signature
motifs specific for AARS enzymes. Moreover, the mTPs were searched within amino
acid sequences of the AARS candidates to determine whether they had cytoplasmic or
mitochondrial functions or both of these functions. It should be noted that some AARS
genes may encode both mitochondrial and cytoplasmic AARS enzymes of the same
specificity such as the genes encoding mitochondrial and cytoplasmic valyl-tRNA
synthetase and histidyl-tRNA synthetase in S. cerevisiae (Natsoulis et al. 1986; Chatton

59
et al. 1988). Hence, if the protein sequence of an AARS gene contains an mTP at its N-
terminus, and it is more similar to cytoplasmic AARSs than to the mitochondrial AARSs,
it is likely that the protein has both cytoplasmic and mitochondrial functions.
Since the BLASTP search is based on the predicted proteins of M. thermophila, it
may be possible that some genes are missed during the protein-encoding gene prediction.
Accordingly, some AARS genes may also be missed due to the incorrect gene prediction.
To address this issue, the TBLASTN search was carried out against the whole genome of
M. thermophila using the characterized AARSs as query sequences. Results from the
BLASTP and TBLASTN searches were compared to ensure that no genomic region
possibly encoding AARSs is missed.
2.3. Calculating the effective number of codons (Nc)
The method to calculate the effective number of codons was proposed by Wright
(1990). When calculating Nc values, 20 amino acids are classified into five different
synonymous families (SF), each of which consists of the amino acids having the same
number of synonymous codons (Table 2).
Table 2. The synonymous families and the amino acids in each family
Family name(*)
Number of
synonymous codons Amino acids
Number of amino
acids
SF1 1 Met, Trp 2
SF2 2 Asn, Asp,Cys, Gln, Glu,
His, Lys, Phe, Tyr 9
SF3 3 Ile 1 SF4 4 Ala, Gly, Pro, Thr, Val 5 SF6 6 Arg, Leu, Ser 3
(*) The number in the family name shows the number of synonymous codons of amino
acids in each family

60
Contribution of an amino acid j (Fj) to the overall codon usage of a gene X is estimated
according to the formula (1).
(1)
where n : the number of amino acid j in the sequence of gene X
k : the number of synonymous codons of amino acid j (e.g. kAla = 4)
pi : frequency of codon i among its synonymous codons (if ni is the number of
codon i in gene X, then pi = ni/n)
The Nc value of the gene X is calculated as followed:
(2)
where , , : the average of Fj values of the amino acids in the family SF2, SF4 and
SF6, respectively
If an amino acid does not exist in the gene, the calculation only considers the ones
that are present. If Ile is absent or rarely used in the gene, the value of F3 is calculated as
the average of and .
An Nc of a gene takes the values from 20 to 61. When Nc is equal to 20, it indicates
that the codon usage of the gene is extremely biased since it utilizes only one codon to
code for each amino acid. In contrast, when Nc is equivalent to 61, the gene does not have
codon bias (Wright 1990). In this study, the Nc values were calculated by using the
codonW 1.4.2 program (Peden 2005).
2.4. Determining preferred codons
The preferred codons were deduced by combining the results from three methods.
The first method was based on 420 protein-encoding genes having the highest gene
expression levels in M. thermophila. The 101,727 codons from the mRNA sequences of

61
these genes were classified into groups according to the amino acid specificity. The
codon having the highest percentage in each group was considered as the preferred codon
of the corresponding amino acid. For instance, if the percentages of four codons coding
for Ala (GCT, GCC, GCA and GCG) are 10%, 20%, 5% and 65%, respectively, the
preferred codon of Ala would be GCG. The second method was based on the complete
set of tRNA genes. Transfer RNA genes in each isoacceptor family were classified into
anticodon specific groups. The group having the highest number of tRNA genes in each
isoacceptor family was selected for further analysis. It has been reported that although a
tRNA can decode multiple codons due to the Wobble base pairing, it mainly decodes the
codon which it perfectly matches (Percudani et al. 1997). Hence, among codons
recognized by tRNAs in a selected group, the perfectly matched codon was considered as
the preferred codon of the corresponding amino acid. It should be noted that in tRNAs
having nucleotide “A” at their anticodon wobble position, this nucleotide is frequently
converted into “I” during the post-transcriptional modification (Percudani et al. 1997).
Unlike “A”, which substantially forms base pairing with “U”, “I” favourably matches
with either “U” or “C” (Ikemura and Ozeki 1983). Therefore, when searching for the
codon well-matched with a tRNA having “A” at its wobble position, the codons
terminated by either “C” or “U” were preferentially considered. The third method was
based on a set of protein-encoding genes having Nc values lower than 31. Due to the low
Nc values, these genes obviously show that they have bias in their codon usage. Similar to
the first method, codons from this gene set were classified into amino acid specific
groups, and percentages of codons in each group were calculated. The codon having the
highest percentage in each group was selected as a preferred codon. Finally, results from

62
the three methods were compared to select the final set of preferred codons. Since Met
and Trp are encoded by only one codon, they are not included in the preferred codon
selection.
2.5. Analyzing relationships between tRNA gene number, tRNA abundance and
codon usage
The relationships between tRNA gene number, tRNA abundance and codon usage
are examined by using the Pearson correlation analysis. A correlation coefficient value
(r), which ranges from -1 to 1, is calculated for each of the relationships. If the value of r
is less than zero, it means that the two entities in the analysis are negatively correlated.
Otherwise, they are positively correlated. The higher the absolute value of r is, the
stronger the correlation of the two entities is. Along with the r value, the p value, which
shows the probability that the correlation is found by chance, is calculated. Generally, a
correlation is considered to be statistically significant when its p value is lower than 0.05.
To calculate the r and p values, the SPSS v.20 (Statistical Package for the Social
Sciences) program (http://www-01.ibm.com/software/analytics/spss/) is used. In all of the
correlation analyses in this study, the selenocystein tRNA (tRNASeC
) was not included.
2.5.1. Relationship between tRNA gene number and tRNA abundance
The tRNA abundance was calculated from the number of short RNAs mapped onto
exon regions of the tRNA genes. One problem of this calculation is that it depends on the
lengths of the tRNAs because a long tRNA may have more reads mapped onto it than a
shorter one although their gene expression levels are similar. To solve this problem, the
original read count number was transformed into the FPKM value, which was the number
63
of Fragments Per Kilobase of exon per Million fragments mapped (Mortazavi et al.
2008). Each tRNA gene has an FPKM value calculated from its mapped reads.
To determine the relationship between tRNA gene number and tRNA abundance,
tRNA genes detected from M. thermophila were grouped into anticodon specific families.
The initiator tRNA ( ) and the elongator tRNA specific for methionine
(tRNAMet
) were considered as two different families. The tRNA abundance of each
family is the total FPKM values of all tRNA genes in the family. Finally, the numbers of
tRNA genes and the tRNA abundance values of all of the anticodon specific families
were subjected to the Pearson correlation analysis.
2.5.2. Relationship between tRNA gene number, tRNA abundance and codon
usage
Two strategies were applied to determine the relationship between tRNA availability
and codon usage. In the first approach, the relationship was examined at the amino acid
level. First, tRNA genes were classified into isoacceptor families, each of which is
specific for a given amino acid. The tRNA abundance of an isoacceptor family was
calculated as the sum of FPKM values of tRNA genes in that family. Subsequently, the
Pearson correlations between frequencies of amino acids and either tRNA abundance
values or tRNA gene numbers of the isoacceptor families were calculated. In the second
approach, the relationship between tRNA availability and codon usage was examined at
codon level. The method of Percudani et al. (1997) was applied to determine this
relationship. Firstly, each anticodon specific tRNA family has a “tRNA usage” value,
which is calculated from the frequencies of codons that tRNA genes in the family can
recognize. Due to the Wobble base paring between the first nucleotide of the anticodon

64
and third nucleotide of the codon (Table 3), a tRNA can code for more than one codon
(Crick 1966). In this study, “A” in the first position of the anticodons is considered as “I”
and can form base pairing with “T”, “C” and “A” because adenosine (A) is usually
converted into inosine (I) in eukaryotic nuclear tRNAs. Since each tRNA primarily codes
for its perfectly matching codon, the codons that are recognized by the Wobble base
pairing are not included in the tRNA usage calculation except for the cases in which the
perfect matching does not exist. For example, if there are three anticodon-specific tRNA
families of the tRNAAla
with the anticodons AGC, CGC, TGC, and there are four codons
GCT, GCG, GCA and GCC, the tRNA usage of these three families is calculated as
presented in Table 4. Secondly, the tRNA abundance of each anticodon specific family
was calculated as the total FPKM values of all tRNA genes in the family. Next, the tRNA
abundance and tRNA usage values of all anticodon specific families were subjected to
the Pearson correlation analysis to determine the relationship between tRNA abundance
and codon usage. Similarly, the correlation between tRNA gene numbers and codon
usage was also calculated. In the second approach, initiator tRNAs and the first codons of
all protein-coding genes were not included in the analysis. The frequencies of codons and
amino acids were calculated from the coding sequences of all predicted protein-encoding
genes in M. thermophila which were provided by the Genozymes projects.

65
Table 3. Base pairing at the third position of the codon according to Wobble theory
(Crick 1966)
First base of anticodon Bases recognized on the codon
T A, G C G
A T G T, C I T, C, A
Table 4. Calculating tRNA usage values for three tRNA gene families specific for the
anticodons AGC, CGC and TGC
Amino acid Anticodon Codons* tRNA usage**
Ala AGC GCT, GCA, GCC F(GCT) + F(GCC) Ala CGC GCG F(GCG) Ala TGC GCA, GCG F(GCA)
((*) Codon: all possible codons that the tRNAs in each family can decode according to
the Wobble theory (Crick 1966);(**) F(X): frequency of codon X)

66
CHAPTER 3. RESULTS
3.1. tRNA gene prediction results
3.1.1. tRNAscan-SE
tRNAscan-SE detected 194 genes including 46 anticodon-specific gene families
(Supplementary table 1). Although not all tRNA genes for the 61 anticodons were
predicted, these 194 genes were still able to decode the 20 standard amino acids.
Moreover, one tRNA gene specific for SeC and two pseudogenes corresponding to
tRNAIle
and tRNAPro
were found from the predicted result. More than half of these
predicted genes (65.46%) contain intervening sequences. These genes have only one
intron located in the anticodon-loop region. The intron lengths are from 7 to 57
nucleotides.
3.1.2. SPLITSX
There are 195 tRNA genes predicted by SPLITSX. Results from SPLITSX were
almost identical to those of tRNAscan-SE program except that one more pseudogene
which had the anticodon “TCT” and was specific for Arg was found. There was no tRNA
genes containing multiple introns detected from the genome of M. thermophila.
3.1.3. ARAGORN
Unlike tRNAscan-SE and SPLITSX, ARAGORN predicts any possible tRNA gene
region, which may overlap each other or contain a very long intron sequence. Therefore,
the number of genes that it predicted was much higher than the other predictors. The 349
tRNA genes predicted by ARAGORN comprised most of the 61 anticodon specific tRNA
gene families, except for one family specific for the anticodon “ACA” (Supplementary
table 2). In addition to tRNA genes coding for the 20 universal amino acids, there were
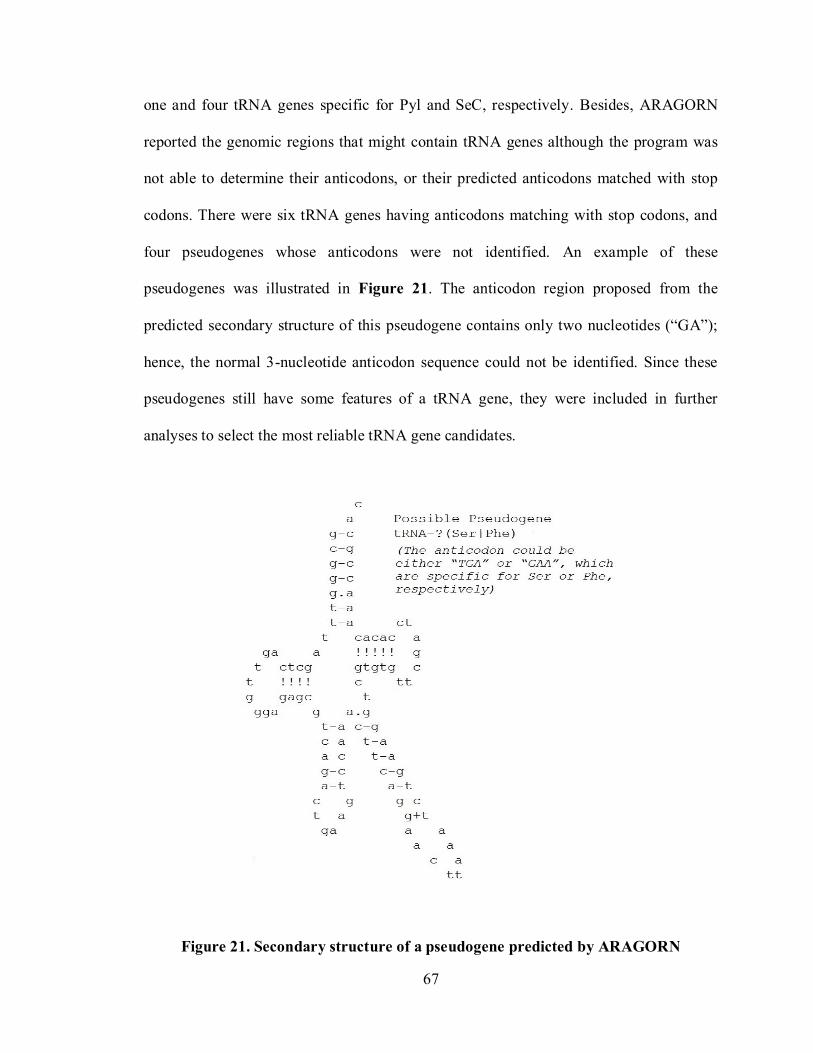
67
one and four tRNA genes specific for Pyl and SeC, respectively. Besides, ARAGORN
reported the genomic regions that might contain tRNA genes although the program was
not able to determine their anticodons, or their predicted anticodons matched with stop
codons. There were six tRNA genes having anticodons matching with stop codons, and
four pseudogenes whose anticodons were not identified. An example of these
pseudogenes was illustrated in Figure 21. The anticodon region proposed from the
predicted secondary structure of this pseudogene contains only two nucleotides (“GA”);
hence, the normal 3-nucleotide anticodon sequence could not be identified. Since these
pseudogenes still have some features of a tRNA gene, they were included in further
analyses to select the most reliable tRNA gene candidates.
Figure 21. Secondary structure of a pseudogene predicted by ARAGORN

68
More than 75% of the tRNA genes predicted by ARAGORN contain intervening
sequences. The intron lengths were from 1 to 2991 nucleotides. While tRNA genes
predicted from the other tools do not contain introns longer than 100 nucleotides, there
were 36.4% of the tRNA genes from ARAGORN having introns longer than 100
nucleotides.
3.1.4. tRNAfinder
tRNAfinder predicted 190 tRNA genes including 47 anticodon-specific gene
families. These genes can code for 19 universal amino acids (Supplementary table 3).
Transfer RNA genes coding for the amino acid “Tyr” were not detected. There were
64.2% of the genes containing one intron. The intron lengths range from 7 to 94
nucleotides. The program also found one tRNA gene specific for the amino acid SeC.
3.1.5. Compare predicted tRNA genes from the four tools
The total number of tRNA genes predicted from the four programs was 928 genes.
After removing the duplicates, the predicted data set contained 465 unique tRNA genes.
As shown in Figure 22, results from the four tools are not in good agreement since the
same results from all of these programs made up only 18% of the non-redundant
predicted gene set. More than half of the predicted tRNA genes (56%) were from
ARAGORN but not from the other predictors. When manually examining the genes only
predicted by ARAGORN, it revealed that, except for those having introns longer than
100 nucleotides in length, most of the remaining genes were similar to the genes reported
by the other predictors. However, their intron positions and ending positions were not
exactly the same as from the other programs. Figure 22 also showed that results from
tRNAscan-SE, SPLITSX and tRNAfiner are highly consistent since the same results from

69
these tools made up a large proportion in the non-redundant predicted data set. As
mentioned above, results from tRNAscan-SE and SPLITSX are almost identical except
for one pseudogene from SPLITSX. Among the total 190 genes from tRNAfinder, only
ten genes were not predicted by tRNAscan-SE and SPLITSX.
Figure 22. Numbers and percentages of tRNA genes predicted by different tools in
the non-redundant predicted tRNA gene set
3.2. Mapping of short RNAs
After trimming the adapter sequences and discarding reads having more than five
consecutive unidentified nucleotides, over 14 million reads were obtained from
sequencing the short RNAs. 87.3% of them were mapped to the genome of M.

70
thermophila using Bowtie. The remaining 12.7% of the short RNAs were then subjected
to the mapping process using BLAT. Finally, by combining the two programs, 94% of
the total reads were mapped to the genome. 13.36% of them were mapped to the
predicted tRNA gene regions. Although the number of short RNA sequences mapped by
BLAT was fewer than those mapped by Bowtie, they were improtant for the manual
curation and annotation process on GBrowse, especially for the intron-containing tRNA
genes. As illustrated in Figure 23, when using only Bowtie, the read coverage does not
match with the predicted tRNA gene model. However, when combining with BLAT
program, the mapping result is much improved.
Figure 23. The short read mapping was improved when using BLAT
(The tRNA gene model in this example is located in the plus strand of chromosome 1 of
the genome, from position 10293658 to position 10293739)
3.3. Summary of characterized fungal tRNAs and tRNA genes

71
There were 56 tRNA sequences and 322 tRNA gene sequences from 16 fungal
species in tRNAdb database. After examining the published papers related to each of
these sequences, there were 55 tRNAs and 53 tRNA genes found to be experimentally
characterized. Moreover, four new experimentally characterized fungal tRNA genes were
found from the literature. Their sequences were extracted from the papers since they were
not available in either GenBank or tRNAdb. After discarding the duplicates, the final data
set contained 85 unique tRNA sequences from 14 fungal species (Supplementary table
4), 43 of them were from S. cerevisiae (Table 5).
Table 5. Number of sequences of each fungal species in the experimentally
characterized tRNA sequence data set
Fungal species Number of tRNA sequences
Candida albicans 4 Candida cylindracea 8 Candida guilliermondii 1
Candida lusitaniae 1 Candida melibiosica 1 Candida parapsilosis 1 Candida rugosa 1 Candida tropicalis 1 Candida utilis 7 Candida zeylanoides 1
Neurospora crassa 3 Podospora anserine 2 Saccharomyces cerevisiae 43 Schizosaccharomyces pombe 11
Transfer RNA genes of the 20 isoacceptor families were included in the
experimentally characterized fungal tRNAs collected in this study. Moreover, five tRNA
initiators ( ), which were used specifically in the translation initiation process,
were found. However, this reliable data set did not comprise tRNAs from all 61
anticodon-specific families (Table 6). There are nine tRNAs specific for Ser, which have
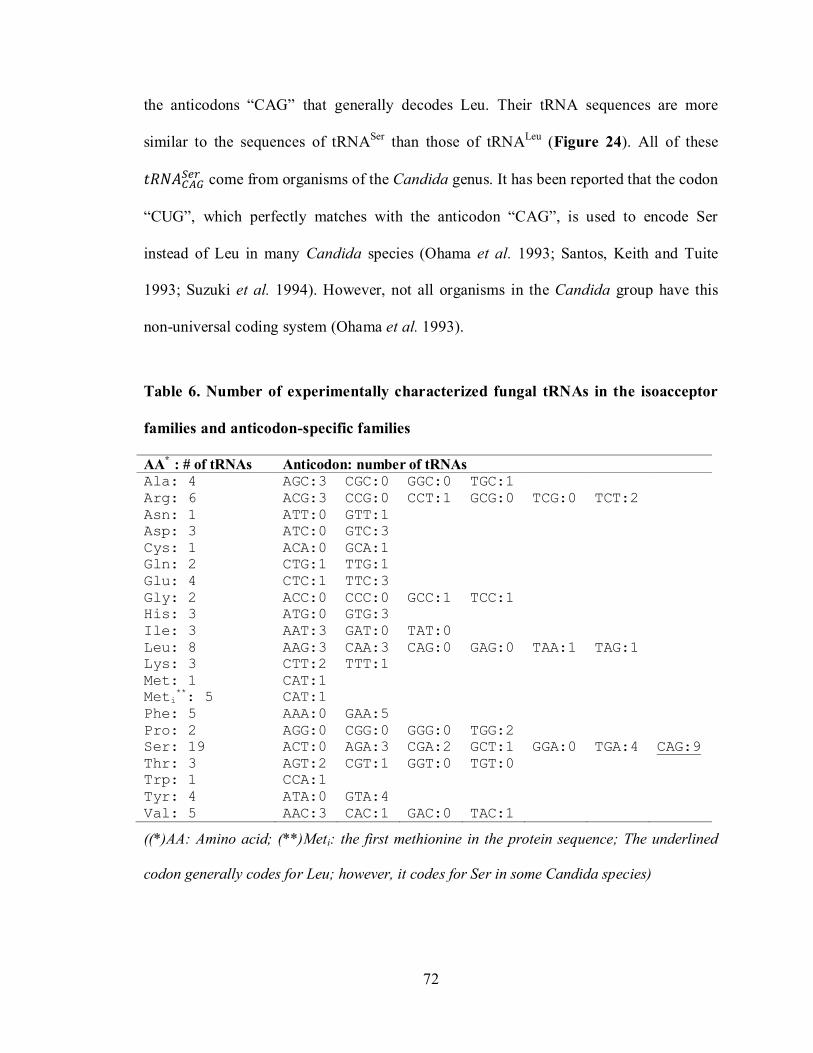
72
the anticodons “CAG” that generally decodes Leu. Their tRNA sequences are more
similar to the sequences of tRNASer
than those of tRNALeu
(Figure 24). All of these
come from organisms of the Candida genus. It has been reported that the codon
“CUG”, which perfectly matches with the anticodon “CAG”, is used to encode Ser
instead of Leu in many Candida species (Ohama et al. 1993; Santos, Keith and Tuite
1993; Suzuki et al. 1994). However, not all organisms in the Candida group have this
non-universal coding system (Ohama et al. 1993).
Table 6. Number of experimentally characterized fungal tRNAs in the isoacceptor
families and anticodon-specific families
AA*
: # of tRNAs Anticodon: number of tRNAs Ala: 4 AGC:3 CGC:0 GGC:0 TGC:1
Arg: 6 ACG:3 CCG:0 CCT:1 GCG:0 TCG:0 TCT:2
Asn: 1 ATT:0 GTT:1
Asp: 3 ATC:0 GTC:3
Cys: 1 ACA:0 GCA:1
Gln: 2 CTG:1 TTG:1
Glu: 4 CTC:1 TTC:3
Gly: 2 ACC:0 CCC:0 GCC:1 TCC:1
His: 3 ATG:0 GTG:3
Ile: 3 AAT:3 GAT:0 TAT:0
Leu: 8 AAG:3 CAA:3 CAG:0 GAG:0 TAA:1 TAG:1
Lys: 3 CTT:2 TTT:1
Met: 1 CAT:1
Meti**: 5 CAT:1
Phe: 5 AAA:0 GAA:5
Pro: 2 AGG:0 CGG:0 GGG:0 TGG:2
Ser: 19 ACT:0 AGA:3 CGA:2 GCT:1 GGA:0 TGA:4 CAG:9
Thr: 3 AGT:2 CGT:1 GGT:0 TGT:0
Trp: 1 CCA:1
Tyr: 4 ATA:0 GTA:4
Val: 5 AAC:3 CAC:1 GAC:0 TAC:1
((*)AA: Amino acid; (**)Meti: the first methionine in the protein sequence; The underlined
codon generally codes for Leu; however, it codes for Ser in some Candida species)

73

74
Figure 24. Phylogenetic tree built from the experimentally characterized fungal
tRNA sequences
(Transfer RNAs from the same isoacceptor family are presented in the same color.
Transfer RNAs specific for the first methionine (Meti) in the protein sequence and those
specific for the other methionines are classified in two different isoacceptor families. For
the isoacceptor families that have only one tRNA sequence in the experimentally
characterized tRNA data set, their tRNAs are presented in grey color. The numbers on
the tree are bootstrap values, which show the probability of clades on the tree. The
higher the probability is, the more likely the corresponding branch or clade is. Name of
each tRNA on the tree includes abbreviations of the corresponding species name, the
assigned amino acid, the anticodon and the order number of that tRNA in its anticodon-
specific family. For example, there are two
from S. pombe. Thus, names of
these two tRNAs are Sp_Tyr_GTA_1 and Sp_Tyr_GTA_2. Abbreviations: Ca, Candida
albicans; Cc, Candida cylindracea; Cg, Candida guilliermondii; Cl, Candida lusitaniae;
Cm, Candida melibiosica; Cp, Candida parapsilosis; Cr, Candida rugosa; Ct, Candida
tropicalis; Cu, Candida utilis, Cz, Candida zeylanoides; Nc, Neurospora crassa; Pa,
Podospora anserine; Sc, Saccharomyces cerevisiae; Sp, Schizosaccharomyces pombe)
The relationships among the 85 experimentally characterized fungal tRNAs are
displayed in the phylogenetic tree constructed from their sequences (Figure 24).
Although there are some exceptions, the tree generally shows that tRNAs in the same
isoacceptor family are grouped together. These clusters indicate that tRNAs specific for
the same amino acid from different species are more similar to each other than those from

75
different isoacceptor families from the same organism. There are several significant
clades having bootstrap values equal or greater than 0.7. These clades demonstrate the
close relationship between tRNAs having the same anticodons or decoding the same
amino acids although they originated from different species. However, due to the low
bootstrap values of a majority of clades, it may require additional evidence, such as the
ability to form cloverleaf structure as well as the conserved positions within the stems
and loops, in addition to the primary sequence similarity, to detect new tRNAs.
3.4. Results from the manual curation and annotation of tRNA genes in M.
thermophila
After manually examining the transcriptome data as well as the primary and
secondary structures of all 465 unique tRNA genes predicted by the four prediction tools,
194 genes are found to be correctly predicted (https://reviewers.fungalgenomics.ca/
gene_model_pages/tRNA_Table.html). Some of these genes do not have good matchings
between their gene models and the short read coverage. However, they are considered as
reliable tRNA genes since they have common features of the experimentally
characterized fungal tRNA genes. Also, there is evidence in the sequenced data, such as
the high number of mapped reads or the 3’-CCA tail, which demonstrates that these
predicted genes are true positive results. Most of the 194 tRNA genes are predicted by
more than one tool, except for one gene only predicted by ARAGORN (Table 7). The
tRNA genes identically predicted by all four tools are all true tRNA genes. Most of the
incorrectly predicted genes come from ARAGORN. Some of them are from tRNAfinder,
and only two of them are from tRNAscan-SE and SPLITSX. As shown in Figure 25,
tRNAscan-SE and SPLITSX are the most reliable programs among the four predictors.

76
Results from these two tools are almost the same since SPLITSX is basically an extended
version of tRNAscan-SE with some modifications to detect tRNA genes containing
multiple introns. It should be noted that all three pseudogenes predicted by tRNAscan-SE
and SPLITSX are found to be true tRNA genes. tRNAfinder is also a reliable tool for
tRNA gene detection although it is not as good as tRNAscan-SE and SPLITSX. It cannot
find several true tRNA genes and has a higher number of false positive results. As
compared to the others, ARAGORN has the lowest rate of true positive outcomes. This
tool reported the highest number of tRNA gene locations since it predicted tRNA genes
having introns longer than 100 nucleotides while the other tools did not. However, all
genes containing introns longer than 100 nucleotides from ARAGORN were incorrectly
predicted genes. On the other hand, although a number of tRNA gene locations reported
by ARAGORN did contain the true genes, their ending positions or intron positions are
not accurate (Figure 26). All of the pseudogenes and tRNA genes having anticodons
matching with stop codons reported by ARAGORN are not true positives.
The 194 reliable tRNA genes found in M. thermophila are from 46 anticodon
specific families. Although these tRNA genes do not comprise all of the 61 anticodon
specific families, they can code for all of the 20 universal amino acids. In addition, genes
of the tRNAs specifically used for translational initiation were found among the tRNAMet
genes. There is one tRNA gene found to be specific for SeC as determined by its
anticodon. This gene is predicted by all of the tRNA predictors. According to the
transcriptome data, it is a reliable gene. However, its secondary structure is more similar
to those of normal elongator tRNAs than the special one of tRNASeC
, which is described
previously. Therefore, to ensure whether this tRNA actually carries SeC to the

77
polypeptide chain in the translation process or not, experimental evidence may be
required. According to the numbers of tRNA genes in the anticodon specific families
presented in Table 8, it is likely that M. thermophila does not use the synonymous
codons equally. Instead, its codon usage tends to bias toward a subset of the 61 codons
since there is frequently one anticodon specific family has many more tRNA genes than
the others in the same isoacceptor family.
Table 7. Number of correctly and incorrectly predicted tRNA genes as revealed by
manual curation and annotation
Predictor(s) that reports unique tRNA genes
Total # of
predicted
genes
Correctly
predicted
genes
Incorrectly
predicted
genes
tRNAscan-SE, SPLITSX, ARAGORN, tRNAfinder 84 84 0 tRNAscan-SE, SPLITSX, ARAGORN 4 3 1 tRNAscan-SE, SPLITSX, tRNAfinder 95 94 1
SPLITSX, ARAGORN, tRNAfinder 1 1 0 tRNAscan-SE, SPLITSX 11 11 0 tRNAfinder 10 0 10 ARAGORN 260 1 259

78
Figure 25. Comparing results from the four tRNA gene prediction tools
Figure 26. Example of a tRNA gene from ARAGORN having incorrect ending and
intron positions

79
(The gene model predicted by tRNAscan-SE and SPLITSX is considered by manual
curation and annotation as a true tRNA gene. It is located in the plus strand of
chromosome 5 of the genome, from position 513153 to position 513236. Because the 3’-
CCA tail is added to the tRNA transcript after the transcription process, the short RNA
sequences may contain the three nucleotides “CCA” at their 3’ end in addition to the
tRNA gene sequences. Therefore, the short read coverage may extend longer than the
tRNA gene model.)
Table 8. Number of tRNA genes of M. thermophila in isoacceptor families and
anticodon specific families
AA : Gene number Anticodon: Gene number Ala: 12 AGC:7 CGC:3 GGC:0 TGC:2
Arg: 14 ACG:7 CCG:2 CCT:2 GCG:0 TCG:1 TCT:2
Asn: 6 ATT:0 GTT:6
Asp: 10 ATC:0 GTC:10
Cys: 3 ACA:0 GCA:3
Gln: 7 CTG:5 TTG:2
Glu: 10 CTC:8 TTC:2
Gly: 16 ACC:0 CCC:2 GCC:11 TCC:3
His: 4 ATG:0 GTG:4
Ile: 10 AAT:8 GAT:1 TAT:1
Leu: 15 AAG:7 CAA:2 CAG:4 GAG:0 TAA:1 TAG:1
Lys: 12 CTT:9 TTT:3
Met: 4 CAT:4
Meti: 4 CAT:4
Phe: 5 AAA:0 GAA:5
Pro: 11 AGG:5 CGG:3 GGG:0 TGG:3
Ser: 17 ACT:0 AGA:5 CGA:3 GCT:6 GGA:0 TGA:3
Thr: 11 AGT:6 CGT:3 GGT:0 TGT:2
Trp: 4 CCA:4
Tyr: 6 ATA:0 GTA:6
Val: 12 AAC:7 CAC:3 GAC:0 TAC:2
SeC: 1 TCA:1
As stated earlier, the number of short RNA reads covering a predicted tRNA gene
demonstrates its reliability. The graph in Figure 27 shows that a large fraction of the

80
reliable tRNA genes have a high number of mapped reads. More than half of them have
at least 1000 mapped reads. Most of the remaining genes had more than 100 read
sequences mapped onto them.
Figure 27. The amount of short reads mapped onto the reliable tRNA genes
In addition, there are many genomic regions in the genome of M. thermophila that match
with a large number of the sequenced short RNAs. However, no tRNA gene is predicted
within these regions (Figure 28). Their lengths are consistent with those of tRNA genes.
Therefore, to ensure that all tRNA genes were detected, the tRNA gene prediction was
carried out again on nucleotide sequences of the genomic regions highly covered by the
short reads and having at least 70 nucleotides in length. No new reliable tRNA gene was
found in this second prediction.

81
Figure 28. Example of a genomic region highly covered by the short reads and
having no predicted tRNA gene
(The genomic region in this example is in chromosome 1 of the genome, from position
7512588 to position 7512663)
3.5. Characteristics of experimentally characterized fungal tRNA genes and tRNA
genes found in M. thermophila
Lengths of tRNAs found in M. thermophila are similar to those of the characterized
fungal tRNAs. Lengths of the class II tRNAs (tRNALeu
and tRNASer
) in M. thermophila
and in the experimentally characterized tRNA data set are 82-91 nucleotides and 83-87
nucleotides, respectively. For the class I tRNAs, their lengths range from 74 to 77
nucleotides in M. thermophila, and from 74 to78 nucleotides in the characterized tRNA
data set. The difference between the class I and class II tRNA lengths is mostly due to
their different V-loop lengths. Lengths of the V-loop are from 11 to 15 nucleotides for the
class II tRNAs, and from 3 to 5 nucleotides for the class I tRNAs. The length range of all
fungal tRNAs found in this study is in agreement with the commonly known tRNA
lengths which are from 74 to 98 nucleotides (Westhof and Auffinger 2001).
Nucleotides at the conserved and semi-conserved positions in tRNAs of M.
thermophila are consistent with those found in the characterized fungal tRNAs. Within

82
the A box region which is from position 8 to 19 in the cloverleaf structure, four strictly
conserved nucleotides “T”, “G”, “A” and “G” are found at positions 8, 10, 14, and 18,
respectively. Furthermore, at position 9 and 15, only purine nucleotides (A, G) are
observed. Also, only pyrimidine nucleotides (C, T) are found at position 16. Within the B
box region which is from position 52 to 62 in the secondary structure, the nucleotides
“G”, “T”, “C”, “A” and “C” are always found at positions 53, 55, 56, 58 and 61,
respectively. At position 57, only purine nucleotides are observed. At position 54 and 60,
there is a distinction between initiator and elongator tRNAs. The nucleotide “T” is always
located at position 54 of all elongator tRNAs while it is always “A” at this position in
initiator tRNAs. Moreover, at position 60 of all elongator fungal tRNAs, it is either “T”
or “C” while it is always “A” in initiator tRNAs. In addition to the conserved and semi-
conserved positions of the A box and B box, which are located within the D and T stem
and loop regions, there are three more semi-conserved positions found within the
anticodon loop. Pyrimidine and purine nucleotides are always observed at position 32 and
37, respectively. The nucleotides at position 33 are frequently either “T” or “G”. The
conserved and semi-conserved nucleotides of all fungal tRNAs in this study are presented
in Figure 29. Besides the invariant nucleotides, the base pairings within the stems in the
cloverleaf structures of the fungal tRNAs were considered. It showed that in addition to
the normal base pairs (A-T, G-C), several unusual pairs (T-G, T-T, C-T and C-A) were
found in the A-stem. Among those, T-G is the most frequently observed.

83
Figure 29. Conserved and semi-conserved nucleotides as well as the intron position
of the fungal tRNAs in this study
In M. thermophila, 65% of the tRNA genes contain introns. All of the intron-
containing genes in M. thermophila as well as in the characterized fungal tRNA data set
have only one intron. All of the introns are located one nucleotide downstream of the
anticodon (Figure 29). Intron lengths of the tRNAs in M. thermophila and the

84
experimentally identified tRNAs range from 7-57 nucleotides and 8-34 nucleotides,
respectively. The intron-containing tRNA genes are specific for most of the 20 amino
acids, except for Asn and Cys. Transfer RNA genes in the same isoacceptor family or in
the same anticodon specific family may or may not have introns. Therefore, introns are
not specific for any isoacceptor family or anticodon-specific family.
The downstream regions of all of the experimentally identified tRNA genes and their
paralogs as well as the 194 tRNA genes found in M. thermophila contain a stretch of
consecutive thymidines (poly-T), which has been proposed to be the transcriptional
termination site (Schmidt and Söll 1981; Hamada et al. 2000) (Figure 30). Lengths of the
poly T are frequently from 5 to 22 nucleotides. Also, the distance between the 3’ end of
the tRNA genes and the poly T regions were from 0 to 84 nucleotides. For a majority of
the tRNA genes, this distance is from 0 to 13 nucleotides. This provides further evidence
that the tRNA genes curated in this study are correct.
Figure 30. Examples of poly-T regions found downstream of the tRNA genes

85
(The genomic regions shown in these examples are in the nuclear genome of M.
thermophila. The tRNA gene sequences are highlighted. The poly-T regions, proposed to
be the transcription termination signals, are boxed.)
The delta, tau and sigma elements are only found in the genome of S. cerevisiae, and
the beta element is only detected in the genome of C. albicans. These transposable
elements (TEs) are not found in M. thermophila as well as in the other fungal genomes
which harbour the characterized tRNA genes. Therefore, the four TEs could not be used
to support the tRNA gene annotation in M. thermophila. There might be other TEs
specific for M. thermophila; however, in the scope of this study, only the delta, tau,
sigma and beta elements which are commonly reported to be located adjacent to tRNA
genes are investigated. There is no clear relationship found between the four TEs and
tRNA genes in the genomes of S. cerevisiae and C. albicans. As shown in Table 9, for
each of the four TEs, not all of its copies are located close to tRNA genes. For the ones
positioned adjacent to tRNA genes, they are located upstream of the tRNA genes. The
distances between the sigma elements and their adjacent tRNA genes are very similar to
those reported by Del Rey et al. (1982). The transfer RNA genes located nearby the TEs
are from all of the 20 isoacceptor families. Some of them contain introns while some do
not. For the gene copies of the same tRNA gene, some of them are located near the TEs,
while the others are not. It indicates that the four TEs may be located adjacent to various
types of tRNA genes, and there is no relationship between these TEs and a specific group
of tRNA genes.

86
Table 9. Numbers of the four TEs found in the genomes of S. cerevisiae and C.
albicans
Species TE name Number of
TE copies
Number of TEs adjacent
to tRNA genes
Distance(*)
(nucleotides)
S. cerevisiae delta 157 49 80-928
S. cerevisiae sigma 24 14 14-18 S. cerevisiae tau 18 6 147-925 C. albicans beta 4 1 36
(*) the distances between the TEs and their adjacent tRNA genes
3.6. Results from collecting and analyzing reliable AARSs
3.6.1. Summary of characterized AARSs
Results from the searches from different databases showed that only 27 fungal
cytoplasmic AARSs have been experimentally characterized (Supplementary table 5).
Most of them are from S. cerevisiae. These cytoplasmic fungal AARSs do not include all
of the enzymes of the 20 universal AARS families since the prolyl-tRNA synthetase and
arginyl-tRNA synthetase are still missing. Although these 27 enzymes are well-
documented, some of them still have the unreliable GO evidence code “IEA” (Inferred
from Electronic Annotation) at the three GO aspects. Therefore, their new GO terms and
GO evidence codes were assigned by the decision tree in Figure 17.
In addition to the 27 fungal cytoplasmic AARSs, 52 other aminoacyl-tRNA
synthetases obtained from UniProt are found to be reliable according to their assigned
GO terms and GO evidence codes at the three GO aspects (Supplementary table 6).
Most of these evidence codes were IDA (Inferred from Direct Assay), TAS (Traceable
Author Statement), IMP (Inferred from Mutant Phenotype) and IGI (Inferred from
Genetic Interaction). They included both mitochondrial and cytoplasmic AARSs from
bacterial, fungal and other eukaryotic species.

87
In summary, the reliable AARS data set in this study consists of 79 enzymes from 11
organisms. Among those, there are 22 mitochondrial proteins, 49 cytoplasmic ones and 8
enzymes having both mitochondrial and cytoplasmic functions (Table 10). For the AARS
genes encoding both mitochondrial and cytoplasmic enzymes, their transcriptional
products comprised two alternative mRNAs coding for two protein isoforms. The longer
isoform encodes the mitochondrial AARS while the shorter one encodes the cytoplasmic
enzyme. The two isoforms are mostly identical except that the longer one has an extra
sequence at its N-terminus which codes for the mitochondrial targeting peptide. The
cytoplasmic compilation comprises enzymes from each of the 20 universal AARS
families. For the mitochondrial AARS collection, enzymes specific for Gln, Pro and Cys
have not been found yet. Since phenylalanyl-tRNA synthetase (PheRS) has two subunits
(α and β), there are two sequences found to encode PheRSα and PheRSβ. Moreover,
there is an AARS from H. sapiens functioning as both prolyl-tRNA synthetase and
glutamyl-tRNA synthetase.
Table 10. Number of characterized AARSs collected in this study
Species group Species name Number of AARSs(*)
Bacteria Escherichia coli 8
Mycobacterium tuberculosis 1
Thermus thermophilus 1
Fungi
Candida albicans 4 (3 cyt, 1 cyt and mit)
Neurospora crassa 2 (1 cyt, 1 cyt and mit) Saccharomyces cerevisiae 33 (16 cyt, 4 cyt and mit, 13 mit) Schizosaccharomyces pombe 2 (1 cyt, 1 mit)
Other eukaryotic organisms
Arabidopsis thaliana 1 (1 mit)
Bos Taurus 1 (1 mit) Homo sapiens 25 (17 cyt, 2 cyt and mit, 6 mit) Rattus norvegicus 1 (1 cyt)
(*) The eukaryotic AARSs are either cytoplasmic (cyt) or mitochondrial (mit). Also, some
of them have both cytoplasmic and mitochondrial functions (cyt and mit). Those in

88
brackets describe in detail the numbers of cytoplasmic, mitochondrial and bifunctional
enzymes of each organism.
3.6.2. Results from analyzing the characterized AARS sequences
The relationship between different types of AARSs is shown in the phylogenetic tree
built from all reliable AARS sequences collected in this study. As presented in Figure
31, AARSs specific for the same amino acid tend to cluster together on the tree. The high
bootstrap values of the clades within each cluster demonstrate that these groupings are
not random events. It indicates that AARSs of the same amino acid from different
organisms are more similar to each other than AARSs having different specificities from
the same species. Moreover, for the enzymes specific for the same amino acid, the
mitochondrial and cytoplasmic AARSs form two distinct groups. Therefore, when using
an AARS sequence as a query in the BLAST search to detect AARS enzymes in a new
sequenced genome, the most similar hit found from the BLAST search would be the
AARS that have the same specificity with the query AARS. Also, if the query enzyme
has the cytoplasmic function, it is more likely that the AARS found from the BLAST
search is a cytoplasmic enzyme than a mitochondrial enzyme and vice versa. For AARSs
of Met, Thr and Asp, as shown on the tree, the mitochondrial enzymes are more similar
to the bacterial ones than to their cytoplasmic counterparts, which is consistent with those
reported by Sissler et al. (2000). However, for AARSs of Ser, Asn and Lys, the
cytoplasmic enzymes are more similar to the bacterial ones than the mitochondrial
enzymes. Also, for alanyl-tRNA synthetase, the cytoplasmic enzymes are more similar to
their mitochondrial counterparts than the bacterial ones. Hence, when using a bacterial

89
AARS as a query sequence to search for AARS enzymes in a eukaryotic genome, further
analysis would be required to determine whether the most similar hit found from the
BLAST search is a cytoplasmic or mitochondrial AARS. For the phenylalanyl-tRNA
synthetase (PheRS), the tree showed that the mitochondrial PheRSs tend to cluster with
the alpha subunit of the cytoplasmic enzymes.

90

91
Figure 31. Phylogenetic tree built from the characterized AARS protein sequences
(AARSs having the same specificity are presented in the same colour. The numbers shown
on the tree are the bootstrap values. Name of each AARS on the tree consists of its
species name, its amino acid specificity and the cellular component in which the enzyme
primarily functions. Each AARS is either cytoplasmic (cyt) or mitochondrial (mit). Some
of them are bifunctional (cyt_mit). Abbreviations of the species names are: Ec,
Escherichia coli; Mt, Mycobacterium tuberculosis; Tt, Thermus thermophilus; Ca,
Candida albicans; Sc, Saccharomyces cerevisiae; Sp, Schizosaccharomyces pombe; At,
Arabidopsis thaliana; Bt, Bos Taurus; Hs, Homo sapiens; Rn, Rattus norvegicus)
The signature motifs specific for class I and class II AARSs are observed in most of
the characterized AARS enzymes except for two class I AARSs which are the
cytoplasmic arginyl-tRNA synthetase (ArgRS) from human and the mitochondrial ArgRS
from S. cerevisiae. As previously mentioned, class I AARSs have two conserved motifs:
“HIGH” and “KMSKS”. The two characterized ArgRSs from human and S. cerevisiae do
not harbour the “KMSKS” motif. It has been reported that there are two groups of ArgRS
enzymes. Proteins in the first group have the canonical “KMSKS” motif while those of
the second one do not; yet, they have a conserved lysine (K) upstream of the “HIGH”
motif (Sekine et al. 2001). This invariant K is observed in the upstream region of the
“HIGH” motif of the two characterized ArgRSs. When comparing sequences of the class
I AARS signature motifs of all characterized AARSs, it showed that only the first
histidine of the “HIGH” motif is strictly conserved (Figure 32 (A)). The second amino
acid of this motif is diverse. The other residues of the two class I motifs are highly

92
conserved; however, they are substituted by alternative amino acids in some cases. For
the three motifs of the class II AARSs, the multiple sequence alignment profiles of these
motif sequences reveal some invariant and highly conserved residues which are in
agreement with the ones discovered earlier by Eriani et al. (1995) (Figure 32 (B), (C),
(D)).

93
Figure 32. Multiple sequence alignment profiles of the signature motif sequences of
the characterized AARSs
(Invariant amino acids are highlighted in grey color. Highly conserved residues are in
bold)

94
Fig. 32. Continued.

95
3.7. Results from the manual curation and annotation of AARS genes in M.
thermophila
In the BLASTP search against all 11,342 predicted proteins of M. thermophila using
the characterized AARSs as query sequences, 36 significant hits were found. These hits
were considered as AARS candidates for M. thermophila and subjected to further
analysis in which their gene models and sequences were manually examined. When
comparing the AARS gene models, which were predicted by either JGI or the
Genozymes project, and the sequenced transcript data on GBrowse (https://reviewers.
fungalgenomics.ca/gene_model_pages/AARS_Table.html), gene models of the 36 AARS
candidates match well to their corresponding transcript coverage. In some cases, the
genes models proposed by the Genozymes project are better than those from JGI and vice
versa. As presented in Figure 33, more correct gene models are predicted from the
Genozymes project.
Figure 33. The numbers of correct gene models from JGI and the Genozymes
project when comparing the gene models of 36 AARS candidates and the
transcriptome data

96
The nucleotide sequences of the 36 selected gene models were examined by checking
their start and stop codons as well as the intron splice sites for the genes containing
introns. The start and stop codons of all of the 36 gene models are the same as the
universal ones. There are no stop codons within their exon regions. Most of the intron
splice sites follow the “GT-AG” rule except for three introns of three gene models. These
three exceptions have “GC” at the 5’ splice site instead of “GT” as frequently observed.
However, it has been observed that in addition to a number of introns beginning with
“GT”, there exist a small proportion of introns starting with “GC”. These non-canonical
5’ splice sites occupy 0.5% of the annotated 5’ spice sites in SpliceDB database (Burset,
Seledtsov and Solovyev 2001; Kitamura-Abe et al. 2004). Therefore, the gene models
containing the 5’ splice site “GC” are also considered as correct. When analyzing the
protein sequences, AARS signature motifs were found in most of the 36 AARS
candidates except for two candidates which were proposed to be the arginyl-tRNA
synthetase (ArgRS) and the histidyl-tRNA synthetase (HisRS). The protein sequence of
the predicted ArgRS, a class I AARS, does not harbour the “KMSKS” motif; however, it
contains lysine (K) in the upstream region of the “HIGH” motif. As mentioned earlier,
some well-documented ArgRSs which lack the canonical “KMSKS” motif have a
conserved K in the upstream region of the “HIGH” motif. Therefore, it is possible that
this candidate is a true ArgRS. For the proposed HisRS, a class II AARS, the three
signature motifs specific for class II AARSs were not found. In fact, only the HisRS
having both mitochondrial and cytoplasmic functions in S. cerevisiae shows the sequence
similarity with this candidate among all of the characterized AARSs. However, this
similarity (37%) is much lower than the similarities of the other AARS candidates with
97
the experimentally characterized AARSs. Although the query coverage from the
BLASTP search is high (82%), the target coverage is very low (26%). Therefore, it is
likely that this candidate is not an AARS enzyme. Hence, it was eliminated from AARS
gene annotation. The remaining 35 AARS candidates are considered to be true AARS
enzymes due to the sequence similarities from the BLASTP search and the presence of
the signature motifs. The amino acid specificities as well as the cytoplasmic and
mitochondrial functions of these 35 candidates were inferred from their most similar
proteins in the characterized AARS data set and the results from the mTP detection. After
assigning the specificities and functions of these 35 candidates, it showed that the
mitochondrial AARSs of Ala, Gly, Cys, Arg and Gln were not detected. The missing of
mitochondrial glutaminyl-tRNA synthetase (GlnRS) in M. thermophila is due to the lack
of mitochondrial GlnRS in the query sequences in the BLASTP search. Also, it has been
reported that mitochondrial GlnRS can be absent due to the indirect aminoacylation
pathway (Sissler et al. 2000). For Ala, Gly, Cys and Arg, when using the bacterial,
mitochondrial and cytoplasmic AARSs specific for these amino acids in the well-
documented compilation as query sequences in the BLASTP search, only one AARS
candidate found for each of these amino acids. On the other hand, when considering
results of the TBLASTN search, there were no other genomic regions found to potentially
code for AARSs in addition to those found from the BLASTP search. Therefore, it is
likely that the unique AARSs of Ala, Gly, Cys and Arg found in M. thermophila function
in both the cytoplasm and mitochondrion. However, the protein sequences of AARSs
specific for these amino acids do not contain mitochondrial targeting peptide identified
by the mitochondrial signal peptide detection. As previously mentioned, an AARS gene

98
encoding both mitochondrial and cytoplasmic enzymes frequently has two alternative
start codons, forming two ORFs on the same reading frame. The longer ORF encodes the
mitochondrial AARS, and the shorter one encodes the cytoplasmic counterpart.
Therefore, upstream regions of the four genes encoding AARSs specific for Ala, Gly,
Cys and Arg in M. thermophila were examined. The result showed that another start
codon was present in the upstream region of each of these genes. In each gene, the two
alternative codons are located close to each other. When replacing the start codons of the
four AARS genes with the new ones found in their upstream regions, the mitochondrial
signal peptides were detected in the N-termini of the corresponding protein gene
products. This demonstrates that the mitochondrial and cytoplasmic enzymes of the
AARSs specific for Ala, Gly, Cys and Arg in M. thermophila are encoded by a single
gene by using alternative start codons.
In summary, based on the transcriptome data, the sequence similarity with the well-
documented AARSs and the presence of the signature motifs, 35 reliable AARS enzymes
are found in M. thermophila. According to results from the BLASTP and TBLASTN
searches, it is likely that most of the complete set of AARSs in M. thermophila, except
for mitochondrial GlnRS, is detected. The numbers of mitochondrial, cytoplasmic and
bifunctional enzymes are 12, 15 and 8, respectively. As presented in Table 11, the
cytoplasmic AARSs found in M. thermophila include those of all of the 20 amino acids.
For the mitochondrial AARSs, only the enzyme specific for Gln is missing. For the
cytoplasmic phenylalanyl-tRNA synthetase, two genes encoding two subunit types (α and
β) of this enzyme were detected.
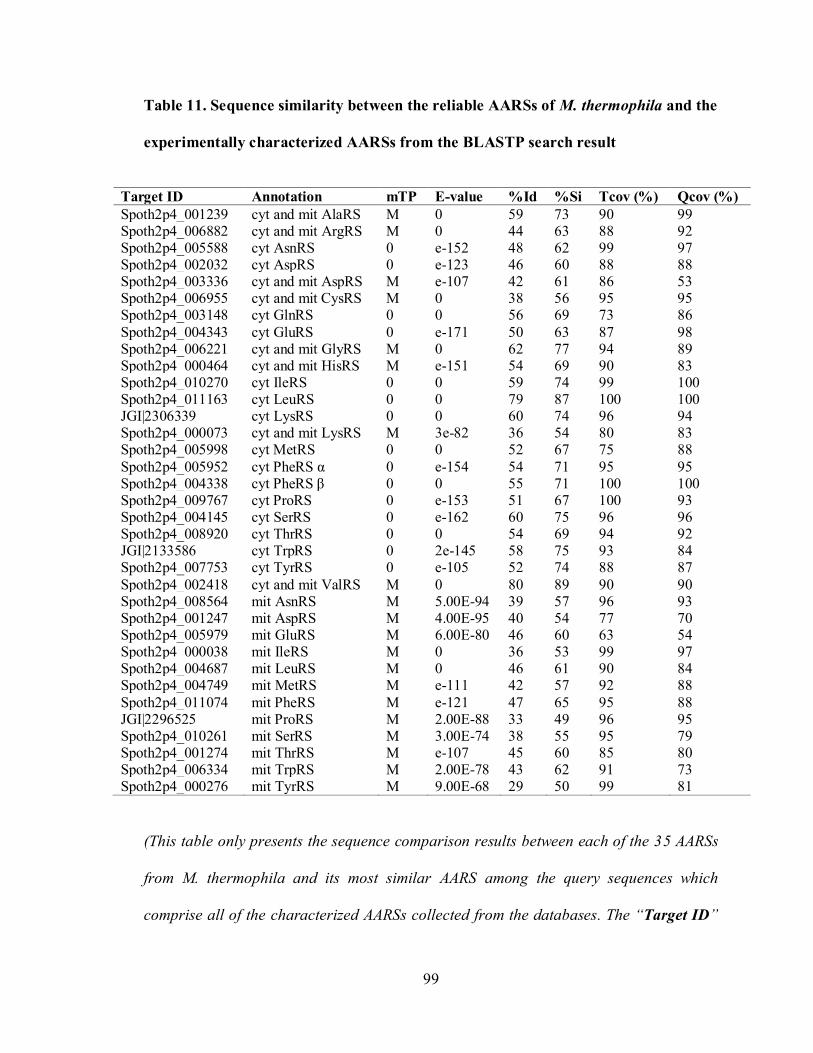
99
Table 11. Sequence similarity between the reliable AARSs of M. thermophila and the
experimentally characterized AARSs from the BLASTP search result
Target ID Annotation mTP E-value %Id %Si Tcov (%) Qcov (%)
Spoth2p4_001239 cyt and mit AlaRS M 0 59 73 90 99 Spoth2p4_006882 cyt and mit ArgRS M 0 44 63 88 92 Spoth2p4_005588 cyt AsnRS 0 e-152 48 62 99 97 Spoth2p4_002032 cyt AspRS 0 e-123 46 60 88 88 Spoth2p4_003336 cyt and mit AspRS M e-107 42 61 86 53 Spoth2p4_006955 cyt and mit CysRS M 0 38 56 95 95 Spoth2p4_003148 cyt GlnRS 0 0 56 69 73 86
Spoth2p4_004343 cyt GluRS 0 e-171 50 63 87 98 Spoth2p4_006221 cyt and mit GlyRS M 0 62 77 94 89 Spoth2p4_000464 cyt and mit HisRS M e-151 54 69 90 83 Spoth2p4_010270 cyt IleRS 0 0 59 74 99 100 Spoth2p4_011163 cyt LeuRS 0 0 79 87 100 100 JGI|2306339 cyt LysRS 0 0 60 74 96 94 Spoth2p4_000073 cyt and mit LysRS M 3e-82 36 54 80 83 Spoth2p4_005998 cyt MetRS 0 0 52 67 75 88
Spoth2p4_005952 cyt PheRS α 0 e-154 54 71 95 95 Spoth2p4_004338 cyt PheRS β 0 0 55 71 100 100 Spoth2p4_009767 cyt ProRS 0 e-153 51 67 100 93 Spoth2p4_004145 cyt SerRS 0 e-162 60 75 96 96 Spoth2p4_008920 cyt ThrRS 0 0 54 69 94 92 JGI|2133586 cyt TrpRS 0 2e-145 58 75 93 84 Spoth2p4_007753 cyt TyrRS 0 e-105 52 74 88 87
Spoth2p4_002418 cyt and mit ValRS M 0 80 89 90 90 Spoth2p4_008564 mit AsnRS M 5.00E-94 39 57 96 93 Spoth2p4_001247 mit AspRS M 4.00E-95 40 54 77 70 Spoth2p4_005979 mit GluRS M 6.00E-80 46 60 63 54 Spoth2p4_000038 mit IleRS M 0 36 53 99 97 Spoth2p4_004687 mit LeuRS M 0 46 61 90 84 Spoth2p4_004749 mit MetRS M e-111 42 57 92 88
Spoth2p4_011074 mit PheRS M e-121 47 65 95 88 JGI|2296525 mit ProRS M 2.00E-88 33 49 96 95 Spoth2p4_010261 mit SerRS M 3.00E-74 38 55 95 79 Spoth2p4_001274 mit ThrRS M e-107 45 60 85 80 Spoth2p4_006334 mit TrpRS M 2.00E-78 43 62 91 73 Spoth2p4_000276 mit TyrRS M 9.00E-68 29 50 99 81
(This table only presents the sequence comparison results between each of the 35 AARSs
from M. thermophila and its most similar AARS among the query sequences which
comprise all of the characterized AARSs collected from the databases. The “Target ID”

100
column shows the identification numbers of the 35 AARSs in the predicted protein set of
M. thermophila. The IDs that begin with “JGI” indicate that the corresponding proteins
are from JGI. The others are from Genozymes project. The “Annotation” column
presents the annotated functions of these 35 proteins. They can have either cytoplasmic
(cyt) or mitochondrial (mit) function, or both of them (cyt and mit). The “mTP” column
has two values, which is zero if there is no mitochondrial targeting peptide detected in
the protein sequence or “M” if the mitochondrial signal peptide is found. Other columns
are: %Id, percentage of sequence identity; %Si, percentage of sequence similarity; Tcov,
target coverage; Qcov, query coverage)
3.8. Preferred codons in M. thermophila
When considering the codon occurrences in the coding regions of protein-encoding
genes, among the codons of the same tRNA which has an anticodon beginning with “A”,
the codon having “C” at its 3’ end has the highest frequency. For example, the
can encode three codons GCC, GCT and GCA, and frequencies of these codons are
56.45%, 20.29% and 6.29%, respectively (Supplementary table 7). It shows that when
the nucleotide “A” is located at the Wobble position of an anticodon, it preferentially
binds to the nucleotide “C” instead of “T”. It may be because the nucleotide “A” at the
Wobble position is usually modified into “I” (Percudani et al. 1997), and this
modification causes some changes in its binding property. Therefore, when selecting
preferred codons according to tRNA genes, among the codons encoded by the same
tRNA that has an anticodon beginning with “A”, the codon having “C” at its 3’ end
should be selected.

101
As shown in Table 12, preferred codons deduced from the three methods which are
based on the tRNA gene set, the highly expressed genes and the genes having Nc values
lower than 31 are almost identical, except for the case of Ser. Among tRNA genes coding
for Ser, the group of tRNA genes having the anticodon “GCT” has the highest tRNA
gene number, and the codon perfectly matching with this anticodon is AGC. In the sets of
highly expressed genes and genes having low Nc values, the codons having the highest
frequencies are TCG and ACG, respectively. It is noticed that three of the six codons
coding for Ser (AGC, TCG and TCC) have similar frequencies. In the highly expressed
gene set, frequencies of these three codons are 26.93%, 25.56% and 25.31%,
respectively. In the set of genes having low Nc values, their frequencies are 32.52%,
32.33% and 28.55%, respectively. Because frequencies of these three codons are similar
and low, and because the numbers of tRNA genes of different anticodon-specific groups
in the tRNASer
gene family are not distinctly different (Supplementary table 7), it
reveals that no codon is clearly found to be preferentially used among the codons coding
for Ser. Therefore, no codon is selected for Ser in the preferred codon selection. In
summary, using the three methods which are based on the tRNA gene numbers, the
highly expressed genes and the genes having low Nc values, 17 optimal codons were
determined for 17 amino acids. Among the three methods, the method based on genes
having low Nc values is the simplest one since it does not need the sequenced RNA data.
Hence, it can be used to quickly determine the preferred codons of an organism.

102
Table 12. Preferred codons in M. thermophila found from the three methods which
are based on the tRNA genes, the highly expressed genes and the genes having Nc
values lower than 31
Amino
acid
Method based on
highly expressed
genes
Method based on
tRNA gene
numbers
Method based on
genes having Nc
<31
Combined
three methods
Ala GCC GCC GCC GCC Arg CGC CGC CGC CGC Asn AAC AAC AAC AAC
Asp GAC GAC GAC GAC Cys TGC TGC TGC TGC Gln CAG CAG CAG CAG Glu GAG GAG GAG GAG Gly GGC GGC GGC GGC His CAC CAC CAC CAC Ile ATC ATC ATC ATC
Leu CTC CTC CTC CTC Lys AAG AAG AAG AAG Phe TTC TTC TTC TTC Pro CCC CCC CCC CCC Ser TCG AGC AGC None Thr ACC ACC ACC ACC Tyr TAC TAC TAC TAC Val GTC GTC GTC GTC
3.9. Correlation between tRNA gene number, tRNA abundance and codon usage in
M. thermophila
To determine the relationship between the number of tRNA genes in the genome and
the amount of tRNAs in the cell, tRNA genes are classified into anticodon specific
groups. Each group has a FPKM value which shows the estimated tRNA abundance and
is calculated from the sequenced short RNAs. Subsequently, the number of tRNA genes
and FPKM values of all of the anticodon specific groups are subjected to the Pearson
correlation analysis. The correlation coefficient value of this correlation is 0.51, which
indicates a moderate correlation between the two entities. Moreover, since the p value is

103
zero, the relationship between tRNA gene number and tRNA abundance is considered to
be statistically significant.
As previously mentioned, the relationship between tRNA availability and codon
usage is examined at the amino acid level and the codon level. At the amino acid level,
tRNA genes are classified into amino acid specific groups. The FPKM value, or the
tRNA abundance, of each group is calculated as the sum of FPKM values of all tRNA
genes in the group. After using Pearson correlation to analyze the relationship between
the FPKM values of all of the groups and the amino acid frequencies, no significant
correlation between these two objects is found according to the low correlation
coefficient value (r=0.097) and the high p value (p= 0.675). In contrast, when analyzing
the connection between tRNA gene numbers of the amino acid specific groups and amino
acid frequencies, a strong and statistically significant correlation is observed (r=0.901,
p=0) (Figure 34). When examining the correlations between tRNA availability and
codon usage at the codon level, tRNA genes are grouped together according to their
anticodons. Each anticodon specific group has a tRNA gene number value, a FPKM
value and a tRNA usage value. The tRNA usage is the frequency of codons that are
encoded by tRNA genes in the group. The codons encoded by the Wobble base pairing
are not included when calculating the tRNA usage except for some Wobble codons that
do not have perfectly matching tRNA genes. After using Pearson correlation analysis, a
strong relationship (r=0.8) between tRNA gene number and tRNA usage, or codon
frequency, is observed (Figure 35). For the relationship between tRNA abundance and
codon frequency, the correlation coefficient value is 0.4, which indicates a weak
correlation. The p values of these two correlations are zero and 0.006, respectively. Since

104
these p values are lower than 0.05, the relationships observed between tRNA gene
number and codon frequency as well as between tRNA abundance and codon frequency
are statistically significant.
Figure 34. Correlation between tRNA gene number and amino acid frequency

105
Figure 35. Correlation between tRNA gene number and codon frequency

106
CHAPTER 4. DISCUSSION
4.1. Reliable tRNA gene detection in M. thermophila
Along with the recognition of various and crucial roles of the non-coding RNAs
(Mattick and Makunin 2006), tRNA gene detection has been an important part to
complete a genome project. Generally, tRNA genes are detected by using the tRNA gene
prediction tools. In this thesis, tRNA genes in M. thermophila are detected by combining
both predicted results from different tRNA gene predictors and the experimental data.
Therefore, they are expected to be more reliable than tRNA genes from other genome
projects. In the tRNA gene annotation of C. albicans (Fan et al. 2007), A. niger (Pel et al.
2007), cow (D. T. Tang et al. 2009) and O. sativa (Itoh et al. 2007), tRNA genes were
identified by the tRNAscan-SE program. The number of tRNA gene sets in different
organisms has been increasing considerably in the GtRNAdb database by using this
tRNA gene predictor (Chan and Lowe 2009). Yet, it has been reported that this tool has
some limitations in finding the complete set of tRNA genes in a genome (Bakke et al.
2009). Some attempts have been made to improve the result by combining tRNAscan-SE
with other bioinformatics programs, such as Sim4 alignments or ARAGORN for the
tRNA gene detection in D. melanogaster and mouse, respectively (Misra et al. 2002;
Coughlin et al. 2009). However, tRNA genes reported from most of the genomes are
predicted genes and require supporting experimental data. There has been very limited
experimental evidence confirming the reliability of predicted tRNA genes so far. The
tRNA gene detection in mouse is among few efforts to make the tRNA gene finding more
reliable by verifying the expression of predicted tRNA genes from microarray data. In

107
this attempt, as described by Coughlin et al. (2009), predicted tRNA genes were
classified into different families according to their sequence similarity. Then,
oligonucleotides specific for each family were determined and used as probes in the
microarray analysis. The hybridization of RNAs extracted from mouse cells and the
probes confirmed the expression of the tRNA gene families. Although this procedure can
examine the expression levels of the tRNA groups, it is not able to confirm the reliability
of individual genes. In this thesis, the expression of tRNA genes predicted from the
genome of M. thermophila is verified by examining the sequenced short RNAs mapped
onto its predicted gene model. Besides, the reliability of each tRNA gene is confirmed by
comparing its primary and secondary structures to those of the experimentally
characterized fungal tRNAs. Furthermore, the prediction stage is carried out by not only
tRNAscan-SE but also three other widely used tools - tRNAfinder, SPLITSX and
ARAGORN. These additional predictors can complement the tRNA genes that may be
missed by tRNAscan-SE. In addition, when repeating the tRNA gene prediction on the
genomic regions that are mapped with a high number of short RNAs, no new tRNA gene
is found. Based on these reasons, it is likely that the complete set of tRNA genes in M.
thermophila has been detected, and the tRNA genes determined in this study are reliable.
4.2. Reliable tRNA data for the tRNA gene annotation in fungal genomes
The manually curated and annotated tRNA genes in M. thermophila as well as the
experimentally characterized fungal tRNAs and tRNA genes collected in this thesis can
be used as a reliable data set for the tRNA gene annotation in fungal genomes. Although
tRNAdb is a good source of tRNA data, it contains both automatically predicted and
experimentally identified tRNAs. Moreover, tRNA sequences provided in tRNAdb

108
database contain modified nucleotides while the unmodified sequences would be more
convenient for the tRNA sequence analysis in the tRNA gene annotation process. In this
thesis, the reliability of tRNA and tRNA genes extracted from tRNAdb is ensured by
examining their related literatures. Also, the unmodified tRNA sequences are provided by
using sequences from the GenBank database. For the tRNA genes of M. thermophila,
their reliability is confirmed according to the sequenced RNA data and the comparison to
the experimentally characterized fungal tRNA sequences. In addition to the reliable
tRNA sequences, the strictly conserved and semi-conserved nucleotides in the stems and
loops of cloverleaf structures found from analyzing the reliable tRNA sequences in this
thesis provide useful information for the tRNA gene detection in fungal genomes.
Besides, information of the transcriptional termination sites can support the tRNA
annotation results.
4.3. Comparing different tRNA gene predictors
When using the four widely used tRNA gene predictors (tRNAscan-SE, SPLITSX,
tRNAfinder and ARAGORN) in the tRNA gene detection in M. thermophila, tRNAscan-
SE and SPLITSX perform better than the others since they have the highest percentages
of correctly predicted genes. However, they did not find the complete set of tRNA genes.
There is one reliable tRNA gene uniquely predicted by ARAGORN. Therefore, to reduce
the possibility of missing genes, results from different predictors should be combined.
Advantages and better results obtained from combining multiple tRNA gene-finders have
been mentioned previously (Ardell 2010). Although the tools could detect the initiator
tRNAMet
, none of them is able to distinguish between the initiator and the elongator
tRNAMet
. Hence, the tools should be improved by adding features differentiating between

109
these two types of tRNAMet
. The typical characteristics of initiator tRNAs found from this
study can be used in this improvement.
4.4. Reliable AARS gene detection in M. thermophila
Like the tRNA gene detection process, the AARS gene finding procedure in this
thesis combines predicted and experimental data to increase the reliability of the detected
AARSs. The expression of each AARS gene is confirmed by examining the sequenced
transcripts. The cytoplasmic and mitochondrial functions as well as the amino acid
specificities of the AARS enzymes are assigned from the high sequence similarities with
the well-documented AARSs, the occurrences of the signature motifs and results from the
mitochondrial targeting peptide detection. According to results from the BLASTP search
against all predicted protein-encoding genes in M. thermophila and from the TBLASTN
search against the complete sequenced genome, it is likely that most of the AARS genes
of M. thermophila have been determined. Only mitochondrial glutaminyl-tRNA
synthetase is not detected. One possible explanation of this gene missing is that the
mitochondrion uses the indirect aminoacylation pathway which does not required
glutaminyl-tRNA synthetase to synthesize the Gln-tRNAGln
complex (Figure 14). This
explanation has been proposed for the missing mitochondrial glutaminyl-tRNA
synthetase in S. cerevisiae (Sissler et al. 2000). In brief, based on the sequenced RNA
data and results from the sequence comparison to the characterized aminocyl-tRNA
synthetases, the AARS enzymes found in M. thermophila are considered to be reliable.
These manually curated and annotated AARSs as well as the characterized AARSs
collected from the databases can be used as a reliable source of AARS data for the AARS
gene annotation in other genomes.

110
4.5. Genes encoding both mitochondrial and cytoplasmic AARSs
In M. thermophila, eight AARS genes specific for Ala, Arg, Asp, Cys, Gly, Lys, His
and Val encode both cytoplasmic and mitochondrial enzymes. Like the bifunctional
AARS genes that have been reported so far, those found in M. thermophila encode the
mitochondrial and cytoplasmic enzymes by harbouring two alternative start codons which
form two open reading frames (ORF) in the same frame. The longer ORF codes for the
mitochondrial AARS, and the shorter one codes for the cytoplasmic counterpart. The
bifunctional AARS genes have been found to encode AARSs of His, Val, Gly, Lys and
Ala (Natsoulis et al. 1986; Chatton et al. 1988; Kubelik, Turcq and Lambowitz 1991;
Tolkunova et al. 2000; Turner et al. 2000; H. L. Tang et al. 2004). This study provides
the first examples of bifunctional AARS genes of Asp, Cys and Arg.
4.6. Correlation between tRNA gene number, tRNA abundance and codon usage
Along with evidence previously reported in S. cerevisiae and B. subtilis, a significant
correlation between the numbers of tRNA genes and their expression levels is also
observed in M. thermophila although it is not as strong as those found previously. The
correlation coefficient values are 0.91 in S. cerevisiae (Percudani et al. 1997) and 0.86 in
B. subtilis (Kanaya et al. 1999) while this value is only 0.51 in M. thermophila. When
comparing the detected tRNA genes with the codon usage in M. thermophila, strong
correlations between tRNA gene numbers and codon frequencies as well as amino acid
frequencies are observed. This result is similar to those previously found in S. cerevisiae
(Percudani et al. 1997), C. elegans (Duret 2000) and C. albicans (Fan et al. 2007). This
evidence indicates that the number of tRNA genes is obviously a factor in the codon
selection of each organism. This relationship supports the hypothesis that natural

111
selection participates in the codon selection process since the adaptation of codon usage
to the tRNA availability would result in increasing either efficiency or fidelity of the
translation (Hershberg and Petrov 2008).
4.7. Potential of codon optimization in M. thermophila and a quick method for
determining preferred codons
Based on the complete set of tRNA genes found in M. thermophila, the optimal
codons, which match well with the tRNAs having the highest gene numbers, are
determined. These preferred codons can be applied in the codon optimization of the
protein production using M. thermophila as a host. The genes harbouring the preferred
codons may be translated more accurately and efficiently due to the high availability of
the corresponding tRNAs. In addition to using the number of tRNA genes to determine
the preferred codons, two other methods, which were based on the data sets of highly
expressed genes and the genes having low Nc values, were used and gave similar results.
Among the three methods, the one based on Nc values is the simplest method since it
does not need the complete tRNA gene set or the highly expressed protein encoding
genes. It suggests that this method can be used to quickly estimate the preferred codons
of an organism.

112
CHAPTER 5. CONCLUSIONS
By comparing the predicted gene models to the sequenced transcriptome data and
the characterized tRNA and AARS genes collected from the literature and different
databases, the exhaustive sets of tRNA and AARS genes were determined from the
nuclear genome of M. thermophila. The 194 tRNA genes found in this study can code for
all 20 universal amino acids. The 35 AARSs consist of both cytoplasmic and
mitochondrial aminoacyl-tRNA synthetases in M. thermophila. The cytoplasmic enzymes
comprise AARSs of all of the 20 amino acid specificities. For the mitochondrial AARSs,
only mitochondrial glutaminyl-tRNA synthetase is missing. The lack of this gene in M.
thermophila supports for the hypothesis that mitochondria use the indirect
aminoacylation path which does not require glutaminyl-tRNA synthetase for the
synthesis of Gln-tRNAGln
. The characterized tRNA and AARS genes collected from the
literature and the databases as well as those found in M. thermophila in this study can be
used as reliable tRNA and AARS data sets for the detection of these genes in other
genomes.
When comparing the four commonly used tRNA gene predictors – tRNAscan-SE,
SPLITSX, ARAGORN and tRNA finder, the tRNA gene detection results in this study
showed that predicted results from tRNAscan-SE and SPLITSX are better than those
from the other tools. However, to detect the complete set of tRNA genes in the genome,
multiple tRNA gene prediction programs should be combined to reduce the possibility of
missing genes.
There is a moderate correlation between tRNA gene number and tRNA abundance in
M. thermophila. Besides, strong correlations are observed between tRNA gene number

113
and codon frequency as well between tRNA gene number and amino acid frequency in
this organism. Evidence of the relationship between tRNA gene availability and codon
usage in M. thermophila indicates that natural selection plays a role in the codon
selection process. By analyzing the tRNA gene number and the codon frequencies, 17
preferred codons of 17 multiple codon coded amino acids, except for Ser, were
determined and could be applied to improve the protein production in M. thermophila.
Different methods which are based on the complete tRNA gene set, the highly expressed
genes and the genes having low Nc values are used to deduce the preferred codons and
give similar results. Among them, the method based on the genes having low Nc values is
the simplest one and could be used to quickly determine preferred codons in an organism.

114
REFERENCES
Abe, T., Ikemura, T., Sugahara, J., Kanai, A., Ohara, Y., Uehara, H. et al. (2011).
tRNADB-CE 2011: tRNA gene database curated manually by experts. Nucleic
Acids Res, 39, D210-213.
Ambrogelly, A., O'Donoghue, P., Soll, D., & Moses, S. (2010). A bacterial ortholog of
class II lysyl-tRNA synthetase activates lysine. FEBS Lett, 584(14), 3055-3060.
Antonellis, A., & Green, E. D. (2008). The role of aminoacyl-tRNA synthetases in
genetic diseases. Annu Rev Genomics Hum Genet, 9, 87-107.
Ardell, D. H. (2010). Computational analysis of tRNA identity. FEBS Lett, 584(2), 325-
333.
Arnez, J. G., & Moras, D. (1997). Structural and functional considerations of the
aminoacylation reaction. Trends Biochem Sci, 22(6), 211-216.
Arnez, J. G., & Moras, D. (2009). Aminoacyl-tRNA Synthetases. In: Encyclopedia of
Life Sciences (eLS). John Wiley & Sons, Ltd. Retrieved from:
http://dx.doi.org/10.1002/9780470015902.a0000530.pub2.
Ashburner, M., Ball, C. A., Blake, J. A., Botstein, D., Butler, H., Cherry, J. M. et al.
(2000). Gene ontology: tool for the unification of biology. The Gene Ontology
Consortium. Nat Genet, 25(1), 25-29.
Bakke, P., Carney, N., Deloache, W., Gearing, M., Ingvorsen, K., Lotz, M. et al. (2009).
Evaluation of three automated genome annotations for Halorhabdus utahensis.
PLoS One, 4(7), e6291.
Berka, R. M., Grigoriev, I. V., Otillar, R., Salamov, A., Grimwood, J., Reid, I. et al.
(2011). Comparative genomic analysis of the thermophilic biomass-degrading
fungi Myceliophthora thermophila and Thielavia terrestris. Nat Biotechnol,
29(10), 922-927.
Bjork, G. R., Ericson, J. U., Gustafsson, C. E., Hagervall, T. G., Jonsson, Y. H., &
Wikstrom, P. M. (1987). Transfer RNA modification. Annu Rev Biochem, 56,
263-287.
Böck, A. (2001). Selenocysteine. In: Encyclopedia of Life Sciences (eLS). John Wiley &
Sons, Ltd. Retrieved from: http://dx.doi.org/10.1038/npg.els.0003891.
Breathnach, R., & Chambon, P. (1981). Organization and expression of eucaryotic split
genes coding for proteins. Annu Rev Biochem, 50, 349-383.
115
Burks, C., Cinkosky, M. J., Fischer, W. M., Gilna, P., Hayden, J. E., Keen, G. M. et al.
(1992). GenBank. Nucleic Acids Res, 20 Suppl, 2065-2069.
Burset, M., Seledtsov, I. A., & Solovyev, V. V. (2001). SpliceDB: database of canonical
and non-canonical mammalian splice sites. Nucleic Acids Res, 29(1), 255-259.
Cantara, W. A., Crain, P. F., Rozenski, J., McCloskey, J. A., Harris, K. A., Zhang, X. et
al. (2011). The RNA Modification Database, RNAMDB: 2011 update. Nucleic
Acids Res, 39, D195-201.
Chan, P. P., & Lowe, T. M. (2009). GtRNAdb: a database of transfer RNA genes
detected in genomic sequence. Nucleic Acids Res, 37, D93-97.
Chapeville, F., Lipmann, F., Von Ehrenstein, G., Weisblum, B., Ray, W. J., Jr., &
Benzer, S. (1962). On the role of soluble ribonucleic acid in coding for amino
acids. Proc Natl Acad Sci U S A, 48, 1086-1092.
Chatton, B., Walter, P., Ebel, J. P., Lacroute, F., & Fasiolo, F. (1988). The yeast VAS1
gene encodes both mitochondrial and cytoplasmic valyl-tRNA synthetases. J Biol
Chem, 263(1), 52-57.
Commans, S., & Böck, A. (1999). Selenocysteine inserting tRNAs: an overview. FEMS
Microbiol Rev, 23(3), 335-351.
Coughlin, D. J., Babak, T., Nihranz, C., Hughes, T. R., & Engelke, D. R. (2009).
Prediction and verification of mouse tRNA gene families. RNA Biol, 6(2), 195-
202.
Crick, F. H. (1966). Codon - anticodon pairing: the wobble hypothesis. J Mol Biol, 19(2),
548-555.
Crooks, G. E., Hon, G., Chandonia, J. M., & Brenner, S. E. (2004). WebLogo: a sequence
logo generator. Genome Res, 14(6), 1188-1190.
del Rey, F. J., Donahue, T. F., & Fink, G. R. (1982). sigma, a repetitive element found
adjacent to tRNA genes of yeast. Proc Natl Acad Sci U S A, 79(13), 4138-4142.
Duret, L. (2000). tRNA gene number and codon usage in the C. elegans genome are co-
adapted for optimal translation of highly expressed genes. Trends Genet, 16(7),
287-289.
Eddy, S. R., & Durbin, R. (1994). RNA sequence analysis using covariance models.
Nucleic Acids Res, 22(11), 2079-2088.

116
Eigel, A., & Feldmann, H. (1982). Ty1 and delta elements occur adjacent to several
tRNA genes in yeast. EMBO J, 1(10), 1245-1250.
Emanuelsson, O., Nielsen, H., Brunak, S., & von Heijne, G. (2000). Predicting
subcellular localization of proteins based on their N-terminal amino acid
sequence. J Mol Biol, 300(4), 1005-1016.
Encyclopædia Britannica. (2012). transfer RNA (tRNA), from:
http://www.britannica.com/EBchecked/topic/602542/transfer-RNA
Eriani, G., Cavarelli, J., Martin, F., Ador, L., Rees, B., Thierry, J. C. et al. (1995). The
class II aminoacyl-tRNA synthetases and their active site: evolutionary
conservation of an ATP binding site. J Mol Evol, 40(5), 499-508.
Fan, J., Savard, F., Wu, M., & Shen, S.-H. (2007). A full complement of transfer RNA
genes in the Candida albicans genome. In: Communicating Current Research and
Educational Topics and Trends in Applied Microbiology (Vol. 2, pp. 915-925).
Spain. Formatex. Retrieved from:
http://www.formatex.org/microbio/pdf/pages915-925.pdf.
Felsenstein, J. (1981). Evolutionary trees from DNA sequences: a maximum likelihood
approach. J Mol Evol, 17(6), 368-376.
Felsenstein, J. (1985). Confidence-Limits on Phylogenies - an Approach Using the
Bootstrap. Evolution, 39(4), 783-791.
Fichant, G. A., & Burks, C. (1991). Identifying potential tRNA genes in genomic DNA
sequences. J Mol Biol, 220(3), 659-671.
Gaston, M. A., Jiang, R., & Krzycki, J. A. (2011). Functional context, biosynthesis, and
genetic encoding of pyrrolysine. Curr Opin Microbiol, 14(3), 342-349.
Gauss, D. H., & Sprinzl, M. (1983a). Compilation of sequences of tRNA genes. Nucleic
Acids Res, 11(1), r55-103.
Gauss, D. H., & Sprinzl, M. (1983b). Compilation of tRNA sequences. Nucleic Acids
Res, 11(1), r1-53.
Genbauffe, F. S., Chisholm, G. E., & Cooper, T. G. (1984). Tau, sigma, and delta. A
family of repeated elements in yeast. J Biol Chem, 259(16), 10518-10525.
Gillum, A. M., Hecker, L. I., Silberklang, M., Schwartzbach, S. D., RajBhandary, U. L.,
& Barnett, W. E. (1977). Nucleotide sequence of Neurospora crassa cytoplasmic
initiator tRNA. Nucleic Acids Res, 4(12), 4109-4131.

117
Goldman, E. (2008). Transfer RNA. In: Encyclopedia of Life Sciences (eLS). John Wiley
& Sons, Ltd. Retrieved from:
http://dx.doi.org/10.1002/9780470015902.a0000878.pub2.
Guo, M., Yang, X. L., & Schimmel, P. (2010). New functions of aminoacyl-tRNA
synthetases beyond translation. Nat Rev Mol Cell Biol, 11(9), 668-674.
Hamada, M., Sakulich, A. L., Koduru, S. B., & Maraia, R. J. (2000). Transcription
termination by RNA polymerase III in fission yeast. A genetic and biochemically
tractable model system. J Biol Chem, 275(37), 29076-29081.
Hans, V., Vivi, J., J., P. P., V., G. A., T., O. P., Rob, J. et al. (2011). Development of a
mature fungal technology and production platform for industrial enzymes based
on a Myceliophthora thermophila isolate, previously known as Chrysosporium
lucknowense C1. Industrial Biotechnology, 7(3), 214-223.
Hatfield, D., Choi, I. S., Mischke, S., & Owens, L. D. (1992). Selenocysteyl-tRNAs
recognize UGA in Beta vulgaris, a higher plant, and in Gliocladium virens, a
filamentous fungus. Biochem Biophys Res Commun, 184(1), 254-259.
Hershberg, R., & Petrov, D. A. (2008). Selection on codon bias. Annu Rev Genet, 42,
287-299.
Higgins, D. G., Fuchs, R., Stoehr, P. J., & Cameron, G. N. (1992). The EMBL Data
Library. Nucleic Acids Res, 20 Suppl, 2071-2074.
Ibba, M., Becker, H. D., Stathopoulos, C., Tumbula, D. L., & Soll, D. (2000). The
adaptor hypothesis revisited. Trends Biochem Sci, 25(7), 311-316.
Ibba, M., & Soll, D. (2001). The renaissance of aminoacyl-tRNA synthesis. EMBO Rep,
2(5), 382-387.
Ikemura, T. (1981). Correlation between the abundance of Escherichia coli transfer
RNAs and the occurrence of the respective codons in its protein genes: a proposal
for a synonymous codon choice that is optimal for the E. coli translational system.
J Mol Biol, 151(3), 389-409.
Ikemura, T. (1982). Correlation between the abundance of yeast transfer RNAs and the
occurrence of the respective codons in protein genes. Differences in synonymous
codon choice patterns of yeast and Escherichia coli with reference to the
abundance of isoaccepting transfer RNAs. J Mol Biol, 158(4), 573-597.
Ikemura, T. (1985). Codon usage and tRNA content in unicellular and multicellular
organisms. Mol Biol Evol, 2(1), 13-34.

118
Ikemura, T., & Ozeki, H. (1983). Codon usage and transfer RNA contents: organism-
specific codon-choice patterns in reference to the isoacceptor contents. Cold
Spring Harb Symp Quant Biol, 47 Pt 2, 1087-1097.
Itoh, T., Tanaka, T., Barrero, R. A., Yamasaki, C., Fujii, Y., Hilton, P. B. et al. (2007).
Curated genome annotation of Oryza sativa ssp. japonica and comparative
genome analysis with Arabidopsis thaliana. Genome Res, 17(2), 175-183.
Juhling, F., Morl, M., Hartmann, R. K., Sprinzl, M., Stadler, P. F., & Putz, J. (2009).
tRNAdb 2009: compilation of tRNA sequences and tRNA genes. Nucleic Acids
Res, 37, D159-162.
Kanaya, S., Yamada, Y., Kudo, Y., & Ikemura, T. (1999). Studies of codon usage and
tRNA genes of 18 unicellular organisms and quantification of Bacillus subtilis
tRNAs: gene expression level and species-specific diversity of codon usage based
on multivariate analysis. Gene, 238(1), 143-155.
Kent, W. J. (2002). BLAT-the BLAST-like alignment tool. Genome Res, 12(4), 656-664.
Kinouchi, M., & Kurokawa, K. (2006). tRNAfinder: A Software System To Find All
tRNA Genes in the DNA Sequence Based on the Cloverleaf Secondary Structure
Journal of Computer Aided Chemistry, 7, 116-124.
Kitamura-Abe, S., Itoh, H., Washio, T., Tsutsumi, A., & Tomita, M. (2004).
Characterization of the splice sites in GT-AG and GC-AG introns in higher
eukaryotes using full-length cDNAs. J Bioinform Comput Biol, 2(2), 309-331.
Kubelik, A. R., Turcq, B., & Lambowitz, A. M. (1991). The Neurospora crassa cyt-20
gene encodes cytosolic and mitochondrial valyl-tRNA synthetases and may have
a second function in addition to protein synthesis. Mol Cell Biol, 11(8), 4022-
4035.
Langmead, B., Trapnell, C., Pop, M., & Salzberg, S. L. (2009). Ultrafast and memory-
efficient alignment of short DNA sequences to the human genome. Genome Biol,
10(3), R25.
Laslett, D., & Canback, B. (2004). ARAGORN, a program to detect tRNA genes and
tmRNA genes in nucleotide sequences. Nucleic Acids Res, 32(1), 11-16.
Lowe, T. M., & Eddy, S. R. (1997). tRNAscan-SE: a program for improved detection of
transfer RNA genes in genomic sequence. Nucleic Acids Res, 25(5), 955-964.
Marechal-Drouard, L., Weil, J. H., & Dietrich, A. (1993). Transfer RNAs and Transfer
RNA Genes in Plants. Annual Review of Plant Physiology and Plant Molecular
Biology, 44(1), 13-32.
119
Mattick, J. S., & Makunin, I. V. (2006). Non-coding RNA. Hum Mol Genet, 15 Spec No
1, R17-29.
Misra, S., Crosby, M. A., Mungall, C. J., Matthews, B. B., Campbell, K. S., Hradecky, P.
et al. (2002). Annotation of the Drosophila melanogaster euchromatic genome: a
systematic review. Genome Biol, 3(12), RESEARCH0083.
Mohan, A., Whyte, S., Wang, X., Nashimoto, M., & Levinger, L. (1999). The 3' end
CCA of mature tRNA is an antideterminant for eukaryotic 3'-tRNase. RNA, 5(2),
245-256.
Mortazavi, A., Williams, B. A., McCue, K., Schaeffer, L., & Wold, B. (2008). Mapping
and quantifying mammalian transcriptomes by RNA-Seq. Nat Methods, 5(7), 621-
628.
Natsoulis, G., Hilger, F., & Fink, G. R. (1986). The HTS1 gene encodes both the
cytoplasmic and mitochondrial histidine tRNA synthetases of S. cerevisiae. Cell,
46(2), 235-243.
Nielsen, H., Engelbrecht, J., Brunak, S., & von Heijne, G. (1997). Identification of
prokaryotic and eukaryotic signal peptides and prediction of their cleavage sites.
Protein Eng, 10(1), 1-6.
Ohama, T., Suzuki, T., Mori, M., Osawa, S., Ueda, T., Watanabe, K. et al. (1993). Non-
universal decoding of the leucine codon CUG in several Candida species. Nucleic
Acids Res, 21(17), 4039-4045.
Parks, T. D., Dougherty, W. G., Levings, C. S., & Timothy, D. H. (1984). Identification
of two methionine transfer RNA genes in the maize mitochondrial genome. Plant
Physiol, 76(4), 1079-1082.
Pavesi, A., Conterio, F., Bolchi, A., Dieci, G., & Ottonello, S. (1994). Identification of
new eukaryotic tRNA genes in genomic DNA databases by a multistep weight
matrix analysis of transcriptional control regions. Nucleic Acids Res, 22(7), 1247-
1256.
Peden, J. (2005, April 15th). Correspondence Analysis of Codon Usage, from:
http://codonw.sourceforge.net/#Downloading%20and%20Installation
Pel, H. J., de Winde, J. H., Archer, D. B., Dyer, P. S., Hofmann, G., Schaap, P. J. et al.
(2007). Genome sequencing and analysis of the versatile cell factory Aspergillus
niger CBS 513.88. Nat Biotechnol, 25(2), 221-231.
Percudani, R., Pavesi, A., & Ottonello, S. (1997). Transfer RNA gene redundancy and
translational selection in Saccharomyces cerevisiae. J Mol Biol, 268(2), 322-330.

120
Perreau, V. M., Santos, M. A., & Tuite, M. F. (1997). Beta, a novel repetitive DNA
element associated with tRNA genes in the pathogenic yeast Candida albicans.
Mol Microbiol, 25(2), 229-236.
Phizicky, E. M., & Hopper, A. K. (2010). tRNA biology charges to the front. Genes Dev,
24(17), 1832-1860.
Plotkin, J. B., & Kudla, G. (2011). Synonymous but not the same: the causes and
consequences of codon bias. Nat Rev Genet, 12(1), 32-42.
RajBhandary, U. L., & Ghosh, H. P. (1969). Studies on polynucleotides. XCI. Yeast
methionine transfer ribonucleic acid: purification, properties, and terminal
nucleotide sequences. J Biol Chem, 244(5), 1104-1113.
Randau, L., & Soll, D. (2008). Transfer RNA genes in pieces. EMBO reports, 9(7), 623-
628.
Saitou, N., & Nei, M. (1987). The neighbor-joining method: a new method for
reconstructing phylogenetic trees. Mol Biol Evol, 4(4), 406-425.
Santos, M. A., Keith, G., & Tuite, M. F. (1993). Non-standard translational events in
Candida albicans mediated by an unusual seryl-tRNA with a 5'-CAG-3' (leucine)
anticodon. EMBO J, 12(2), 607-616.
Schmidt, O., & Söll, D. (1981). Biosynthesis of Eukaryotic Transfer RNA. BioScience,
31(1), 34-39.
Schuster, P., Fontana, W., Stadler, P. F., & Hofacker, I. L. (1994). From sequences to
shapes and back: a case study in RNA secondary structures. Proc Biol Sci,
255(1344), 279-284.
Sekine, S., Shimada, A., Nureki, O., Cavarelli, J., Moras, D., Vassylyev, D. G. et al.
(2001). Crucial role of the high-loop lysine for the catalytic activity of arginyl-
tRNA synthetase. J Biol Chem, 276(6), 3723-3726.
Sissler, M., Pütz, J., Fasiolo, F., & Florentz., C. (2000). Mitochondrial Aminoacyl-tRNA
Synthetases. In: Madame Curie Bioscience Database. Austin (TX): Landes
Bioscience. Retrieved from: http://www.ncbi.nlm.nih.gov/books/NBK6033/.
Söll, D., & RajBhandary, U. (1995). tRNA : structure, biosynthesis, and function.
Washington, D.C. ASM Press.
Sprinzl, M., Dank, N., Nock, S., & Schon, A. (1991). Compilation of tRNA sequences
and sequences of tRNA genes. Nucleic Acids Res, 19 Suppl, 2127-2171.

121
Sprinzl, M., & Gauss, D. H. (1982). Compilation of sequences of tRNA genes. Nucleic
Acids Res, 10(2), r57-81.
Sprinzl, M., & Gauss, D. H. (1984). Compilation of sequences of tRNA genes. Nucleic
Acids Res, 12 Suppl, r59-131.
Sprinzl, M., Hartmann, T., Meissner, F., Moll, J., & Vorderwulbecke, T. (1987).
Compilation of tRNA sequences and sequences of tRNA genes. Nucleic Acids
Res, 15 Suppl, r53-188.
Sprinzl, M., Hartmann, T., Weber, J., Blank, J., & Zeidler, R. (1989). Compilation of
tRNA sequences and sequences of tRNA genes. Nucleic Acids Res, 17 Suppl, r1-
172.
Sprinzl, M., Horn, C., Brown, M., Ioudovitch, A., & Steinberg, S. (1998). Compilation of
tRNA sequences and sequences of tRNA genes. Nucleic Acids Res, 26(1), 148-
153.
Sprinzl, M., Steegborn, C., Hubel, F., & Steinberg, S. (1996). Compilation of tRNA
sequences and sequences of tRNA genes. Nucleic Acids Res, 24(1), 68-72.
Sprinzl, M., & Vassilenko, K. S. (2005). Compilation of tRNA sequences and sequences
of tRNA genes. Nucleic Acids Res, 33, D139-140.
Sprinzl, M., Vorderwulbecke, T., & Hartmann, T. (1985). Compilation of sequences of
tRNA genes. Nucleic Acids Res, 13 Suppl, r51-104.
Stadtman, T. C. (1996). Selenocysteine. Annu Rev Biochem, 65, 83-100.
Stein, L. D., Mungall, C., Shu, S., Caudy, M., Mangone, M., Day, A. et al. (2002). The
generic genome browser: a building block for a model organism system database.
Genome Res, 12(10), 1599-1610.
Steinberg, S., Misch, A., & Sprinzl, M. (1993). Compilation of tRNA sequences and
sequences of tRNA genes. Nucleic Acids Res, 21(13), 3011-3015.
Sugahara, J., Yachie, N., Arakawa, K., & Tomita, M. (2007). In silico screening of
archaeal tRNA-encoding genes having multiple introns with bulge-helix-bulge
splicing motifs. RNA, 13(5), 671-681.
Suzuki, T., Ueda, T., Yokogawa, T., Nishikawa, K., & Watanabe, K. (1994).
Characterization of serine and leucine tRNAs in an asporogenic yeast Candida
cylindracea and evolutionary implications of genes for tRNA(Ser)CAG
responsible for translation of a non-universal genetic code. Nucleic Acids Res,
22(2), 115-123.

122
Szymanski, M., Deniziak, M., & Barciszewski, J. (2000). The new aspects of aminoacyl-
tRNA synthetases. Acta Biochim Pol, 47(3), 821-834.
Tamura, K., Peterson, D., Peterson, N., Stecher, G., Nei, M., & Kumar, S. (2011).
MEGA5: molecular evolutionary genetics analysis using maximum likelihood,
evolutionary distance, and maximum parsimony methods. Mol Biol Evol, 28(10),
2731-2739.
Tang, D. T., Glazov, E. A., McWilliam, S. M., Barris, W. C., & Dalrymple, B. P. (2009).
Analysis of the complement and molecular evolution of tRNA genes in cow.
BMC Genomics, 10, 188.
Tang, H. L., Yeh, L. S., Chen, N. K., Ripmaster, T., Schimmel, P., & Wang, C. C.
(2004). Translation of a yeast mitochondrial tRNA synthetase initiated at
redundant non-AUG codons. J Biol Chem, 279(48), 49656-49663.
The Gene Ontology Consortium (1999). The Gene Ontology, from:
http://www.geneontology.org/GO.evidence.tree.shtml
Thompson, J. D., Gibson, T. J., & Higgins, D. G. (2002). Multiple sequence alignment
using ClustalW and ClustalX. Curr Protoc Bioinformatics, Chapter 2, Unit 2 3.
Toh, Y., Hori, H., Tomita, K., Ueda, T., & Watanabe, K. (2001). Transfer RNA Synthesis
and Regulation. In: Encyclopedia of Life Sciences (eLS). John Wiley & Sons,
Ltd. Retrieved from: http://dx.doi.org/10.1002/9780470015902.a0000529.pub2.
Tolkunova, E., Park, H., Xia, J., King, M. P., & Davidson, E. (2000). The human lysyl-
tRNA synthetase gene encodes both the cytoplasmic and mitochondrial enzymes
by means of an unusual alternative splicing of the primary transcript. J Biol
Chem, 275(45), 35063-35069.
Trapnell, C., & Salzberg, S. L. (2009). How to map billions of short reads onto genomes.
Nat Biotechnol, 27(5), 455-457.
Turanov, A. A., Xu, X. M., Carlson, B. A., Yoo, M. H., Gladyshev, V. N., & Hatfield, D.
L. (2011). Biosynthesis of selenocysteine, the 21st amino acid in the genetic code,
and a novel pathway for cysteine biosynthesis. Adv Nutr, 2(2), 122-128.
Turner, R. J., Lovato, M., & Schimmel, P. (2000). One of two genes encoding glycyl-
tRNA synthetase in Saccharomyces cerevisiae provides mitochondrial and
cytoplasmic functions. J Biol Chem, 275(36), 27681-27688.
Westhof, E., & Auffinger, P. (2001). Transfer RNA Structure. In: Encyclopedia of Life
Sciences (eLS). John Wiley & Sons, Ltd. Retrieved from:
http://dx.doi.org/10.1038/npg.els.0000527.

123
Wright, F. (1990). The 'effective number of codons' used in a gene. Gene, 87(1), 23-29.
Yamashiro-Matsumura, S., & Takemura, S. (1979). The primary structure of cytoplasmic
initiator transfer ribonucleic acid from Torulopsis utilis. J Biochem, 86(2), 335-
346.
Zhang, Y., Baranov, P. V., Atkins, J. F., & Gladyshev, V. N. (2005). Pyrrolysine and
selenocysteine use dissimilar decoding strategies. J Biol Chem, 280(21), 20740-
20751.
Zhou, X. L., Du, D. H., Tan, M., Lei, H. Y., Ruan, L. L., Eriani, G. et al. (2011). Role of
tRNA amino acid-accepting end in aminoacylation and its quality control. Nucleic
Acids Res, 39(20), 8857-8868.

124
APPENDICES
Supplementary table 1. tRNA gene prediction results from tRNAscan-SE
AA* : Gene number Anticodon: Gene number
Ala: 12 AGC:7 CGC:3 GGC:0 TGC:2
Arg: 13 ACG:7 CCG:2 CCT:2 GCG:0 TCG:1 TCT:1
Asn: 6 ATT:0 GTT:6
Asp: 10 ATC:0 GTC:10
Cys: 3 ACA:0 GCA:3
Gln: 7 CTG:5 TTG:2
Glu: 10 CTC:8 TTC:2
Gly: 17 ACC:0 CCC:2 GCC:11 TCC:4
His: 4 ATG:0 GTG:4
Ile: 9 AAT:8 GAT:1 TAT:1
Leu: 15 AAG:7 CAA:2 CAG:4 GAG:0 TAA:1 TAG:1
Lys: 12 CTT:9 TTT:3
Met: 8 CAT:8
Phe: 5 AAA:0 GAA:5
Pro: 11 AGG:6 CGG:3 GGG:0 TGG:3
Ser: 16 ACT:0 AGA:5 CGA:3 GCT:5 GGA:0 TGA:3
Thr: 11 AGT:6 CGT:3 GGT:0 TGT:2
Trp: 4 CCA:4
Tyr: 6 ATA:0 GTA:6
Val: 12 AAC:7 CAC:3 GAC:0 TAC:2
SeC: 1 TCA:1
Pseudo:2 GAT:1 TGG:1
(*)
AA: amino acid

125
Supplementary table 2. tRNA genes predicted by ARAGORN
AA : Gene number Anticodon: Gene number
Ala: 25 AGC:4 CGC:9 GGC:4 TGC:8
Arg: 34 ACG:6 CCG:7 CCT:4 GCG:4 TCG:7 TCT:6
Asn: 9 ATT:1 GTT:8
Asp: 14 ATC:1 GTC:13
Cys: 3 ACA:0 GCA:3
Gln: 10 CTG:6 TTG:4
Glu: 19 CTC:16 TTC:3
Gly: 25 ACC:2 CCC:3 GCC:14 TCC:6
His: 10 ATG:1 GTG:9
Ile: 10 AAT:7 GAT:2 TAT:1
Leu: 23 AAG:8 CAA:4 CAG:6 GAG:3 TAA:1 TAG:1
Lys: 19 CTT:12 TTT:7
Met: 7 CAT:7
Phe: 4 AAA:3 GAA:1
Pro: 21 AGG:6 CGG:6 GGG:3 TGG:6
Ser: 38 ACT:3 AGA:5 CGA:9 GCT:12 GGA:4 TGA:5
Thr: 28 AGT:7 CGT:6 GGT:8 TGT:7
Trp: 5 CCA:5
Tyr: 10 ATA:1 GTA:9
Val: 20 AAC:8 CAC:5 GAC:5 TAC:2
SeC: 4 TCA:4
Pyl: 1 CTA:1
Stop: 6 TTA:6
Pseudo: 4
Supplementary table 3. tRNA genes predicted by tRNAfinder
AA : Gene number Anticodon: Gene number
Ala: 11 AGC:6 CGC:3 GGC:0 TGC:2
Arg: 15 ACG:7 CCG:2 CCT:2 GCG:0 TCG:2 TCT:2
Asn: 6 ATT:0 GTT:6
Asp: 11 ATC:1 GTC:10
Cys: 3 ACA:0 GCA:3
Gln: 7 CTG:5 TTG:2
Glu: 10 CTC:8 TTC:2
Gly: 16 ACC:0 CCC:2 GCC:11 TCC:3
His: 4 ATG:0 GTG:4
Ile: 10 AAT:8 GAT:1 TAT:1
Leu: 15 AAG:7 CAA:2 CAG:4 GAG:0 TAA:1 TAG:1
Lys: 12 CTT:9 TTT:3
Met: 8 CAT:8
Phe: 7 AAA:0 GAA:7
Pro: 11 AGG:6 CGG:3 GGG:0 TGG:2
Ser: 16 ACT:0 AGA:5 CGA:3 GCT:5 GGA:0 TGA:3
Thr: 11 AGT:6 CGT:3 GGT:0 TGT:2
Trp: 4 CCA:4
Tyr: 0 ATA:0 GTA:0
Val: 12 AAC:7 CAC:3 GAC:0 TAC:2
SeC: 1 TCA:1

126
Supplementary table 4. Experimentally characterized fungal tRNAs and tRNA genes collected in this study
Species Strain Amino
acid Anticodon
Gene ID
(tRNAdb)
Gene ID
(Genbank)
tRNA ID
(tRNAdb)
tRNA ID
(Genbank)
Literature
(PMIDs)
Candida albicans unknown Ser CAG tdbD00001753
tdbD00002874 X64564 tdbR00000618 none 8440250
Candida albicans 2005E Ala AGC tdbD00000217 Y08493 none none 9282735
Candida albicans 2005E Asp GUC tdbD00000499 Y08491 none none 9282735
Candida albicans 2005E Ile AAU tdbD00001319 Y08492 none none 9282735
Candida cylindracea unknown Leu CAA none none tdbR00000253 D14894 8121794
Candida cylindracea unknown Leu IAG none none tdbR00000254 D14895 8121794
Candida cylindracea unknown Leu IAG none none tdbR00000255 D14896 8121794
Candida cylindracea MS_5 Ser CAG tdbD00002886 S42192 tdbR00000409
D12939
S42406
8121794
1502151
Candida cylindracea unknown Ser UGA none none tdbR00000410 D14897 8121794
Candida cylindracea unknown Ser IGA none none tdbR00000411 D14898 8121794
Candida cylindracea unknown Ser CGA none none tdbR00000412 D14899 8121794
Candida cylindracea unknown Ser GCU none none tdbR00000413 D14900 8121794
Candida guilliermondii JCM1539 Ser CAG tdbD00001759 D17533 none none 7748957
Candida lusitaniae JCM5936 Ser CAG tdbD00001758 D17534 none none 7748957
Candida melibiosica JCM 1613 Ser CAG none none none none 8371978
Candida parapsilosis JCM 1785 Ser CAG none none none none 8371978
Candida rugosa JCM 1619 Ser CAG none none none none 8371978
Candida tropicalis JCM1541 Ser CAG tdbD00001757 D17535 none none 7748957
Candida utilis unknown Ala IGC none none tdbR00000013 M35061 4796875
Candida utilis unknown Ile IAU none none tdbR00000171 K01061 5817084
Candida utilis unknown Met CAU none none tdbR00000528 K00323 573264
Candida utilis TFO 1086 Leu CAA none none tdbR00000252 K00232 350863
Candida utilis unknown Pro UGG none none tdbR00000325 K00357 6920386

127
Species Strain Amino
acid Anticodon
Gene ID
(tRNAdb)
Gene ID
(Genbank)
tRNA ID
(tRNAdb)
tRNA ID
(Genbank)
Literature
(PMIDs)
Candida utilis unknown Tyr GUA none none tdbR00000557 M24830 4308683
Candida utilis unknown Val IAC none none none X02700 4305011
Candida zeylanoides JCM 1627 Ser CAG none none none none 8371978
Neurospora crassa OR23_1A Met CAU none none tdbR00000525 K00316 146192
Neurospora crassa unknown Phe GAA tdbD00000784 J01251 tdbR00000082 X02710
6449692
6449691
Neurospora crassa 74A Leu AAG tdbD00001752 X00736 none none 6235483
Podospora anserina unknown Ser UGA tdbD00002875 X05227 none none 3937728
Podospora anserina unknown Ser UGA tdbD00002876 X05226 none none 3937728
Saccharomyces cerevisiae VP64_9A Ala IGC tdbD00000219 X13793 tdbR00000012 K01059
2648329
1089070
Saccharomyces cerevisiae unknown Arg UCU tdbD00002586
X00375
J01378
J01377
tdbR00000370 K00158
6321234
6253814
6986864
Saccharomyces cerevisiae unknown Arg UCU none none tdbR00000371 K00159 6986864
Saccharomyces cerevisiae unknown Arg ICG tdbD00002585 V01330 tdbR00000369 K00157
16453416
1100396
Saccharomyces cerevisiae unknown Arg CCU tdbD00002587 V01326 none none 16453444
Saccharomyces cerevisiae J24_24A Asn GUU tdbD00002076 X58787 tdbR00000300 M26099
1840659
6395902
Saccharomyces cerevisiae unknown Asp GUC tdbD00000502 M10994 tdbR00000035 K00171
3886659
4551153
Saccharomyces cerevisiae unknown Ala UGC tdbD00000218 M10958 none none 3886659
Saccharomyces cerevisiae unknown Cys GCA tdbD00000372 K02653 tdbR00000021 X01939
6088502
819006
Saccharomyces cerevisiae unknown Glu UUC tdbD00000644
K02652
K02652
K02651
Z00039
tdbR00000054 K00191
6088502
4376021
Saccharomyces cerevisiae C836 Glu CUC tdbD00000645 X06132 none none 2833361
Saccharomyces cerevisiae unknown His GUG none none tdbR00000144 M26097 6370316

128
Species Strain Amino
acid Anticodon
Gene ID
(tRNAdb)
Gene ID
(Genbank)
tRNA ID
(tRNAdb)
tRNA ID
(Genbank)
Literature
(PMIDs)
Saccharomyces cerevisiae S288c His GUG tdbD00001112
K01597
K01596
K01595
tdbR00000145 M26098
6305975
6370316
Saccharomyces cerevisiae unknown Pro UGG none none tdbR00000323 M26096 6370316
Saccharomyces cerevisiae X2180 Gly GCC tdbD00000951
X05272
U19971
X05269
X05270
M10995
tdbR00000129 K00204
3039147
3886659
4569887
Saccharomyces cerevisiae unknown Gly UCC none X05271
X05265 tdbR00000130 none 3039147
Saccharomyces cerevisiae ATCC 25657 Ile IAU tdbD00001320 X05058 tdbR00000170 K02004
3547324
6370253
Saccharomyces cerevisiae DBY939 Met CAU tdbD00003496
M22701
M22702 tdbR00000526 K00321
3011608
4344891
Saccharomyces cerevisiae unknown Met CAU tdbD00003495 J01373 none none 6278434
Saccharomyces cerevisiae unknown Leu CAA tdbD00001754 J01370 tdbR00000249 K00228
387786
4574158
Saccharomyces cerevisiae unknown Leu UAA tdbD00001756 X69765 tdbR00000251 X63952
8394042
1799629
Saccharomyces cerevisiae unknown Leu UAG none none tdbR00000250 K00229 374075
Saccharomyces cerevisiae unknown Lys UUU tdbD00001463 none tdbR00000193
K00287
M36150
4589316
17778175
Saccharomyces cerevisiae alpha S288c Lys CUU none none tdbR00000192 K00286 4576137
Saccharomyces cerevisiae Y185, C836 Met CAU tdbD00001919 Z00037 tdbR00000284 M10268
6253952
826525
Saccharomyces cerevisiae 5178 IC2X2B2 Phe GAA tdbD00000785
J01369
J01368
J01367
tdbR00000083
K01553
X00655
M14856
343104
5637712
3545201
Saccharomyces cerevisiae unknown Phe GAA none none tdbR00000084 M14867 3545201
Saccharomyces cerevisiae unknown Phe GAA tdbD00000786 M17332 none none 3308382
Saccharomyces cerevisiae C836 Thr IGU tdbD00003079 X56504 tdbR00000443 K00278
2011498
992092

129
Species Strain Amino
acid Anticodon
Gene ID
(tRNAdb)
Gene ID
(Genbank)
tRNA ID
(tRNAdb)
tRNA ID
(Genbank)
Literature
(PMIDs)
Saccharomyces cerevisiae unknown Thr IGU none none tdbR00000444 K00279 992092
Saccharomyces cerevisiae C836 Thr CGU tdbD00003080 none none none 2011498
Saccharomyces cerevisiae unknown Trp CCA tdbD00003403 S48358 tdbR00000494 M35060
1398091
4350483
Saccharomyces cerevisiae unknown Ser IGA none none tdbR00000407 K01557 5991670
Saccharomyces cerevisiae unknown Ser IGA tdbD00002877 V01329 tdbR00000407 K01558
16453416
5991670
Saccharomyces cerevisiae unknown Ser CGA tdbD00002879 none none K00367 355641
Saccharomyces cerevisiae unknown Ser UGA tdbD00002880 K00572 tdbR00000406 K00368
6262655
355641
389430
Saccharomyces cerevisiae unknown Tyr GUA tdbD00003654
J01383
J01382 J01380
tdbR00000555 M10266
341157
5938777
Saccharomyces cerevisiae unknown Val UAC none none tdbR00000466 M35070 4606852
Saccharomyces cerevisiae unknown Val CAC none none tdbR00000465 K00249 410008
Saccharomyces cerevisiae unknown Val IAC tdbD00003245 V01331 tdbR00000464 K00248
16453416
4375496
Saccharomyces cerevisiae unknown Val AAC tdbD00003246 X54514 none none 2235498
Saccharomyces cerevisiae unknown Gln CUG tdbD00002387 M29654 none none 3295253
Saccharomyces cerevisiae unknown Gln UUG tdbD00002386
X02445
V01295 none none 2989539
Schizosaccharomyces pombe unknown Glu UUC none none tdbR00000055 X01325 379816
Schizosaccharomyces pombe unknown Glu UUC tdbD00000647 X00239 none none 6561518
Schizosaccharomyces pombe unknown Lys CUU tdbD00001466 X00283 none none 6561518
Schizosaccharomyces pombe unknown Arg ACG tdbD00002588 X00239 none none 6561518
Schizosaccharomyces pombe unknown Arg ACG tdbD00002589 X00240 none none 6561518
Schizosaccharomyces pombe unknown Asp GUC tdbD00000503 K00570 none none 6561518
Schizosaccharomyces pombe unknown His GUG tdbD00001113 X00241 none none 6561518

130
Species Strain Amino
acid Anticodon
Gene ID
(tRNAdb)
Gene ID
(Genbank)
tRNA ID
(tRNAdb)
tRNA ID
(Genbank)
Literature
(PMIDs)
Schizosaccharomyces pombe unknown Met CAU tdbD00003497 V01360 tdbR00000527 X69095
7407924
8332511
Schizosaccharomyces pombe unknown Phe GAA tdbD00000789 X00242 tdbR00000085 K00344
6561518
247991
Schizosaccharomyces pombe 972h_ Tyr GUA none none tdbR00000556 K00273 116193
Schizosaccharomyces pombe 972h_ Tyr GUA none none none K00272 116193
Supplementary table 5. Experimentally characterized fungal cytoplasmic AARSs collected in this study
Species Strain Gene
name Enzyme name
Function(*)
Protein
length
Gene ID
(Genbank) Protein ID
(UniProt)
Literature
(PMIDs)
Saccharomyces cerevisiae GRF88 ALA1 Alanyl-tRNA synthetase cyt + mit 958 U18672 P40825 7761427
Saccharomyces cerevisiae S288c DED81 Asparaginyl-tRNA synthetase cyt 554 NC_001140 P38707 9605503
Saccharomyces cerevisiae unknown DPS1 Aspartyl-tRNA synthetase cyt 557 X03606 P04802 3513127
Saccharomyces cerevisiae X2180 YNL247W Cysteinyl-tRNA synthetase cyt 767 Z71523 P53852 9523015
Saccharomyces cerevisiae S288c GLN4 Glutaminyl-tRNA synthetase cyt 809 J02784 P13188 3301841
Saccharomyces cerevisiae unknown GUS1 Glutamyl-tRNA synthetase cyt 708 U32265 P46655 11069915
Saccharomyces cerevisiae S288c GRS1 Glycyl-tRNA Synthase cyt + mit 667
Z35990
X78993
BK006936
P38088 10874035
Saccharomyces cerevisiae S288c GRS2 Glycyl-tRNA Synthase cyt 618 U51033 Q06817 10874035
Saccharomyces cerevisiae unknown HTS1 Histidine-Trna Synthetase cyt + mit 526 M14048 P07263 3521891
Saccharomyces cerevisiae S288c ILS1 Isoleucine-tRNA Synthetase cyt 1072 M19992 P09436 3311074
Saccharomyces cerevisiae S288c CDC60 Leucyl-tRNA synthetase cyt 1090 X62878 P26637 1398122
Saccharomyces cerevisiae X2180 KRS1 Lysyl-tRNA synthetase cyt 591 J04186 P15180 2903861
Saccharomyces cerevisiae FL100 MES1 Methionyl-tRNA synthetase cyt 751 V01316 P00958 6341994
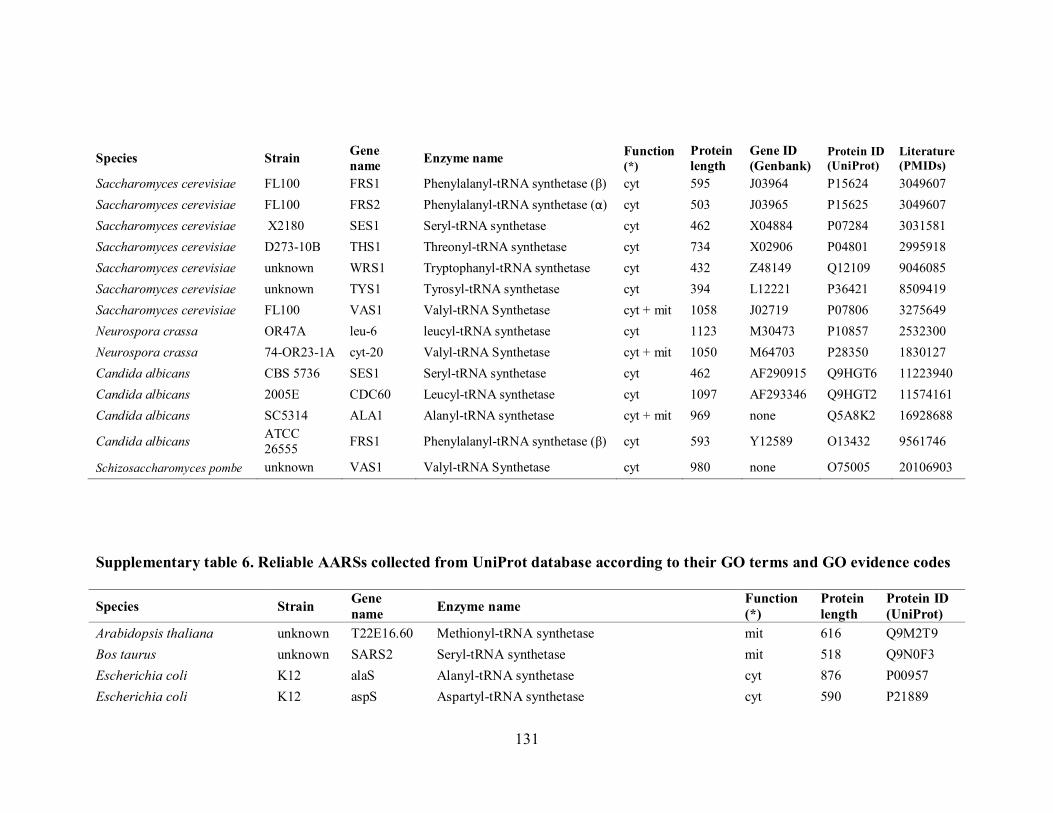
131
Species Strain Gene
name Enzyme name
Function(*)
Protein
length
Gene ID
(Genbank) Protein ID
(UniProt)
Literature
(PMIDs)
Saccharomyces cerevisiae FL100 FRS1 Phenylalanyl-tRNA synthetase (β) cyt 595 J03964 P15624 3049607
Saccharomyces cerevisiae FL100 FRS2 Phenylalanyl-tRNA synthetase (α) cyt 503 J03965 P15625 3049607
Saccharomyces cerevisiae X2180 SES1 Seryl-tRNA synthetase cyt 462 X04884 P07284 3031581
Saccharomyces cerevisiae D273-10B THS1 Threonyl-tRNA synthetase cyt 734 X02906 P04801 2995918
Saccharomyces cerevisiae unknown WRS1 Tryptophanyl-tRNA synthetase cyt 432 Z48149 Q12109 9046085
Saccharomyces cerevisiae unknown TYS1 Tyrosyl-tRNA synthetase cyt 394 L12221 P36421 8509419
Saccharomyces cerevisiae FL100 VAS1 Valyl-tRNA Synthetase cyt + mit 1058 J02719 P07806 3275649
Neurospora crassa OR47A leu-6 leucyl-tRNA synthetase cyt 1123 M30473 P10857 2532300
Neurospora crassa 74-OR23-1A cyt-20 Valyl-tRNA Synthetase cyt + mit 1050 M64703 P28350 1830127
Candida albicans CBS 5736 SES1 Seryl-tRNA synthetase cyt 462 AF290915 Q9HGT6 11223940
Candida albicans 2005E CDC60 Leucyl-tRNA synthetase cyt 1097 AF293346 Q9HGT2 11574161
Candida albicans SC5314 ALA1 Alanyl-tRNA synthetase cyt + mit 969 none Q5A8K2 16928688
Candida albicans ATCC
26555 FRS1 Phenylalanyl-tRNA synthetase (β) cyt 593 Y12589 O13432 9561746
Schizosaccharomyces pombe unknown VAS1 Valyl-tRNA Synthetase cyt 980 none O75005 20106903
Supplementary table 6. Reliable AARSs collected from UniProt database according to their GO terms and GO evidence codes
Species Strain Gene
name Enzyme name
Function
(*)
Protein
length
Protein ID
(UniProt)
Arabidopsis thaliana unknown T22E16.60 Methionyl-tRNA synthetase mit 616 Q9M2T9
Bos taurus unknown SARS2 Seryl-tRNA synthetase mit 518 Q9N0F3
Escherichia coli K12 alaS Alanyl-tRNA synthetase cyt 876 P00957
Escherichia coli K12 aspS Aspartyl-tRNA synthetase cyt 590 P21889

132
Species Strain Gene
name Enzyme name
Function
(*)
Protein
length
Protein ID
(UniProt)
Escherichia coli K12 cysS Cysteinyl-tRNA synthetase cyt 461 P21888
Escherichia coli K12 lysU Lysyl-tRNA synthetase cyt 505 P0A8N5
Escherichia coli K12 lysS Lysyl-tRNA synthetase cyt 505 P0A8N3
Escherichia coli K12 proS Prolyl-tRNA synthetase cyt 572 P16659
Escherichia coli K12 serS Seryl-tRNA synthetase cyt 430 P0A8L1
Escherichia coli K12 thrS Threonyl-tRNA synthetase cyt 642 P0A8M3
Homo sapiens unknown AARS Alanyl-tRNA synthetase cyt 968 P49588
Homo sapiens unknown RARS Arginyl-tRNA synthetase cyt 660 P54136
Homo sapiens unknown NARS Asparaginyl-tRNA synthetase cyt 548 O43776
Homo sapiens unknown DARS Aspartyl-tRNA synthetase cyt 501 P14868
Homo sapiens unknown DARS2 Aspartyl-tRNA synthetase mit 645 Q6PI48
Homo sapiens unknown EPRS Bifunctional aminoacyl-tRNA synthetase
(ProRS (class II) and GluRS (class II)) cyt 1512 P07814
Homo sapiens unknown CARS Cysteinyl-tRNA synthetase cyt 748 P49589
Homo sapiens unknown QARS Glutaminyl-tRNA synthetase cyt 775 P47897
Homo sapiens unknown GARS Glycyl-tRNA Synthase cyt + mit 739 P41250
Homo sapiens unknown IARS Isoleucine-tRNA Synthetase cyt 1262 P41252
Homo sapiens unknown LARS Leucyl-tRNA synthetase cyt 1176 Q9P2J5
Homo sapiens unknown KARS Lysyl-tRNA synthetase cyt + mit 597 Q15046
Homo sapiens unknown MARS Methionyl-tRNA synthetase cyt 900 P56192
Homo sapiens unknown MARS2 Methionyl-tRNA synthetase mit 593 Q96GW9
Homo sapiens unknown FARS2 Phenylalanyl-tRNA synthetase mit 451 O95363
Homo sapiens unknown FARSA Phenylalanyl-tRNA synthetase (alpha subunit) cyt 508 Q9Y285
Homo sapiens unknown FARSB Phenylalanyl-tRNA synthetase (beta subunit) cyt 589 Q9NSD9
Homo sapiens unknown SARS Seryl-tRNA synthetase cyt 514 P49591
Homo sapiens unknown SARS2 Seryl-tRNA synthetase mit 518 Q9NP81

133
Species Strain Gene
name Enzyme name
Function
(*)
Protein
length
Protein ID
(UniProt)
Homo sapiens unknown TARS Threonyl-tRNA synthetase cyt 723 P26639
Homo sapiens unknown TARS2 Threonyl-tRNA synthetase mit 718 Q9BW92
Homo sapiens unknown WARS Tryptophanyl-tRNA synthetase cyt 471 P23381
Homo sapiens unknown YARS Tyrosyl-tRNA synthetase cyt 528 P54577
Homo sapiens unknown YARS2 Tyrosyl-tRNA synthetase mit 477 Q9Y2Z4
Homo sapiens unknown VARS Valyl-tRNA Synthetase cyt 1264 P26640
Mycobacterium tuberculosis unknown metG Methionyl-tRNA synthetase cyt 519 O05593
Rattus norvegicus unknown Aars Alanyl-tRNA synthetase cyt 968 P50475
Saccharomyces cerevisiae S288c MSR1 Arginyl-tRNA synthetase mit 643 P38714
Saccharomyces cerevisiae S288c SLM5 Asparaginyl-tRNA synthetase mit 492 P25345
Saccharomyces cerevisiae S288c MSD1 Aspartyl-tRNA synthetase mit 658 P15179
Saccharomyces cerevisiae S288c MSE1 Glutamyl-tRNA synthetase mit 536 P48525
Saccharomyces cerevisiae S288c ISM1 Isoleucine-tRNA synthetase mit 1002 P48526
Saccharomyces cerevisiae S288c NAM2 Leucyl-tRNA synthetase mit 894 P11325
Saccharomyces cerevisiae S288c MSK1 Lysyl-tRNA synthetase mit 576 P32048
Saccharomyces cerevisiae S288c MSM1 Methionyl-tRNA synthetase mit 575 P22438
Saccharomyces cerevisiae S288c MSF1 Phenylalanyl-tRNA synthetase mit 469 P08425
Saccharomyces cerevisiae S288c DIA4 Seryl-tRNA synthetase mit 446 P38705
Saccharomyces cerevisiae S288c MST1 Threonyl-tRNA synthetase mit 462 P07236
Saccharomyces cerevisiae S288c MSW1 Tryptophanyl-tRNA synthetase mit 379 P04803
Saccharomyces cerevisiae S288c MSY1 Tyrosyl-tRNA synthetase mit 492 P48527
Schizosaccharomyces pombe 972h- vas1 Valyl-tRNA Synthetase mit 950 O14160
Thermus thermophilus HB8 asnS Asparaginyl-tRNA synthetase cyt 438 P54263
(*) Each AARS gene encodes either a cytoplasmic (cyt) or a mitochondrial (mit) enzyme, or both of them (cyt + mit)

134
Supplementary table 7. Number of tRNA genes in each anticodon specific family and
codon frequencies calculated from the highly expressed genes and the genes having N c
less than 31 in M. thermophila
AA Anti-
codon
Decoded
codons (*)
tRNA
gene
number
Codon frequency calculated
from highly expressed genes
(%)
Codon frequency calculated
from genes having Nc < 31
(%)
Ala
AGC GCT,GCA,GCC 7 GCT (20.29) GCC (56.45) GCT (6.12) GCC (71.98)
CGC GCG 3 GCG (16.97) GCG (19.37)
TGC GCA,GCG 2 GCA (6.29) GCA (2.54)
Arg
ACG CGT,CGA,CGC 7 CGT (17.93) CGC (43.66) CGT (4.37) CGC (63.05) CCG CGG 2 CGG (15.28) CGG (20.88)
CCT AGG 2 AGG (11.68) AGG (8.79)
TCG CGA,CGG 1 CGA (5.28) CGA (1.71)
TCT AGA,AGG 2 AGA (6.16) AGA (1.2)
Asn GTT AAC,AAT 6 AAC (84.28) AAT (15.72) AAC (94.76) AAT (5.24)
Asp GTC GAC,GAT 10 GAC (72.5) GAT (27.5) GAC (90.81) GAT (9.19)
Cys GCA TGC,TGT 3 TGC (81.55) TGT (18.45) TGC (96.37) TGT (3.63)
Gln CTG CAG 5 CAG (79.48) CAG (92.77)
TTG CAA,CAG 2 CAA (20.52) CAA (7.23)
Glu CTC GAG 8 GAG (84.86) GAG (93.32)
TTC GAA,GAG 2 GAA (15.14) GAA (6.68)
Gly
CCC GGG 2 GGG (7.77) GGG (10.75)
GCC GGC,GGT 11 GGC (59.02) GGT (25.51) GGC (78.58) GGT (7.32)
TCC GGA,GGG 3 GGA (7.7) GGA (3.35)
His GTG CAC,CAT 4 CAC (76.52) CAT (23.48) CAC (94.02) CAT (5.98)
Ile
AAT ATT,ATA,ATC 8 ATT (24.55) ATT (7.99)
GAT ATC,ATT 1 ATC (72.26) ATC (90.68)
TAT ATA 1 ATA (3.18) ATA (1.33)
Leu
AAG CTT,CTA,CTC 7 CTT (12.98) CTC (43.9) CTT (2.99) CTC (51) CAA TTG 2 TTG (8.77) TTG (2.87)
CAG CTG 4 CTG (29.81) CTG (41.99)
TAA TTA,TTG 1 TTA (1.72) TTA (0.27)
TAG CTA,CTG 1 CTA (2.82) CTA (0.88)
Lys CTT AAG 9 AAG (90.36) AAG (96.7)
TTT AAA,AAG 3 AAA (9.64) AAA (3.3)
Phe GAA TTC,TTT 5 TTC (78.59) TTT (21.41) TTC (89.04) TTT (10.96)
Pro
AGG CCT,CCA,CCC 5 CCT (18.6) CCC (44.11) CCT (5.18) CCC (52.96) CGG CCG 3 CCG (27.48) CCG (39.32)
TGG CCA,CCG 3 CCA (9.81) CCA (2.54)
Ser
AGA TCT,TCA,TCC 5 TCT (12.39) TCC (25.31) TCT (3.96) TCC (28.55)
CGA TCG 3 TCG (26.93) TCG (32.33)
GCT AGC,AGT 6 AGC (25.56) AGT (4.15) AGC (32.52) AGT (1.26)
TGA TCA,TCG 3 TCA (5.66) TCA (1.38)
Thr
AGT ACT,ACA,ACC 6 ACT (15.18) ACC (55.18) ACT (4.54) ACC (63.4) CGT ACG 3 ACG (20.59) ACG (29.64)
TGT ACA,ACG 2 ACA (9.05) ACA (2.42)
Tyr GTA TAC,TAT 6 TAC (80.25) TAT (19.75) TAC (93.56) TAT (6.44)
Val
AAC GTT,GTA,GTC 7 GTT (19.08) GTC (58.14) GTT (4.62) GTC (69.21) CAC GTG 3 GTG (19.18) GTG (25.1)
TAC GTA,GTG 2 GTA (3.6) GTA (1.07)
((*) Decoded codons: possible codons that can match with the corresponding anticodons in the table, according to the Wobble theory. The bold codons are the ones having the highest frequencies among the synonymous ones.)
![[Training records]erp.hansae.com/sharefile/Compliance/2018_11_02_VN_방문... · 2018-10-19 · Tràn Thi NgQC Ngà Tràn Thi MY I-Iucng vy Lâm Thi Minh Thu NguyCn Hüu Nghi Lê](https://static.fdocuments.us/doc/165x107/5f10d8f37e708231d44b1a9e/training-recordserp-e-2018-10-19-trn-thi-ngqc-ng-trn-thi-my.jpg)


![[Nguyen Thi Minh Anh] Curriculum Vitae](https://static.fdocuments.us/doc/165x107/587b653b1a28ab38258b6571/nguyen-thi-minh-anh-curriculum-vitae.jpg)