New Product Performance: What Distinguishes the Star … · New Product Performance: What...
30
– 17 – New Product Performance: What Distinguishes the Star Products by Robert G. Cooper † Elko J. Kleinschmidt † Abstract: Better new product performance is important for the survival of the firm. Based on a three-dimensional performance space, 110 new products launched from 55 Australian firms are grouped into five performance clusters. Performance groups from ‘Stars’—the winning group to—‘Dogs’—the worst performance group. The five groups could be well explained by the impact constructs. ‘Stars’ did what one expects for winning projects (product advantage, homework, cross-functional team, reasonable risk level, etc.), ‘Dogs’ were identified as doing nearly everything wrong. The Australian results were tested against international findings and concurred fully. Managerial implications are detailed. Keywords: NEW PRODUCT DEVELOPMENT (NPD); NPD SUCCES DIMENSIONS; NPD SUCCCESS FACTORS; NPD OUTCOME CLUSTERS; INTERNATIONAL COMPARISON OF NPD FACTORS. † Michael G. DeGroote School of Business, McMaster University, 1280 Main Street West, Hamilton, Canada, L8S 4M4. Email: [email protected] The authors wish to thank Griffith University Gold Coast, Queensland Manufacturing Institute, Brisbane, and MINT McMaster University, Canada for their support (financial and otherwise) for this research. Australian Journal of Management, Vol. 25, No. 1, June 2000, © The Australian Graduate School of Management
Transcript of New Product Performance: What Distinguishes the Star … · New Product Performance: What...
– 17 –
New Product Performance:What Distinguishes the Star Products
byRobert G. Cooper †Elko J. Kleinschmidt †
Abstract:Better new product performance is important for the survival of the firm. Based ona three-dimensional performance space, 110 new products launched from 55Australian firms are grouped into five performance clusters. Performance groupsfrom ‘Stars’—the winning group to—‘Dogs’—the worst performance group. Thefive groups could be well explained by the impact constructs. ‘Stars’ did what oneexpects for winning projects (product advantage, homework, cross-functional team,reasonable risk level, etc.), ‘Dogs’ were identified as doing nearly everythingwrong. The Australian results were tested against international findings andconcurred fully. Managerial implications are detailed.
Keywords:NEW PRODUCT DEVELOPMENT (NPD); NPD SUCCES DIMENSIONS; NPDSUCCCESS FACTORS; NPD OUTCOME CLUSTERS; INTERNATIONALCOMPARISON OF NPD FACTORS.
† Michael G. DeGroote School of Business, McMaster University, 1280 Main StreetWest, Hamilton, Canada, L8S 4M4. Email: [email protected]
The authors wish to thank Griffith University Gold Coast, Queensland Manufacturing Institute,Brisbane, and MINT McMaster University, Canada for their support (financial and otherwise) forthis research.
Australian Journal of Management, Vol. 25, No. 1, June 2000, © The Australian Graduate School of Management
AUSTRALIAN JOURNAL OF MANAGEMENT June 2000
– 18 –
1. Introductionew products are vital to the success and prosperity of the modern company.Facing new technologies, increasing and global competition, and dynamic
market needs, Australian companies must either succeed at product innovation orrisk failing as businesses. Thus an understanding of what makes new productssuccessful—what practices and characteristics distinguish the winners—is essentialin order to provide the management insights needed in the decades ahead.
What are the critical driving factors that underlie successful productdevelopments in Australia? The last two decades have witnessed numerous studiesinto new product successes and failures throughout the world in an attempt touncover what makes a winner. Indeed, many characteristics and practices have beenfound that discriminate between successful and unsuccessful new products. Butmuch of this research has tended to view new product performance on a uni-dimensional continuum, usually financial performance (e.g. profitability). Whileshort-term profitability is one goal, there are other ways of looking at a newproduct’s performance—for example, time-to-market, or the product’s overallimpact on the company (e.g. platform for growth).
The goal of the current study is to uncover what distinguishes successful newproducts from failures in industrial product firms, and by so doing providemanagement insights into more proficient product development. To achieve thisgoal, we look at a large number of Australia new product projects, and identifywhich projects were most successful. But a number of measures of new productperformance are employed, rather than just the single measure continuum.1 Bycomparing the best projects to the rest, the distinguishing characteristics and bestpractices are identified. We then investigate in detail each project type and probewhat drives their performances, and what makes for new product success, whensuccess is measured in different ways.
1.1 BackgroundIdentifying new product success factors has become an important researchdirection, as investigators probe commercial new product projects in order todiscover what discriminates between winners and losers. For excellent reviews, seeMontoya-Weiss and Calantone (1994) and Cooper (1996).
One concern with the majority of these success/failure investigations is thatthey tend to treat new product performance as a single dimension—usually,financial performance. This is simplistic, however; indeed the measurement of newproduct performance has a multi-dimensional flavour (Montoya-Weiss & Calantone1994; Cooper 1996). New products can be successful in a variety of ways: they canhave a major impact on the firm; they can be seen as great ‘technical’ successes;they can have a significant impact in the market by achieving a high market share;and even speed-to-market and the ability to reduce cycle time is being used as aproxy for success in some fast-paced companies. While many of these successmeasures are no doubt interrelated, there are some important differences; forexample, it may be possible to have a fast-to-market product which is not too 1. This method or approach was first reported in Cooper and Kleinschmidt (1995), and updated in Cooper
and Kleinschmidt (1999). Parts of this section are thus taken from Cooper and Kleinschmidt (1995,1999).
N
Vol. 25, No. 1 Cooper & Kleinschmidt: NEW PRODUCT PERFORMANCE
– 19 –
profitable; or a product with a high return on investment that has a rather modestimpact on the firm overall; and so on.
It is important to consider different types of new product success, and indeedmove towards a typology of performance scenarios. First, new product success canbe measured in a multitude of ways. Many previous studies, however, have taken arather singular approach to the measurement of success. Further, these differentmeasures of success are not the same thing—they are somewhat independent ofeach other. Thus the success factors reported in the majority of studies are onlyvalid for that particular measure of success considered, for example, immediateprofitability. Therefore, if other types of ‘success’ or performance are desired—forexample, impact on the firm, or time-to-market—then these may have quitedifferent drivers.
The current investigation addresses this issue by looking at new productsuccess in different ways and by identifying five unique types or groups of projectsin terms of their performance. First, we consider a variety of performance measures,including profitability, time efficiency and time-to-market, impact on the company,opening up new opportunities, market share and even technical success. Wedevelop a multi-dimensional Performance Map, where new product projects aremapped according to their performances on these different measures. We thencluster projects into groups on this map and identify five different types of projects,each characterised by its own type of performance, for example, ‘Stars’ versus‘Dogs’ versus ‘Steady Winners’. Each project type is investigated in detail to seewhat differentiates it from the others; in so doing, different determinants of successare uncovered, depending on what type of successful project one considers.
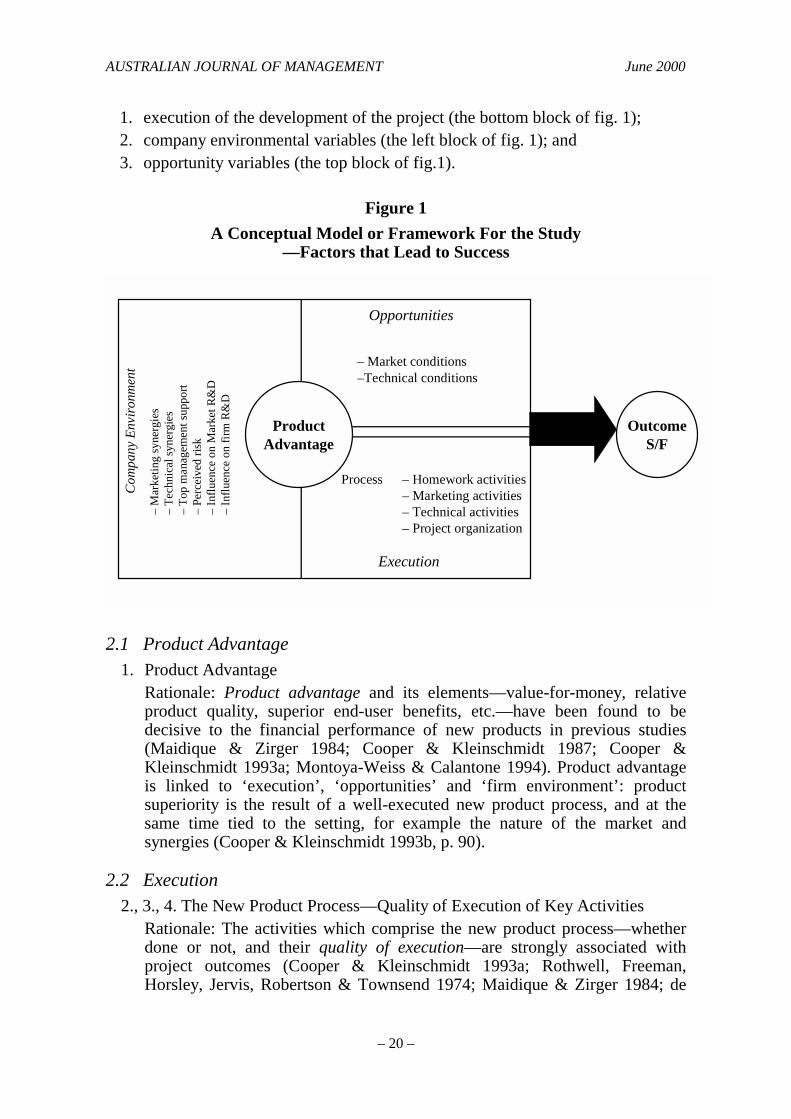
2. A Conceptual FrameworkThe conceptual model used in the current study is based on one originallydeveloped in the 1970s (Cooper 1979a, p. 124; Cooper 1979b, p. 93), and whichhas been tested and refined over the years by numerous researchers (de Brentani1991; Sanchez & Elola 1991; Cooper & Kleinschmidt 1993a,b; Song & Parry1994). (For a comprehensive literature review of many of the new productsuccess/failure studies that have employed this model and research methodology,see Montoya-Weiss & Calantone 1994). The model, outlined in figure 1, postulatesthat new product success is in part determined by the nature of the commercialentity (e.g. whether the product has competitive advantage), which in turn isdetermined by the new product or innovation process (activities that occur duringthe project). The nature of the project (e.g. perceived risk) influences the process.Finally, this project and process take place within an internal and externalenvironment, namely a company and the marketplace. Characteristics of bothenvironments influence the innovation process and ultimate outcome of the project(e.g. the existence of certain company resources and competencies within that canbe leveraged to advantage in the project; and various factors that capture theattractiveness of the marketplace).
Thirteen blocks of variables, identified from this model, are proposed asdrivers of new product performance (fig. 1), and are categorized into three broadgroups plus product advantage:
AUSTRALIAN JOURNAL OF MANAGEMENT June 2000
– 20 –
1. execution of the development of the project (the bottom block of fig. 1);2. company environmental variables (the left block of fig. 1); and3. opportunity variables (the top block of fig.1).
Figure 1A Conceptual Model or Framework For the Study
—Factors that Lead to Success
Com
pany
Env
ironm
ent
– M
arke
ting
syne
rgie
s–
Tech
nica
l syn
ergi
es–
Top
man
agem
ent s
uppo
rt–
Perc
eive
d ris
k–
Influ
ence
on
Mar
ket R
&D
– In
fluen
ce o
n fir
m R
&D
ProductAdvantage
Opportunities
– Market conditions–Technical conditions
Process – Homework activities – Marketing activities – Technical activities – Project organization
Execution
OutcomeS/F
2.1 Product Advantage1. Product Advantage
Rationale: Product advantage and its elements—value-for-money, relativeproduct quality, superior end-user benefits, etc.—have been found to bedecisive to the financial performance of new products in previous studies(Maidique & Zirger 1984; Cooper & Kleinschmidt 1987; Cooper &Kleinschmidt 1993a; Montoya-Weiss & Calantone 1994). Product advantageis linked to ‘execution’, ‘opportunities’ and ‘firm environment’: productsuperiority is the result of a well-executed new product process, and at thesame time tied to the setting, for example the nature of the market andsynergies (Cooper & Kleinschmidt 1993b, p. 90).
2.2 Execution2., 3., 4. The New Product Process—Quality of Execution of Key Activities
Rationale: The activities which comprise the new product process—whetherdone or not, and their quality of execution—are strongly associated withproject outcomes (Cooper & Kleinschmidt 1993a; Rothwell, Freeman,Horsley, Jervis, Robertson & Townsend 1974; Maidique & Zirger 1984; de
Vol. 25, No. 1 Cooper & Kleinschmidt: NEW PRODUCT PERFORMANCE
– 21 –
Brentani 1991; Montoya-Weiss & Calantone 1994). Three constructs aredefined here, namely quality of execution of:
a. homework, up-front or pre-development activities—those activitieswhich precede the development phase of the project, such as initialscreening, preliminary market and technical assessments, marketstudies, and business analysis;
b. marketing tasks—such as market analysis and studies, customer tests,test marketing, and the launch; and
c. technical tasks—such as technical assessment, product development, in-house testing, pilot/trial production, and production start-up.
5. Project OrganisationRationale: How those who, undertake the project are organised—the team,team leadership, accountability, etc.—has an impact on new product success(Maidique & Zirger 1984; Johne & Snelson 1988; Larson & Gobeli 1988;Dwyer 1990).
2.3 Company Environmental Variables6., 7. Marketing Synergies, Technical Synergy
Rationale: Building on one’s in-house technical and marketing strengths,skills and resources (rather than seeking new opportunities far from one’sskill and resource base) is one of the keys to success (Peters & Waterman1982; Maidique & Zirger 1984; Abernathy & Clark 1986; de Brentaini 1991;Montoya-Weiss & Canantone 1994; Song & Parry 1994). The notion here isto leverage one’s core competencies and to attack from a position of strength.
8. Top Management SupportRationale: Whether or not top management supports the project certainly hasan impact on the project’s progress (Montoya-Weiss & Calantone 1994).Some earlier studies (Rothwell 1972; Rothwell et al. 1974, p. 258) and others(Maidique & Zirger 1984) showed that success was higher when there was ahigh level of top management support for the project (Utterback, Allen,Holloman & Sirbu 1976). However, some more recent studies have onlyfound ‘soft’ support for the impact on success rates, with some findingsindicating that top management support failures almost as frequently,according to one study (Cooper & Kleinschmidt 1993b, p. 90). Because of itsconceptual importance and some support, this construct is included in thisstudy.
9. Perceived RiskRationale: This is a new construct. The argument can be made that projectsthat have high perceived risk when the projects begin should have a lowerlevel of success rates (Song & Parry 1994; Kleinschmidt & Cooper 1997, p.28; Rosenthal & Tatikonda 1993, p. 13). This construct includes measures ofperceived risk, magnitude of customer problem and whether the requiredproduct features were easy to identify at the beginning of the project.
AUSTRALIAN JOURNAL OF MANAGEMENT June 2000
– 22 –
10.The Firm’s Power over the Technology DevelopmentRationale: This new construct is based on the premise that projects that relyon technology that is greatly influenced and controlled by the firm should leadto successes. The firm sets the standards and the factors that make a great‘product advantage’, and by having control over main customersdevelopment, may be able to leverage their new products better (Kleinschmidt& Cooper 1997, p. 28).
11.Customer InfluenceRationale: By working closely with their main customers (i.e. being greatlycontrolled in their developments), the new product should fit customerrequirements better and thus result in a better, more successful product (newconstruct).
2.4 Opportunities12.Market Conditions
Rationale: Previous research has identified market size, growth and need levelas success ingredients (Porter 1985; Cooper & Kleinschmidt 1987, p. 215;Song & Parry 1994). For this study, ‘market conditions’ measures, althoughrelated to previous definitions, look at market conditions represented by howstable, predictable and simple the market for the project was (Montoya-Weiss& Calantone 1994, p. 397).
13.Technological ConditionsRationale: The argument follows the rationale for market conditions—thelevel of technology stability, predictability and complexity of the project willinfluence the successful outcome (Fisher, Blackmon & Woodward 1992;Song & Parry 1994; Kleinschmidt & Cooper 1997, p. 28).
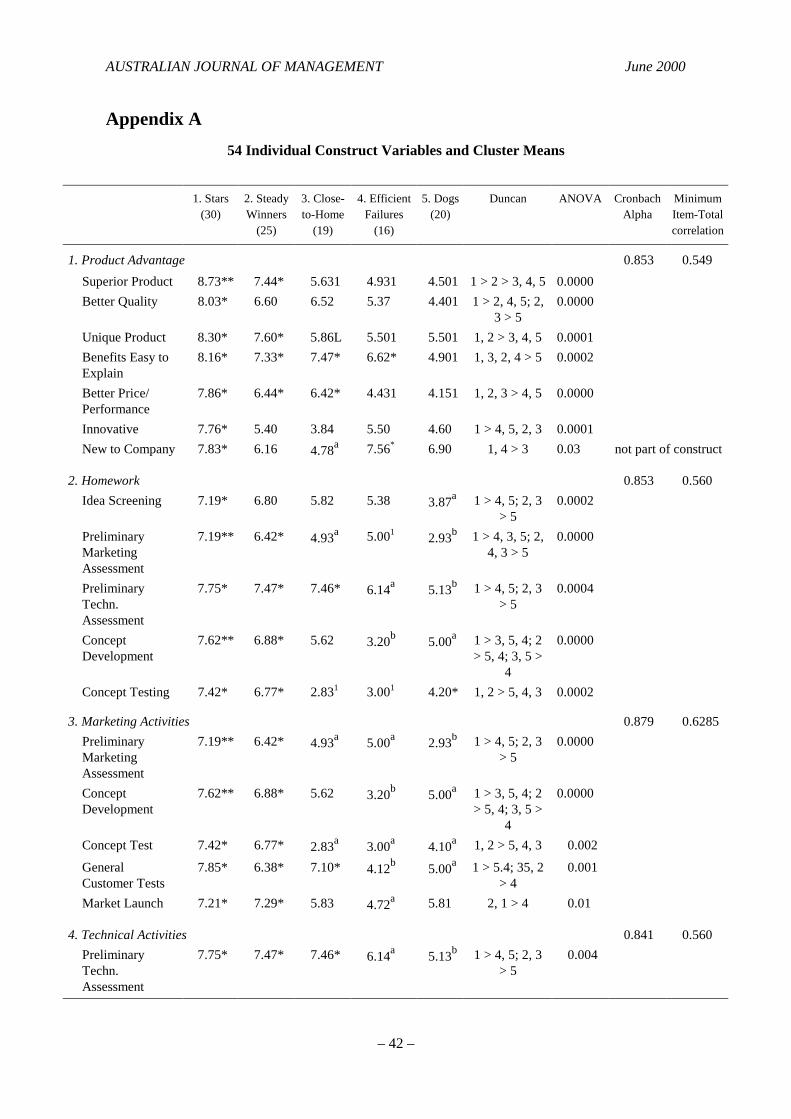
From these 13 blocks of variables, constructs or major themes, 54 variables ormeasures were identified (see app. A). Note: the ‘competitive situation’ has notbeen included because in other major studies this factor has not been found to besignificantly correlated to outcome at all (Cooper & Kleinschmidt 1993b, p. 90;Montoya-Weiss & Calantone 1994, p. 397).
3. How the Research was DoneA total of 110 new industrial product projects—68 commercial successes and 42failures from 55 firms—provided the data for the study. The research method usedis based on the NewProd studies, developed by Cooper (1979a) and refined over theyears by numerous researchers—see Larson and Gobeli (1988). First, a list ofAustralian companies was developed, firms known to be active in productdevelopment. Next, these firms were contacted to seek their participation in thisnew-product investigation. In each firm, typical new product projects were selectedfor in-depth discussion and review: a commercial success and a failure, but whichhad been on the market long enough for company management to know whether the
Vol. 25, No. 1 Cooper & Kleinschmidt: NEW PRODUCT PERFORMANCE
– 23 –
product was a commercial success or failure (usually 2 years or more). Success andfailure were defined from a financial standpoint: whether or not the productachieved profits above or below the minimal acceptable return for that company.Personal interviews were conducted in each firm with the manager(s) mostknowledgeable about this project.
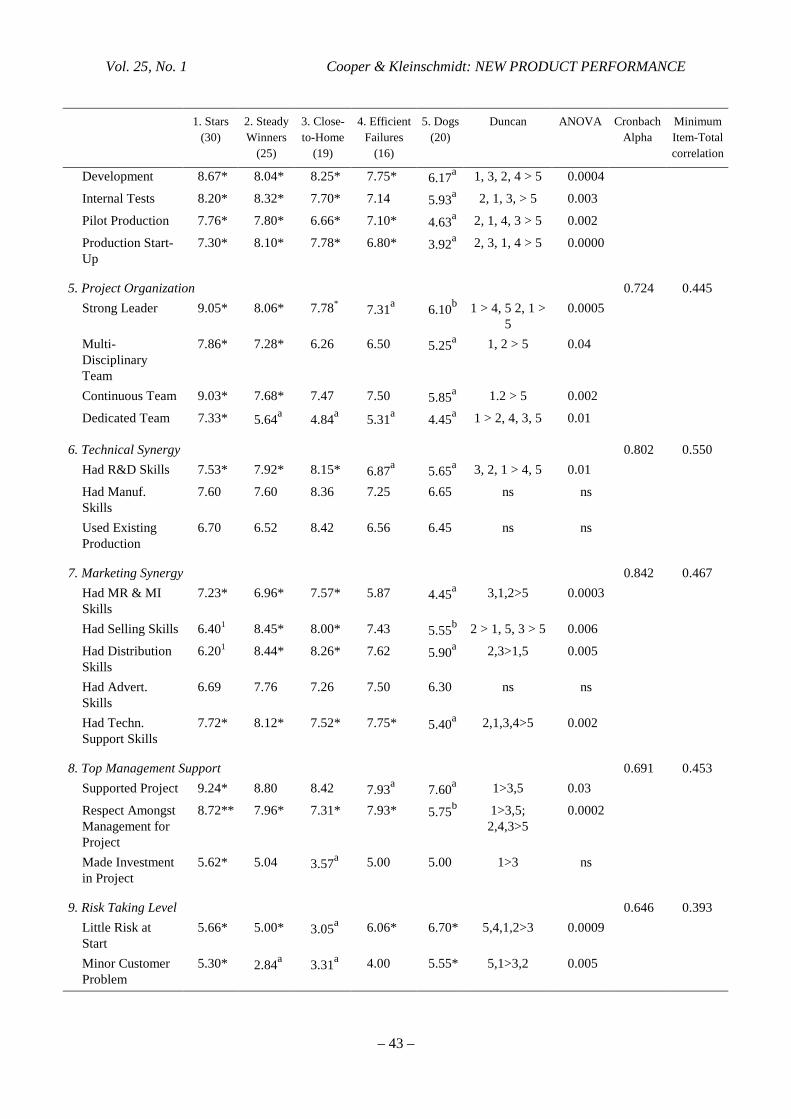
The interviews were based on a detailed, pre-tested questionnaire. Theconceptual model or framework in figure 1 provided the main areas of focus (orblocks of variables) for the questionnaire. Within each block, 54 specificcharacteristics were developed—see appendix A. These characteristics were gaugedon 0–10 Likert-type scales with anchor phrases. From these, the 13 major themes orconstructs were developed (simple averages across the characteristics within eachblock or theme). These constructs proved to be very robust: internal consistencieswere high (Cronbach alphas), and minimum item total correlations exceeded 0.4 for11 of the 13 constructs—see appendix A.
Ten performance measures were also captured, again on 0–10 scales exceptfor the success rate. Finally, some additional information regarding project risk,management expectations, and use of outside sources of information was alsoobtained. Firms which participated were from a wide variety of industries: thebreakdown of firms and projects by industry is given in table 1.
Table 1Industry Profile of Projects in the Australian Sample
Industry No. of Firms Percent of Firms
Electronics 20 18.3Machinery 10 9.0(Tele) Communications 2 1.8Electrical 9 8.1Heavy Machinery 3 2.7Precision Mechanical Part 9 8.1Automotive 6 5.4Mechanical Parts/Products 40 36.9Food Industry 2 1.8Chemicals 9 8.1
Total 110 100.0%
4. The DataData were collected on 110 actual new product projects: 67 commercial successesand 43 failures in 55 Australian industrial product companies (moderate to highertechnology industries). These projects were gauged on each of the 54characteristics, as defined above and on the 13 constructs or themes.
There were also ten performance gauges measured (Cooper & Kleinschmidt1987; Griffin & Page 1993, p. 241; Cooper & Kleinschmidt 1995, p. 439), namely:
AUSTRALIAN JOURNAL OF MANAGEMENT June 2000
– 24 –
1. Success rate: whether the product was considered (by their companies) to be afinancial and commercial success or not—a ‘Yes/No’ answer. These Yes/Noscores, when considered across a group of projects, yield the success rate.
2. Return rating: degree to which the new product project met, exceeded or fellshort of the minimal acceptable return-on-investment for this type ofinvestment (a 0–10 scale, where 10 = ‘far exceeded the minimum criterion’and 0 = ‘fell far short’).
3. Meeting sales objectives: degree to which the product exceeded (or fell shortof) the company’s sales objectives for it (a 0–10 scale, where 10 = ‘farexceeded objectives’ and 0 = ‘fell far short’).
4. Meeting profit objectives: the degree to which the new product exceeded thecompany’s profit objectives for it (same scale as point 3).
5. Time efficiency: how speedy and time efficiently this project was undertaken(0–10 scale, where 10 = ‘fast, very time efficient’ and 0 = ‘slow, inefficient,time wasted’).
6. On-schedule project: the degree to which the project stayed on-schedule (0–10 scale, where 10 = ‘stayed on schedule’ and 0 = ‘fell far behind schedule’).
7. On budget project: the degree to which the project remained within budgetedcosts (similar 0–10 scale to point 6).
8. Access to new markets: whether or not the project provided access to newmarkets for the company (a 0–10 scale, where 10 = ‘opened up new markets’and 0 = ‘did not’).
9. New product windows: whether or not the project paved the way for newproduct possibilities for the business (similar 0–10 scale to point 8).
10.Technical success rating: the degree to which the new product was consideredto be a technical success (0–10 scale, where 10 = ‘great technologicalsuccess’).
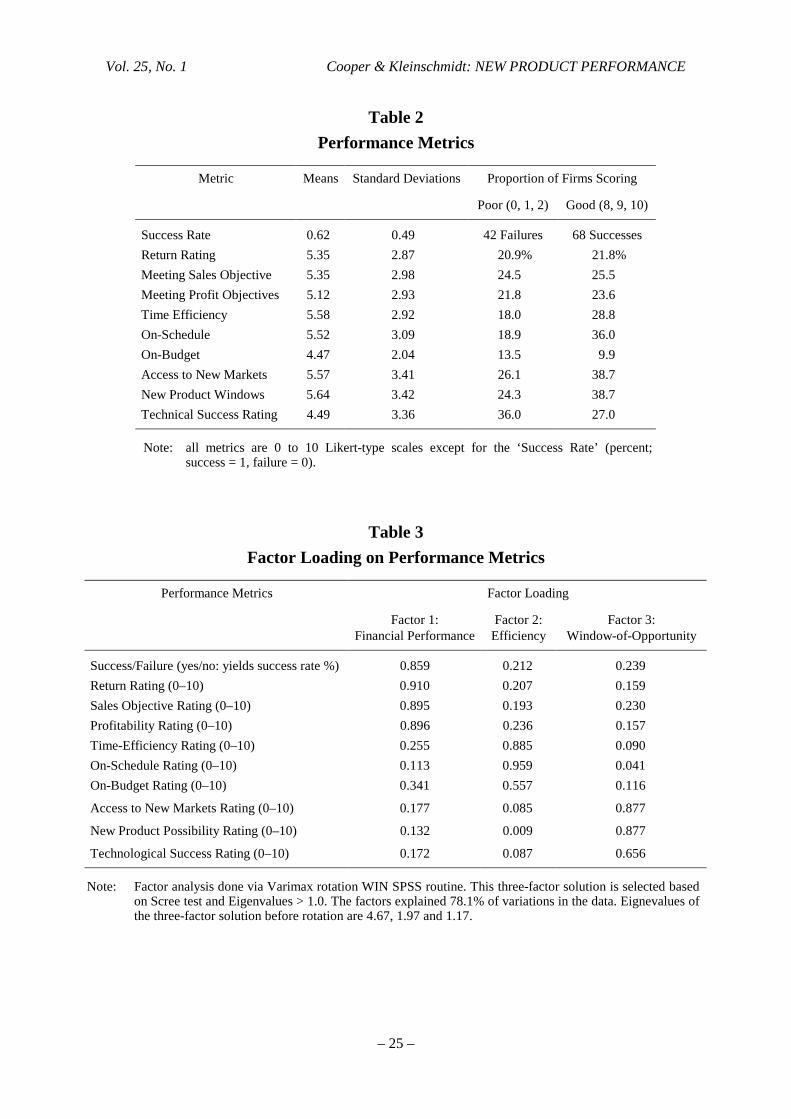
5. The Performance Map: The Five Performance TypesA Performance Map was constructed from the ten measures of performance.Table 2 reveals how the projects performed on each of the ten performance metrics.Note that all metrics are on 0–10 scales, except success rate (shown as apercentage). Projects score fairly well on average, with mid-range scores on these0–10 gauges. But there is a large distribution in performance, with a handful ofprojects doing exceptionally well and others doing quite poorly. The existence ofthese major differences in performance begs the question: what is it thatcharacterises the winners, and sets them apart from the losers?
In order to identify the exceptional projects, both good and bad, aPerformance Map was constructed. Here’s how. A review of the performancemeasures in table 2 reveals that these ten measures are likely interlinked. Therefore,factor analysis was undertaken to reduce these performance measures to theirunderlying dimensions. Three clear, easy-to-interpret performance factors emergedfrom the analysis (see loadings in table 3):
Vol. 25, No. 1 Cooper & Kleinschmidt: NEW PRODUCT PERFORMANCE
– 25 –
Table 2Performance Metrics
Metric Means Standard Deviations Proportion of Firms Scoring
Poor (0, 1, 2) Good (8, 9, 10)
Success Rate 0.62 0.49 42 Failures 68 SuccessesReturn Rating 5.35 2.87 20.9% 21.8%Meeting Sales Objective 5.35 2.98 24.5 25.5Meeting Profit Objectives 5.12 2.93 21.8 23.6Time Efficiency 5.58 2.92 18.0 28.8On-Schedule 5.52 3.09 18.9 36.0On-Budget 4.47 2.04 13.5 9.9Access to New Markets 5.57 3.41 26.1 38.7New Product Windows 5.64 3.42 24.3 38.7Technical Success Rating 4.49 3.36 36.0 27.0
Note: all metrics are 0 to 10 Likert-type scales except for the ‘Success Rate’ (percent;success = 1, failure = 0).
Table 3Factor Loading on Performance Metrics
Performance Metrics Factor Loading
Factor 1:Financial Performance
Factor 2:Efficiency
Factor 3:Window-of-Opportunity
Success/Failure (yes/no: yields success rate %) 0.859 0.212 0.239Return Rating (0–10) 0.910 0.207 0.159Sales Objective Rating (0–10) 0.895 0.193 0.230Profitability Rating (0–10) 0.896 0.236 0.157Time-Efficiency Rating (0–10) 0.255 0.885 0.090On-Schedule Rating (0–10) 0.113 0.959 0.041On-Budget Rating (0–10) 0.341 0.557 0.116
Access to New Markets Rating (0–10) 0.177 0.085 0.877
New Product Possibility Rating (0–10) 0.132 0.009 0.877
Technological Success Rating (0–10) 0.172 0.087 0.656
Note: Factor analysis done via Varimax rotation WIN SPSS routine. This three-factor solution is selected basedon Scree test and Eigenvalues > 1.0. The factors explained 78.1% of variations in the data. Eignevalues ofthe three-factor solution before rotation are 4.67, 1.97 and 1.17.
AUSTRALIAN JOURNAL OF MANAGEMENT June 2000
– 26 –
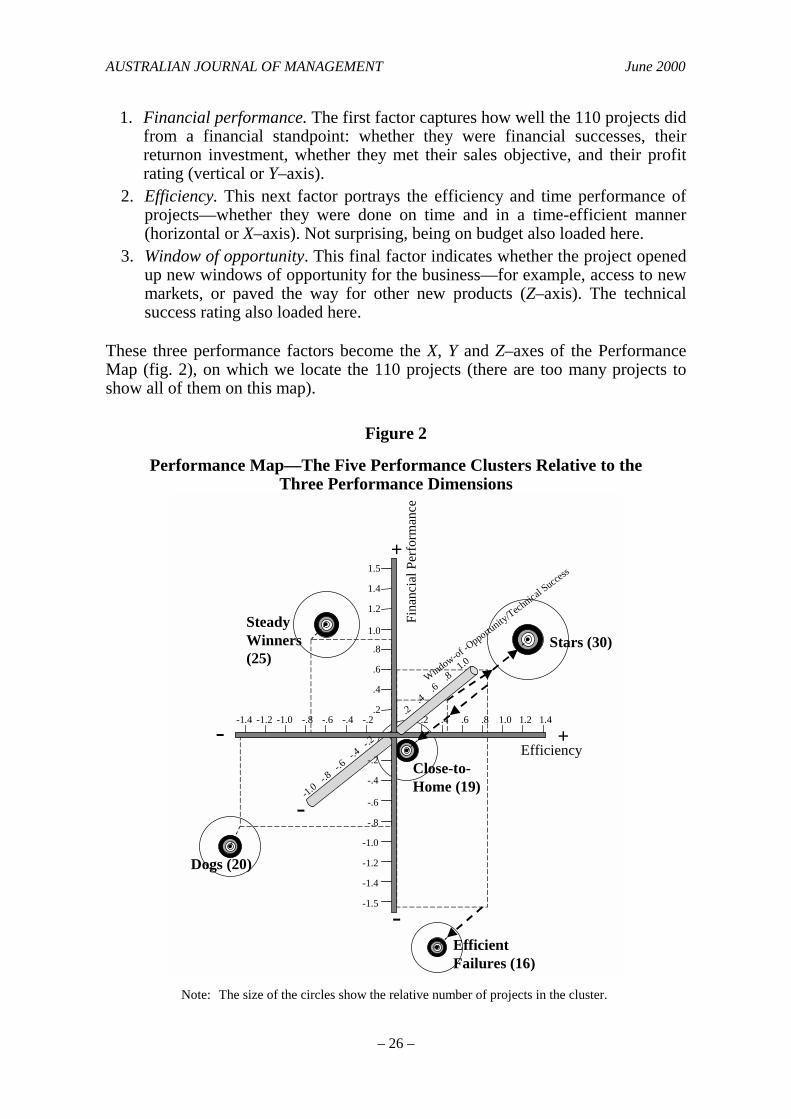
1. Financial performance. The first factor captures how well the 110 projects didfrom a financial standpoint: whether they were financial successes, theirreturnon investment, whether they met their sales objective, and their profitrating (vertical or Y–axis).
2. Efficiency. This next factor portrays the efficiency and time performance ofprojects—whether they were done on time and in a time-efficient manner(horizontal or X–axis). Not surprising, being on budget also loaded here.
3. Window of opportunity. This final factor indicates whether the project openedup new windows of opportunity for the business—for example, access to newmarkets, or paved the way for other new products (Z–axis). The technicalsuccess rating also loaded here.
These three performance factors become the X, Y and Z–axes of the PerformanceMap (fig. 2), on which we locate the 110 projects (there are too many projects toshow all of them on this map).
Figure 2
Performance Map—The Five Performance Clusters Relative to theThree Performance Dimensions
Note: The size of the circles show the relative number of proje
Stars (30)SteadyWinners(25)
Close-to-Home (19)
EfficientFailures (
Dogs (20)
-
+
-
Fina
ncia
l Per
form
ance
Window-of -Opportu
nity/Technica
l Success
-
-1.4 -1.2 -1.0 -.8 -.6 -.4 -.2 .2 .4 .6 .8 1.0 1.2 1.4.2
.4
.6
.8
1.0
1.2
1.4
1.5
-.2
-.4
-.6
-.8
-1.0
-1.2
-1.4
-1.5
.2 .4 .
6 .8 1
.0
-1.0 -.8 -
.6 -.4 -
.2
+Efficiencycts in the cluster.
16)
Vol. 25, No. 1 Cooper & Kleinschmidt: NEW PRODUCT PERFORMANCE
– 27 –
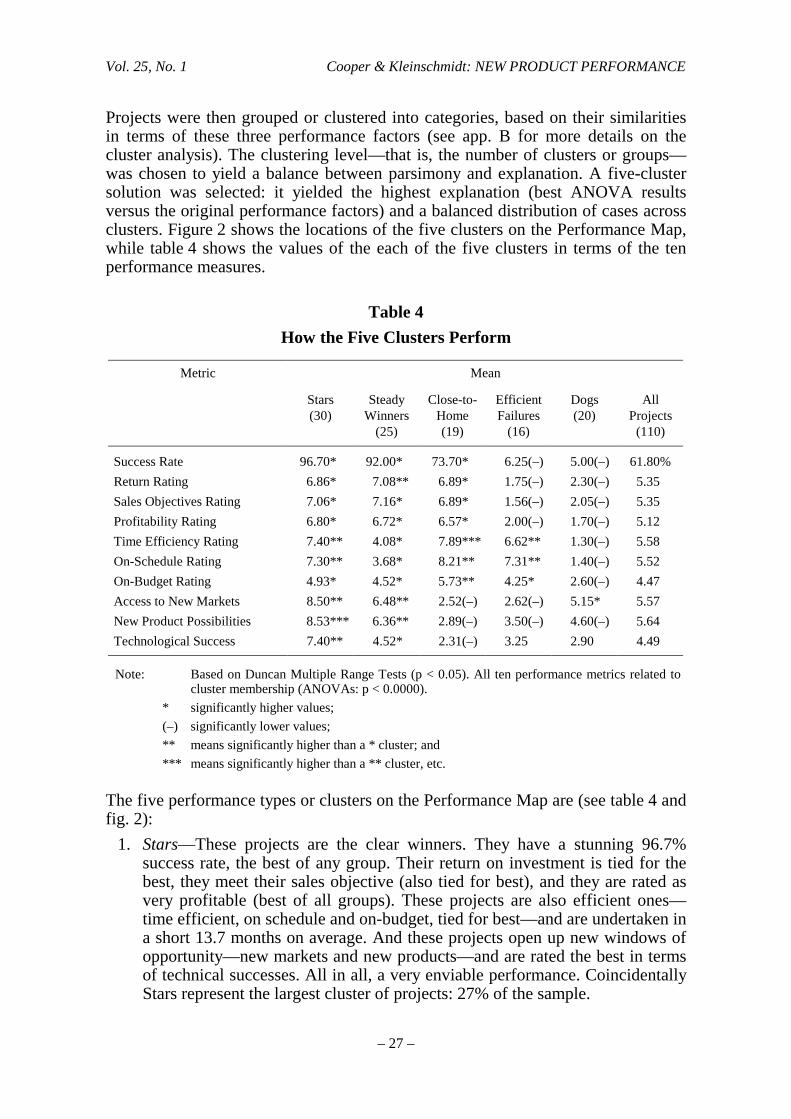
Projects were then grouped or clustered into categories, based on their similaritiesin terms of these three performance factors (see app. B for more details on thecluster analysis). The clustering level—that is, the number of clusters or groups—was chosen to yield a balance between parsimony and explanation. A five-clustersolution was selected: it yielded the highest explanation (best ANOVA resultsversus the original performance factors) and a balanced distribution of cases acrossclusters. Figure 2 shows the locations of the five clusters on the Performance Map,while table 4 shows the values of the each of the five clusters in terms of the tenperformance measures.
Table 4How the Five Clusters Perform
Metric Mean
Stars(30)
SteadyWinners
(25)
Close-to-Home(19)
EfficientFailures
(16)
Dogs(20)
AllProjects
(110)
Success Rate 96.70* 92.00* 73.70* 6.25(–) 5.00(–) 61.80%Return Rating 6.86* 7.08** 6.89* 1.75(–) 2.30(–) 5.35Sales Objectives Rating 7.06* 7.16* 6.89* 1.56(–) 2.05(–) 5.35Profitability Rating 6.80* 6.72* 6.57* 2.00(–) 1.70(–) 5.12Time Efficiency Rating 7.40** 4.08* 7.89*** 6.62** 1.30(–) 5.58On-Schedule Rating 7.30** 3.68* 8.21** 7.31** 1.40(–) 5.52On-Budget Rating 4.93* 4.52* 5.73** 4.25* 2.60(–) 4.47Access to New Markets 8.50** 6.48** 2.52(–) 2.62(–) 5.15* 5.57New Product Possibilities 8.53*** 6.36** 2.89(–) 3.50(–) 4.60(–) 5.64Technological Success 7.40** 4.52* 2.31(–) 3.25 2.90 4.49
Note: Based on Duncan Multiple Range Tests (p < 0.05). All ten performance metrics related tocluster membership (ANOVAs: p < 0.0000).
* significantly higher values;(–) significantly lower values;** means significantly higher than a * cluster; and*** means significantly higher than a ** cluster, etc.
The five performance types or clusters on the Performance Map are (see table 4 andfig. 2):
1. Stars—These projects are the clear winners. They have a stunning 96.7%success rate, the best of any group. Their return on investment is tied for thebest, they meet their sales objective (also tied for best), and they are rated asvery profitable (best of all groups). These projects are also efficient ones—time efficient, on schedule and on-budget, tied for best—and are undertaken ina short 13.7 months on average. And these projects open up new windows ofopportunity—new markets and new products—and are rated the best in termsof technical successes. All in all, a very enviable performance. CoincidentallyStars represent the largest cluster of projects: 27% of the sample.
AUSTRALIAN JOURNAL OF MANAGEMENT June 2000
– 28 –
2. Steady Winners—These projects we characterise as ‘steady-slow but sure’,and yield the second best results. They achieve very positive financialresults—a high success rate (92%); the best return on investment; and are tiedwith Stars for best in meeting sales objectives and profitability rating.Additionally, steady winners, to some degree, open up new windows ofopportunity for the business—new markets and new products, second only toStars (yet significantly less). But the technological success rating is onlymediocre, which might explain why they fare relatively poorly in terms oftime efficiency, on-time performance, and on-budget performance, and take18.8 months on average to undertake. These slow but sure projects account for23% of the sample.
3. Close-to-Home Projects—This smaller group of projects (17% of sample) arecharacterised as ‘conservative, stay close-to-home’ projects. They are the leastventuresome in terms of opening up new windows for the firms—no access tonew markets, nor opening other new product possibilities. Further, they arenot rated great technical successes, the lowest of all groups. But they are verytime efficient, are done very quickly (only 8.7 months), and boast on-timeperformance (tied for best). And they are the best in terms of staying on-budget. Financially, these projects achieve modest-to-good performance—amiddle-of-the-road 74% success rate, but very good scores for return oninvestment, meeting sales objectives, and profitability rating (tied for best).
4. Efficient Failures—This group of projects feature an abysmal success rate(94% failed!), but they got there efficiently. They are tied for best on all threeefficiency metrics—time efficiency, on-time performance, and staying onbudget—yet still take 14.5 months to do. But financial performance is dismal:tied for lowest for return on investment, meeting sales objectives, andprofitability rating. They also fail to open up new windows of opportunity: noaccess to new markets or new products, almost tied with Close-to-Homeprojects here. Fortunately this is a relatively small group of projects (only 15%of sample).
5. Dogs—These projects fare the worst on most performance metrics. They fail95% of the time. Their other financial measures—profitability rating, meetingsales objectives, and return on investment—are tied for worst. They are by farthe worst in terms of efficiency—time efficiency, and on-time and on-budgetperformance—even below the slow-moving Steady Winners above, taking23.4 months to do. These projects are anything but a technological success,but do manage to open up some new windows of opportunity (new market,new products), but only in a very modest way. Dogs represent 18% of thesample.
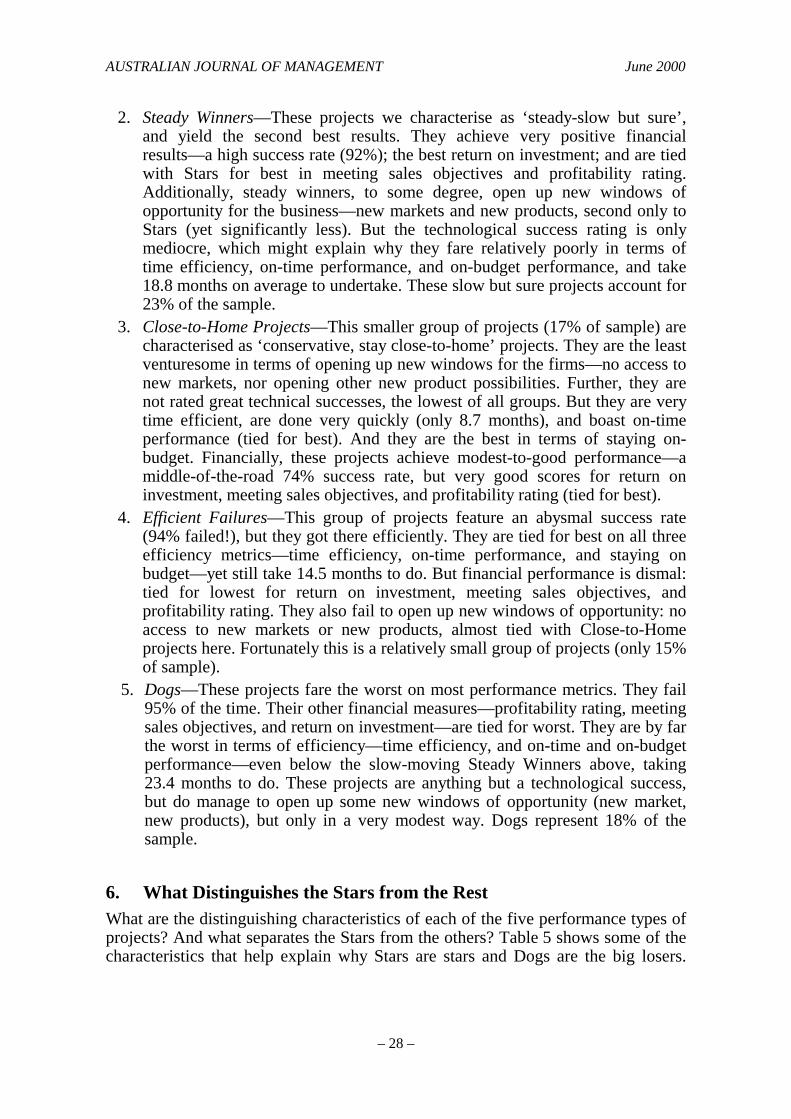
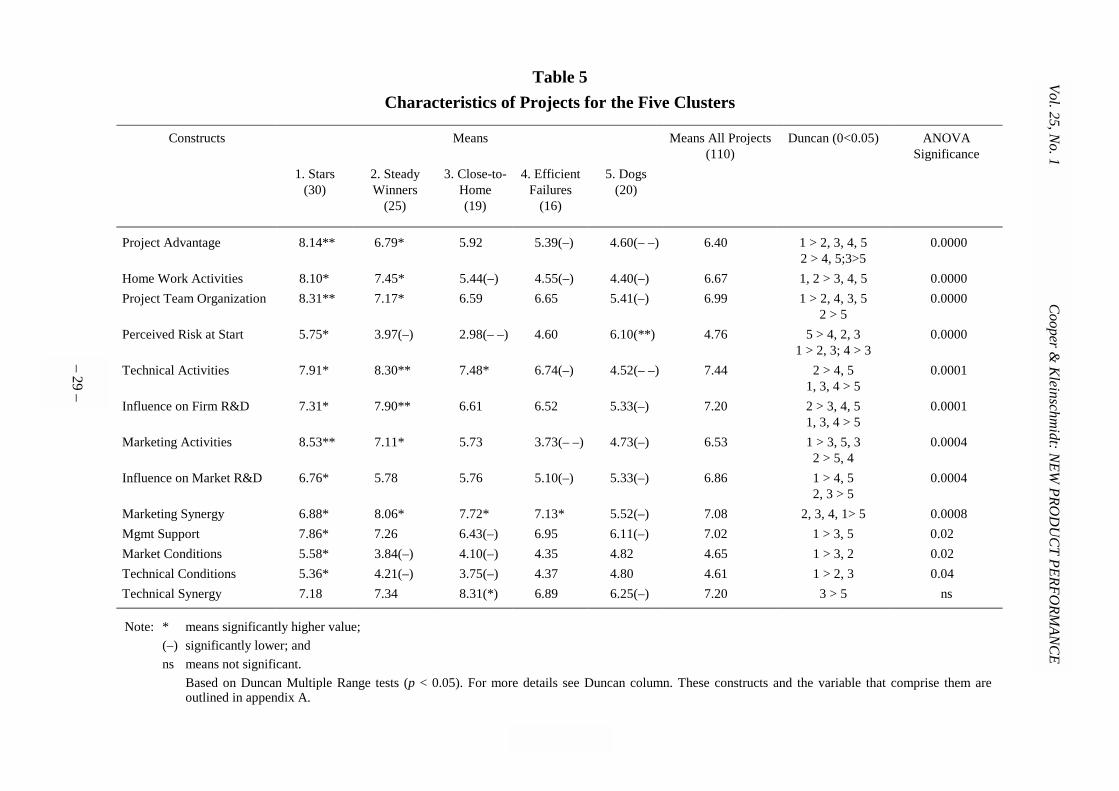
6. What Distinguishes the Stars from the RestWhat are the distinguishing characteristics of each of the five performance types ofprojects? And what separates the Stars from the others? Table 5 shows some of thecharacteristics that help explain why Stars are stars and Dogs are the big losers.
– 29 –
– 29 –
Table 5Characteristics of Projects for the Five Clusters
Constructs Means Means All Projects(110)
Duncan (0<0.05) ANOVASignificance
1. Stars(30)
2. SteadyWinners
(25)
3. Close-to-Home(19)
4. EfficientFailures
(16)
5. Dogs(20)
Project Advantage 8.14** 6.79* 5.92 5.39(–) 4.60(– –) 6.40 1 > 2, 3, 4, 52 > 4, 5;3>5
0.0000
Home Work Activities 8.10* 7.45* 5.44(–) 4.55(–) 4.40(–) 6.67 1, 2 > 3, 4, 5 0.0000Project Team Organization 8.31** 7.17* 6.59 6.65 5.41(–) 6.99 1 > 2, 4, 3, 5
2 > 50.0000
Perceived Risk at Start 5.75* 3.97(–) 2.98(– –) 4.60 6.10(**) 4.76 5 > 4, 2, 31 > 2, 3; 4 > 3
0.0000
Technical Activities 7.91* 8.30** 7.48* 6.74(–) 4.52(– –) 7.44 2 > 4, 51, 3, 4 > 5
0.0001
Influence on Firm R&D 7.31* 7.90** 6.61 6.52 5.33(–) 7.20 2 > 3, 4, 51, 3, 4 > 5
0.0001
Marketing Activities 8.53** 7.11* 5.73 3.73(– –) 4.73(–) 6.53 1 > 3, 5, 32 > 5, 4
0.0004
Influence on Market R&D 6.76* 5.78 5.76 5.10(–) 5.33(–) 6.86 1 > 4, 52, 3 > 5
0.0004
Marketing Synergy 6.88* 8.06* 7.72* 7.13* 5.52(–) 7.08 2, 3, 4, 1> 5 0.0008Mgmt Support 7.86* 7.26 6.43(–) 6.95 6.11(–) 7.02 1 > 3, 5 0.02Market Conditions 5.58* 3.84(–) 4.10(–) 4.35 4.82 4.65 1 > 3, 2 0.02Technical Conditions 5.36* 4.21(–) 3.75(–) 4.37 4.80 4.61 1 > 2, 3 0.04Technical Synergy 7.18 7.34 8.31(*) 6.89 6.25(–) 7.20 3 > 5 ns
Note: * means significantly higher value;(–) significantly lower; andns means not significant.
Based on Duncan Multiple Range tests (p < 0.05). For more details see Duncan column. These constructs and the variable that comprise them areoutlined in appendix A.
Vol. 25, No. 1
Cooper & K
leinschmidt: N
EW PRO
DU
CT PERFO
RMAN
CE
AUSTRALIAN JOURNAL OF MANAGEMENT June 2000
– 30 –
Note that 54 different characteristics were measured which comprise 13 majorthemes or constructs (see ‘How the Research was Done’ and app. A, for a completelist of project characteristics). Of the 13 constructs hypothesised to impact onperformance (fig. 1), nine are strongly and significantly linked to clustermembership (i.e. significant differences between cluster means; based on onewayANOVAs; α < 0.001). Another three are significantly linked (α=< 0.05), but the linkis not as strong. One construct is not significantly related to the five clusters. Thedrivers of new product performance—those factors that separate the big winnersfrom the losers most strongly, where ‘winners’ are defined on a variety of measures(the three performance metrics with their underlying variables)—are (in order ofimpact2):
1. Gaining competitive advantage via product superiority: a superior product,offering unique benefits to users; higher quality, with excellentprice/performance characteristics and easy-to-explain benefits (see app. A fora complete list of the items that comprise each construct).
2. Undertaking solid up-front homework before development gets underway:initial screening; preliminary market and technical assessments; marketstudies, concept development and concept testing; and business analysis.
3. The quality of the project team: a dedicated, committed team leader; a cross-functional, multi-disciplinary team accountable for the project from idea tolaunch and dedicated team members (a high proportion of their time is spenton the project).
4. Perceived risk at the start of the project: a medium level of risk combined withsome difficulties determining customer problems and identifying the product’sfeatures at the beginning are Star qualities. However, too much perceived riskis detrimental (see ‘Dog’ group).
5. Proficient execution of technical activities: technical assessment; productdevelopment; internal product testing; trial production and production start-up.
6. Customer influence: where the developing firm is closely aligned withcustomers—they have considerable influence over the developing company’stechnology, product and even promotion and distribution.
7. Proficient execution of marketing activities: preliminary market assessment;concept development and concept testing; customer field trials and marketlaunch.
8. Company influence over customers: where the company that develops theproduct has impact over general R&D activities in the market; attractstechnological competent allies and considerably influences its main customersin terms of their technology and their products.
9. Marketing synergy or leveraging the company’s resources in the area ofmarketing research and marketing intelligence, selling, distribution andpromotion and technical support. Note that technical synergy is not ofsignificance for this sample of products (R&D, manufacturing, and fit with theplant).
2 Based on significance levels; see table 5.
Vol. 25, No. 1 Cooper & Kleinschmidt: NEW PRODUCT PERFORMANCE
– 31 –
The winners also had better top management support (more direct support for theproject, more unity amongst senior management and more direct investmentspecific for the project), aimed their projects at somewhat more challengingmarkets (more dynamic markets, less predictable and more complex), and usedmore challenging technology (less stable and predictable and less simple). Asmentioned above, technical synergy did not significantly differ across theperformance groups on a general level.
Consider now the five performance types or cluster of projects, and some oftheir characteristics that differentiate them (see table 5; differences between clustertypes on all 54 characteristics are too numerous to show here but are listed in app.A).
6.1 StarsStars are simply great products: unique superior products, with excellentprice/performance characteristics, offering unique benefits to customers andbenefits that are easy to explain. Such superior products are also higher quality onesthan competitors’ products. Product superiority stands out as the number onedistinguishing feature of Star projects. But note, that product superiority is definedin the eyes of the customer.
So how do these project teams arrive at such stellar new products? For onething, Stars stand out in terms of the up-front homework undertaken and the qualityof marketing actions built in. In particular, the fuzzy front end or homework phaseof the project—those activities that precede Development—is superbly executed:initial screening; preliminary market assessment; preliminary technical assessment;detailed market studies; and building the business case. Some of these up-frontactions are marketing ones, but overall the marketing activities are proficientlyundertaken, from beginning to end of project: the preliminary and detailed marketstudies; customer tests or field trials of the product; and the market launch itself.Technical activities are also well-executed: the technical development of theproduct; preliminary technical assessment; internal tests; and trial production.Superlative up-front homework, a dedication to marketing actions and voice of thecustomer, sharp early product definition and solid technical work combine toexplain why star products boast such strong competitive and product advantage.
Organisationally, Stars are also model projects. They are strongly supportedby senior management: management is committed to the project; managementviews it as important and they make the necessary investment. Further, the projectteam is organised in an ideal way: there is a strong, committed project leader; theteam is cross-functional; team members are dedicated to this project (a highpercentage of their time is allocated to it); and they are accountable for the projectfrom beginning to end.
Some other characteristics of Star projects:• they are aimed at markets considered to be the most challenging; they use the
most challenging technology; and they are thought to be somewhat riskierprojects;
• they feature the second shortest time to market (second only to close-to-homeprojects); and
AUSTRALIAN JOURNAL OF MANAGEMENT June 2000
– 32 –
• the project is in a market or industry sector where the company can influenceits customers; however, customers also influence the firm considerably inthese markets—a mutual influence pattern, more so than for other projecttypes.
6.2 Steady WinnersSteady Winners are also successful—the second best of the five groups and areparticular strong on financial performance. What distinguishes their performance ishow inefficient they are: 18.9 months to market; behind schedule; time inefficient;and over budget.
Steady Winners share many of the same positive attributes as Stars, but mostoften place second on each attribute:
• very strong technical activities—the strongest of all groups;• product advantage: superior products; unique customer benefits; good
price/performance characteristics; but not very innovative products;• solid up-front homework; and• proficient cross-functional teams with moderate management support.
Where these projects differ from Stars is their fit with the business. Overall, theyfeature the greatest synergy with the base business of all project groups—that is,they are able to leverage the business’ core competencies, notably in marketingresearch, selling, distribution and promotion, and technical support.
A second difference concerns customer power/influence over the developmentactivities of the firm. Steady Winners are projects where the customer has greatinfluence (the highest of all groups) over the company’s R&D, which products ortechnology to use for the project, and in particular (the significantly highest level)how to promote and distribute the new product. On the other hand the firm withsuch a project has a very low level of impact on the customer’s R&D in this area.Part of the situation here might be that these are markets/sectors where the customerexerts a strong influence over the company, much more so than for other projecttypes—the company is in a reactive mode, simply responding to customer requests.
Additionally, these Steady Winners are seen as low risk ones, they utiliseunchallenging technologies and they are targeted at unchallenging markets.
In spite of the above these projects are almost as good as Stars in manyrespects. However, activities such as up-front homework, project team organisationand marketing activities could have been executed more proficiently. This may helpexplain the significantly lower efficiency results. The non-challenging market andtechnology for the project, in turn, may be related to the significantly lower level ofopportunities for opening new market/product windows (compared to Stars).
The message is that if firms can find low risk projects that have high marketsynergies (fit the base business in terms of marketing resources), then they canexpect significant financial rewards. However, the non-challenging market andtechnology combined with little investment in the project including the absence of adedicated team (compared to Stars) seems to add many months to the project’s timeframe.
Vol. 25, No. 1 Cooper & Kleinschmidt: NEW PRODUCT PERFORMANCE
– 33 –
6.3 Close-to-Home ProjectsThese projects have a 73.7% success rate (one in four projects is a failure) and arevery quick hits and efficiently undertaken. What distinguishes these projects is thatthey are essentially extensions, modifications or refinements to existing companyproducts:
• they are the lowest risk of all project types;• they boast the shorted time to market (8.7 months); and• they feature high marketing synergy with the base business—marketing
research, selling, distribution, advertising and technical support services.
But these are smaller, less challenging projects:• markets and technologies are thought to be simple and predictable (not much
of a challenge);• they are not innovative products at all (the least innovative of all five groups)
and are very familiar products to the company (the most familiar of allgroups); and
• investments requires and made by senior management are minimal (the leastof all groups).
Perhaps because they are smaller, low risk and familiar projects, relatively little up-front homework is undertaken. Market-oriented activities (preliminary marketassessment, concept development and testing, market launch) are relatively weak.Finally, product advantage is also lacking.
These ‘minor projects’ are popular, and results are generally positive. But withmore attention to up-front homework and market-oriented activities, perhaps resultscould be even better. More on these Close-to-Home projects later in the article.
6.4 Efficient FailuresEfficient failures are a small group of projects overall, but represent more than one-third of the failures in the study. They have a very high failure rate (94%) but arequite time efficient. So what makes them failures? Simple: they lack most of thekey ingredients that make Stars so successful:
• Efficient Failures have the distinction of having the most poorly executedmarketing activities:– the weakest of all groups in terms of customer work: concept development;
concept testing; and field trials with the customer. Launch is also the mostdeficient of the five groups;
• they also feature very weak up-front homework; and• they boast minimal product advantage—no unique customer benefits; no
better than competitors’ products; not particularly high quality products.
Other characteristics of these Efficient Failures are just about average.The message is clear: pay lip-service to the marketing activities; ignore the
voice of the customer; and do a lack-lustre job on the up-front homework and theresult is predicable—another product failure.
AUSTRALIAN JOURNAL OF MANAGEMENT June 2000
– 34 –
6.5 DogsThe big losers in the study are the Dogs: they have the highest failure rate (95%)and account for 45% of all failures in the study. And even worse than EfficientFailures above, these Dogs take forever to get to market (23 months) and are ratedas both very unprofitable and inefficient (behind schedule, over budget).
What distinguishes the Dog projects, and what lessons can be learned here?Dogs have just about everything going against them.
• The team organisation is extremely weak—there is no dedicated team leader;the team is not cross-functional; the team is not accountable from beginning toend of project; and the team lacks dedicated members and this is combinedwith the weakest top management support. In addition, these projects areperceived at having the highest risk at the start of the development;
• Project synergy with the base business is missing, the lowest of all projecttypes. For example, the project does not leverage the business’s R&D nor isthere a good fit with the company’s selling, distribution, promotion andtechnical support resources and abilities;
• Quality of execution is sub-standard across the board:– technical activities are very deficient—the worst of all groups. For
example, preliminary technical assessment, the actual development of theproduct, internal product tests, pilot or trial production and productionstart-up are all rated the weakest of all project types;
– market-oriented activities are also weak (just slightly better than theEfficient Failures); and
– up-front homework is very poor (tied for worst with Efficient Failures).
• The lack of synergy (inability to attack from a position of strength) coupledwith the poor team structure may account for the sub-standard quality ofexecution; and
• Finally, the resulting products have the least product or competitive advantageof all project types: these products are no better than competitors’; theirquality is mediocre; they offer no unique benefits; their price/performancecharacteristics are weak; and they are not innovative. Once again, weaknesseshere might be explained by the lack of synergy, poor team structure and sub-standard quality of execution.
Dogs are easy to explain, but sometimes not so easy to avoid. Recognise thepitfalls: the problems begins with a lack of synergy with the base business(attacking from weakness) coupled with poor team structure. Add to this sub-standard quality of execution across the board and a product with no or fewadvantages and one has all the ingredients for a dismal failure.
7. Comparing the Results to Other StudiesThe results from this Australian study parallel closely those derived from apreviously-undertaken major international study (Cooper & Kleinschmidt 1995).
Vol. 25, No. 1 Cooper & Kleinschmidt: NEW PRODUCT PERFORMANCE
– 35 –
For example, like the current study, the international study also identified fiveperformance groups or clusters of projects, but on a two dimensional performancemap. And the clusters of projects were indeed very similar to the Australianclusters. This striking parallelism lends support to the universality of the underlyingmodel and success factors we identified.
Just how close are the two studies? Both the conceptual model used in theAustralian study, and the variables measured, are based on those in the internationalstudy, thereby permitting direct comparison. However, the Australian studyincluded a few more performance measures, and also some additional measures ofproject characteristics. The major differences, however, are the samples: theinternational study focuses on projects in the chemical industry—typically largemultinational corporations with annual sales in the billions of dollars—in bothEurope and North America; whereas the Australian study looks at quite a differentindustry (across many industries, see table 1 for details), and the companies aremuch smaller (average annual sales: US$38 million).
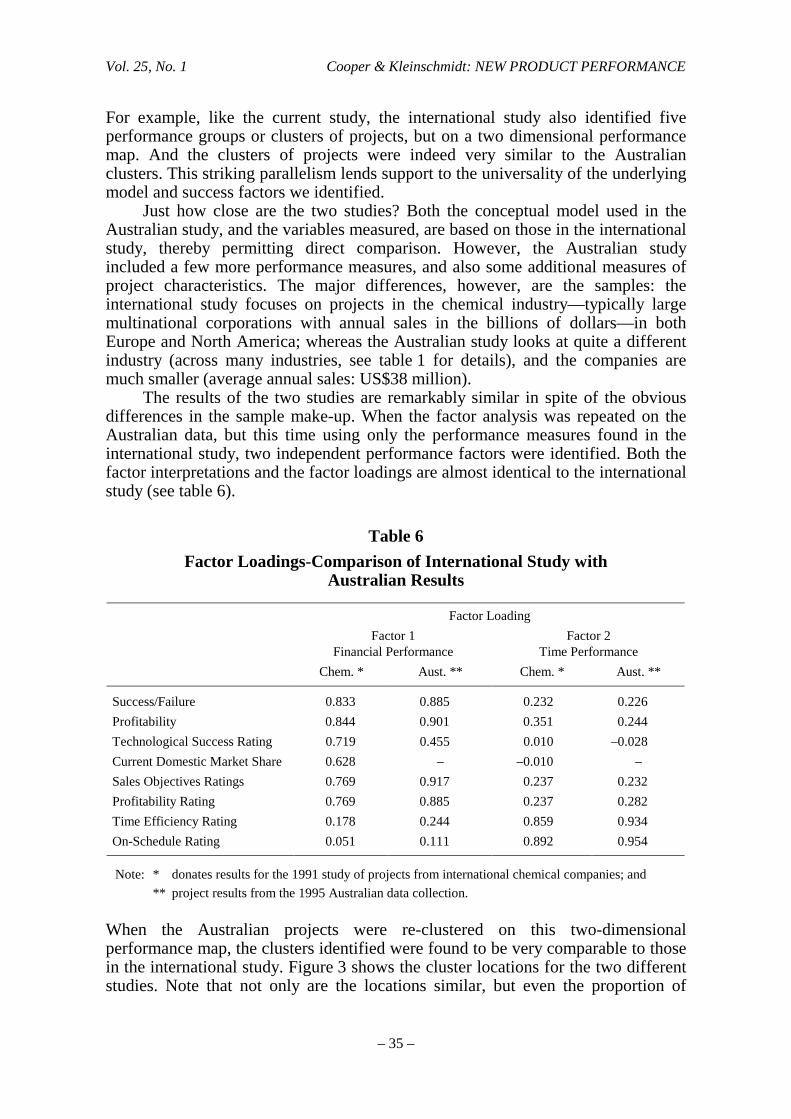
The results of the two studies are remarkably similar in spite of the obviousdifferences in the sample make-up. When the factor analysis was repeated on theAustralian data, but this time using only the performance measures found in theinternational study, two independent performance factors were identified. Both thefactor interpretations and the factor loadings are almost identical to the internationalstudy (see table 6).
Table 6Factor Loadings-Comparison of International Study with
Australian Results
Factor LoadingFactor 1
Financial PerformanceFactor 2
Time PerformanceChem. * Aust. ** Chem. * Aust. **
Success/Failure 0.833 0.885 0.232 0.226Profitability 0.844 0.901 0.351 0.244Technological Success Rating 0.719 0.455 0.010 –0.028Current Domestic Market Share 0.628 – –0.010 –Sales Objectives Ratings 0.769 0.917 0.237 0.232Profitability Rating 0.769 0.885 0.237 0.282Time Efficiency Rating 0.178 0.244 0.859 0.934On-Schedule Rating 0.051 0.111 0.892 0.954
Note: * donates results for the 1991 study of projects from international chemical companies; and** project results from the 1995 Australian data collection.
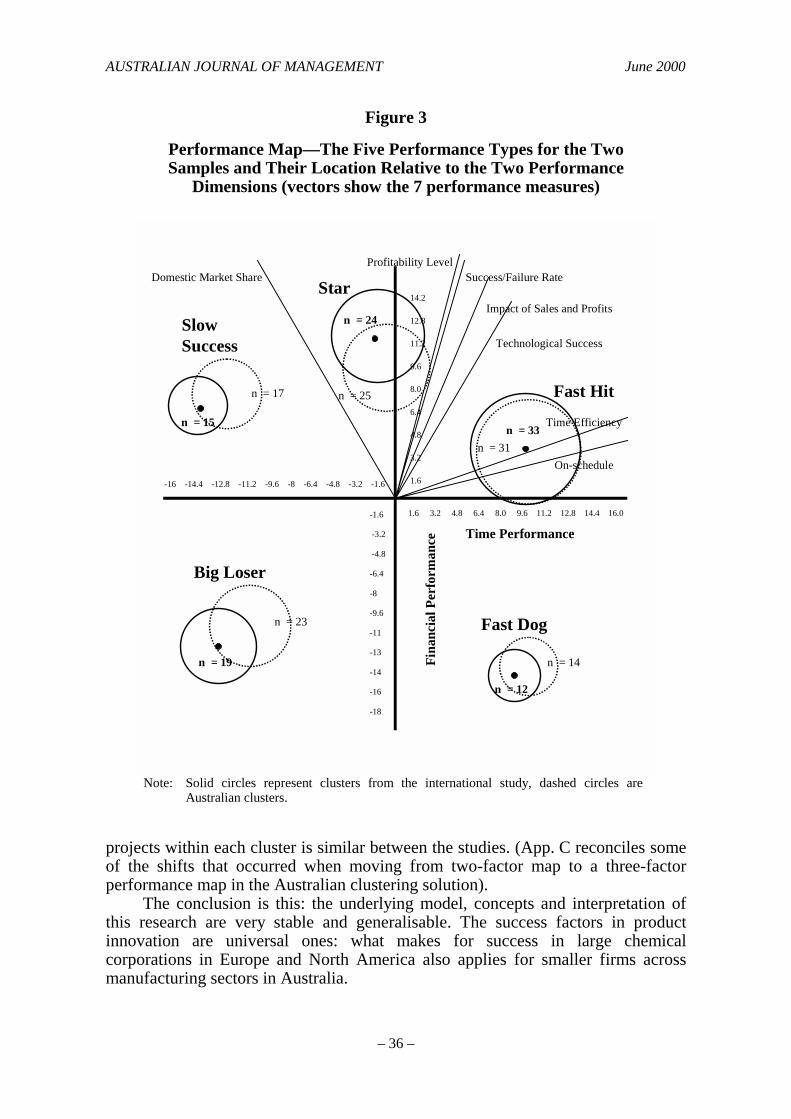
When the Australian projects were re-clustered on this two-dimensionalperformance map, the clusters identified were found to be very comparable to thosein the international study. Figure 3 shows the cluster locations for the two differentstudies. Note that not only are the locations similar, but even the proportion of
AUSTRALIAN JOURNAL OF MANAGEMENT June 2000
– 36 –
Figure 3
Performance Map—The Five Performance Types for the TwoSamples and Their Location Relative to the Two Performance
Dimensions (vectors show the 7 performance measures)
Note: Solid circles represent clusters from the international study, dashed circles areAustralian clusters.
projects within each cluster is similar between the studies. (App. C reconciles someof the shifts that occurred when moving from two-factor map to a three-factorperformance map in the Australian clustering solution).
The conclusion is this: the underlying model, concepts and interpretation ofthis research are very stable and generalisable. The success factors in productinnovation are universal ones: what makes for success in large chemicalcorporations in Europe and North America also applies for smaller firms acrossmanufacturing sectors in Australia.
SlowSuccess
Star
Fast Hit
Fast Dog
Big Loser
Time Performance
Fina
ncia
l Per
form
ance
On-schedule
Time Efficiency
Technological Success
Impact of Sales and Profits
Success/Failure RateProfitability Level
Domestic Market Share
n = 15
n = 17 n = 25
n = 24
n = 33n = 31
n = 14
n = 12
n = 19
n = 23
-16 -14.4 -12.8 -11.2 -9.6 -8 -6.4 -4.8 -3.2 -1.6
1.6 3.2 4.8 6.4 8.0 9.6 11.2 12.8 14.4 16.0-1.6
-3.2
-4.8
-6.4
-8
-9.6
-11
-13
-14
-16
-18
14.2
12.8
11.2
9.6
8.0
6.4
4.8
3.2
1.6
Vol. 25, No. 1 Cooper & Kleinschmidt: NEW PRODUCT PERFORMANCE
– 37 –
8. The Special Case of Close-to-Home ProjectsClose-to-Home projects merit special attention. They are the only cluster that has asignificant proportion of failures and successes. One quarter of all projects arefailures for this cluster, though as a cluster does quite well on time efficiency andfinancial performance. A previous study showed that close-to-home projects—projects that are not innovative for the company—do very well financially(Kleinschmidt & Cooper 1991, p. 240). On average, the Australian results concur.
Now consider the failures versus the successes within this Close-to-Homecluster. Please remember; firms in this study had pre-identified projects as a successor failure. This formed the first of the 10 performance measure ‘success rate.’ Thethree performance metrics or dimension used for forming the five performancetypes or clusters do not identify individual projects as success or failure. In thiscluster, successes do well financially and failures perform significantly lower.Further, failures stand out as being extremely poor at opening any window ofopportunity (e.g. ‘access to new markets’ is a very low 0.80 for failures v. a stilllow of 3.14 for successes; the values are 1.20 v. 3.50 for ‘new product possibilities’and 1.20 v. 2.71 for ‘Technological success’; most detailed values are not shownhere but are available from the authors).
Some notable differences between the failure and successful projects withinthis Close-to-Home cluster are:
• failure projects lack an effective cross-functional team effort: the team is notdedicated at all (a part-time effort—scale value of 1.0 v. 6.21 for successes ona 10 point scale); the team does not carry the project from beginning to end;and the multi-disciplinary aspect is mediocre (value of 5.8);
• failure products have many fewer benefits for customers than do successes(for example ‘having a superior product’ scored 3.60 for failures v. 6.25 forsuccesses and the values for ‘clear benefits’ and ‘superior price/performance’are 5.80 v. 4.20 v. 7.21 respectively); and
• top management supports differed also significantly: failures scored 6.60versus 9.07 for successes on ‘management support’ and 1.80 versus 4.21 on‘made investments specific for this project’.
The conclusion is that Close-to-Home projects, on average do very well financially.This concurs with similar findings in other studies (e.g. see Kleinschmidt & Cooper1991) that indicate that such projects have excellent financial pay-back, and are alsodone efficiently. But such projects do not create a window for new opportunities—new products or new markets. And a significant number of these projects lack atrue cross-functional team effort, most often, they result in failure. One reason forthis is that management may be deluded into believing that, being close-to-homeinitiatives, a cross-functional team is not really needed for these projects . . .perhaps the project isn’t deemed important or adventuresome enough to mandate ateam effort. A dedicated team is never assembled, and the project flounders. So themessage is this: Just because a project is in familiar territory, don’t think thatsuccess can be achieved without a cross-functional team and not aiming for a solidproduct advantage.
AUSTRALIAN JOURNAL OF MANAGEMENT June 2000
– 38 –
9. ConclusionsThere are nine major messages for managers of new product initiatives:
1. Product advantage is the number one success factor (based on ANOVAsignificance values (and highest F values—not shown here), see table 5,construct ‘Product advantage’ and appendix A, #1 details, again ANOVAsand F values (available on request) for the individual variables making up theconstruct as well as the means of each cluster and resulting Duncan splits).This is the strongest discriminator between the winners and losers in thestudy. Yet product advantage is lacking in about half the cases studied; andthese projects performed much more poorly on average. The quest must befor real product advantage: this means building in superior price/performancecharacteristics; superior benefits for customers; and higher relative productquality, however the customer defines quality (items in app. A). Whiletechnological prowess sometimes is the door to arriving at this superior valueproduct, often the key to this door lies with the customer: understanding whata benefit is; what superior performance is; what quality really means; andwhat customer value (price /performance) depends on.
2. Up-front homework is fundamental to success (based on ANOVA andDuncan results, see table 5 (second highest F value, not shown) andapp. A, #2). Devoting the time, money and effort to the up-front homeworkor pre-development tasks and executing these in a quality fashion, isfundamental. The Stars provide the example. Good homework meansproficiently executing those tasks which precede the Development phase, thathelp shape, define and justify the project, namely: the initial screening; thepreliminary technical and market assessments; and the detailed marketstudies (concept development and testing, see app. A). Homework pays off interms of higher success rates and profits (see Stars and Steady Winners).
3. Organise around a true cross-functional team (table 5, construct ‘ProjectTeam organisation’ and app. A, #5, ANOVA, Duncan and F values (notshown)), much like the teams uncovered in the Stars. This means a cross-functional team from different functions or departments in the company; whodevote a considerable proportion of their time (dedicated) to the project; whoare accountable for all facets of the project from beginning to end(continuous); and who are a team with an identifiable, strong project leaderwho champions and drives the project.
4. Focus on markets, sectors or situations where you exert influence over yourcustomer (table 5, construct ‘Influence on market R&D’). This means that thedeveloping company can influence its main customers technology and theirproducts, as in the case of Star projects. And try to avoid situations whereyou exert little influence, while your main customers control you in terms oftechnology, products and even promotion. This was the situation faced byEfficient Failures (see app. A, #10 and #11, means, ANOVAs and Duncansplits). By contrast, projects where the main customers have considerableinfluence and impact on the firm’s R&D activities (table 5, construct‘Influence on firm R&D’ and app. A, #11), influence products andtechnologies used by the firm, and may even impact on the firm’s promotionand distribution set conditions for better performance if this is combined with
Vol. 25, No. 1 Cooper & Kleinschmidt: NEW PRODUCT PERFORMANCE
– 39 –
being able to exert influence over your customers (at least to some degree;see Steady Winners, table 5, Duncan results). Close co-operation, wherecustomers and the developer firm work closely together and influence eachother, certainly makes for more successful projects (Stars, table 5, means andDuncan results and app. A, #10 and #11).
5. Don’t avoid projects where you perceive of risks at the beginning but becareful (see table 5, construct ‘Perceived risk at start’ and app. A, #9).Projects with a perceived level of risk at the beginning, some difficultydetermining customer problems and identifying required features are part ofthe profiles of projects of Stars and Dogs. So don’t exclude such projectsautomatically if you aim for Stars. How you treat these difficulties will makethe difference.
6. Quality of execution is key. Marketing excellence must be an integral facet ofevery new product project. By marketing excellence we don’t just mean astrong, well-targeted launch (see construct ‘Marketing activities’, table 5).We mean quality of execution of marketing tasks from idea generation rightthrough to launch (app. A, #3 lists the activities linked to success which werea measure of how well the activities were done). This begins with thepreliminary market assessment and the detailed market studies (define theproduct concept, and do a concept tests to gauge customer reaction).Customer tests of the product (field trials) and a quality market launch arealso key. Indeed quality of execution of these marketing tasks is one of thethree common denominators of our two winners, Stars and Steady Winners(see table 5 and app. A, #3, ANOVAs, mean values and Duncan splits).Similarly, quality of execution of technical activities is vital. This meansdoing a first class job on the preliminary technical assessment, thedevelopment of the product itself, internal tests, trial production andproduction start-up, as was the case with our success scenarios, Stars, SteadyWinners and Close-to-Home and a significantly weaker aspect of Dogs(app. A, #4 shows the details).
7. Synergy—the ability to leverage or exploit one’s core competencies, skillsand resources—improves the odds of success (see construct ‘Marketingsynergy’ in table 5 and details in app. A, #7). The goal is to attack from aposition of strength, in particular from marketing synergies—building fromyour company’s marketing research and information base, selling,distribution, promotion and technical support. But synergy is not as critical assome of the other factors above (see ‘Technical Synergy’ and ANOVAs andDuncan splits in app. A, #6). Indeed, Star products boasted only moderatesynergy, but the other two winners Steady Winners and Close-to-Homeprojects feature high synergy. One message is that leveraging existingresources is a plus (in particular for Steady Winners); but perhaps this shouldnot be the overriding concern when selecting which projects to undertake,that is, when trying to choose Stars.
8. These success factors, and indeed the underlying model and measures used,are universal. The results of this study parallel remarkably well those of aninternational study done in the chemical industry that employed almostidentical research methodology (see section ‘Comparing the Results to other
AUSTRALIAN JOURNAL OF MANAGEMENT June 2000
– 40 –
Studies’ and table 6). Moreover, the conclusions of the study mirror those ofcountless other studies that compared new product successes and failures (seeMaidique & Zirger 1984; Cooper 1996).
9. Close-to-Home projects generally yield positive financial and efficiencyperformances (see table 4, means and Duncan splits). However, becausethese projects are so familiar, don’t overlook important success factors.These projects require support from top management and a solid team thatstays with the project and has a sharp eye on creating a solid productadvantage (see section ‘The Special case . . .’).
Product leadership—creating and developing superior new products—is a criticalgoal for Australian businesses if they are to survive and prosper in the years ahead.The research reported in this article shed some light on the success factors thatunderlie Australian product innovation, and identify the key messages formanagement. The next step for management, is to review their product innovationprocess and practices and then move towards implementing a systematicapproach—for example, a stage-and-gate new product process (Cooper 1998)combined with effective project selection and portfolio management (Cooper,Edgett & Kleinschimdt 1998)—in order to build these success factors into theirmodus operandi.
(Date of receipt of final typescript: January, 2000.Accepted by Mark Uncles, Area Editor.)
ReferencesAbernathy, W.J. & Clark, K.B. 1986, ‘Innovation: Mapping the winds of creative destruction’,
Research Policy, vol. 14, pp. 3–22.Cooper, R.G. 1979a, ‘Identifying industrial new product success: Project NewProd’, Industrial
Marketing Management, vol. 8, May, pp. 124–35.Cooper, R.G. 1979b, ‘The dimensions of industrial new product success and failure’, Journal of
Marketing, vol. 43, Summer, pp. 93–103.Cooper, R.G. 1996, ‘New products: What separates the winners from the losers’, in PDMA
Handbook for New Product Development, ed. M. D. Rosenau Jr., John Wiley & Sons Inc. NewYork.
Cooper, R.G. 1998, Product Leadership: Creating and Launching Superior New Products,Perseus Books, Reading, Mass.
Cooper, R.G., Edgett, S.J. & Kleinschmidt, E.J. 1998, Portfolio Management for New Products,Perseus Book, Reading, Mass.
Cooper, R.G. & Kleinschmidt, E.J. 1987, ‘Success factors in product innovation’, IndustrialMarketing Management, vol. 16, no. 3, pp. 215–23.
Cooper, R.G. & Kleinschmidt, E.J. 1993a, ‘Major new products: What distinguishes the winnersin the chemical industry’, Journal of Product Innovation Management, vol. 2, no. 10, March,pp. 90–111.
Cooper, R.G. & Kleinschmidt, E.J. 1993b, ‘New product success in the chemical industry’,Industrial Marketing Management, vol. 22, no. 2, pp. 85–99.
Vol. 25, No. 1 Cooper & Kleinschmidt: NEW PRODUCT PERFORMANCE
– 41 –
Cooper, R.G. & Kleinschmidt, E.J. 1995, ‘Performance typologies of new product projects’,Industrial Marketing Management, vol. 24, pp. 439–56.
Cooper, R.G. & Kleinschmidt, E.J. 1999, ‘New product performance: Benchmarking the bestpractice projects’, Industrial Marketing Management, forthcoming.
Dwyer, L.M. 1990, ‘Factors affecting the proficient management of product innovation,’ Journalof Technology Management, vol. 5, no. 6, pp. 721–30.
de Brentani, U, 1991, ‘Success factors in developing new business services’, European Journal ofMarketing, vol. 15, no. 2, pp. 33–59.
Fisher, W.A., Blackmon, K.L. & Woodward, W. 1992, ‘Technical decision making in Chineseenterprises’, in Organization & Management in China, 1979–1990, Oded Shenkar ed. M.E.Sharpe, Inc., London.
Griffin, A. & Page, A.L. 1993, ‘An interim report on measuring product development success andfailure’, Journal of Product Innovation Management, vol. 10, no. 4, pp. 291–308.
Johne, A. & Snelson, P. 1998, ‘Auditing product innovation activities in manufacturing firms’,R&D Management, vol. 18, no. 3, pp. 227–233.
Kleinschmidt, E.J. & Cooper, R.G. 1991, ‘The impact of product innovativeness on performance’,Journal of Product Innovation Management, vol. 8, pp. 240–51.
Kleinschmidt, E.J. & Cooper, R.G. 1997, ‘The winning formula’, Engineering World, vol. 7,no. 2, April-May, pp. 28–35.
Larson, E.W. & Gobeli, D.H. 1998, ‘Organizing for product development projects’, Journal ofProduct Innovation Management, vol. 5, pp. 180–90.
Maidique, M.A. & Zirger, B.J. 1984, ‘A study of success and failure in product innovation: Thecase of the U.S. electronics industry’, IEEE Transactions in Engineering Management, EM–31, November, pp. 192–203.
Montoya-Weiss, M.M. & Calantone, R. 1994, ‘Determinants of new product performance: areview and meta analysis’, Journal of Product Innovation Management, vol. 11, no. 5,November, pp. 397–417.
Peters, T.J. & Waterman, R.H. 1982, In Search of Excellence, Harper & Row, New York.Porter, M.E. 1985, Competitive Advantage: Creating and Sustaining Superior Performance, Free
Press, New York.Rosenthal, S.R. & Tatikonda, M.V. 1993, ‘Time management in new product development: Case
study findings’, Engineering Management Review, vol. 21, no. 3, Fall, pp. 13–20.Rothwell, R. 1972 Factors for success in industrial innovations, Project SAPPHO—A
Comparative Study of Success and Failure in Industrial Innovation, SPRU, University ofSussex, Brighton, U.K.
Rothwell, R., Freeman, C., Horseley, A., Jervis, V.T.B., Robertson, A.B. & Townsend, J. 1974,‘SAPPHO updated-Project SAPPHO Phase II’, Research Policy, vol. 3, pp. 258–91.
Sanchez, A.M. & Elola, L.N. 1991, ‘Product innovation management in Spain’, Journal ofProduct Innovation Management, vol. 8, pp. 49–56.
Song, X.M. & Parry, M.E. 1994, ‘The dimensions of industrial new product success and failure instate enterprises in the People’s Republic of China’, Journal of Product InnovationManagement, vol. 11, no. 2, March, pp. 105–18.
Utterback, J.M., Allen, T.J, Holloman, J.H. & Sirbu, M.H. 1976, ‘The process of innovation infive industries in Europe and Japan’, IEEE Transactions in Engineering Management,February, pp. 3–9.
AUSTRALIAN JOURNAL OF MANAGEMENT June 2000
– 42 –
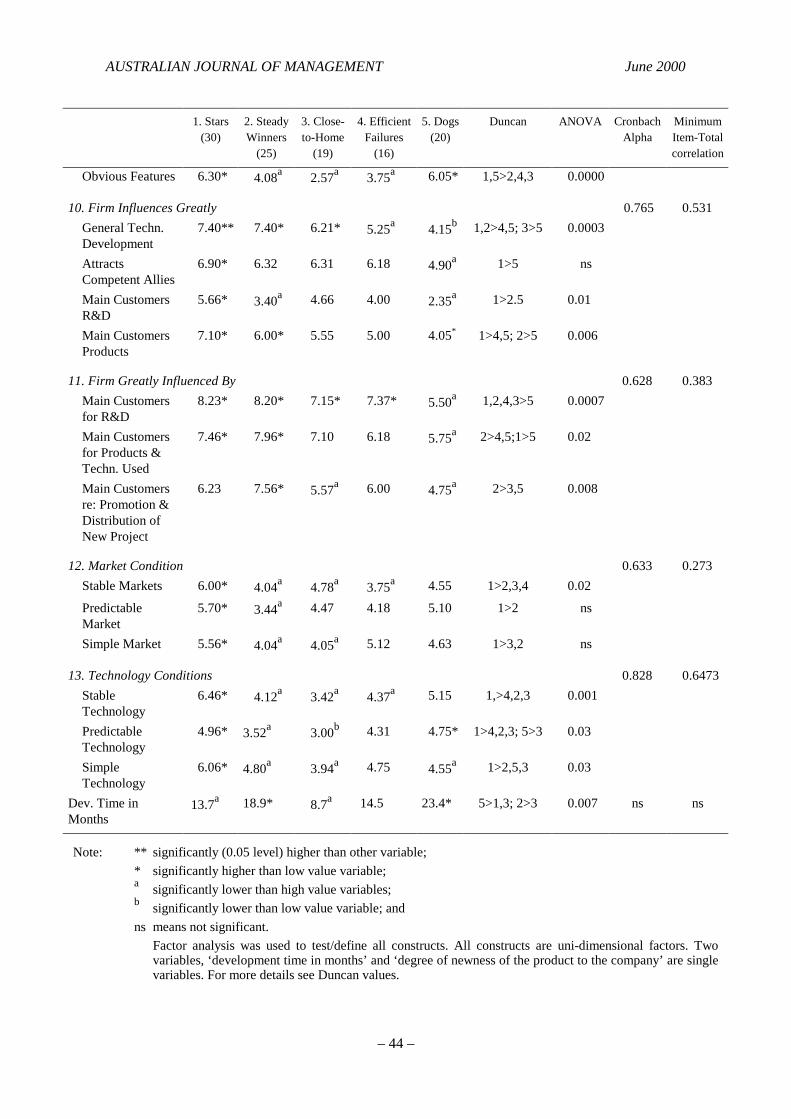
Appendix A54 Individual Construct Variables and Cluster Means
1. Stars(30)
2. SteadyWinners
(25)
3. Close-to-Home
(19)
4. EfficientFailures
(16)
5. Dogs(20)
Duncan ANOVA CronbachAlpha
MinimumItem-Totalcorrelation
1. Product Advantage 0.853 0.549Superior Product 8.73** 7.44* 5.631 4.931 4.501 1 > 2 > 3, 4, 5 0.0000Better Quality 8.03* 6.60 6.52 5.37 4.401 1 > 2, 4, 5; 2,
3 > 50.0000
Unique Product 8.30* 7.60* 5.86L 5.501 5.501 1, 2 > 3, 4, 5 0.0001Benefits Easy toExplain
8.16* 7.33* 7.47* 6.62* 4.901 1, 3, 2, 4 > 5 0.0002
Better Price/Performance
7.86* 6.44* 6.42* 4.431 4.151 1, 2, 3 > 4, 5 0.0000
Innovative 7.76* 5.40 3.84 5.50 4.60 1 > 4, 5, 2, 3 0.0001New to Company 7.83* 6.16 4.78a 7.56* 6.90 1, 4 > 3 0.03 not part of construct
2. Homework 0.853 0.560Idea Screening 7.19* 6.80 5.82 5.38 3.87a 1 > 4, 5; 2, 3
> 50.0002
PreliminaryMarketingAssessment
7.19** 6.42* 4.93a 5.001 2.93b 1 > 4, 3, 5; 2,4, 3 > 5
0.0000
PreliminaryTechn.Assessment
7.75* 7.47* 7.46* 6.14a 5.13b 1 > 4, 5; 2, 3> 5
0.0004
ConceptDevelopment
7.62** 6.88* 5.62 3.20b 5.00a 1 > 3, 5, 4; 2> 5, 4; 3, 5 >
4
0.0000
Concept Testing 7.42* 6.77* 2.831 3.001 4.20* 1, 2 > 5, 4, 3 0.0002
3. Marketing Activities 0.879 0.6285PreliminaryMarketingAssessment
7.19** 6.42* 4.93a 5.00a 2.93b 1 > 4, 5; 2, 3> 5
0.0000
ConceptDevelopment
7.62** 6.88* 5.62 3.20b 5.00a 1 > 3, 5, 4; 2> 5, 4; 3, 5 >
4
0.0000
Concept Test 7.42* 6.77* 2.83a 3.00a 4.10a 1, 2 > 5, 4, 3 0.002
GeneralCustomer Tests
7.85* 6.38* 7.10* 4.12b 5.00a 1 > 5.4; 35, 2> 4
0.001
Market Launch 7.21* 7.29* 5.83 4.72a 5.81 2, 1 > 4 0.01
4. Technical Activities 0.841 0.560PreliminaryTechn.Assessment
7.75* 7.47* 7.46* 6.14a 5.13b 1 > 4, 5; 2, 3> 5
0.004
Vol. 25, No. 1 Cooper & Kleinschmidt: NEW PRODUCT PERFORMANCE
– 43 –
1. Stars(30)
2. SteadyWinners
(25)
3. Close-to-Home
(19)
4. EfficientFailures
(16)
5. Dogs(20)
Duncan ANOVA CronbachAlpha
MinimumItem-Totalcorrelation
Development 8.67* 8.04* 8.25* 7.75* 6.17a 1, 3, 2, 4 > 5 0.0004
Internal Tests 8.20* 8.32* 7.70* 7.14 5.93a 2, 1, 3, > 5 0.003
Pilot Production 7.76* 7.80* 6.66* 7.10* 4.63a 2, 1, 4, 3 > 5 0.002
Production Start-Up
7.30* 8.10* 7.78* 6.80* 3.92a 2, 3, 1, 4 > 5 0.0000
5. Project Organization 0.724 0.445Strong Leader 9.05* 8.06* 7.78* 7.31a 6.10b 1 > 4, 5 2, 1 >
50.0005
Multi-DisciplinaryTeam
7.86* 7.28* 6.26 6.50 5.25a 1, 2 > 5 0.04
Continuous Team 9.03* 7.68* 7.47 7.50 5.85a 1.2 > 5 0.002
Dedicated Team 7.33* 5.64a 4.84a 5.31a 4.45a 1 > 2, 4, 3, 5 0.01
6. Technical Synergy 0.802 0.550Had R&D Skills 7.53* 7.92* 8.15* 6.87a 5.65a 3, 2, 1 > 4, 5 0.01
Had Manuf.Skills
7.60 7.60 8.36 7.25 6.65 ns ns
Used ExistingProduction
6.70 6.52 8.42 6.56 6.45 ns ns
7. Marketing Synergy 0.842 0.467Had MR & MISkills
7.23* 6.96* 7.57* 5.87 4.45a 3,1,2>5 0.0003
Had Selling Skills 6.401 8.45* 8.00* 7.43 5.55b 2 > 1, 5, 3 > 5 0.006
Had DistributionSkills
6.201 8.44* 8.26* 7.62 5.90a 2,3>1,5 0.005
Had Advert.Skills
6.69 7.76 7.26 7.50 6.30 ns ns
Had Techn.Support Skills
7.72* 8.12* 7.52* 7.75* 5.40a 2,1,3,4>5 0.002
8. Top Management Support 0.691 0.453Supported Project 9.24* 8.80 8.42 7.93a 7.60a 1>3,5 0.03
Respect AmongstManagement forProject
8.72** 7.96* 7.31* 7.93* 5.75b 1>3,5;2,4,3>5
0.0002
Made Investmentin Project
5.62* 5.04 3.57a 5.00 5.00 1>3 ns
9. Risk Taking Level 0.646 0.393Little Risk atStart
5.66* 5.00* 3.05a 6.06* 6.70* 5,4,1,2>3 0.0009
Minor CustomerProblem
5.30* 2.84a 3.31a 4.00 5.55* 5,1>3,2 0.005
AUSTRALIAN JOURNAL OF MANAGEMENT June 2000
– 44 –
1. Stars(30)
2. SteadyWinners
(25)
3. Close-to-Home
(19)
4. EfficientFailures
(16)
5. Dogs(20)
Duncan ANOVA CronbachAlpha
MinimumItem-Totalcorrelation
Obvious Features 6.30* 4.08a 2.57a 3.75a 6.05* 1,5>2,4,3 0.0000
10. Firm Influences Greatly 0.765 0.531General Techn.Development
7.40** 7.40* 6.21* 5.25a 4.15b 1,2>4,5; 3>5 0.0003
AttractsCompetent Allies
6.90* 6.32 6.31 6.18 4.90a 1>5 ns
Main CustomersR&D
5.66* 3.40a 4.66 4.00 2.35a 1>2.5 0.01
Main CustomersProducts
7.10* 6.00* 5.55 5.00 4.05* 1>4,5; 2>5 0.006
11. Firm Greatly Influenced By 0.628 0.383Main Customersfor R&D
8.23* 8.20* 7.15* 7.37* 5.50a 1,2,4,3>5 0.0007
Main Customersfor Products &Techn. Used
7.46* 7.96* 7.10 6.18 5.75a 2>4,5;1>5 0.02
Main Customersre: Promotion &Distribution ofNew Project
6.23 7.56* 5.57a 6.00 4.75a 2>3,5 0.008
12. Market Condition 0.633 0.273Stable Markets 6.00* 4.04a 4.78a 3.75a 4.55 1>2,3,4 0.02
PredictableMarket
5.70* 3.44a 4.47 4.18 5.10 1>2 ns
Simple Market 5.56* 4.04a 4.05a 5.12 4.63 1>3,2 ns
13. Technology Conditions 0.828 0.6473StableTechnology
6.46* 4.12a 3.42a 4.37a 5.15 1,>4,2,3 0.001
PredictableTechnology
4.96* 3.52a 3.00b 4.31 4.75* 1>4,2,3; 5>3 0.03
SimpleTechnology
6.06* 4.80a 3.94a 4.75 4.55a 1>2,5,3 0.03
Dev. Time inMonths
13.7a 18.9* 8.7a 14.5 23.4* 5>1,3; 2>3 0.007 ns ns
Note: ** significantly (0.05 level) higher than other variable;* significantly higher than low value variable;a significantly lower than high value variables;b significantly lower than low value variable; andns means not significant.
Factor analysis was used to test/define all constructs. All constructs are uni-dimensional factors. Twovariables, ‘development time in months’ and ‘degree of newness of the product to the company’ are singlevariables. For more details see Duncan values.
Vol. 25, No. 1 Cooper & Kleinschmidt: NEW PRODUCT PERFORMANCE
– 45 –
Appendix BConstructing the Performance Map and Identifying the Groups of Projects—The Details
Factor analysis was used to reduce the 10 performance metrics to major underlying factors ordimensions. The method used was SPSSX factor analysis, principal components analysis withVarimax rotation. Three factors were selected on the basis of eignevalues>1.0 and the Scree test.These three factors form the X–, Y– and Z–axes of the Performance Map (fig. 2).
Next, the 110 projects were grouped into logical clusters on this Performance Map. Theclustering routine used was Quick Cluster, an SPSSX routine. This is an agglomerativehierarchical clustering method based on nearest centroid sorting: that is, a case is assigned to acluster for which the distance between the case and the centre of the cluster (the centroid) is thesmallest.
The cluster analysis solution proved to be a very robust one. One-way ANOVAs of theperformance metrics across the five groups were significant at the 0.001 level. Additionally, fivegroup discriminant analysis was used to validate the cluster analysis solution, which correctlyclassified 92% of the cases. Finally, the Jackknife method yielded an 89% correctly classifiedvalidation result.
Appendix CComparing the International Study to the Australian Results
To compare the two studies, we redid the analysis of the Australian data, but used only thoseperformance measures used in the international study (exactly the same variables). The result wasa two-dimensional performance map, instead of three.
How did projects shift when we used two performance factors instead of three to undertakethe cluster analysis? Moving from two-dimensions to three-dimensions:
• Of the 23 projects in the Big Loser cluster on the two-dimensional map, the great majority(73.9%) remain as Dogs when a third dimension is included;
• Of the 17 projects in the Slow Success cluster (see the two-dimensional map), more thanthree-quarters (76.5%) are found in the new cluster occupying the same position, namelySteady Winners, on the three-dimensional map;
• Almost all the Fast Dogs (85.6%) on the two-dimensional map remain in the new cluster,Efficient Failures, on the three-dimensional map;
• Of 25 Star projects on the two-dimensional map, half are found in the new Star cluster andhalf in the Steady Winners—a rather logical split, given the introduction of the thirddimension; and
• The 31 Fast Hit projects also split—roughly half went to the new Star cluster, the other halfto the Close-to-Home cluster.

AUSTRALIAN JOURNAL OF MANAGEMENT June 2000
– 46 –