Live at The David Grisman Quartet with Svend Asmussen HI ...


PROJECT DEVELOPMENT DEPARTMENT
Morten ChristiansenDepartment Director
Rena ChenInvestment Officer
Bjørn JakobsenHead of Secretariat
Jens RixenSenior Legal Adviser
Michael HedegaardInvestment Officer
Erik LarssonInvestment Officer
Michael Wedel SørensenEnvironmental Adviser
Søren HeilmannSystem Administrator (IT)
Bente LarsenChief Librarian
Torben KjærInvestment Officer
EXECUTIVE BOARD
Sven RiskærManaging Director
Jørgen Dan JensenDeputy Managing Director *(Until 30 April 2003)
Frank Norman LarsenDeputy Managing Director
Niels Gravgaard LaursenDepartment Director
Lone Bjørn HansenChief Accountant
Max KruseSenior Investment Officer
INVESTMENT MANAGEMENT DEPARTMENT
Torben HussDepartment Director
Brian M. AndersenInvestment Officer
Jens BayerSenior Investment Officer
Malene K. KristensenInvestment Officer
Martin M. KristensenSenior Investment Officer
Tatiana M. ManzonInvestment Officer
Hans-Jørgen NyegaardInvestment Officer
Manish MaheshwariInvestment Officer
Peer MunkholtSenior Investment Officer
Svend J. HeinekeDepartment Director
Steen LarsenInvestment Officer
Jørn Fredsgaard SørensenInvestment Officer
Henrik JepsenDepartment Director
SECRETARIAT COMM./INFO/SERVICE UNIT LEGAL UNIT ENVIRONMENTAL UNIT IT UNIT
Kenneth KristiansenSystem Administrator (IT)
Morten K. JensenFinance Officer
ADVISERS
Mike Benn Pretoria, South Africa
Riyaz BokhariLahore, Pakistan
Nigel BremnerNairobi, Kenya
Roberto FernandezMontevideo, Uruguay
Uffe Bundgaard-JørgensenDenmark (Facilitator)
Meriç GemayelIstanbul, Turkey
Jens Lage HansenCuritiba, Brazil
Bjarne Rørbæk JensenSão Paulo, Brazil
Henrik de JonquièresDenmark (Facilitator)
Peter KilianMexico City, Mexico
Jens KronborgSantiago de Chile, Chile
Claus E. MadsenBuenos Aires, Argentina
Vipin MalikNew Delhi, India
Stephen PotterLondon, United Kingdom
Tonny Bech PedersenDenmark
Mikael OlufsenDenmark (Facilitator)
Peter RasmussenSuzhou, China (Facilitator)
José M. RuisánchezWashington D.C., USA
Poul WeberBangkok, Thailand
BEIJING, CHINA
Martin RømerInvestment Officer
Ib AlbertsenSenior Regional Co-ordinator(Asia)
Kesavan NarayananInvestment Officer
Lucien WangBeijing, China
Sudhir DravidInvestment Officer
Deepa HingoraniResident Representative
Armando MartinezMexico City, Mexico
Niels EvendtResident Representative
JOHANNESBURG, SOUTH AFRICA
IFU OFFICES
Elisabeth ScheinemannInvestment Officer
Natalia SvejgaardInvestment Officer
Henning WongInvestment Officer
Birgitte Christensen Chief Archivist
ARCHIVES
Tayengwa MasawiInvestment Officer
Hong JiangResident Representative
Manmohan MalhotraIT-officer
Jan E. Ditlevsen Denmark (Facilitator)
Paul CardwellSan José, Costa Rica
Hemming JørgensenLuxemburg (Facilitator)
Faridah Abdul KadirSelangor, Malaysia
Gerrie Muller Sandton, South Africa (Facilitator)
Sridhar SampathChennai (Madras), India
Bendt StarupSingapore (Facilitator)
Farouk NasserCairo, Egypt
Per E. L. OlsenSenior Regional Adviser
ADVISER OFFICES
Kodjo AziagbéSenior Regional Adviser
LOMÉ, TOGO SÃO PAULO, BRAZIL
Johannes Huus BoghDenmark
*As of 1 May 2003, Senior Adviser to IFU
CORPORATE ADMINISTRATION DEPARTMENT
SPECIAL OPERATIONS DEPARTMENT
FINANCE DEPARTMENT
SUPERVISORY BOARDJohannes Poulsen (Chairman)Agnete Raaschou-Nielsen (Deputy Chairman)Lars AndersenSigurd Ø. AndersenElsebeth Budolfsen Lars Kolte Kjeld Ranum Michael Rasmussen Carsten Staur Karen Wermuth
EXECUTIVE BOARDSven Riskær (Managing Director)Jørgen Dan Jensen (Deputy Managing Director)Frank Norman Larsen (Deputy Managing Director)
COMPANY AUDITORSDeloitte & Touche Statsautoriseret Revisionsaktieselskab
IFU THE INDUSTRIALIZATION FUND FOR DEVELOPING COUNTRIES
BREMERHOLM 4 DK-1069 COPENHAGEN K DENMARK TEL +45 33 63 75 00 FAX +45 33 32 25 24 [email protected] WWW.IFU.DK
NEW DELHI, INDIA

3
CONTENTS
Statement by the Management on the Annual Report 4
Auditor’s Report 5
The Management’s Review 6
Accounting Policies 18
Income Statement for 2002 23
Balance Sheet at 31 December 2002 24
Cash Flow Statement for 2002 25
Notes 26
The Supervisory Board 30
Foreign Direct Investments Combat Poverty 32
Review: High Productivity and Good Results 34
Co-operation with IFU – Why and How 36
IFU – Resources 43
Investment Portfolio 46
Organisation and Staff 55
Georg Jensen, Danish partner in project for production of jewellery in Thailand

4
STATEMENT BY THEMANAGEMENT ON THE ANNUAL REPORT
THE EXECUTIVE BOARD:Sven Riskær, Managing DirectorJørgen Dan Jensen, Deputy Managing DirectorFrank Norman Larsen, Deputy Managing Director
We have today presented IFU’s annual report for the year 2002.
The annual report has been presented in accordance with the Danish Financial Statements Act. We consider
the accounting policies applied in this annual report appropriate in providing a true and fair view of the Fund’s
assets, equity and liabilities, financial position, the results and cash flows.
THE SUPERVISORY BOARD:Johannes Poulsen, ChairmanAgnete Raaschou-Nielsen, Deputy ChairmanLars AndersenSigurd Ø. AndersenElsebeth BudolfsenLars KolteKjeld RanumMichael RasmussenCarsten StaurKaren Wermuth

5
TO THE SUPERVISORY BOARD OF IFU
We have audited the annual report ofIFU for the financial year ended 31 De-cember 2002, pages 6-29.The annual report is the responsibilityof the Fund’s Supervisory Board andthe Executive Board. Our responsibilityis to express an opinion on the annualreport, pages 6–29, based on our audit.
BASIS OF OPINIONWe conducted our audit in accordancewith Danish Auditing Standards. Thosestandards require that we plan and per-form the audit to obtain reasonable as-surance that the annual report is free ofmaterial misstatement. An audit in-cludes examining, on a test basis, evi-dence supporting the amounts and dis-closures in the annual report. An auditalso includes assessing the accountingpolicies used and significant estimatesmade by the Supervisory Board and theExecutive Board, as well as evalu-ating the overall annual report presenta-
tion. We believe that our audit providesa reasonable basis for our opinion. Our audit has not resulted in any quali-fication.
OPINIONIn our opinion, the annual report givesa true and fair view of the Fund’s finan-cial position at 31 December 2002 andof the results of its operations and itscash flows for the financial year thenended in accordance with the DanishFinancial Statements Act.
Hellerup, 20 March 2003
Deloitte & ToucheStatsautoriseret Revisionsaktieselskab
Torgny PahleState Authorised Public Accountant
Morten S. RengeState Authorised Public Accountant
AUDITORS’ REPORT

6
DKKm 2002 2001 2000 1999 1998
● INCOME STATEMENT
Dividends and interest income from projects 99 87 80 55 33
Value adjustments (114) (81) (86) (26) (59)
Other expenses related to projects (5) (1) (5) (5) (5)
Gross contribution from projects (19) 5 (11) 24 (31)
Operating expenses, net (34) (34) (32) (31) (33)
Financial income, net 72 49 58 23 44
Net income for the year 19 20 15 15 (20)
● BALANCE SHEET 31 DECEMBER
Investments in projects, net1 939 1,063 1,067 854 791
Funds committed to projects 505 539 468 623 357
Total balance 2,088 2,094 1,940 1,797 1,622
Total equity capital 2,027 2,008 1,861 1,696 1,530
● CASH FLOW STATEMENT
Operating activities 104 106 92 41 39
Investing activities (103) (15) (179) (201) (130)
Financing activities (23) (25) 135 167 151
● ADDITIONAL DATA
New projects contracted (no.) 25 25 22 24 27
Exited projects (no.) 25 20 21 31 17
Portfolio of projects (no.) 212 212 207 206 213
Investments contracted 359 351 521 427 177
Share capital investments in projects at cost 1,197 1,096 1,041 930 953
Project loans at cost 637 743 837 580 445
Total investment in projects at cost 1,834 1,839 1,878 1,511 1,398
Accumulated value adjustments (894) (776) (811) (657) (607)1Investments in projects, net 939 1,063 1,067 854 791
THE MANAGEMENT’S REVIEW
FINANCIAL HIGHLIGHTS

7
The financial highlights have been restated for 2002 and 2001 as a consequence of thechanges in accounting policies effected in 2002. For 1998 - 2000, the reserves against losses have been booked against the project assetswhen calculating the total balance, and actual income from sale of shares have been reclassified to value adjustments in the income statement.
2002 2001 2000 1999 1998
● KEY RATIOS
Gross contribution from projects/Investment
in projects, net -2.04% 0.44% -1.06% 2.79% -3.91%
Net income for the year/Average
total equity capital 0.94% 1.05% 0.84% 0.96% -1.39%
Operating expenses, net/Average
investment in projects at cost 1.87% 1.81% 1.90% 2.14% 2.37%
Total equity capital/Total assets 97.09% 95.91% 95.91% 94.36% 94.36%
Accumulated value adjustments/Investment
in projects at cost -48.77% -42.21% -43.18% -43.49% -43.42%
Investments contracted/New projects
contracted (no.) 14.372 14.040 23.682 17.792 6.556
Total investment in projects at cost/Portfolio
of projects (no.) 8.649 8.673 9.073 7.333 6.563
Average number of fulltime employees 81 78 80 78 78

8
For the purpose of promoting economic activity in de-
veloping countries, IFU has been created to promote in-
vestments in these countries in collaboration with Da-
nish trade and industry.
The Danish Parliament, June 7, 1967:
The Act on International Development Co-operation
MAIN ACTIVITIESIFU is part of the range of official Danish activities with theoverall purpose of promoting economic and social progressin the developing countries.IFU is an independent, self-governing entity, limited in its li-ability to the extent of its net worth only. The Danish Mini-ster of Foreign Affairs appoints the Supervisory Board andthe Managing Director. The Fund operates in accordancewith business principles with a strong commitment to goodcorporate governance, high environmental standards and so-cial responsibility.IFU provides advisory services, share capital participation,loans and guarantees on commercial terms for investmentsin production or service companies in developing countries.The Fund’s revenues are generated by interests, dividendsand profits from the sale of shares.By collaborating with IFU, the partners, in addition to fi-nancing, gain access to IFU’s knowledge accumulatedthrough 35 years, and to an extensive network of advisersand contacts.
TOTAL EQUITY CAPITAL DKK 2,027.0m EUR 273.0m
Number of investments since the establishment 474
Number of countries in which IFU has invested 71
MAIN FEATURES AT 31 DECEMBER 2002

9
ECONOMIC SLOW-DOWN2002 was affected by lower economicgrowth in the leading economies char-acterised by declining company re-venues and fluctuating share prices.This had a significant impact in LatinAmerica and in a number of Asiancountries. The negative impact wasstrongest in the countries who primar-ily export to the Western countries. Astabilising factor was China. Here, thegrowth in Gross Domestic Product(GDP) has been 7–8 per cent for seve-ral years, and it appeared unchangedin 2002. India also managed to stayrelatively unaffected by the globaltrend. In Africa, the year was markedby the effect of internal conflicts andthe negative spiral caused by the un-stable political situation in some coun-tries. The present global uncertainty follow-ing the terrorist attack against the USAon 11 September 2001 and the cur-rent situation in Iraq is reducing thepotential interest from Danish compa-nies in initiating investments abroad.Preliminary calculations of the volumeof global Foreign Direct Investments
indicate a continuation at the level of2001, when investments in developingcountries dropped by 14 per cent to atotal of approximately USD 200bn.The investments are concentrated inrelatively few countries, with China asthe leading recipient, while the sharegoing to African countries is small.
SOUND DANISH ECONOMYThe Danish economy did well through-out 2002 and maintained a surplus onboth the public accounts and the bal-ance of payments. In 2002 projections that Denmark willhave a shortage of manpower in thelong term were widely proclaimed.These projections are mainly based ona projection of current demographicdevelopment. The risk of manpowershortage combined with high wage lev-els are now factors mentioned by busi-ness leaders as reasons for reallocatingthe labour intensive part of their pro-duction to countries with an ampleworkforce in order to remain competi-tive in the years to come. IFU will playan active role in this process in closeco-operation with Danish companies.
DEVELOPMENT IN IFU’S AREA OF ACTIVITY

10
In IFU’s 2001 Annual Report, a some-what lower level of activity was pre-dicted for 2002 as a result of the inter-national recession. The number of in-vestments in new projects remained thesame, while a slight increaseappeared inthe amount of IFU’s total investments.The total investments in new and exist-ing projects in 2002 were DKK359.3m.The investments in new projects wentto 15 countries. A relatively large num-ber was made in countries or regionsthat are among the poorest in the world,and where there is an urgent need fordevelopment, such as Bangladesh,Ethiopia, Mozambique and Vietnam.Furthermore, new project investmentswere made in Algeria, Côte d’Ivoire,South Africa, the Philippines,Malaysia, the Maldives, Turkey andMexico.The number of new projects in Chinaand India, which is usually relativelyhigh, decreased to 4 from 9 in 2001.IFU’s average investment of share cap-ital and loans in the new projects wasDKK 11m. Half of the new projectswere made in co-operation with smallDanish partners with less than 50 em-ployees.IFU’s result for 2002 was a profit ofDKK 18.9m compared to a profit ofDKK 20.3m in 2001. Compared to2001, the result for 2002 is positivelyimpacted by a higher amount of divi-dends from projects and a higher net fi-nancial income. On the other hand, in-
terest income from projects was lowerin 2002 due primarily to the steady re-duction in interest rates in 2002.Value adjustments in 2002 comparedto 2001 reflect a large relative im-provement in the contribution fromIFU’s share capital investments. But atthe same time a large negative contri-bution from exchange rate adjustmentson the non-hedged part of IFU’s loanportfolio due primarily to the deprecia-tion of the USD against DKK in 2002.Value adjustments as general provisionsagainst losses are automatically madeat the time of disbursement at a ratewhich should match – as an average –expected future losses. After threeyears, all general value adjustments areeither credited back or replaced by spe-cific value adjustments on a project byproject basis.IFU’s project investments are located indeveloping countries experiencing tur-bulent political and economic condi-tions from time to time. Further, IFU’sinvestments take place in projects hav-ing a high commercial risk. This meansthat the fair value of the investmentsby nature is difficult to measure withaccuracy, and that is furthermore sub-ject to significant fluctuations as re-flected in IFU’s results from year toyear.Other disturbing factors of importance forIFU’s result are fluctuations in foreigncurrency exchange rates and fluctua-tions in interest rate on project loansand on liquid funds.As a consequence of the adoption of thenew Danish Financial Statements Act,IFU’s accounting policies have beenchanged in a number of material areas.Overall, these changes represent a de-crease of the profit for 2002 of DKK12.3m as well as a total increase ofDKK 123.6m in the equity at 31 De-cember 2002. Each change and theoverall effect thereof are described un-der accounting policies.
RESULTS FOR

11
Number of investments in new projects 25
Number of additional financing of existing projects 8
New projects IFU’s investments DKK 280.9m EUR 37.8m
Total investments DKK 943.9m EUR 127.1m
IFU’s investments in new and existing projects DKK 359.3m EUR 48.4m
Disbursement of share capital and loans DKK 245.4m EUR 33.1m
IFU’s equity capital at year ending 31.12.02 DKK 2,027.0m EUR 273.0m
Year end result DKK 18.9m EUR 2.5m
Estimated Danish exports generated from the investments DKK 214.0m EUR 28.8m
Estimated employment effect in Denmark of this export 428
Estimated job creation in host countries 1,948

12
INVESTMENTS CONTRACTED IN 2002
NEW PROJECTS Expectedemployment
Project name Country Shares* Loans** Total (persons)
IFU’S INVESTMENT (million DKK)
Project name Country Shares* Loans** Total
1 Aviation Assistance Alger Algeria 6.8 6.8 652 Dahetra Bangladesh Bangladesh 2.3 2.3 453 Rosti China China 21.5 21.5 2004 DISA China China 10.0 10.0 1505 Finamark Côte d'Ivoire 11.1 11.1 1956 African Lakes Ethiopia Ethiopia 4.0 4.0 507 KE Burgmann India India 3.4 3.4 338 Indan Energy Pvt India 0.7 0.9 1.6 29 Fibertex Nonwovens Malaysia 75.0 75.0 95
10 Aalborg RCI White Cement Malaysia 85.5 85.5 14311 Skim Coat Industries Malaysia Indirect 0.0 2712 SCI Marketing Malaysia Indirect 0.0 313 Aalborg RCI Resources Malaysia Indirect 0.0 2214 RCI Marketing Malaysia Indirect 0.0 1115 Island Beverages Maldives Maldives Indirect 0.0 1516 GLL Mexico Mexico 13.2 13.2 8117 Nyati Beach Lodge Mozambique 4.0 4.0 2418 Aalborg White (Philipp.) Philippines Indirect 0.0 219 Danline Bathroomware South Africa 0.2 0.6 0.8 520 Caretex Thailand 1.0 1.0 11621 Georg Jensen Thailand Thailand 20.0 20.0 45022 Radisson SAS Macka Hotel Turkey 19.7 19.7 123 Macka Ótelcilik A.S. Turkey Indirect 0.0 16824 Orana Vietnam Vietnam 1.0 1.0 2525 Watertech Vietnam Vietnam 0.2 0.2 20
TOTAL 208.1 72.8 280.9 1,948
26 AMSCO Africa (Reg.) 3.7 3.727 Hartmann-Mapol Brazil 2.9 2.928 Caribersa Brazil 0.2 0.229 Shanghai Dansk China 0.5 0.530 Schrøder Plast China 2.0 2.031 RadissonSAS Quseir Resort Egypt 22.3 22.332 Kampsax India India 9.7 9.733 Rosti de Mexico Mexico 37.1 37.1
TOTAL 6.6 71.8 78.4
GRAND TOTAL 214.7 144.6 359.3
*) incl. overrun commitments **) incl. guarantees
FURTHER FINANCING OF ONGOING PROJECTS
24 PROJECTS WERE EXITED IN 2002

13
KNOWLEDGE AND HUMAN RESOURCES
IFU embarked on a major organisational re-structuring from 1 January 2002. The geo-graphical grouping of the staff was replacedby a project process oriented grouping.The overall aim is to strengthen the effi-ciency and effectiveness of work in order toachieve higher quality in the Fund’s projectportfolio and in general financial results.Important elements are ongoing adjust-ments to external demands by optimalcombinations of available human resourcesinto expert teams according to the specificneeds of the individual project.The country-specific expertise is alsostrengthened through a more systematic as-signment of tasks to IFU’s offices abroadbeing closer to the projects with IFU parti-cipation and at the same time a continuedexpansion of the adviser network and usehereof.The organisational change was an opportu-nity to rationalise a number of functionsand routines.Knowledge is one of IFU’s material assets.Therefore emphasis has been placed onmaintaining and developing this resource.IFU’s knowledge is mostly embedded in thestaff in Copenhagen, the offices abroad andwith the network of advisers. Therefore, it isimportant to maintain and continuously de-velop the staff and to adjust the framework sothat the acquired skills can be utilised in thebest possible way in the day-to-day work tothe benefit of projects with IFU participation.
Within the new structure, teams are createdon an ad hoc basis. This has significantlyimproved the exchange of informationamong staff members – as well as with ex-ternal advisers. The year 2002 was markedby intensive activity within supplementarytraining, internally as well as externally.The entire staff of the Funds (IFV, IFU andIØ) was in 2002 convened to attend a oneand a half day seminar in Copenhagen. Thisprovided a good opportunity for consolidat-ing a common team spirit.Since the beginning of 1993, a total of 11trainees engaged by IFU or its sister Funds(IØ and IFV) have completed or are in theprocess of completing a MBA Degree at theScandinavian International ManagementInstitute (SIMI) in Copenhagen. In relationto IFU, three came from India, two fromChina, two from Zimbabwe and one fromVietnam. During the study period, thetrainees work part-time at IFU’s office inCopenhagen and are often offered a posi-tion with one of IFU’s offices abroad oncetheir studies are completed.IFU trains not only its own employees, buthas also initiated leadership seminars forboard members and managers of projectcompanies. In 2002 such a seminar wasimplemented in India. The participants re-ceived an in-depth explanation of theirrights and duties as board members and asmanagers, and issues of current interestwere also dealt with.
Client Seminar, India 2002Staff Seminar, Copenhagen 2002

14
In 2002 IFU opened an office in Johannesburg, SouthAfrica. The area of activities of this office is the entire south-ern region of Africa. At the same time activities have ceasedin IFU’s office in Harare, Zimbabwe, as a consequence of thenegative development and low level of new investments.The offices in New Delhi, India, and Beijing, China, wereboth enhanced and thereby enabled to take over severaltasks from the head office in Copenhagen.To strengthen IFU’s ability to service its projects and its cus-tomers, the offices of the local advisers in Lomé, Togo, andSão Paulo, Brazil, were upgraded to Adviser Offices coveringWest Africa and South America, respectively. This meant ahigher degree of integration of these offices into IFU’s or-ganisational structure enabling these offices to carry outtasks similar to those of the other offices abroad.The adviser network was further expanded in order to allowIFU to better assist its customers in relation to the estab-lishing of new projects and to the monitoring of existing pro-jects. At year end, 30 advisers in 20 countries were connected withthe Fund compared to 25 advisers the year before.
IFU is the fund manager for its sister Funds IØ and IFV,which operate in Central and Eastern Europe and the emerg-ing markets, respectively. The total number of permanentstaff at the end of 2002 was 81.
The average age of the staff was 41 years, and the averageseniority was 8.3 years.
FACTS ABOUT THE STAFF
OFFICES ABROAD ANDADVISER NETWORK
53% Female 47% Male
77% Employed at the head office 23% Outside DK

15
IFU administers a Fund for environ-mental improvements and staff trainingin the project companies. An allocationin 1998 to the Fund of DKK 15m fromthe Danish International DevelopmentAssistance, Danida, was exhausted in2002, and a new allocation wasgranted. A review of the Fund was car-ried out in 2002. It showed that more
than 1,000 employees from IFU’s pro-ject companies in countries with aGross National Product per capita be-low USD 2,500 will have received train-ing, when all programmes having re-ceived commitments under the formerallocations have been implemented.Demand for these funds continues at ahigh level.
DANIDA ENVIRONMENT AND TRAINING FUND
In 2001 IFU carried out its first in-house environmental impact and occu-pational health and safety (OHS) as-sessment of the projects co-financed byIFU. The new account made at the turnof the year 2002–03 included 151 pro-jects. The remaining 61 projects inIFU’s portfolio were at the time either inthe process of being implemented orterminated and were therefore not in-cluded.The primary purpose of the assessmentis to identify projects and areas wherespecial efforts towards improvementsmay be called for.As in 2001, the 2002 assessment waspositive. In both areas (external envi-ronment and OHS), all of the projectsobtained classifications ranging from“fair” to “excellent”.The “fair” classification is the accept-able starting point. To improve thescore, the company will have to showclear indications of good performance.On the other hand, projects are classi-fied “poor” or “critical” if some condi-tions are unsatisfactory, or if they havenot been reported.
IFU continued in 2002 to review theperformance of the project companieswith regard to all major human rightsresolutions and such ILO core conven-tions as protection against child labourand forced labour, equal remunerationfor men and women, freedom of associ-ation, the right to collective bargaining,
ENVIRONMENT, OCCUPATIONAL HEALTH AND SAFETY AND CORPORATE GOVERNANCE
ENVIRONMENTAL IMPACT
OCCUPATIONAL HEALTH AND SAFETY
● Critical● Poor● Fair● Good● Excellent

16
From the perspective of a long-term in-vestor in developing countries, like IFU,the medium- to long-term perspectivelooks challenging and – short of a severeglobal recession – fairly optimistic. Whileinvestments in developing countries forsome decades have mainly focused onaccess to markets and raw materials, in-creasingly the relocation of labour inten-sive production from high-cost areas tocompetitive developing countries is themain driver for the global investmentflow. A trend which will be further en-hanced as the WTO begins to signifi-cantly contribute to opening up the“Global Market”.This implies that globalisation and in-vestments into developing countries foran increasing number of companies inindustrialised countries such as Den-mark will become a necessity rather thanmerely an opportunity. Their ability to re-main cost competitive will increasingly
depend on their ability to globalise theirproduction, and the ensuing investmentflow towards developing countries islikely to keep investment funds like IFUbusy for quite a number of years to come.Already today, the slow economic pace inindustrialised countries creates increas-ing pressure for enhanced competitive-ness on many Danish enterprises, andthis in IFU’s view explains the relativelystable demand for IFU’s advice and fi-nancing to projects in developing coun-tries. Furthermore, this will also implythat the present albeit modest profitabil-ity in IFU’s investment portfolio can beexpected to be maintained with a solidpotential for improvement once the glo-bal economic recovery takes off.Considering the depressed outlook forthe global economy and a historically lowinterest rate, a somewhat lower net resultis expected in 2003 than realised in2002.
No events have occurred between thebalance sheet date and this date, that
could materially influence the evalua-tion of this annual report.
EVENTS AFTER THE BALANCE SHEET DATE
OUTLOOK FOR 2003
or whether alternative consultative pro-cedures have been established betweenmanagement and employees. The re-view further looked at whether the pro-ject company paid wages that met thelegal minimum, and whether its majorsuppliers complied with certain rules. Italso tried to verify that the project com-pany operated in an accountable man-ner in its business transactions (goodcorporate practice).
Of the 150 companies so far covered bythe review, only one was classified as“critical” and two companies wereclassified as having a “poor” perfor-mance. This immediately promptedIFU to address the matters of concern.In general, IFU in co-operation with itspartners is seeking continuously to fur-ther increase awareness of the environ-mental conditions as well as OHS con-ditions in the project companies.
● Critical● Poor● Fair● Good● Excellent
CORPORATE GOVERNANCE
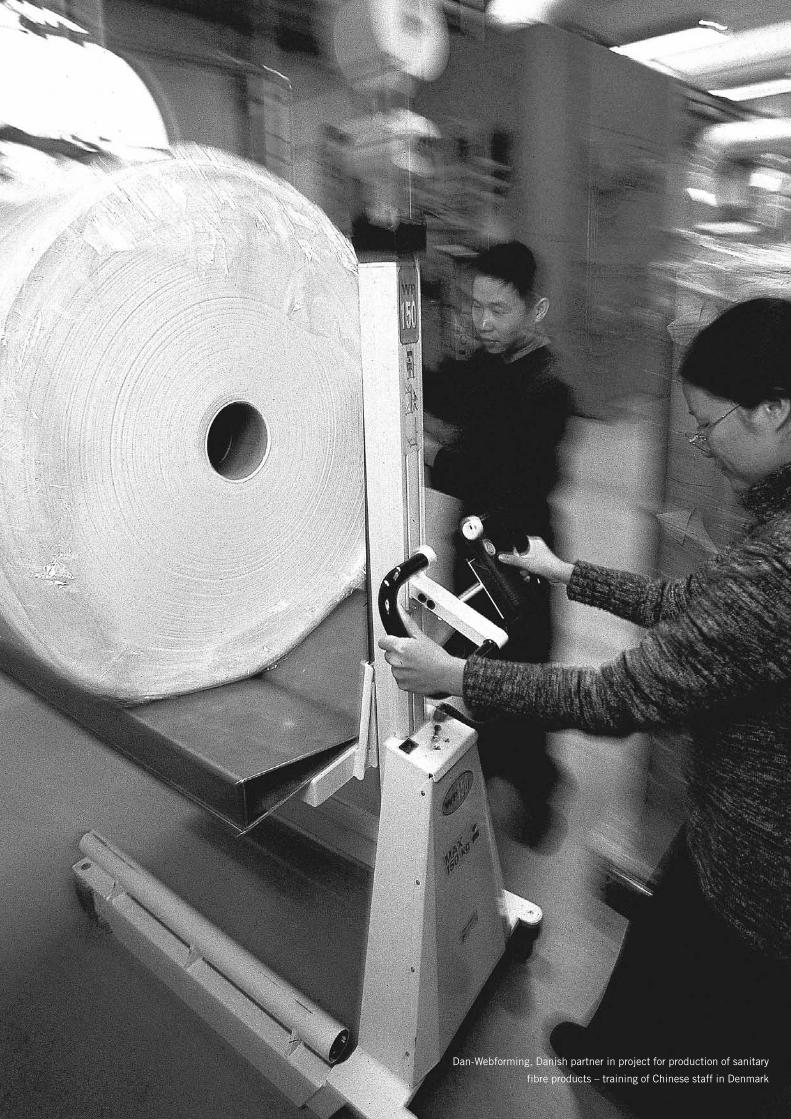
Dan-Webforming, Danish partner in project for production of sanitary
fibre products – training of Chinese staff in Denmark

18
This annual report has been prepared in accordance with the provisions of the Danish
Financial Statements Act governing reporting class C enterprises (large).
CHANGES IN ACCOUNTING POLICIESAs a consequence of the adoption of thenew Danish Financial Statements Act theaccounting policies have been changedas follows:
INTEREST INCOME RELATED TO PROJECTSInterest on loans to projects is accruedand recognised as income when earned.Formerly, interest was recognised as in-come at the time of payment, andcharged not-yet received interest was in-cluded directly in the balance sheet as in-terest receivable and reserves againstlosses.
INVESTMENTS IN PROJECTSShare capital investments in projects areafter initial recognition at cost adjustedto fair value. Value adjustments are re-cognised in the income statement. For-merly, share capital investments weremeasured at cost and provisions againstlosses were accounted for separately.Project loans are after initial recognitionat cost adjusted to fair value. Value ad-justments are recognised in the incomestatement. Formerly, project loans weremeasured at cost and provisions againstlosses including currency losses were ac-counted for separately.
DERIVATIVE FINANCIAL INSTRUMENTSDerivative financial instruments (forwardcontracts and swaps related to projectloans and receivables from sale of sharesdenominated in foreign currency) are ad-justed to fair value and recognised in thebalance sheet as other receivables orother payables. Assets hedged by suchinstruments are adjusted into DKK usingthe exchange rates at the balance sheetdate. Formerly, derivatives were notrecognised separately in the balancesheet, while hedged assets were adjustedinto DKK using the hedging rate.
FIXED ASSETS AND LEASEHOLD IMPROVEMENTSFixed assets and leasehold improvementsabove DKK 50,000 are measured in thebalance sheet at cost less accumulateddepreciation. Formerly all purchases andleasehold improvements were charged tothe income statement.Assets held under finances and related li-abilities are recognised in the balancesheet under fixed assets and leaseholdimprovements and long term debt or cur-rent liabilities, respectively. Formerly,these assets were not recognised in thebalance sheet, and the liabilities weredisclosed in a note.
ACCOUNTINGPOLICIES

19
Equity capial 01.01.2001 prior to adjustments 1,860,741,165Adjustment to Annual Account Act of 2001Value adjustments of share capital investments,project loans and derivatives 104,314,879Interest income from projects, net of value adjustments 27,616,475Other expenses related to projects, net of value adjustments (4,800,603)Total effect 127,130,751Adjusted equity capital as of 01.01.2001 1,987,871,916
Result 2001 prior to adjustments 11,514,388Adjustment to Annual Account Act of 2001Value adjustments of share capital investments, project loans and derivatives 4,127,693Interest income from projects, net of value adjustments 5,261,960Other expenses related to projects, net of value adjustments (1,072,771)Operating expenses, net 434,694Total effect 8,751,576Adjusted result 2001 20,265,964
Result 2002 prior to adjustments 31,155,719Adjustment to Annual Account Act of 2001Value adjustments of share capital investments, project loans and derivatives (5,101,261)Interest income from projects, net of value adjustments (7,002,185)Other expenses related to projects, net of value adjustments (198,502)Operating expenses, net 28,070Total effect (12,273,877)Adjusted result 2002 18,881,842
OTHER EXPENSES RELATED TO PROJECTSInterest on syndicated capital related toIFU’s loans to projects is recognised asexpense according to the accrual princi-ple. Formerly, interest on syndicated cap-ital was recognised as expense at thetime of payment by IFU (which was iden-tical to the time of IFU’s receipt of inter-est on the related project loans), and ac-crued not-yet paid interest on syndicatedcapital were included directly in the bal-ance sheet as current liabilities and a re-duction in reserves against losses.
PROVISIONS AGAINST LOSSESProvisions against losses are offset as valueadjustments against the related assets.Formerly, both assets and related provi-sions against losses were recognised sepa-rately as assets and liabilities, respectively.
CASH FLOW STATEMENTIn the cash flow statement bonds havebeen separated from cash.
COMPARATIVE FIGURESComparative figures and the financialhighlights shown on page 6 have been re-stated to reflect the changes in account-ing policies.
EFFECT OF CHANGES IN ACCOUNTING POLICIESThe aggregate effect of these changes inaccounting policies is a decrease ofT.DKK 12,274 on the profit for the year2002 and an accumulated increase ofthe equity capital at 31 December 2002of T.DKK 123,608.
The effect of the changes is specifiedbelow:
EFFECT OF CHANGES IN ACCOUNTING POLICIES

20
ACCOUNTING POLICIES IN GENERALRECOGNITION AND MEASUREMENTAssets are recognised in the balance sheet when it is proba-ble that future economic benefits will flow to the Fund, andprovided that the value of the assets can be measured reli-ably.Liabilities are recognised in the balance sheet when theFund has a legal or constructive obligation as a result of aprior event, and it is probable that future economic benefitswill flow out of the Fund, and the value of the liabilities canbe measured reliably.On initial recognition assets and liabilities are measured atcost. Measurement subsequent to initial recognition is ef-fected as described below for each item.Information brought to IFU’s attention before the time ofpresentation of the annual report that confirm or invalidateaffairs and conditions existing at the balance sheet date areconsidered at recognition and measurement.Income is recognised in the income statement when earned,whereas costs are recognised by the amounts attributable tothis financial year. Value adjustments of financial assets andliabilities are recorded in the income statement as value ad-justments.
FOREIGN CURRENCY ADJUSTMENTForeign currency transactions are initially recognised usingthe exchange rate at the transaction date. Loans, receiv-ables, payables and other monetary items denominated inforeign currencies that have not been settled at the balancesheet date are adjusted into DKK using the exchange rate atthe balance sheet date. Exchange rate adjustments thatarise between the rate at the transaction date, or the rate atthe balance sheet date, and the one in effect at the paymentdate are recognised in the income statement as value ad-justments, financial income or financial expenses.
DERIVATIVE FINANCIAL INSTRUMENTSIFU enters into forward exchange contracts and cross cur-rency swaps to hedge future transactions concerning se-lected foreign currency loans and receivables from sale ofshares.On initial recognition in the balance sheet, derivative finan-cial instruments are measured at cost and subsequently ad-justed to fair value. Derivative financial instruments arerecognised as other receivables or other payables.Changes in the fair value of derivative financial instrumentsclassified as and complying with the requirements for hedg-ing the fair value of a recognised asset or a recognised lia-bility are recorded in the income statement as value adjust-ments together with changes in the value of the hedged as-set or the hedged liability.

21
DIVIDENDS FROM PROJECTSDividends from projects net of with-holding taxes, if any, are recorded at thedate of declaration.
INTEREST INCOME RELATED TOPROJECTSInterest income on loans to projects areaccrued and recognised as they areearned.
VALUE ADJUSTMENTSAll adjustments to fair value on sharecapital, project loans, interest on pro-ject loans, dividends from projects andother project related receivables andpayables are recognised as value ad-justments, including exchange rate ad-justments and adjustments to actualresults from disposal of share capitalinvestments in projects.For disbursements to projects estab-lished within three years before the bal-ance sheet date, and where no valueadjustment is provided as specific pro-vision against losses, a value adjust-ment is provided as a general provisionagainst losses at a rate of 20 per cent ofcost for loans and 30 per cent of costfor share capital.
OTHER EXPENSES RELATED TOPROJECTSOther expenses related to projects com-prise interest expenses to syndicatedcapital, grants to projects and variousexpenses.
OPERATING EXPENSES, NETThe administration and accounting ofall together four funds/facilities aremanaged by IFU. At present this in-cludes IFU, The Investment Fund forCentral and Eastern Europe (IØ), TheEnvironmental Investment Facility forCentral and Eastern Europe (MIØ) andThe Investment Fund for Emerging Mar-kets (IFV). The total operating expenses,net of income related to operating activ-ities, incurred by IFU are divided atyear-end between IFU, IØ, MIØ and IFVaccording to an activity dependent ratio.
FINANCIAL INCOME AND EXPENSESFinancial income and expenses com-prise interest income on cash andbonds, realised and unrealised capitalgains and losses on bonds, interest ex-penses, exchange rate adjustments oncash and bank charges.
INCOME STATEMENT
SHARE CAPITAL INVESTMENT INPROJECTS, NETShare capital investments in projectcompanies are measured at fair value,i.e. net of or including value adjust-ments relative to cost.
PROJECT LOANS, NETLoans to project companies are mea-sured at fair value, i.e. net of or includ-ing value adjustments relative to cost.
FUNDS COMMITTED TO PROJECTSFunds, which on the balance sheet dateare committed to investments, are
shown as a part of the fixed assets andnot as cash or bonds.
FIXED ASSETS AND LEASEHOLD IMPROVEMENTSFixed assets and leasehold improve-ments are measured at cost less accu-mulated depreciation and impairmentlosses.Cost comprises the acquisition price,costs directly attributable to the acqui-sition, and preparation costs of the as-set until the time when it is ready to beput into operation. The basis of depreciation is cost less
BALANCE SHEET

22
estimated residual value after the endof useful life. Straight-line depreciationis made on the basis of an estimateduseful live of the fixed asset varyingfrom 3 to 5 years.Depreciation is recognised in the in-come statement under operating ex-penses, net.Fixed assets and leasehold improvementscosting less than DKK 50,000 per unitare recognised as costs in the incomestatement at the time of acquisition.For assets held under finance leasescost is the lower of present value of fu-ture lease payments and the asset's fairvalue.
OTHER RECEIVABLESOther receivables are measured at fairvalue. Included in other receivables areprepayments of costs relating to subse-quent financial years.
CASH AND BONDSThe major part of IFU’s liquid capital isinvested in an ad hoc mutual invest-ment fund set up in accordance withlaw on special mutual investment fundsNo. 476 of June 10, 1997. The mutualfund, established in co-ownership withIØ, MIØ and IFV as the only other in-vestors, may according to its invest-ment policy, as approved by the funds,only invest in publicly traded bonds de-nominated in DKK or EUR. The stated amounts of cash and bondsreflect IFU’s (pro rata) share of the un-derlying bonds and cash in the mutualfund. The bonds in the mutual fund arestated at the official prices quoted onthe balance sheet date except for called
bonds, which are stated at par value.Realised and unrealised gains or losseson bonds are recorded in the incomestatement.
PROVISION AGAINST LOSSESProvision against losses comprises an-ticipated losses related to guaranteeagreements.
SYNDICATED CAPITALSyndicated capital is investment capi-tal received from third parties and in-vested in projects on their account andrisk. Syndicated capital only becomesdue to the extent that IFU receives pay-ments from these projects. Syndicatedcapital is measured at fair value similarto share capital investments and loansinvested directly by the Fund.
LEASE COMMITMENTSLease commitments relating to assetsheld under finance leases are capi-talised and recognised in the balancesheet under long term debt or current li-abilities and are measured at amortisedcost, which usually corresponds tonominal value.
LONG TERM DEBTLong term debt is measured at amor-tised cost, which usually corresponds tonominal value.
CURRENT LIABILITIESCurrent liabilities include deferred in-come, which is comprised of receivedincome for recognition in subsequentfinancial years. Current liabilities aremeasured at fair value.
...BALANCE SHEET

23
CASH FLOW STATEMENT
The cash flow statement has been prepared in accordancewith the direct method and shows IFU’s cash flow from op-erating, investing and financing activities as well as IFU’scash position at the beginning and end of the year. Conse-quently, the cash flow statement cannot be directly recon-ciled to the income statement and the balance sheet. Cashcomprises cash at hand less short-term bank debt.
2002 2001DKK 1,000 DKK 1,000
NOTE
Dividends from projects 54,642 27,159 1/ Interest income and fees related to projects 44,455 59,916 2/ Value adjustments (113,636) (80,976)3/ Other expenses related to projects (4,645) (1,406)
GROSS CONTRIBUTION FROM PROJECTS (19,184) 4,693
4/ Operating expenses, net (34,316) (33,595)
OPERATING INCOME (LOSS) (53,500) (28,902)
5/ Financial income 78,191 52,631 5/ Financial expenses (5,810) (3,465)
NET INCOME FOR THE YEAR 18,881 20,264
The net income for the year has been transferred to the equity capital.
INCOME STATEMENT

24
2002 2001DKK 1,000 DKK 1,000
NOTEFIXED ASSETS 2002 2001
Share capital investment in projects at cost 1,196,810 1,095,980 Value adjustments (628,967) (588,185)
6/ Share capital investment in projects, net 567,843 507,795 Project loans at cost 636,841 742,605 Value adjustments (265,276) (187,836)
7/ Project loans, net 371,565 554,769 8/ Funds committed to projects 504,911 539,003 9/ Fixed assets and leasehold improvements 1,553 1,025
Total fixed assets 1,445,872 1,602,592
CURRENT ASSETS
Interest receivable related to projects 19,803 27,004 10/ Other receivables 30,773 33,15011/ Bonds 406,967 224,675
Cash 184,324 206,306
Total current assets 641,134 490,856
TOTAL ASSETS 2,087,739 2,093,727
ASSETS
2002 2001DKK 1,000 DKK 1,000
NOTEEQUITY CAPITALPaid-in capital beginning of year 1,050,936 1,050,936
12/ Accumulated reserves 976,081 957,200
Total equity capital 2,027,017 2,008,136
PROVISION AGAINST LOSSESGuarantees 15,047 11,834
13/ SYNDICATED CAPITAL 18,378 37,273
14/ LONG-TERM DEBT 12,865 12,558
Total provisions and long-term debt 46,290 61,665
15/ CURRENT LIABILITIES 14,432 23,926
Total liabilities 14,432 23,936
TOTAL EQUITY CAPITAL AND LIABILITIES 2,087,739 2,093,727
16/ AVAILABLE EQUITY CAPITAL AND CLEARANCES IN PRINCIPLE17/ CONTINGENT LIABILITIES18/ PLEDGED ASSETS
LIABILITIES AND EQUITY CAPITAL
BALANCE SHEET 31 DECEMBER

25
2002 2001DKK 1,000 DKK 1,000
NOTE
CASH FLOW FROM OPERATING ACTIVITIES
Dividends from projects received 52,459 27,931 Interest from projects received 43,146 60,575 Other project related payments (4,938) (2,299)Operating expenses, paid (34,194) (35,265)Financial income, net 47,433 54,671
Net cash from operating activities 103,906 105,613
CASH FLOW FROM (TO) INVESTING ACTIVITIES
Received from sale of shares 108,343 10,508 Received from project loans 157,659 212,588 Paid-in share capital in projects (182,542) (72,628)Disbursement of project loans (62,893) (87,942)Invested in bonds (123,186) (77,408)
Net cash from (to) investing activities (102,619) (14,882)
CASH FLOW FROM (TO) FINANCING ACTIVITIES
Proceeds from syndications related to projects 0 8,905 Repayment of syndications related to projects (23,269) (46,444)Refinancing from EIB (ECFI III Facility) 0 12,418
Net cash from (to) financing activities (23,269) (25,121)
NET CHANGE IN CASH (21,982) 65,610
CASH BEGINNING OF YEAR 206,306 140,696
CASH END OF YEAR 184,324 206,306
CASH FLOW STATEMENT

26
2002 2001DKK 1,000 DKK 1,000
1 Interest income and fees related to projectsInterest from project loans 41,135 57,988 Interest from receivables 1,314 1,767 Front-end fees 1,685 1,245 Guarantee commission 207 0 Other fees 114 (1,080)Grants for projects etc. 0 (4)
44,455 59,916
2 Value adjustmentsShare capital investments (note 6) (36,616) (111,628)Project loans (note 7) 9,671 27,829 Interest (646) (4,191)Guarantees (3,213) (583)Other (1,965) (635)Syndicated capital (5,789) (15,187)Exchange rate adjustments (99,962) 29,505 Derivatives 24,884 (6,086)
Value adjustments end of year (to income statement) (113,636) (80,976)
3 Other expenses related to projects
Interest expenses related to syndications 3,391 1,216Grants to projects 954 (4)Various expenses 300 194
4,645 1,4064 Operating expenses, net
ExpensesSalaries, Head office 30,478 28,985 Rental expenses 3,522 3,301 Travelling expenses 4,595 4,563 Regional office expenses 12,833 11,835 Fees for board of directors 1,270 1,241 Fees for external assistance 7,673 7,532 IT expenses 3,734 4,955 Office expenses 1,950 2,101 Depreciation of fixed assets and leasehold improvements (note 9) 380 75 Various expenses 3,081 3,015 Total expenses 69,516 67,603
Income
Management fees (542) (1,189)Board member fees, net of tax (575) (734)Various income (421) (636)Total income (1,538) (2,559)
Total operating expenses, net 67,978 65,044
Operating expenses, net charged to IØ (26,039) (23,743)Operating expenses, net charged to MIØ (5,888) (5,806)Operating expenses, net charged to IFV (1,735) (1,900)
IFU's part of operating expenses, net 34,316 33,595
Fee to the auditor of the funds included in "Fees for external assistance" and "Various expenses": 1,264 833
- Hereof audit fees 701 674 - Hereof non-audit fees 564 160
Specification of personnel expenses (salaries etc.)
Salaries, remunerations etc. 34,487 33,789 Pension contributions 3,180 3,115 Other expenses for social security 126 104
Personnel expenses in total 37,793 37,008
Total remuneration to the board of directors and management 4,429 4,328
Average number of employees, Head office 63 60 Average number of employees, Regional offices 18 18
81 78
NOTES

27
NOTES CONTINUED2002 2001
DKK 1,000 DKK 1,000
5 Financial income and expenses
Financial income
Interest income, cash and bonds 53,479 48,066 Gain on bonds 24,712 4,565
Financial income 78,191 52,631
Financial expenses
Interest expenses, bank charges and exchange rate adjustments (5,810) (3,465)
Financial expenses (5,810) (3,465)
Financial income and expenses 72,381 49,166
6 Share capital investment in projects, net
Share capital investment in projects at cost beginning of year 1,095,980 1,041,126 Paid-in share capital in projects during the year 182,542 72,628 Cost of shares sold during the year (48,794) (8,345)Write offs at cost during the year (32,918) (9,429)
Share capital investment in projects at cost end of year 1,196,810 1,095,980
Value adjustment beginning of year (588,185) (485,851)Write-offs *) 32,918 9,429 Income from sale of shares *) (37,084) (135)Value adjustments during the year (note 2) (36,616) (111,628)
Value adjustment end of year (628,967) (588,185)
Share capital investment in projects, net end of year 567,843 507,795
*) Stated relative to historical cost. Reversal of existing value adjustments, if any, at the time of these transactions are shown as value adjustments.
7 Project loans, net
Project loans at cost beginning of year 742,605 836,953 Disbursements during the year 62,893 87,942 Repayments during the year (157,659) (212,588)Exchange rate adjustments during the year relative to cost 5,406 35,522 Project loans transferred to other receivables during the year (3,930 (420)Write-offs at cost during the year (12,474) (4,804)
Project loans at cost end of year 636,841 742,605
Accumulated value adjustments beginning of year (187,836) (211,438)Write-offs *) 12,474 4,804 Exchange rate adjustments relative to cost (99,585) (9,031)Value adjustments during the year (note 3) 9,671 27,829
Accumulated value adjustments end of year (265,276) (187,836)
Project loans, net end of year 371,565 554,769
Accumulated value adjustments end of year are comprised of:Exchange rate adjustments relative to cost (40,143) 59,442 Value adjustments excl. exchange rate adjustment (225,133) (247,278)
(265,276) (187,836)
*) Stated relative to historical cost. Reversal of existing value adjustments, if any, at the time of these transactions are shown as value adjustments.

28
2002 2001DKK 1,000 DKK 1,000
8 Funds committed to projects
Funds at an amount equivalent to undisbursed contractual commitments allocated for investments are shown on the balance sheet as part of the project assets.
Amounts payable on project agreements 292,831 252,793 Guarantees 26,630 30,817 Binding commitments 185,450 255,393
Funds committed to projects 504,911 539,003
9 Fixed assets and leasehold improvements
Cost beginning of year 1,100 0 Additions during the year 908 1,100
Cost end of year 2,008 1,100
Depreciation beginning of year 75 0 Depreciation for the year (note 5) 380 75
Depreciation end of year 455 75
Book value end of year 1,553 1,025
The carrying amount end of year includes:Recognised leased assets 790 189
10 Other receivablesDividends receivables 1,272 124 Receivables from sale of shares etc. 8,314 31,117 Receivables from sale of loan etc. 4,155 420 Receivable front end fees 1,192 348 Other project related receivables 126 0
15,059 32,009Value adjustments (5,214) (1,643)
9,845 30,366
Derivatives *) 14,951 0Administrative receivables 5,402 1,910 Current accounts 0 230 Rental deposits 575 644
30,773 33,150
*) Stated amount concerns a hedged amount of USD 17.3m with term from 2003 to 2007.
11 Bonds
Listed bonds 893,396 747,259 Accrued interest receivables from bonds 18,482 16,419
Bonds end of year 911,878 763,678
Transferred to funds committed to projects (504,911) (539,003)
Bonds end of year 406,967 224,675
12 Accumulated reservesAccumulated reserves beginning of year 957,200 809,806 Effect of changes in accounting policies 127,130 Net income for the year 18,881 20,264
Accumulated reserves end of year 976,081 957,200
NOTES CONTINUED

29
2002 2001DKK 1,000 DKK 1,000
13 Syndicated capital
Syndicated capital is investment capital received from third parties and invested in projects on their account and risk. Syndicated capital only becomes due to the extent that IFU receives payments from these projects.
European Community Investment Partners (ECIP) 30,335 40,869 European Investment Bank (EIB) 3,772 3,772 Corporate investors 17,772 34,704
Syndicated capital in total 51,879 79,345 Value adjustments (33,501) (42,072)
18,378 37,273
14 Long-term debt
EIB (ECFI III facility) * 12,399 12,418 Administrative debt 466 140
12,865 12,558
* hereof payable after five years: DKK 7,295
15 Current liabilitiesSyndicated sale of loan payable 2,203 420 Derivatives 0 9,933 Other project related debt 1,355 385 Administrative debt 10,181 11,855 Current accounts 2,762 1,735 Deferred income 8 18
16,509 24,346
16 Available equity capital and clearances in principle
The available equity capital is reached as follows
Total equity capital 2,027,017 2,008,136 Reserves against losses 15,047 11,834 Syndicated capital 18,378 37,273 Project participation (1,465,675) (1,629,596)
Available equity capital 594,767 427,647
Clearances in principle for new projects amount to 246,092 139,260
17 Contingent liabilities
The total lease and rental commitments amount to DKK 3.3m (DKK 3.4m in 2001)- hereof due within the following year DKK 2.5m (DKK 2.8m in 2001)
18 Pledged assets
IFU has pledged Danish State Bonds amounting to DKK 14.0m as security for long term debt to EIB.
In one project, IFU - as all other shareholders - has pledged its shares (at an estimated fair value of DKK 15.0m) as security for senior loans granted to the project.
NOTES CONTINUED

30
The Danish Minister of Foreign Affairs appoints the Chairman, the Deputy Chairman and other
members of the Supervisory Board for a three-year period. Each appointment is personal.
The Minister of Foreign Affairs also appoints the Managing Director.
The current Supervisory Board has been appointed for the period August 2000 to August 2003.
The Board usually convenes on a monthly basis. On the recommendation of the management, it
makes decisions about investments and principal issues.
The rules for disqualification follow the provisions of the Public Administration Act (Act No. 571
of December 19, 1985, §§3–6). The principle is that a member of the Board or an employee can-
not participate in the discussion of a case involving a company in which the person in question has
a special interest.
Board members may not buy or sell shares or other securities issued by companies of which they
have obtained special knowledge through board work. To prevent insider trading, the Board au-
thorises an updated list at each meeting of the listed companies for which the Board believes its
members to have inside information; however, the prohibition of utilising knowledge from Board
work applies in general.
All information received by the Board members, orally or in writing, is confidential.
THE SUPERVISORY BOARD

31
Johannes Poulsen, Chairman (1942), member since
1997. M.Sc. (Economics and Business Administration).
Director, Buur Invest A/S. Other board memberships:
IØ**, IFV**, AXCEL IndustriInvestor A/S, AXCEL II A/S,
AXCEL Management A/S, Bukkehave A/S, Dantherm
Holding A/S, Eksport Kredit Finansiering A/S,
FLS Industries A/S, F.L. Smidth A/S, Lyskilde Holding A/S,
Frandsen-Lyskilde A/S, Det Fælles Udgiverselskab A/S,
Investeringsforeningen BANCO, Eksport Kredit Fonden,
Extend Reach Corporation.
Agnete Raaschou-Nielsen, Deputy Chairman (1957),
member since 2000. Ph.D. (Economics).
Managing Director, Zacco Denmark A/S. Other board
memberships: IØ*, IFV*, Skandinaviska Enskilda Banken
A/S*, Centre for Business History and Centre for Law,
Economics and Financial Institutions
(Copenhagen Business School).
Lars Andersen (1958), member since 1994.
M.Sc.(Economics). Managing Director, The Economic
Council of the Labour Movement. Other board
memberships: IØ, IFV, DSB, Danish Trade Council.
Sigurd Ø. Andersen (1951), member since 2000.
M.Sc. (Engineering). Managing Director, Burmeister &
Wain Scandinavian Contractor A/S. Other board
memberships: IØ, IFV, Pedregal S. de RL., BWSC A/S,
BWSC Guam Inc., BWSC Mindanau Inc.,
BWSC Panama S.A., Brancheforeningen for Biogas.
Elsebeth Budolfsen (1947), member since 2000.
M.Sc. (Pharm). Managing Director, T-cellic A/S.
Other board memberships: IØ, IFV, Ferrosan A/S,
Fertin Pharma A/S, NSGene A/S, VækstFonden.
Lars Kolte (1950), member since 1997.
Degrees in Economics (Universities of Århus,
Wisconsin, Brügge). Managing Director, Eksport Kredit
Fonden. Other board memberships: IØ, IFV, Nordic
Investment Bank.
** Chairman * Deputy Chairman
Kjeld Ranum (1938), member since 1994.
M.Sc. (Engineering). Director. Other board
memberships: IØ, IFV, Svejsefabrikken Migatronic
A/S**, Superfos Packaging A/S, B.U.H.L.-Randers
A/S**, Randers Reb A/S*, Aarhus Oliefabrik A/S**,
HEMPEL A/S, United International Enterprises Ltd,
Det Fælles Udgiverselskab A/S, Danish Trade Council**.
Michael Rasmussen (1964), member since 2000.
M.Sc. (Economics) and AMP (Insead). Member of
the Executive Board, Nordea Bank Denmark A/S.
Other board memberships: IØ, IFV, Nordea Kredit
A/S*, Nordea Finance, Nordea Bank Poland, Danish
Trade Council, LRF Kredit A/S, Council of Danish
Ship Finance.
Carsten Staur (1954), member since 2000. MA.
State Secretary, Ambassador, Ministry of Foreign
Affairs. Other Board memberships: IØ, IFV.
Karen Wermuth (1954), member since 2000.
LLM. Under Secretary, Ambassador, Ministry of
Foreign Affairs. Other board memberships: IØ, IFV.

32
FOREIGN DIRECT INVESTMENTS COMBAT POVERTY
IFU supports the business opportunities of Danish compa-nies in some of the poorest regions in the world and sup-ports their interest in investing there. Seen over a numberof years and again in 2002, a comparatively large part of theDanish investments with IFU participation have been madein the least developed countries or in the poor areas of thebetter situated developing countries.At the Millennium Summit in 2000, the international com-munity decided to aim to achieve eight Development Goalsby 2015. Among other things, the proportion of poor peoplein the world is to be halved. Denmark has adopted the Mil-lennium objectives.IFU contributes to the achievement of the Millennium De-velopment Goals by promoting economic growth and em-ployment in the developing countries through Danish in-vestments.In 2003 IFU’s capability in this respect will be measured. TheDanish Ministry of Foreign Affairs has initiated an evaluationof IFU, and completion of its report is expected in 2003.In 2002 IFU carried out its own review focusing on the suc-cess rate of the Fund and of the projects. This review showsthat IFU works efficiently and achieves good results.
Danper, Peru

33
● LOAN FROM IFU SECURES EXPANSION IN PERU
A loan granted from IFU of DKK 7.5m toDanper Trujillo in Peru will allow the com-pany to expand and diversify, in spite ofthe difficult credit situation in Peru.Peru is the world’s largest producer ofasparagus, and since its establishment10 years ago, Danper has become Peru’ssecond largest exporter of asparagus injars and cans. Demand has made it de-sirable to expand and diversify produc-tion with artichokes and jalapeños.Danper is located in Trujillo in one of theleast developed regions of Peru, 500 kmnorth of Lima. With its 750 employees, 200local farmers delivering asparagus, andspin-off employment for, among others,casual workers, Danper brings economicactivity on many levels to the region.Danper has established itself as a so-cially responsible company. It has itsown clinic, where all employees andtheir children are treated free of chargeand given preventative medical care andeducation in health, hygiene and nutri-tion. In 2002 Danper obtained the SocialAccountability Standard 8000 certifi-cate from the World Trade Organisation.With funding from the Environment andTraining Fund (Danish development aidfinanced fund administered by IFU), Dan-per has trained its workers and invested inergonomic work places, air conditioningand water treatment. Danper obtained itsHACCP quality certificate in 1998 andwas the first food industry in Peru to ob-tain ISO 9002 certification. The most re-cent honour bestowed on Danper was thegold medal issued by the Peruvian Cham-ber of Industry for outstanding perfor-mance in 2001.
●● IFU BRINGS DEVELOPMENT TO WESTERN CHINA
While the growth centres in China’scoastal areas are booming, the Chinese
government is concerned that westernChina is generally being overlooked byforeign investors. Nanning QiaohongNew Materials Co. Ltd, which is partiallyfinanced by a Danish investor, is goingagainst the current. The company is sit-uated in Nanning, in the less developedregion of Guangxi Zhuang AutonomousRegion. The region is one of the 12 west-ern provinces in which the Chinese gov-ernment encourages investments, whilethe foreign investors are hesitant.The Danish partner and technology sup-plier Dan-Webforming International A/S(Dan-Web) does not hide the fact thatIFU has been an invaluable co-operatingpartner. This is primarily due to Dan-Web being a small company with 40 em-ployees. The company has patented,leading technology.Dan-Web wished to co-operate with IFUfor three reasons. Firstly, Dan-Weblacked experience in Asia prior to theproject. Secondly, it did not have experi-ence in joint venture investments. Fi-nally, Dan-Web wanted to reduce itsblock of shares in the project.In IFU, Dan-Web found a partner whocreated security during the negotia-tions, with the participation of IFU’sresident representative in China, whoeven acted as an interpreter both lan-guage-wise and culturally. IFU partici-pated with its knowledge of legal andcompany law aspects and its experienceof how to draw up agreements betweenthe partners.The Chinese partner is Nanning SugarManufacturing Co. Ltd with more than5000 employees. Nanning Sugar Manu-facturing together with Dan-Web estab-lished a new production of air-laid ab-sorbent paper materials to be used ascore material in hygienic products suchas feminine hygiene, napkins and phar-maceutical disposables. Implementa-tion of the project started in 2002.
Two examples of projects from the investment portfolio thatcontribute to the alleviation of poverty

34
The economic performance of IFU projects has improved over the years, a review made in 2002 con-cluded. The review also asserted that IFU has promoted the internationalisation of Danish companies.Since its inception in 1967, IFU has, according to the review, generated exports worth DKK 10.5bn.This figure should be taken with reservations, as it is based on a desk study and on accounts of expecta-tions at project start. The report also credits IFU for the creation of new categories of jobs with higheradded value in Denmark.
REVIEW: HIGH PRODUCTIVITY AND GOOD RESULTS
MAIN FINDINGS:
The projects have contributed signifi-cantly to the promotion of export andto import substitution effects in mostcountries.
Over the years, the focus has movedfrom the food and beverage industrytowards infrastructure and services.
The projects are generally performingwell in terms of environment and hu-man rights.
Large projects are more efficient de-velopment agents than small pro-jects. They have more extensive locallinkages, they generate more exportand their environmental performanceis better. Large projects also show
better commercial performance andtherefore a more significant spin-offeffect.
IFU COMPARED TO SIMILARAGENCIES:
IFU’s productivity per employee ishigher and its administrative costslower compared to similar financialinstitutions.
IFU’s investments are strongly orien-tated towards the poorest developingcountries, and IFU has a relativelyconservative policy regarding provi-sions against losses. Consequently,IFU’s profits appear in the low end inthe comparison.
●
●
●
●
●
●

35
Considering the theoretical case of IFU being liquidated andthe equity capital paid to the Danish Treasury would showIFU’s financial performance over the years. In this case, theDanish Government would have had an internal rate of returnof 4.4 per cent. The Fund thus lives up to the aim of beingself-financing.The review was prepared by Michael W. Hansen, assistantprofessor at the Copenhagen Business School.
It is IFU’s own observation that, in connection with partial re-location of the production, Danish companies can maintainor even improve other parts of the company in Denmark andthus strengthen the Danish position in the international di-vision of labour. Often, actual production is relocated, whileactivities such as product development, design, marketingand sales are maintained, or even increased, in Denmark. Inmany cases relocation of actual production results in an in-crease in total employment, because the company gains big-ger market shares on a global scale.The profitability of producing in developing countries is notonly a consequence of low wages. In many cases it is necess-ary to place the production close to where the products aremarketed to allay the costs of expensive long distance trans-port. In other cases a production facility is required to beclose to the raw materials. Often a company’s request to op-erate is not considered by the national authorities if it doesnot have a department in the country in question.The projects also have a positive impact on the Danish econ-omy and Danish employment by virtue of the export of, for ex-ample, production equipment in connection with the pro-jects. In 2002 exports were estimated at DKK 214m. Usinga statistical conversion factor, this adds up to 428 man-years.In the developing countries, the investments in new projectsare expected to create 2,115 new jobs.

36
By collaborating with IFU, partners gain, in addition to financing, access to IFU’s knowledge
accumulated through 35 years, and access to IFU’s network of advisers and contacts
CO-OPERATION WITH IFU– WHY AND HOW
Danish partners in particular gain access to IFU’s knowledge of investments and of the operation of com-panies in developing countries.Developing countries request IFU’s assistance in establishing contact with appropriate Danish companies.IFU’s commitment to co-operate through its participation in the investment increases credibility and cre-ates confidence.
THROUGH THE PARTNERSHIP WITH IFU, DANISH COMPANIES WILL:Gain access to IFU’s experience from previous investments in the same sector or country.Have the opportunity to make use of IFU’s advisers in the geographic areas in question or within specificareas of expertise.Benefit from the respect which IFU enjoys in the investment countries by the mere fact that IFU hasbeen established by the Danish state.
INVESTORS IN DEVELOPING COUNTRIES HAVE GOOD REASONS TO SEEK CO-OPERATIONWITH DANISH COMPANIES:Because the Danish business structure is characterised by small enterprises and a high number of en-trepreneurs, entrepreneurs from developing countries find it easy to see eye to eye with Danish businesspeopleDanish companies hold a strong position within many sectors.
IFU’S SHARE OF THE FINANCING IS ALSO IMPORTANT: The risk is spread among more parties. IFU is more willing to take risks than commercial banks. Due to IFU’s close contacts with Nordic, European, international and local financial institutions, IFU isoften able to make complete financing arrangements.In priority areas such as the least developed countries, the partners can draw on IFU’s special facilitiesto finance preparatory studies and first visits.
●
●
●
●
●
●
●
●
●
●
●
●
WHY CO-OPERATE WITH IFU?
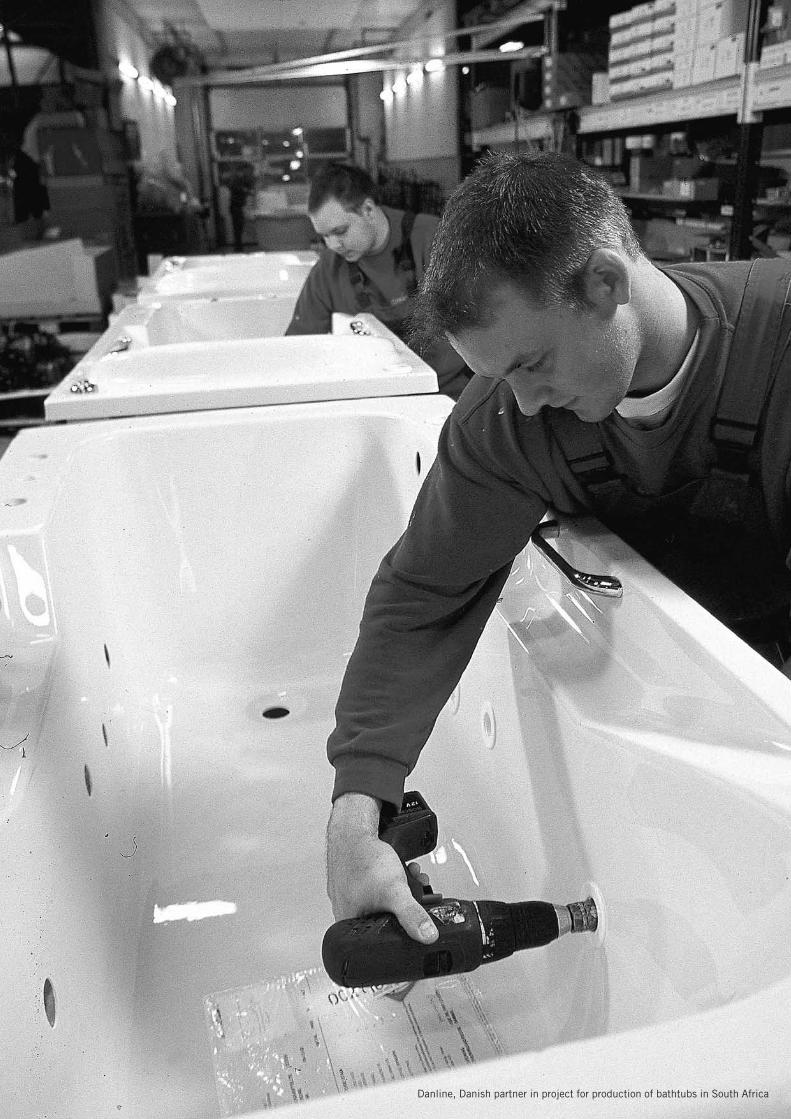
Danline, Danish partner in project for production of bathtubs in South Africa

38
IFU may subscribe for shares and/or grant loans and issue loan guarantees.
IFU can normally finance up to 25 per cent of the total investment, including working capital.
IFU subscribes to a maximum of 30 per cent of the share capital and usually not to a larger share than the Danish partner.
The loans usually mature within up to 5 years, and often a period of grace is offered.
IFU’S PART OF THE FINANCING
Both large and small projects, including pilot projects, areeligible for financing. This applies whether they are green-field projects, expansion of existing projects or privatisationof state-run businesses.The investment is conditional on IFU viewing the project ascommercially viable and the participation of a Danish com-pany.Host countries of investments must be on the OECD-DAC listof development aid recipients, and per capita income maynot exceed USD 5,185 (2003).
IFU recommends that companies contact IFU early on dur-ing preparations. Only then will they benefit fully from IFU’sparticipation.In the beginning of the process, IFU’s Board may grant a pre-liminary approval of the project – a declaration of Clearance
HOW IFU WORKS
ELIGIBILITY
100 % Share CapitalNo Local Partner
Share Capital & LoanWith Local Partner
● IFU ● Danish Partner ● Local Partner ● Project Loans
60%
40%
35%
35%
30%
60%
40%
50%
30%
35%
35%
50%
No Local Partner With Local Partner
] Shar
e Ca
pita
l
] Loan

39
in Principle. This can facilitate negotiations with authorities,project partners and lenders.When preparations are drawing to a close, IFU will arrange inmost cases for the partners to meet at a seminar run by anindependent facilitator to ensure that they share a full andclear understanding of each other’s business motives andobligations prior to the final investment decision.The signing of the shareholders’ agreement and/or the loanagreement between IFU and the partners marks the conclu-sion of the project preparations. IFU usually takes a seat onthe board of the project company, which allows the partnersto benefit continuously from the Fund’s knowledge.Through IFU the project companies may apply for Danish de-velopment aid on a grant/gift basis for education and train-ing of employees. They may also apply for grants to improvethe external environment and Occupational Health andSafety. The precondition is that the per capita income of thehost country does not exceed USD 2,500.Once a project company is consolidated – usually after 6–8years – IFU withdraws. IFU’s shares are sold at terms oftenagreed by the partners at the beginning of the project. Thecapital returned to IFU can then be used for new invest-ments.
IFU administers two sister Funds, IØ and IFV, which operatein Central and Eastern Europe and in developing countrieswith a per capita income above USD 5,185 (2003). Thethree Funds are collectively termed the Danish InternationalInvestment Funds.The Funds are members of the European Development Fi-nance Institutions (EDFI). This is an organisation with theobjective of furthering mutual co-operation between the 13member agencies and safeguarding common interests in re-lation to the European Commission and its institutions, in-cluding the European Investment Bank (EIB).
SISTER FUNDS AND INTERNATIONAL CO-OPERATION

40
DANIDA ENVIRONMENT AND TRAINING FUND
It will support only environmental im-provements exceeding local minimumrequirements.The maximum support to a joint ven-ture company is DKK 1.5m or 10 percent of the total investment in the com-pany. The Danida Environment and TrainingFund is financed by Danish InternationalDevelopment Assistance (Danida), butis administered by IFU. A review pre-pared in 2002 for the Danish Ministryof Foreign Affairs by Copenhagen De-velopment Consulting concluded thatthe Fund plays an important role andthat significant results are obtained inareas of importance to the companies.The review covered commitments to-talling DKK 15m made between 1998and 2001 to 23 projects. Half of the
commitments were allocated to train-ing of employees and the other half toOccupational Health and Safety andexternal environment measures. In thereview it was estimated that when allthe commitments have been utilised,more than 1,000 employees wouldhave received training for at least 15days. Following the recommendations of thereview, a new allocation to the DanidaEnvironment and Training Fund wasapproved in 2002.The Danida Environment and TrainingFund is reserved for projects in coun-tries with a GNP/capita not exceedingUSD 2,500, provided that the hostcountry is not covered by the DanishForeign Ministry’s Private Sector De-velopment Programme.
The Danida Environment and Training Fund offers grants covering
up to 80 per cent of the expenses for:
● Training of staff at all levels (including board members)● Practical guidance and consultation for joint venture staff● Measures to mitigate environmental effects● Measures to improve Occupational Health and Safety

41
Financing may be offered from many sources. But IFU’s em-pirical material and expertise are unique. Experience and ex-pertise follow the money from IFU. IFU underwent a reorganisation in January 2002 with theaim of creating a flexible organisation. The flexibility will en-sure that the right people with the relevant experience andthe proper expertise are always available to companies mak-ing plans for or implementing projects.
COUNTRY EXPERIENCEAn important aspect is IFU’s country-specific experience.With investments in more than 70 countries, IFU has a geo-graphical diversification surpassed by very few similar fi-nancing institutions in the world.
BUSINESS EXPERIENCEIn the same way IFU has overall knowledge of most businesssectors and has had the opportunity to gather general expe-rience from a number of investments within the individualsectors. With 474 projects now in its portfolio, the Fund hasat some point or other been involved in almost all types ofproduction or services.
PARTNER EXPERIENCEIFU also has unique knowledge when it comes to partner re-lations. The law stipulates that a Danish partner has to be in-volved in a project if IFU is to participate.In the past, it was a main rule that a local partner was in-volved, but in more and more cases projects are carriedthrough as purely foreign investments. Recent researchshows that the positive effects of the investments in the re-ceiving country depend more on other factors and less onownership. Through the years IFU has gained considerable insight intothe strengths of partnerships, and also their pitfalls.To better utilise the strengths and to avoid the pitfalls, IFUalmost always suggests that to complete the preparations thepartners should meet for a final review of motives, distribu-tion of responsibility etc. before the money is invested. Thepurpose of these pre-investment meetings is to make a finalvalidation of the business plans with the participation of allparties involved.
FINANCING EXPERIENCEIFU’s experience of putting together total financing solutionsis valuable to the investors.
WITH MONEY COMES ADVICE

42
IFU co-operates closely with a number of international, Eu-ropean and local financing institutions, and has a goodknowledge of local sources of financing.An example is the Africa Project Development Facility(APDF). All projects with IFU’s financial participation lo-cated in sub-Saharan Africa are eligible to utilise the APDFservices, which include training, capacity building and busi-ness advisory services. APDF was established as a co-opera-tion between the World Bank, the UN and a number of bilat-eral donor agencies.
MANAGEMENT AND TRAININGEspecially in Africa, private companies often experiencedifficulties with the professional management of projects.The partners benefit from IFU’s co-ownership and boardmembership of the African Management Services Company(AMSCO). Here, the companies can gain access to seniormanagers for a short or long period of time, and to fundingfor training of employees. AMSCO is backed by United Nations Development Pro-gramme and the World Bank affiliate, the International Fi-nance Corporation (IFC).
12,000
10,000
8,000
6,000
4,000
2,000
0
KEY FIGURES ABOUT IFU 1968-2002
● Export from Denmark● Disbursed amounts● Contracted investments● Paid-in capital● Reserves against losses● Equity
DKKm

43
IFU – RESOURCES
Stephen Potter, a Chartered Accountant by profession, hasmore than 35 years’ experience in the developing world,mainly through employment with IFU’s sister organisationthe Commonwealth Development Corporation, now CDCCapital Partners plc in England.As part of his career, Stephen Potter has resided overseas,mainly in Africa, the Caribbean and Asia. During the last fewyears, he enjoyed leading CDC positions in South Asia, in-cluding Pakistan and Sri Lanka, and more recently as theirRegional Director for East Asia and Pacific. As Director forChina, he was responsible for the establishment of CDC’s op-erations there in the year 2000.Along the way, he came to know IFU extremely well and en-joyed close co-operation with IFU as a partner in a variety ofventures in various countries around the world. Following
THE ADVISER NETWORK
At the end of 2002 IFU had 30 advisers.
The network is extended continuously with the purpose of offering the best possible gui-
dance when it comes to choice of partners, preparation and implementation of the projects.
Most of the advisers are senior business people with considerable commercial experience. I.e.
they have run their own business or have held a leading position in a company. They have
an in-depth knowledge of local business culture, investment authorities, local financing in-
stitutions, accountants, lawyers etc.
Companies entering into dialogue with IFU can draw directly on advisers who have special
expertise or local knowledge of the area in which establishment of the project is contemplated.
PORTRAITS OF TWO ADVISERS

44
his departure from CDC, he was an obvious choice as an ad-viser to IFU.“For many years, it was my job to conduct negotiations be-tween both Governments and business partners and to seekbusiness solutions and results with which everyone could besatisfied. Thanks to the many years of residence in overseaslocations, I feel that I understand the differing business cul-tures in different parts of the world. Living and working in acountry is quite unlike paying short visits, no matter howmany you make! Those experiences and the long-standingrelationships that are created serve as a valuable network ofcontacts and are particularly useful in finding solutions for aproject when things start to go wrong.”One of Stephen Potter’s first assignments for IFU has beento tackle some of the troublesome IFU projects in SouthAsia. He says, “Danish business integrity and culture is wellrespected around the world, but is sometimes misunder-stood, leading to difficulties between the local sponsor, theDanish partner and IFU. This is where I believe that I can of-fer some help in finding a meaningful way forward for IFUand all the stakeholders in the venture.”
Meric Gemayel, BA with honours in political science andeconomics from the American University of Beirut, Lebanon.Since 1985 she has lived and worked in Istanbul, Turkey, asa consultant to foreign investors and since 1986 as an IFUadviser."My work experience, by choice, has been limited to institu-tions that had motives ulterior to simple profit making. It isalso this aspect of IFU that I find most appealing. Beyondthe object of creating financially sound projects, IFU givespriority to environmental and developmental considera-tions."Meric Gemayel finds interaction with Danish companies veryagreeable and appreciates their co-operation. She says:"While working together with Danish companies I discoveredthat the success of the majority of them is based on integrityand hard work carried out in an assuring manner."As an advisor to IFU she describes herself as a 'mental trans-lator' between the Danish and Turkish business cultures:"I firmly believe that a seemingly very feasible project can bedoomed to failure, particularly in the developing countries,if the local and the Danish partners cannot co-operate. Op-posite, what on paper seems like an unfeasible project canbloom if the two partners understand each other and strivetowards the same objectives. This is not to underestimatethe need for a thorough feasibility study but to underline theimportance of the human factor."
A MODERNISING FORCE

45
Deputy Managing Director Jørgen Dan Jensen has decidedto retire from IFU as from the end of April 2003 after 33years of employment and will from then be attached to IFUas senior adviser.As he was employed as a young economist only two years af-ter start of IFU’s activities Jørgen Dan Jensen is often givena good deal of the credit for the development of IFU from thetime when the first uneasy steps were taken till the 1990s,when it was recognised as a model institution.When IØ (the Investment Fund for Central and Eastern Eu-rope) in 1989-90 was formed over the IFU mould and withIFU acting as fund manager, Jørgen Dan Jensen was giventhe responsibility of developing the new institution as a re-liable financial partner for Danish commercial investors.His resignation has accelerated the Fund’s transition to atwo-person Executive Board.
About the role of advisers she says:"I believe that the local advisers can protect potential Dan-ish investors from making wrong alliances as they have bet-ter insight in the business sector of their respective coun-tries. The solid professional approach of IFU Investment Of-ficers combined with the instinctive advice based on thor-ough knowledge of their surroundings, provided by local ad-visers, is a package Danish companies should find hard torefuse. In developing countries, the combination is a strongmodernising force."
JØRGEN DAN JENSEN IS RETIRING

46
INVESTMENT PORTFOLIO AS AT 31 DECEMBER 2002
AFRICA
AFRICA (REGIONAL)African Infrastruc. Fund Infrastructure projects B&W Scandinavian Contractor 8.6 2,875.4 30 2000-AMSCO Management services Carl Bro Gruppen/Globe 7.3 50.0 54 1989-Mærsk Africa Facility Transport related projects Mærsk 50.0 100.0 500 1999-Total 3 Projects 15.9 50.0 3,025.4 584
ALGERIAAldaph Pharmaceuticals Novo Nordisk 11.4 34.1 359.3 240 2000-2002Altec Engineering Haldor Topsøe 0.6 3.0 50 1971-1977Aviation Assistance Alger Aviation Burgess Aviation 6.8 28.0 65 2002-Cosider Construction Christiani & Nielsen 3.3 14.0 550 1978-1981Total 4 Projects 22.1 34.1 404.3 905
ANGOLANova Cimangola Cement FLS Industries 50.5 625.6 1,000 1996-Total 1 Project 50.5 625.6 1,000
BENINCimbenin Cement Fibo 8.6 6.9 105.0 170 1991-Fan Milk Dairy Fan Milk International 0.4 1.0 12 1992-1996Fan Milk Distribution of dairy products Fan Milk International 1.7 4.2 55 1999-Total 3 Projects 9.0 8.6 110.2 237
BURKINA FASOFan Milk Distrubution of dairy products Fan Milk International 0.7 1.8 22 1997-Total 1 Project 0.7 1.8 22
BURUNDIAvicom Poultry farming DPD 1.0 1.2 4.0 40 1989-1996Total 1 Project 1.0 1.2 4.0 40
CAMEROONCamsavon Chemical industry Sønderstrup Sæbefabrik 0.0 1.0 40 1986-1988Camtainer Land transport Scancatrans 3.1 6.7 35.0 100 1984-1995Cocadac Construction E. Pihl & Søn 2.8 4.0 10.0 300 1976-1982NOBRA Brewery Cerekem 17.8 25.6 412.0 15 1986-1995Total 4 Projects 23.7 36.3 458.0 455
CAPE VERDECeris Brewery Bryggerigruppen 4.2 15.6 63.0 90 1985-2001Total 1 Project 4.2 15.6 63.0 90
CENTRAL AFRICAN REP.SOGESCA Sugar refinery Niro/Danisco 26.6 320.0 350 1985-1996Total 1 Project 26.6 320.0 350
CÔTE D'IVOIRECITB Wood products Danish Wood Treating 0.3 1.0 4.0 15 1983-1984Fan Milk Ice cream Fan Milk International 0.7 6.9 20 1993-1995Finamark Dairy products Fan Milk International 11.1 45.3 195 2002-Sadofoss Chemical industry Sadolin Nobel 5.3 9.3 32.0 58 1976-1995SAM Furniture E. Roth Oversøisk Hårdtræ 0.5 1.1 15.0 25 1970-1999Sedan Construction Helsingør Værft 5.0 4.8 42.0 350 1976-1982Sitransbois Wood products Nordisk Trælast 16.8 33.0 83.0 600 1977-West Africa Growth Fund Financial institution No Danish partner 12.9 130.0 6 1997- #Total 8 Projects 52.6 49.1 358.2 1,269
DEMOCRATIC REP. CONGODanilait Powdered milk packing Scancool International 1.4 0.4 6.0 25 1987-1997Dilaz Dairy Primodan Food Machinery 0.9 10.0 25 1987-1988Total 2 Projects 2.3 0.4 16.0 50
EGYPTCLFF Research and development No Danish partner 2.1 3.0 40 1982-1996Dantex Clothing Brandtex 4.3 8.0 35.0 200 1984-1991Egypac Pulp and paper products Buhl Automation 2.3 9.2 30.0 30 1976-1986El Rayan Danfarm Dairy farm Danfarm Contractors 20.5 435.0 350 1987-1988EPL Research and development Danish Protein Institute 1.1 2.0 15 1980-1982Hotel Marina Hotels and restaurants Helnan Hotels 7.4 16.6 220 1992-2000RadissonSAS Quseir Resort Hotel operation SAS Hotels 21.5 22.3 141.6 300 2000-Sinai Cement Co. Cement production Aalborg Portland 39.6 1,501.0 700 2000-Sinai White Portl. Cement Cement plant Aalborg Portland 41.8 31.8 639.9 400 1999-Total 9 Projects 132.1 79.8 2,804.1 2,255
ETHIOPIAAfrican Lakes Ethiopia Car sales and maintenance Kjær Group 4.0 24.0 50 2002-Muus Feed mill Elias B. Muus 0.5 0.9 3.0 25 1972-1975Total 2 Projects 4.5 0.9 27.0 75
Activity/product Danish Partner(s) IFU Participation Total Investment Employment PeriodShares Loans
(DDK million) (DDK million) (DDK million) (Persons)

47
GHANAAko Larsen Ltd. Waste Collection Hvidtved Larsen 1.5 8.6 80 2001-Carpo Scandi Wood Ghana Production of wood products Scandi Wood 1.2 7.0 40 2001-Danafco Pharmaceuticals Propharma 1.9 17.6 100 1998-Fan Milk Dairy Fan Milk International 2.9 15.4 34.1 110 1989-Ghana Emulsion Cold emulsion Phønix Contractors 3.8 1.2 27.0 50 1995-Muk Air Air transport Muk Air 2.0 10.5 30 1997- *Northsax Kiln Company Wood products Dalhoff Larsen & Hornemann 0.6 6.0 4 1997-Pako Bay Fishing Brdr. Kristensen 0.2 3.7 60 1997-1998Scanbech Ghana Production of plastic bottles Scanbech 1.3 1.0 6.5 80 1998-Volta Arkil Quarry Ove Arkil 2.1 2.5 9.0 30 1991-1999Total 10 Projects 15.8 21.7 130.0 584
KENYAAcacia Fund Financial institution No Danish partner 0.1 13.2 140.0 7 1997-DCK-EA Agriculture and farming DCK Production 0.8 0.8 22.0 1 1970-1978DCK-Production Agriculture and farming DCK Production 3.9 4.0 34.0 5,000 1970-1978Muus Feed mill Elias B. Muus 0.7 1.3 3.0 35 1972-1980Vestergaard-Frandsen Ldt Textiles Vestergaard Frandsen 1.3 5.0 8.2 10 1995-Total 5 Projects 6.8 24.2 207.2 5,053
LESOTHOTantina Milling Flour milling ABC Hansen 0.3 4.9 27 1999-2000Total 1 Project 0.3 4.9 27
MALAWIScandrill Water supply Intertec Contracting 1.2 13.8 22.8 30 1986-Total 1 Project 1.2 13.8 22.8 30
MALISomapil Batteries Alkaline Batteries 1.8 4.8 34.0 260 1984-1995Total 1 Project 1.8 4.8 34.0 260
MOROCCOComapral Dairy O.G. Hoyer 8.7 25.4 95.0 30 1986-1997Cool Time Trade O.G. Hoyer 0.0 110.0 1 1990-1998Ettamam Feed mill Schmidt & Jessen 1.5 19.0 50 1981-1986York Refrigeration Morocc Service company York Refrigeration 0.4 1.4 10 1993-Total 4 Projects 10.5 25.4 225.4 91
MOZAMBIQUEFrigo Services Machinery and equipment York Refrigeration 0.4 2.0 25 1989-2001Motorcare Sale and service of cars Kjær Group 3.7 6.7 27.7 12 1999-Nyati Beach Lodge Lodge Nyati Mozambique 4.0 7.5 24 2002-Total 3 Projects 8.0 6.7 37.2 61
NIGERIAAdegbemile Flour mill United Milling Systems 1.1 0.2 25.0 40 1985-1998BARC Agriculture and farming Bryggerigruppen 440.0 950 1982-DEMCO Construction Bryggerigruppen 52.0 57 1988-Fan Milk Dairy Fan Milk International 16.0 6.5 73.8 2,200 1999-Fertile Acres Agriculture and farming Cerekem 2.5 2.9 23.0 100 1984-1996Grundfos Pumps Machinery and equipment Grundfos 1.3 20.0 60 1983-1986JIB Brewery Bryggerigruppen 55.5 0.3 416.0 1,400 1977-Nwankwu & Rasch Construction NTR Holding 1.0 4.0 65 1976-1979Peacock Paints Paints Dyrup 4.5 9.7 101.0 64 1979-1999Pioneer Milling Milling plant Bryggerigruppen 52.0 90 1986-Plateau Bottling Soft drinks Bryggerigruppen 4.2 100.0 120 1981-1999Sunrise Bottling Soft drinks Cerekem 8.2 104.0 120 1983-1988Tiger Battery Batteries Alkaline Batteries 4.4 38.2 144.0 150 1983-1997W.Africa Container Term. Container terminal Mærsk 25.4 42.5 25 2000-W.African Portland Cement Production of cement F.L. Smidth 35.4 920.7 550 1999-2000Total 15 Projects 98.5 118.7 2,518.0 5,991
RWANDASorwapiles Batteries Alkaline Batteries 4.0 47.0 100 1985-1989Total 1 Project 4.0 47.0 100
SENEGALAfrican Seafood Fishing/processing P.F. Faromar 10.5 26.5 129.0 90 1984-1999Ciments du Sahel Production of cement F.L. Smidth 8.0 29.8 639.5 200 2001-Rutec Service company Atlas-DK 0.1 1.0 20 1980-1983Senegal Seafood Fishing/fish processing P.F. Faromar 2.0 30.0 250 1982-1985SOCA Agriculture and farming APV Engineering 3.4 13.0 48.0 75 1987-1996Total 5 Projects 22.0 71.3 847.5 635
SOUTH AFRICABenzak Beverages Distribution of malt drinks Bryggerigruppen 1.0 2.7 20 1999-Credin Bakery Supplies Food ingredients Palsgaard Industri 0.7 2.7 9.8 70 1998-Danafrica Flour Mills Food and beverages Kongskilde Industries 0.1 1.0 50 1997-1999Dan-Essence Detergents & soap Sønderstrup Sæbefabrik 1.2 3.8 54 1997-2001Danforge Engineering Machinery and equipment Brdr. Jørgensen 0.5 0.4 2.6 25 1997-Danline Bathroomware Bath tubs Danline 0.2 0.6 2.2 5 2002-Kristensen Oceanfront Restaurants Kristensen Group 8.5 13.9 45.4 270 1998-
Activity/product Danish Partner(s) IFU Participation Total Investment Employment PeriodShares Loans
(DDK million) (DDK million) (DDK million) (Persons)

48
Activity/product Danish Partner(s) IFU Participation Total Investment Employment PeriodShares Loans
(DDK million) (DDK million) (DDK million) (Persons)
Morsø Heating Centre Production of heating products Morsø Jernstøberi 2.3 2.3 10.3 8 2000-New Africa Signs & Graph. Signs and posters Sign-Tronic 0.0 0.8 3.4 12 1996-2001Newave Technology Prepress print Dokmand 1.0 7.8 12 1998-Nielsen Tap Water taps Toni Armatur 0.3 0.2 2.1 30 1995-1999Princeton Computing Education Courseware Scandinavia 0.2 1.3 30 1996-1999Resource Dev. Consultants Consultancy Carl Bro Gruppen 0.8 1.5 4.5 20 1995-2000Sibaya Conservation Proj. Hotels and restaurants Hotel Pakhuset/Claus Jepsen 0.4 0.3 5.5 20 1998-Stoneground Mills Manufacturing of mills ABC Hansen 0.9 2.7 15 1999-Time Out SA Branded sportswear Time Out 1.0 2.9 20 2001-Today's Signs & Graphics Production of signs Ladelund Skilte 0.2 1.1 7 1999-Umtha Manufacturing Production of sports articles Time Out 0.7 3.1 80 2000-2001Total 18 Projects 14.1 28.7 112.2 748
SUDANSFI Dry yeast Danisco Bioteknologi 5.5 8.3 35.0 60 1977-1987SMS Milling Flour mill United Milling Systems 0.4 1.2 6.0 15 1981-1990Total 2 Projects 5.9 9.5 41.0 75
SWAZILANDKGR Enterprises Rehab. of railwagons Giersing Rose 2.7 17.9 45 1993 - *United Plantations Africa Plantations IPF 17.3 88.5 750 1999- #Total 2 Projects 17.3 2.7 106.4 795
TANZANIADAHACO Airport handling SAS 1.4 8.1 33.0 400 1984-Den-Tan Resources Fishing Pre-Consult 2.0 15.0 60 1992-1997Mashado Game Fish. Lodge Hotels and restaurants Skanska Jensen 5.9 5.1 69.3 160 1994- *Mount Meru Hotels and restaurants Tanzania Hotel Investment 1.7 4.0 40.0 300 1974-1995RSP Transport Water transport Danea 1.2 6.4 15 1994-Tanruss Hotels and restaurants Skanska Jensen 15.4 69.3 414.2 350 1993-Total 6 Projects 24.4 89.7 577.9 1,285
TOGOAfricotière Water transport Mortensen & Lange 0.1 1.0 35 1989-1992Atlantic Produce Agriculture and farming Tropical Plants Agencies 2.0 3.3 11.0 100 1991-Cerekem Exotic Agriculture and farming Cerekem 3.1 7.8 34.0 170 1986-1995Fan Milk Dairy Fan Milk International 2.1 3.6 10.0 68 1985-1996ITP Rubber and plastic products Nordisk Wavin 6.7 20.1 63.0 82 1980-La Gazelle Land transport Erik Conradsen 1.3 9.3 80 1991-1993Soprolait Dairy APV Engineering 0.7 2.0 25.0 40 1980-1996Sotodas Chemical industry DK Kemi International 4.9 11.5 22.0 41 1985-1996STS Fabricated metal products Rambøll 1.2 3.6 14.0 250 1987-1997Total 9 Projects 22.1 51.9 189.3 866
TUNISIATDC Clothing D.T.C. Company 0.9 5.5 5 1992-1994Total 1 Project 0.9 5.5 5
UGANDADrillcon Drilling of bore holes Victoria Pumps 1.3 5.7 45 1998-K2 Group Management and IT consultancy K2-Consult 1.0 3.2 40 2001-Maersk Uganda Operation of container depot Mærsk 9.3 15.6 10 2000-Motorcare Uganda Sale/maintenance of vehicles Kjær Group 3.2 8.8 44.5 60 1998-MTN Publicom Pay phones Ascom Nordic 2.6 19.4 34.1 26 1998-Victoria Engineering Manufacturing of pumps Knebel Drilling 3.0 8.5 56 1998-2002Victoria Fresh Food Fishing/fish processing Brødrene Gram 4.0 3.0 12.0 60 1988-1998Victoria Pumps Mechanical engineering Knebel Drilling 5.5 3.0 16.0 50 1988-Total 8 Projects 15.3 48.9 139.6 347
ZAMBIAMilden Milling Maize milling United Milling Systems 5.0 60.0 200 1994-1995Verino Farms Broilers/dressed chickens Springkildegaard 4.4 12.2 120 1998-Total 2 Projects 5.0 4.4 72.2 320
ZIMBABWEBallantyne Butchery Meat processing No Danish partner 2.0 7.0 70 2001-Colcom Meat processing No Danish partner 1.2 53.9 300 2001-Danmeats Meat processing Pfeiffer/Globe 1.0 3.4 11.5 50 1995-2001Dansafe Reflection textile Oppenhejm & Jansson 0.3 0.2 2.0 10 1995-1999Frese Plumbing equipment Frese Armatur 2.5 6.0 34.0 50 1996-Imperial Coolers and freezers Derby 18.8 67.0 120 1993-Metafold Investments Refrigerators and coolers No Danish partner 5.5 33.5 90 2000-Powervision Energy production/distribution IRD 0.5 0.2 2.5 70 1997- #Ref-Air-Engineering Machinery and equipment Danish Refrigeration 0.6 1.8 2.4 25 1992-2002Scan-Lock Plastic floor tiles I.P.E. Danmark 0.4 2.3 20 1994-1999Total 10 Projects 32.8 11.6 216.1 805
TOTAL AFRICA 144 Projects 573.6 888.0 13,751.8 25,410

49
Activity/product Danish Partner(s) IFU Participation Total Investment Employment PeriodShares Loans
(DDK million) (DDK million) (DDK million) (Persons)
ASIA
BANGLADESHDahetra Bangladesh Dyeing and printing on textile Dahetra 2.3 9.9 45 2002-Dandy Chewing gum Dandy 1.0 28.0 80 1991-1992KAFCO (Plant) Fertilizers Haldor Topsøe 35.1 43.1 2,500.0 800 1990-KAFCO (Prom) Fertilizers Haldor Topsøe 0.6 7.0 8 1987-1990Wavin PVC pipes Nordisk Wavin 3.0 60.0 134 1986-1987Total 5 Projects 39.8 45.4 2,604.9 1,067
CAMBODIADumex Chemical industry Dumex 1.0 2.0 6.0 100 1971-1976Total 1 Project 1.0 2.0 6.0 100
CHINABaihua Publishing and printing Heidelberg 18.0 62.5 160 1992-Beijing Sunpu El. Appl. Production of water heaters Metro Therm 5.0 88.0 150 2001- #Bestseller Fashion Group Clothing Bestseller Wholesale 6.5 3.0 13.6 241 1997- #Chinaust Changchun Automobile parts Codan Gummi 2.6 15 1993-1994Chinaust Plastics PVC pipes Codan Gummi 1.3 5.5 20.0 90 1987-1994Chinaust Shanghai Automobile parts Codan Gummi 6.5 25 1993-1994Codan Ling Yun Rubber hoses Codan Gummi 7.5 4.4 42.2 55 1994-Coloplast Rubber and plastic products Coloplast 22.4 46.7 100 1995-2002 #Dalian Xinshiji Publishing and printing EAC (Hong Kong) 16.0 40.0 150 1994-Danagraf China Electrical machinery/equip. Danagraf 0.4 1.0 10 1997-2001 #Danavox Xiamen Hearing aids GN Danavox 6.2 2.3 18.0 125 1989-1999Danfoss Medical/precision instruments Danfoss 28.6 172.0 60 1995-Danhua Consultancy Kampsax/Vejdirektoratet 0.8 3.0 8 1993- *Danisco (China) Food ingredients Danisco Ingredients 6.0 147.4 90 1997-2002DISA China Air pollution contr. products DISA 10.0 15.0 150 2002-East Lake Villas Real estate activities EAC (Hong Kong) 3.5 41.9 210.0 380 1987-1997Green Environment Consultancy Cowi/Rambøll 0.4 1.2 3 1995-1997Huhhot Hua Ou Starch Starch products Kartoffelmelcentralen 8.2 42.0 100 1996-Hydro-X Chemical industry Hydro-X 0.7 0.6 2.8 12 1995-Impact Furniture Production of sofas Eilersen 0.6 2.0 25 1999-2001 #Innovation Production of sofa sets Innovation Randers 1.9 5.0 20 1998-2000International Nutrition Food and beverages EAC (Hong Kong) 41.0 6.3 115.0 180 1992-2000 #Jacob Holm Chemical industry Jacob Holm & Sønner 20.8 221.0 90 1995-2002Mærsk Container Production of ship containers Mærsk Container 13.9 267.0 600 1999-Ningbo Zhedong PVC windows Plastmo 2.9 13.0 60 1996-2000 #Novozymes (China) Pharmaceuticals Novozymes 54.1 1,160.0 360 1995-Primo Kunming Plastic (PVC) windows Primo Danmark 0.6 2.5 20 1999- #Qiaohong New Materials Co Sanitary fibre products Dan-Webforming 18.5 157.0 56 2001- #Rosti China Production of plastic parts Rosti 21.5 68.0 200 2002-Schrøder Plast Production of plastic products Schrøder Plast 4.2 2.0 18.9 12 2000- #Shanghai Dansk Textiles Dansk HK 12.4 15.1 40.0 30 1995- #Shanghai Ovo Egg Prod. Pasteurised egg products Ovotec International 2.2 12.5 50 2001- #Shanghai Shenlian Roulund Rubber and plastic products Roulunds Fabriker 3.4 22.2 80 1996-Shanghai Trayton Trading Sale of polstered furniture Trayton Møbler 1.0 5.7 116 2000-2000 #SIDIC Consulting engineers Dangroup International 1.1 0.2 3.0 4 1987-1999Silcon Electrical machinery/equipment Silcon 2.5 0.8 17.0 80 1995-1999Smekru Consulting engineers Krüger 0.4 5.0 6 1988-2001Sonion ( Suzhou ) Electronic equipment Kirk Accoustics 26.5 150.0 100 2001- #Tianjin FTZ TeamWork Office furniture and consult. System B8 møbler 2.8 11.7 24 2001- #Ting Fung Starch Starch products Kartoffelmelcentralen 10.9 85.0 30 1996-Trayton Furniture Production/sale of furniture Trayton Møbler 4.0 12.0 186 2000-2000 #Unicon-Dalian Ready-mix concrete Unicon Beton 3.3 25.0 50 1995-1999Wenzhou Primotex Production of buttons Moria Industri 8.5 22.2 60 2001- #Wolfking Tianjin Co. Machinery and equipment Wolfking Danmark 2.0 9.0 35 1997-2000Yan-Dan Consultancy Dangroup International 0.8 4 1995-1999Zhejiang ACO PVC windows Plastmo 2.1 9.0 60 1996-2002 #Zi Dan Publishing and printing Heidelberg 17.6 177.0 150 1996-Total 47 Projects 371.9 132.4 3,571.1 4,612
INDIAAkay Flavours Chemical industry Chr. Hansen 16.7 44.2 80 1996-Ambuja Cement Rajasthan Cement FLS Industries 8.8 843.0 300 1994-Arcodan Communication equipment Arcodan 2.4 10.0 65 1994-1998Asian Can Fabricated metal products Rexam Holding 3.0 17.0 175 1989-1990Asian Closures Fabricated metal products Rexam Holding 2.3 13.0 50 1989-1990CG Maersk Data EDP software Mærsk Data 4.2 16.2 450 1996-Coduras Exports Food and beverages Atlas-Stord 8.1 30.0 150 1993- *Convoy India Designing of ships Logimatic Software 0.5 3.1 6 1999-CRIIL EDP software Computer Resources Int. 5.0 14.0 60 1991- *D&H Secheron Migatronic Production of welding equip. Migatronic 1.4 8.0 31 2000-2002Dane Foods Butter cookies Kelsen Bakery 0.2 0.3 5 1995-2000Dania Food Food additives Palsgaard Industri 2.5 9.0 40 1991-2000DDE-ORG Office machinery/computers Dansk Data Elektronik 2.6 24.6 565 1993-DENIN Foods Extruded snack pellets Finn Lange 3.6 18.9 50 2000-2001Egmont Imagination India Publication of comic books Egmont 3.8 15.6 35 2001-Energy Solutions Int. IT equipment Energy Solutions International 1.6 4.3 30 1998-Engsko Kristone Mill stones Engsko 0.4 1.2 40 1995-

50
Fibcom Electrical machinery/equipment Tellabs Denmark 6.2 17.7 50.4 74 1994-Fowler Westrup (India) Machinery and equipment Westrup 3.1 2.6 17.4 85 1999-Fuller India Design/equip. f/cement plants Fuller 4.4 14.0 0 2000-Garware-Utzon Textiles N.P. Utzon 1.5 6.0 20 1995-1998Global Wool Alliance Textiles Bloch & Behrens 13.7 58.9 99.3 360 1994-Grundfos Pumps India Assembly/production of pumps Grundfos 2.1 40.5 30 1998-2002Gujarat Sidhee Cement Cement FLS Industries 13.2 175.0 400 1994-Indan Energy Pvt Ltd Windfarm San 0.7 0.9 4.4 2 2002-Indo-Dan Lampshades Furniture Erik Frederiksen Production 0.7 4.3 85 1997-IndoDane Textiles Textiles Vestergaard Frandsen 0.9 7.0 94 1994-Infrastr & Tech Consult. Consultancy and management Kampsax 0.2 6.8 80 2001-IRON Maxflow Machinery and equipment Maskinfabriken Iron 4.6 15.2 60 1995-2001Kampsax India Mapping Kampsax 1.5 9.7 11.3 20 1994-KE Burgmann India Production of expansion joints KE-Burgmann 3.4 5.2 33 2002-L&T-Ramboll Consultancy Rambøll 2.0 6.5 25 1997-LEC India Software EDP software Lec 1.9 9.0 50 1994-2000LICindia Engineering Energy Solutions International 0.6 1.8 20 1995-1998LK India Electrical equipment LK 1.9 6.7 19.6 200 1998-LM Glasfiber Non-metallic mineral products LM Glasfiber 12.0 31.0 130 1993-2002Marinplast Boat yard PF Marin Plast 0.5 0.9 5.0 40 1984-1988Mather Derby Machinery and equipment Derby 13.9 135.0 180 1991-1993MD-JK India Textiles Julius Koch International 0.4 2.5 40 1994-1998Pedershaab-ACME Machinery and equipment Pedershaab 0.6 4.7 30 1998-Pioneer Wincon Limited Electrical machinery/equipment Wincon West Wind 3.9 1.9 15.8 75 1996-Prism Cement Cement FLS Industries 31.3 1,087.0 600 1993-Procon EDP software Pro:Con 0.6 1.8 3.0 14 1996-Roulunds Codan Belts Rubber and plastic products Roulunds Fabriker 4.5 17.5 275 1992-Roulunds Codan Hoses Production of rubber hoses Roulunds Fabriker 4.2 30.9 50 1999-Roulunds Friction Brake pads & linings Roulunds Fabriker 3.0 22.2 123 1996-2002Sabroe India Machinery and equipment York Refrigeration 0.9 4.2 75 1992-1999Saurashtra Cement Cement FLS Industries 50.5 780.0 300 1996-Sividan Chemical industry Binadan 2.0 14.2 25 1996-1998Taparia Exports Food and beverages Quality Pellets 0.6 5.9 35 1996-1998Tellabs Software Production of software Tellabs Denmark 4.7 9.6 400 2001-TTK Mærsk Medical Medical/precision instruments Maersk Medical 15.2 57.0 300 1996-Venkateshwara Hatcheries Food processing Ovotec International 1.6 74.0 300 1994-Total 53 Projects 259.8 121.0 3,865.5 6,762
INDONESIABorncharter Fishing J. Lauritzen/Globe 0.0 1.0 1 1990-1999Cowi Computer and rel. activities Cowi 1.8 11.0 10 1984-1987Danindo Fishing J. Lauritzen 6.7 118.0 67 1989- *Dankaffe Food and beverages Niro 11.5 94.9 100 1992-1993P.T. Aalborg Industries Fabricated metal products Aalborg Industries 9.9 2.6 46.0 101 1994-P.T. Wahana Derby Coolers and freezers Derby 9.2 4.4 19.7 101 1992- *Total 6 Projects 39.2 7.0 290.6 380
IRANDyrup Paints Dyrup 0.6 1.2 20.0 400 1970-1977Total 1 Project 0.6 1.2 20.0 400
JORDANDJDC Dairy Arla Foods International 2.1 25.6 86.0 110 1980-1994Kemapco Fertilizers Kemira 3.3 50.0 729.5 160 2000-Total 2 Projects 5.4 75.6 815.5 270
MALAYSIAAalborg RCI Resources Lime stone quarry operation Aalborg Portland 7.8 22 2002-Aalborg RCI White Cement Production of white cement Aalborg Portland 85.5 321.5 143 2002-Bredan Fabricated metal products Senior Flexonics Bredan 0.4 1.0 4 1991-2000Checkerasia Machinery and equipment Systema & Checker 1.8 0.3 4.5 23 1991-2002Cimbria Far East Machinery and equipment Cimbria Unigrain 0.4 0.4 3.6 13 1992-1996Dan Software Computer and rel. activities Dan Software International 0.1 0.5 1 1993-1997Daneel Fishing Ole T. Kragh/Per Kragh 0.3 1.8 3 1991- *Dankaffe Food and beverages Niro 28.4 1.5 135.0 120 1993- *DDE Information technology Dansk Data Elektronik 1.0 1 1990-1991DZ Security Plastic cards DZ Holding 2.7 4.0 7.0 42 1990-1997Fibertex Nonwovens Textile fibres Fibertex 75.0 233.5 95 2002-Goldkist Poultry processing Cerekem 1.5 2.6 12.0 40 1986-1996Guthrie-DDE EDP software Dansk Data Elektronik 3.0 13.0 22 1991-1998Kualiti Alam Sewage and refuse disposal Krüger 0.0 1.0 4 1991-1999Kvik Wood products Kvik Holding 1.4 0.3 8.0 80 1989-1994Medicotest Medical/precision instruments Medicotest 2.1 5.3 52 1995-2000Niro Ceramic Granite tiles Niro 15.5 22.2 100.0 308 1988-1993Oriental Horticulture Agriculture and farming EAC (Malaysia) 4.9 1.3 13.0 1 1988-2002Pl. Masterbach Chemical industry Kunststof Kemi 0.6 5.0 15 1985-1987Pong Codan Marketing Marketing Codan Gummi 1.0 10 1989-1990Pong Codan Rubber Rubber and plastic products Codan Gummi 0.3 3.0 30 1988-1990RCI Marketing Trading of constr. material Aalborg Portland 10.7 11 2002-Roxul Asia Mineral wool Rockwool International 63.9 49.6 245.9 104 2000- #Scan Dairy & Food Food and beverages Niro 20.6 89.0 104 1992-2000Scanavionics Medical/precision instruments Scandinavian Avionics 1.1 4.0 5 1993-SCI Marketing Marketing of dry mortars Aalborg Portland 3.5 3 2002-
Activity/product Danish Partner(s) IFU Participation Total Investment Employment PeriodShares Loans
(DDK million) (DDK million) (DDK million) (Persons)

51
Sika Furniture Sika Møbler 0.3 2.0 100 1974-1982Skaarup&Jespersen Architects Skaarup & Jespersen 0.1 1.0 6 1990-Skim Coat Industries Dry mortars Aalborg Portland 7.1 27 2002-STAR Fishieries Fishing Skagen Fish Network 0.5 3.0 10 1996-1997Unico Kemi Chemical industry DK Kemi International 6.4 57.0 90 1988-1991Total 31 Projects 316.6 82.4 1,301.7 1,489
MALDIVESIPOH Investments Tourist Resort Seaplane Holding 42.3 84.0 0 1999-2001Island Beverages Maldives Bottled water HOH Water Technology 9.5 15 2002-Maldivian Air Taxi Air transport Air Service International 2.5 4.8 25 1992-1999Male Water & Sewerage Water supply HOH Water Technology 27.2 20.3 126.3 80 1995-Total 4 Projects 27.2 65.2 224.6 120
NEPALGhorka Brewery Brewery Danbrew 8.1 5.0 52.0 100 1988-Nedrill Water supply International Water Contractor 2.4 11.7 5 1989-Total 2 Projects 10.4 5.0 63.7 105
PAKISTANCamden Holding Rehab. of cement plant F.L. Smidth 0.6 1.6 1 2000- #Cattle Breeders Agriculture and farming APV Engineering 1.7 3.8 7.0 50 1982-2002Chakwal Cement FLS Industries 27.1 1,360.0 500 1995-2001Chemi Dansk Co. Textiles Dansk Transfertryk 3.8 24.5 30 1997-Dairyland Food and beverages APV Engineering 3.8 45.0 140 1987-1988Dane Foods Cookies Kelsen Bakery 4.5 15.0 124 1993-2002Fauji Cement Cement FLS Industries 42.9 970.0 400 1993-Fauji Fertilizer Co. Fertilizers Haldor Topsøe 29.2 1,600.0 1,550 1978-Fauji II Fertilizers Haldor Topsøe 39.5 2,145.0 300 1990-Maple Leaf Cement FLS Industries 35.1 1,125.0 390 1994-Milkpak Dairy APV Engineering 1.4 3.2 66.0 225 1979-1989Pepcem Cement Cement FLS Industries 32.9 1,000.0 250 1997-2001Total 12 Projects 222.5 7.0 8,359.1 3,960
PAPUA NEW GUINEAPacific Battery Batteries Alkaline Batteries 4.5 54.0 90 1985-1987Total 1 Project 4.5 54.0 90
PHILIPPINESAalborg White (Philipp.) Wholesale of white cement Aalborg Portland 0.7 2 2002-Atlas/Hi Cement Cement FLS Industries 12.6 425.0 260 1984-Davao Union Cement FLS Industries 23.8 750.0 300 1981-1996Drilling Corp. of Asia Construction Kampsax/Krüger 3.1 4.5 17.0 10 1981-1988DZ-Philippines Plastic cards DZ Holding 5 1992-2000JEDE Asianbakers Food and beverages B. Christensen Maskinfabrik 1.5 2.4 11.4 208 1996-2001Philcadan Furniture Philcadan 0.3 0.8 6.0 500 1975-1981Philmop Pulp and paper products Brdr. Hartmann/EAC 2.3 3.4 16.0 25 1976-1988Rotex Friction materials Roulunds Fabriker 0.3 0.3 4.0 25 1972-1987Summit Air transport Sterling 3.4 1.3 6.0 10 1975-1982Towi Furniture M. Krüger 0.5 6.1 8.0 210 1974-1987Unidex Clothing Unidex 0.3 9.7 25.0 1,060 1979-1992Vitarich Animal feed Cerekem 2.9 5.8 49.0 150 1980-1982Total 13 Projects 51.0 34.3 1,318.1 2,765
REPUBLIC OF KOREAKDDC Dairy Arla Foods International 33.4 20.5 107.9 108 1985-2001Kodas Animal feed Flemstofte Mads Amby 7.1 1.8 10.0 2 1985-1988Novenco Ventilation Novenco 1.5 7.0 12 1988-1988Total 3 Projects 42.0 22.3 124.9 122
SINGAPOREI.B.S. Construction Larsen & Nielsen/EAC 1.3 20.0 300 1973-1974Total 1 Project 1.3 20.0 300
SRI LANKAAsia Power Energy production/distribution B&W Scandinavian Contractor 9.9 372.0 60 1997-Bünger Machinery and equipment Bünger Engineering 1.0 20 1982-1987BWSC Lanka Service of power plants B&W Scandinavian Contractor 2.0 3.1 50 2001-C.W.Mackie & Co. Trade and distribution Aarhus Oliefabrik 13.2 7.8 154.1 3,120 1998- #Ceymac Rubber Co. Rubber products C.W. Mackie 33.0 321 1998- *Ceytra Limited Rubber products C.W. Mackie 6.6 115 1998-Elsteel Fabricated metal products Erik Løgstrup 5.0 29.3 340 1997-Korea Ceylon Footwear Manufacture of footwear C.W. Mackie 72.0 1,858 1998-Scan Products Holding Co. Production of squashes C.W. Mackie 13.5 65 1998-Serendib Coconut Products Dessicated coconuts C.W. Mackie 14.2 530 1998- *Silver Power Energy Sprout-Matador 0.5 2.0 20 1985-1987Skanko Lanka Textiles Skandinavisk Kokosvæveri 0.8 1.5 10.0 90 1987- *Total 12 Projects 24.4 16.3 710.8 6,589
Activity/product Danish Partner(s) IFU Participation Total Investment Employment PeriodShares Loans
(DDK million) (DDK million) (DDK million) (Persons)

52
Activity/product Danish Partner(s) IFU Participation Total Investment Employment PeriodShares Loans
(DDK million) (DDK million) (DDK million) (Persons)
THAILANDBeer Thai Brewery Carlsberg Int. 19.7 863.0 600 1992-2002Caretex Production of container liners Caretex 1.0 2.9 116 2002-Carlsberg Brewery Brewery Carlsberg Int. 19.7 750.0 600 1992-2002DZ Plastic cards DZ Holding 0.5 6.2 18.0 124 1985-1993Flux B. Grimm Electrical machinery/equipment Flux Transformerteknik 0.7 7.2 36 1995-1997Georg Jensen Thailand Production of jewellery Georg Jensen 20.0 30.0 450 2002-Nation Egmont Edutainment Publishing house Egmont 17.9 27.0 50 1999-P. C. Hose Rubber hoses Codan Gummi 0.3 2.0 11.0 30 1985-1994P. C. Rubber Rubber profiles Codan Gummi 3.6 13.0 410 1991-1994Penadansk Textiles Dansk Transfertryk 18.9 10.2 51.0 30 1997-Pongpara Rubber products Codan Gummi 1.4 3.6 8.0 410 1980-1987Premier Dairy Food Dairy Mejerigaarden Holding/Globe 1.8 1.3 8.0 15 1993-Quick-Cool Co. Fabricated metal products Brødrene Gram Invest 1.0 3.4 25 1997-Royal Scandinavia Jewelry Royal Scandinavia 3.0 11.0 30 1998-Scanthai Furniture M. Krüger 0.4 0.5 13.0 90 1975-1981Tropic Dane Ceramics and furniture Tropic Dane Trading 1.4 6.1 50 1996-2003 #Total 16 Projects 63.4 71.7 1,822.6 3,066
VIETNAMBodilsen Vietnam Wood garden furniture Bodilsen 6.1 17.7 340 2001-2002Hue Brewery Brewery Tuborg International 26.3 3.7 130.0 192 1994-KMC Vietnam Cultivation of root fruits Kartoffelmelcentralen 2.1 24.0 70 2001-MK-Rubico Wood products M. Krüger 5.9 40.0 120 1992-1994Orana Vietnam Ltd. Production of fruit juice Orana 1.0 4.2 25 2002-S.E. Asia Brewery Brewery Carlsberg Int. 35.8 91.0 120 1992-Watertech Vietnam GIS Services Watertech 0.2 0.8 20 2002-Total 7 Projects 77.4 3.7 307.7 887
YEMENMuus Feed mill Elias B. Muus 0.2 0.5 1.0 20 1976-1978Total 1 Project 0.2 0.5 1.0 20
TOTAL ASIA 218 PROJECTS 1,558.7 693.1 25,481.8 33,104
EUROPE
MALTAMellieha Hotels and restaurants Dansk Folkeferie 2.5 5.4 69.0 50 1975-1989Total 1 Project 2.5 5.4 69.0 50
TURKEYAytac Food and beverages APV Engineering 17.8 466.0 750 1994-2001DLF-Trifolium Agriculture and farming DLF-Trifolium 0.6 2.0 8 1994-1995Ege-Baltica Insurance Tryg-Baltica 12.5 16.0 40 1990-1992Entas Agriculture and farming KFK/Globe 27.2 1.5 250.0 230 1984-2002Golden Dolphin Hotels and restaurants DK Turkish Inv. 1.6 40.0 250 1973-1985Klimasan Coolers and freezers Derby 4.4 26.3 208 1992-2001Köytür Integrated Poultry Agriculture and farming No Danish partner 14.5 17.4 1,730.8 2,700 1988-Macka Ótelcilik A.S. Hotel SAS Hotels 38.0 168 2002-Parlar Clothing Minelli 8.8 26.0 90 1989-1993Radisson SAS Macka Hotel Hotel SAS Hotels 19.7 34.1 1 2002-Riegens Production of light fittings Riegens 1.4 5.0 20 1999-S & Q Mart Technical services S & Q Tech 0.3 2.0 3 1990-ScanBrid Agriculture and farming Scanbrid International 5.0 17.7 30 1993-1996Viking Pulp and paper products Papyrus 15.6 15.5 125.0 200 1969-1986Total 14 Projects 120.6 43.2 2,778.9 4,698
TOTAL EUROPE 15 PROJECTS 123.1 48.6 2,847.9 4,748
LATIN-AMERICA
CENTRAL AMERICA (REGIONAL)Mærsk Centr. America Fac. Transport related projects A.P. Møller 63.0 106.2 0 2001-Total 1 Project 63.0 106.2
ARGENTINAAilinco Sewage and refuse disposal Kommunekemi 12.1 26.3 113.3 81 1994-2000Dan Austral Fishing Norfo 3.4 10.0 70 1993-1999Euroamérica Harbour terminal J. Lauritzen 4.2 9.3 60.0 20 1992-1998Palle Westerby Machinery and equipment Westconsult 0.9 0.4 5.0 15 1986-2000PECORSA Energy production/distribution NEG Micon 0.6 1.7 5.0 3 1993-1999Total 5 Projects 17.7 41.0 193.3 189
BELIZEBelize Minerals Mining Svend Brorsen 0.6 0.5 4.0 15 1991-Total 1 Project 0.6 0.5 4.0 15
BOLIVIABera de Bolivia Fabricated metal products Paul Bergsøe/EAC 0.6 0.7 32.0 20 1976-1987Hielo Seco Chemical industry Hydrogas Danmark 2.9 3.6 16.0 25 1989-2002Total 2 Projects 3.4 4.4 48.0 45

53
BRAZILAalborg Industries Fabricated metal products Aalborg Industries 5.8 2.7 25.0 130 1991-Aalborg Pontin Fabricated metal products Aalborg Værft 11.3 1.7 30.7 80 1978-1984Biotropical Agriculture and farming Chr. Hansen 8.5 13.8 65 1988-1997Cáceres Florestal Forestry Dalhoff Larsen & Hornemann 10.8 8.6 138.0 350 1990-Capricórnio Florestal Nature park Verdensnaturfonden 0.7 3.7 12 1993-1996Caribersa Technical Service Provider Kampsax 2.9 0.2 8.4 83 2001-Danfoss do Brasil Machinery and equipment Danfoss 10.0 30 1987-1994Danfrio Refrigeration equipment Brødrene Gram 5.1 3.0 10.0 50 1972-1983Danica Nordeste Production of coldstore panels Danica Latin America 1.2 1.6 24 2001-Danica Tupiniquim Machinery and equipment Per Barke Nevermann 2.2 21.5 245 1992-Design 2000 do Brasil Furniture Danish Design Group 7.2 17.0 70 1996-1998FLS Comercio Cement machines FLS Industries 10.6 17.5 55.0 200 1975-1984Frio Grande do Norte Cold Store for Fruits J. Lauritzen 5.4 5.1 19.3 5 2000-Gerstenberg Machinery and equipment Gerstenberg & Agger 3.3 1.2 9.0 4 1989-1996Glunz & Jensen Electrical machinery/equip. Glunz & Jensen 2.0 25 1983-1983Grindsted Food and beverages Danisco Ingredients 13.3 1.1 30.0 30 1986-1993Hartm.-Mapol Montes Claro Pulp and paper products Hartmann-Mapol 85.0 100 1997-Hartmann-Mapol Pulp and paper products Brdr. Hartmann 39.4 344.4 500 1995-Hempel Tintas Paints Hempel 0.4 0.4 16.0 50 1970-1976Kongskilde Machinery and equipment Kongskilde Industries 0.8 1.5 7.0 50 1973-1981Mapol Pulp and paper products Brdr. Hartmann/EAC 11.4 4.9 57.0 400 1970-1986Multiwing Machinery and equipment F.S. Andersen 2.0 15.8 10 1979-1987Nordisk do Brasil Chemical industry Novo Nordisk 1.8 5.0 2 1984-1992Nordisk Timber Wood products Dalhoff Larsen & Hornemann 9.4 62.5 151 1994-2001Sabroe do Bahia Refrigeration equipment Sabroe do Brasil 1.0 7 1990-1993Sabroe Export Refrigeration equipment Sabroe do Brasil 1 1985-1997Sabroe Marine Service Refrigeration equipment Sabroe do Brasil 1.0 25 1991-1993Sabroe Montagens Refrigeration equipment Sabroe do Brasil 71 1992-1997Sabroe/York do Brasil Refrigeration equipment York Refrigeration 6.2 27.6 83.0 650 1981-Sul Americana Refrig. Refrigeration equipment Sabroe do Brasil 11.6 39.0 50 1997-1999Total 30 Projects 139.2 107.9 1,111.8 3,470
CHILEC.A. Holding Units f/controlled atmosphere J. Lauritzen 6.2 11.2 23.9 20 2000-CAC Controlled atmosphere J. Lauritzen (Chile) 8.9 2 2001- #Copenhagen Smokehouse Food and beverages Vendsyssel Denmark 0.7 4.5 40 1996-1999Sabroe de Chile Refrigeration equipment Sabroe do Brasil 1.8 2.9 25 1992-1997Segetrans Trucking J. Lauritzen 4.2 13.9 50 1994-1999Segetrans Transporte Trucking J. Lauritzen (Chile) 9.4 24.8 6 1999-Total 6 Projects 6.9 26.7 78.8 143
COLOMBIACementos Rioclaro Cement production FLS Industries 10.4 18.2 1,000.0 230 1983-1995Coldin Fishing Krüger 1.6 11.2 25 1987-1992Plumrose Madrileña Meat processing EAC 6.1 66.0 200 1995-1999Sabroe de Colombia Machinery and equipment Sabroe do Brasil 1.2 2.3 20 1997-1999Total 4 Projects 18.1 19.4 1,079.5 475
CUBADinaCarne Breeding of pigs DinaCuba Holding 4.8 29.0 25 2000-2001DinaFeed Feed mill DinaCuba Holding 1.3 16.0 25 1999-2001Total 2 Projects 6.0 45.0 50
DOMINICAN REP.Indulac Dairy Emidan 2.7 1.9 21.0 110 1971-1978Total 1 Project 2.7 1.9 21.0 110
ECUADORDan Química Chemical industry Rustfri Stålmontage 17.1 55.3 80.0 70 1979-1998Ecudina Agriculture and farming Holsted Tørrestation 5.1 17.3 26.7 20 1980-1986PECS-DESMI Oil pit cleaning De Smithske 3.3 13.2 46 1996-1998Scanform Construction Scan-Form 0.1 1.0 5 1980-1981Total 4 Projects 22.3 75.9 120.9 141
GUATEMALACementos Progreso Cement FLS Industries 59.5 855.0 700 1997-2002Total 1 Project 59.5 855.0 700
GUYANAGuyabreed Agriculture and farming Cerekem 2.4 10.7 35.0 15 1987-1995Total 1 Project 2.4 10.7 35.0 15
JAMAICAGolf Beach Hotels and restaurants H. Hansen & P. Pedersen 0.2 2.5 5.0 50 1970-1976Total 1 Project 0.2 2.5 5.0 50
MEXICOAlta Tecnologia Dairy Niro de Mexico 9.9 12.5 39.2 107 1994-1999Biblomodel Furniture B.C Inventar 5.5 27.0 181 1981-2002Carpur Feed lot Niro de Mexico 5.0 25.0 70 1993-
Activity/product Danish Partner(s) IFU Participation Total Investment Employment PeriodShares Loans
(DDK million) (DDK million) (DDK million) (Persons)

54
Danfoss de Mexico Compressors Danfoss 49.9 575.0 800 1996-GLL Mexico Production of speakers TC Group 13.2 30.0 81 2002-La Campiña Dairy Niro 12.7 95.0 270 1988-1991Lacpur Dairy Niro de Mexico 11.9 17.1 42.9 70 1993-Monica's Food Dairy Niro de Mexico 10.3 5.8 27.9 108 1994-1999Nordisk de Mexico Chemical industry Novo Nordisk 1.8 5.0 15 1984-1988Palmex Food ingredients Palsgaard Industri 3.1 6.0 11 1996-Pescado Chiapas Fishing/fish processing Atlas-DK 6.5 240.0 650 1982-1984Prolac Dairy Niro de Mexico 4.9 6.1 19.4 73 1995-2001Rosti de Mexico Plastic products Rosti 67.9 141.5 300 1998-Roulunds Mexico Fabrication and sale of rubber Roulunds Fabriker 24.4 42.5 100 2001-Sabroe de Mexico Refrigeration equipment Sabroe do Brasil 1.3 2.0 20 1991-1999Santa Lucía Vegetable oil refinery Aarhus Oliefabrik 30.6 339.3 300 1992-2002Total 16 Projects 71.7 228.8 1,657.6 3,156
NICARAGUAENISA Wind mill farm No Danish partner 0.4 0.7 5Total 1 Project 0.4 0.7 5 1998-
PANAMAMærsk Jupiter Oil exploration A.P. Møller 26.7 85.7 25 1994-1999Mærsk Mercury Oil exploration A.P. Møller 20.7 110.7 25 1994-1999Mærsk Sirius Oil exploration A.P. Møller 39.5 202.0 250 1997-2000PECS-DESMI Hold. Oil pit cleaning De Smithske 1.7 6.8 3 1996-1998 #Pedregal Power Co. Thermical Electricity Plant B&W Scandinavian Contractor 0.1 26.7 354.1 50 2001-Total 5 Projects 0.1 115.2 759.3 353
PARAGUAYCesusa Brewery Carlsberg Int. 12.0 0.2 70.0 91 1990-1996Total 1 Project 12.0 0.2 70.0 91
PERUAgroindustria Danper Agriculture and farming Wiik & Co. 0.1 1.0 50 1985-1988Danper Trujillo Asparagus processing Arne Hensel Berg 2.1 8.4 15.5 300 1991-Fima Machinery and equipment Atlas-Stord 8.6 266.3 500 1999-PAMIAL Procurement of guarantees Alfa-Laval Oil & Protein Tech. 0.0 43.2 5 2000-2002Sabroe de Peru Refrigeration equipment Sabroe do Brasil 1.3 5 1995-1997Segetrans Peru Trucking of fruit a.o. J. Lauritzen 0.5 2.2 5.7 20 2000-Total 6 Projects 2.7 19.1 333.0 880
URUGUAYAstra Fishing/fish processing J. Lauritzen 14.9 26.2 280.0 1,200 1982- *Cosmos Trawl Production of trawls Cosmos Trawl/Randers Reb 0.3 2.8 4 1999-Gley Cheese powder Lactosan 5.0 20.0 10 1991-1996Mvd Int. Container Term. Port terminal A.P. Møller 38.9 193.0 80 1998-2000Oceanica Fish processing J. Lauritzen 10.0 600 1987-1991Total 5 Projects 14.9 70.4 505.8 1,894
VENEZUELAAFI Pig breeding Plumrose Latinoamericana 15.5 100.8 42 1998-Haustrup Venezolana Fabricated metal products Rexam Holding 6.6 5.7 84.0 105 1980-1994PECS-DESMI-CPVEN Oil pit cleaning De Smithske 0.7 5 1997-1998 #Plumrose Latinoamericana Processed meat products EAC 40.1 920.7 3,000 1996-Total 4 Projects 22.1 45.9 1,106.2 3,152
TOTAL LATIN AMERICA 97 PROJECTS 342.9 893.2 8,136.2 14,934
GRAND TOTAL 474 PROJECTS 2,598.4 2,522.9 50,217.8 78,196
IFU participation is the accumulated sum in DKK of IFU’s contracted investments in all project companies since project start.
The list includes active projects as well as projects where IFU’s participation has been terminated. Consequently,
the figures cannot be related to the figures in the balance sheet at year end.
Investment in shares includes overrun commitments, and investment in loans includes guarantees.
Total investment is the total investment in all project companies in DKK as originally foreseen at the
appraisal stage. The number of employees is the number expected to be employed at the appraisal stage.
* Operation discontinued
# Investment through holding company
Activity/product Danish Partner(s) IFU Participation Total Investment Employment PeriodShares Loans
(DDK million) (DDK million) (DDK million) (Persons)

PROJECT DEVELOPMENT DEPARTMENT
Morten ChristiansenDepartment Director
Rena ChenInvestment Officer
Bjørn JakobsenHead of Secretariat
Jens RixenSenior Legal Adviser
Michael HedegaardInvestment Officer
Erik LarssonInvestment Officer
Michael Wedel SørensenEnvironmental Adviser
Søren HeilmannSystem Administrator (IT)
Bente LarsenChief Librarian
Torben KjærInvestment Officer
EXECUTIVE BOARD
Sven RiskærManaging Director
Jørgen Dan JensenDeputy Managing Director *(Until 30 April 2003)
Frank Norman LarsenDeputy Managing Director
Niels Gravgaard LaursenDepartment Director
Lone Bjørn HansenChief Accountant
Max KruseSenior Investment Officer
INVESTMENT MANAGEMENT DEPARTMENT
Torben HussDepartment Director
Brian M. AndersenInvestment Officer
Jens BayerSenior Investment Officer
Malene K. KristensenInvestment Officer
Martin M. KristensenSenior Investment Officer
Tatiana M. ManzonInvestment Officer
Hans-Jørgen NyegaardInvestment Officer
Manish MaheshwariInvestment Officer
Peer MunkholtSenior Investment Officer
Svend J. HeinekeDepartment Director
Steen LarsenInvestment Officer
Jørn Fredsgaard SørensenInvestment Officer
Henrik JepsenDepartment Director
SECRETARIAT COMM./INFO/SERVICE UNIT LEGAL UNIT ENVIRONMENTAL UNIT IT UNIT
Kenneth KristiansenSystem Administrator (IT)
Morten K. JensenFinance Officer
ADVISERS
Mike Benn Pretoria, South Africa
Riyaz BokhariLahore, Pakistan
Nigel BremnerNairobi, Kenya
Roberto FernandezMontevideo, Uruguay
Uffe Bundgaard-JørgensenDenmark (Facilitator)
Meriç GemayelIstanbul, Turkey
Jens Lage HansenCuritiba, Brazil
Bjarne Rørbæk JensenSão Paulo, Brazil
Henrik de JonquièresDenmark (Facilitator)
Peter KilianMexico City, Mexico
Jens KronborgSantiago de Chile, Chile
Claus E. MadsenBuenos Aires, Argentina
Vipin MalikNew Delhi, India
Stephen PotterLondon, United Kingdom
Tonny Bech PedersenDenmark
Mikael OlufsenDenmark (Facilitator)
Peter RasmussenSuzhou, China (Facilitator)
José M. RuisánchezWashington D.C., USA
Poul WeberBangkok, Thailand
BEIJING, CHINA
Martin RømerInvestment Officer
Ib AlbertsenSenior Regional Co-ordinator(Asia)
Kesavan NarayananInvestment Officer
Lucien WangBeijing, China
Sudhir DravidInvestment Officer
Deepa HingoraniResident Representative
Armando MartinezMexico City, Mexico
Niels EvendtResident Representative
JOHANNESBURG, SOUTH AFRICA
IFU OFFICES
Elisabeth ScheinemannInvestment Officer
Natalia SvejgaardInvestment Officer
Henning WongInvestment Officer
Birgitte Christensen Chief Archivist
ARCHIVES
Tayengwa MasawiInvestment Officer
Hong JiangResident Representative
Manmohan MalhotraIT-officer
Jan E. Ditlevsen Denmark (Facilitator)
Paul CardwellSan José, Costa Rica
Hemming JørgensenLuxemburg (Facilitator)
Faridah Abdul KadirSelangor, Malaysia
Gerrie Muller Sandton, South Africa (Facilitator)
Sridhar SampathChennai (Madras), India
Bendt StarupSingapore (Facilitator)
Farouk NasserCairo, Egypt
Per E. L. OlsenSenior Regional Adviser
ADVISER OFFICES
Kodjo AziagbéSenior Regional Adviser
LOMÉ, TOGO SÃO PAULO, BRAZIL
Johannes Huus BoghDenmark
*As of 1 May 2003, Senior Adviser to IFU
CORPORATE ADMINISTRATION DEPARTMENT
SPECIAL OPERATIONS DEPARTMENT
FINANCE DEPARTMENT
SUPERVISORY BOARDJohannes Poulsen (Chairman)Agnete Raaschou-Nielsen (Deputy Chairman)Lars AndersenSigurd Ø. AndersenElsebeth Budolfsen Lars Kolte Kjeld Ranum Michael Rasmussen Carsten Staur Karen Wermuth
EXECUTIVE BOARDSven Riskær (Managing Director)Jørgen Dan Jensen (Deputy Managing Director)Frank Norman Larsen (Deputy Managing Director)
COMPANY AUDITORSDeloitte & Touche Statsautoriseret Revisionsaktieselskab
IFU THE INDUSTRIALIZATION FUND FOR DEVELOPING COUNTRIES
BREMERHOLM 4 DK-1069 COPENHAGEN K DENMARK TEL +45 33 63 75 00 FAX +45 33 32 25 24 [email protected] WWW.IFU.DK
NEW DELHI, INDIA

DA
NI
SH
I
NT
ER
NA
TI
ON
AL
I
NV
ES
TM
EN
T
FU
ND
S,
C
OP
EN
HA
GE
N,
A
PR
IL
2
00
3 T H E I N D U S T R I A L I Z A T I O N F U N D F O R D E V E L O P I N G C O U N T R I E S
DANISH INTERNATIONAL INVESTMENT FUNDS:
ANNUALREPORT2002
THE INDUSTRIALIZATION FUND FOR DEVELOPING COUNTRIES (IFU)Bremerholm 4 DK-1069 Copenhagen KDenmarkTel + 45 33 63 75 00Fax + 45 33 32 25 24E-mail: [email protected] · www.ifu.dk
DANISH INTERNATIONAL INVESTMENT FUNDS
IFU-SÃO PAULO (ADVISER OFFICE)Rua Riachuelo 460Edificio Trade Tower, Office 1105CEP 18035-330 Sorocaba-São PauloBrazilTel + 55 15 231 4442Fax + 55 15 231 4442E-mail: [email protected]
IFU-JOHANNESBURGLancaster Gate, ground floor Hyde Park Lane, Hyde Park 2196JohannesburgRepublic of South AfricaTel + 27 11 325 19 40Fax + 27 11 325 19 44E-mail: [email protected]
IFU-BEIJINGRoom 1808, China Travel Service TowerNo. 2, Beisanhuan East RoadBeijing 100028ChinaTel + 86 10 6460 9797Fax + 86 10 6460 9799E-mail: [email protected]
DANISH INTERNATIONAL INVESTMENT FUNDSDanish International Investment Funds is the umbrella term for IFU, IØ and IFV. Each of the Funds operates in its specific geographical sphere:
� IFU in developing countries with a per capita income below the World Bank’s upper limit for new loans (USD 5,185 in the year 2003)
� IFV in developing countries with a per capita income above the same limit� IØ in Central and Eastern Europe and in the Asian part of the former Soviet Union
EUROPEAN CO-OPERATIONIFU, IØ and IFV are members of the European Development Finance Institutions (EDFI). Besides the Danish Funds, there are 12 othermembers. They are all bilateral finance institutions offering capital for the development of the private sector in developing countriesand countries that are in a transition process towards market economy. The objective of EDFI is to further co-operation and to safe-guard common interests in relation to the European Commission and its institutions, including the European Investment Bank (EIB).
IFU-NEW DELHISPWD Building, 2nd floor14 A, Vishnu Digambhar Marg (Rouse Avenue Lane)New Delhi – 110002IndiaTel + 91 11 2321 7160Fax + 91 11 2321 7167E-mail: [email protected]
●■
◆
▲
●
●
●
▲●
●
●
●
●●
●●
●
●
◆
●
●
●
●
●
●◆●
●
◆
●
●
●
●
●
●
Text consultant Jesper Jespersen (TextPartner) · Photos Flemming Jeppesen · Layout Linda Balle · Print Trekroner Tryk · ISSN 0901-6171 541 422Printed Matter
IFU-LOMÉ (ADVISER OFFICE)21, rue du Chemin de FerB.P. 7373 LoméTogoTel + 228 221 78 07Fax + 228 221 75 13E-mail: [email protected]
◆
●
●
■ HEAD OFFICE Copenhagen
◆ OFFICES Beijing Johannesburg Moscow New Delhi Warsaw
▲ ADVISER OFFICES São Paulo Togo
● ADVISERS Bangkok Beijing Bucharest Budapest Buenos Aires Cairo Chennai CopenhagenIstanbul Lahore London Luxemburg Mexico City Montevideo Moscow Nairobi New DelhiPretoria San Jose Sandton Santiago de Chile São Paulo Selangor Seoul Singapore SuzhouTallinn Vilnius Washington D.C.


