Indicators for Measuring Competitiveness in Tourism: A Guidance ...

New Brunswick Tourism Indicators Summary Report 2013September 2014

New Brunswick Tourism Indicators Summary Report 2013 September, 2014
Published by:
Province of New Brunswick P.O. Box 6000 Fredericton, New Brunswick
Images: Department of Tourism, Heritage and Culture, New Brunswick, Canada
9778

Preface . . . . . . . . . . . . . . . . . . . . . . . . . . . . . . . . . . . . 1
2013 New Brunswick Tourism Season Summary . . . . . . . . . . 2
The Importance of Tourism in the New Brunswick Economy. . . 3
Visits in New Brunswick. . . . . . . . . . . . . . . . . . . . . . . . . . 5
Quarterly Visits . . . . . . . . . . . . . . . . . . . . . . . . . . . . . . . . 5
Monthly Domestic Visits . . . . . . . . . . . . . . . . . . . . . . . . . . 6
Trip Reasons . . . . . . . . . . . . . . . . . . . . . . . . . . . . . . . . . . 6
Mode of Transportation . . . . . . . . . . . . . . . . . . . . . . . . . . . 7
United States Border Crossings . . . . . . . . . . . . . . . . . . . . . 8
Airport Passengers. . . . . . . . . . . . . . . . . . . . . . . . . . . . . 8
Cruise Calls . . . . . . . . . . . . . . . . . . . . . . . . . . . . . . . . . 9
New Brunswick Accommodations . . . . . . . . . . . . . . . . . . . 10
Provincial Park Campgrounds . . . . . . . . . . . . . . . . . . . . . . 12
Attractions Attendance . . . . . . . . . . . . . . . . . . . . . . . . . . 14
Provincial Visitor Information Centres . . . . . . . . . . . . . . . . . 15
Appendix A: New Brunswick Tourism Indicator Definitions . . . . . . . . . . . . 16
Appendix B: Statistics Canada Travel Surveys . . . . . . . . . . . . . . . . . . . . 18
Table of Contents


0
500,000
1,000,000
1,500,000
2,000,000
2,500,000
3,000,000
3,500,000Visits
2013p2012201120102009200820072006900,000,000
985,714,500
1,071,429,000
1,157,142,500
1,242,857,000
1,328,571,500
1,414,286,000
1,500,000,000Spending
0
200
400
600
800
1000
1200
1400
Spending($ millions)
0
500
1000
1500
2000
2500
3000
3500
Visits(thousands)
2013p2012201120102009200820072006
11
The New Brunswick Department of Tourism, Heritage and Culture collects and reports on a monthly basis provincial tourism indicators including accommodation occupancy, provincial park campground occupancy, provincial visitor information centre counsels, and attraction visits.
The Department is also a partner in Statistics Canada’s core travel surveys, to provide estimates of visitor spending and the volume of visits in New Brunswick. Note that 2012 is the most recent reference year available from the Statistics Canada travel survey data. Further, no direct comparisons to previous years are possible due to recent methodological changes in the domestic travel survey (the Travel Survey of Residents of Canada). For more information on Statistics Canada’s travel surveys and changes, please refer to Appendix B: Statistics Canada Travel Surveys.
This year-in-review report summarizes all of these tourism indicators, to inform business planning for tourism development projects and marketing activities.
PrefaceTrends in Visits and Visitor Spending in New BrunswickWith recent methodological changes causing difficulties in directly comparing estimates from Statistics Canada travel surveys between years, Statistics Canada has produced revision factors to bridge the breaks in the time series (see Appendix B).
The following figure depicts the volume of visits of one or more nights in New Brunswick, and the total value of visitor spending, from 2006 to 2012 based on the revision factors for the Travel Survey of Residents of Canada, and the International Travel Survey.
Further, preliminary estimates for 2013 have been included, based on the Conference Board of Canada’s Autumn 2013 Travel Markets Outlook.
Figure 1: Trends in visits of one or more nights and total visitor spending from 2006 to 2012, and preliminary 2013 estimates. Source: New Brunswick Department of Tourism, Heritage and Culture, Statistics Canada (2014) TSRC 2011 Revision Factors, Statistics Canada (2006-2012) International Travel Survey, Conference Board of Canada (Autumn 2013) Travel Markets Outlook
2 3
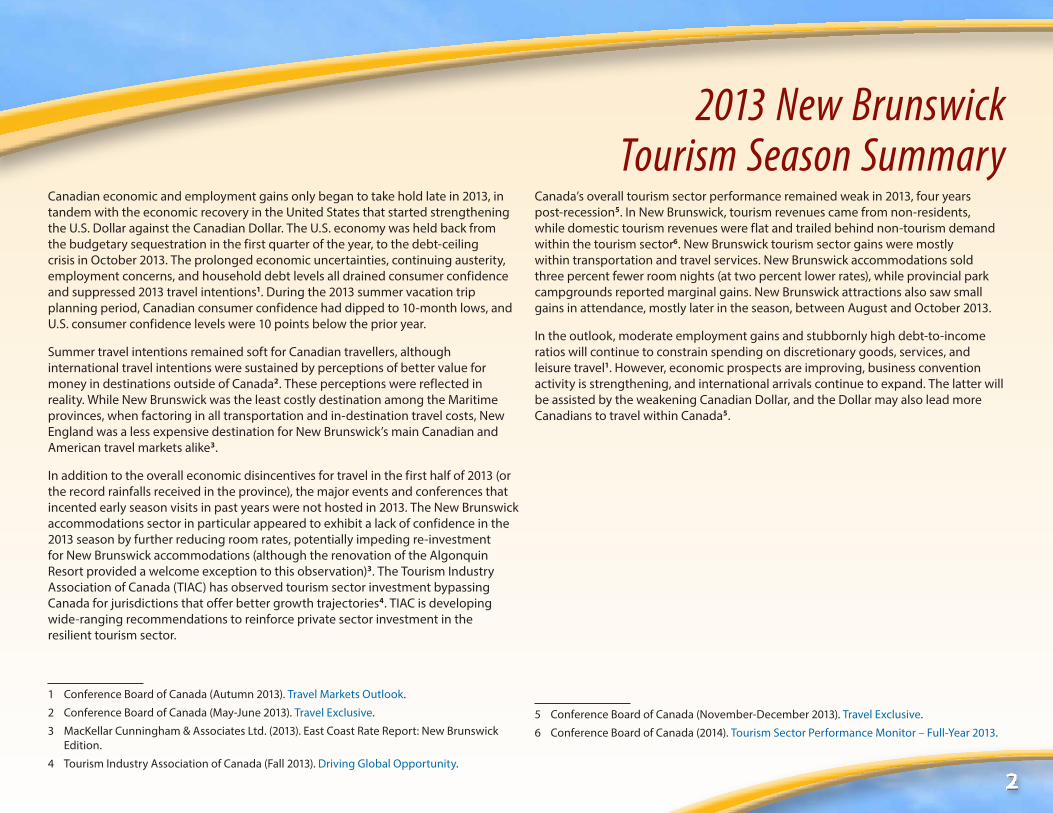
Canadian economic and employment gains only began to take hold late in 2013, in tandem with the economic recovery in the United States that started strengthening the U.S. Dollar against the Canadian Dollar. The U.S. economy was held back from the budgetary sequestration in the first quarter of the year, to the debt-ceiling crisis in October 2013. The prolonged economic uncertainties, continuing austerity, employment concerns, and household debt levels all drained consumer confidence and suppressed 2013 travel intentions1. During the 2013 summer vacation trip planning period, Canadian consumer confidence had dipped to 10-month lows, and U.S. consumer confidence levels were 10 points below the prior year.
Summer travel intentions remained soft for Canadian travellers, although international travel intentions were sustained by perceptions of better value for money in destinations outside of Canada2. These perceptions were reflected in reality. While New Brunswick was the least costly destination among the Maritime provinces, when factoring in all transportation and in-destination travel costs, New England was a less expensive destination for New Brunswick’s main Canadian and American travel markets alike3.
In addition to the overall economic disincentives for travel in the first half of 2013 (or the record rainfalls received in the province), the major events and conferences that incented early season visits in past years were not hosted in 2013. The New Brunswick accommodations sector in particular appeared to exhibit a lack of confidence in the 2013 season by further reducing room rates, potentially impeding re-investment for New Brunswick accommodations (although the renovation of the Algonquin Resort provided a welcome exception to this observation)3. The Tourism Industry Association of Canada (TIAC) has observed tourism sector investment bypassing Canada for jurisdictions that offer better growth trajectories4. TIAC is developing wide-ranging recommendations to reinforce private sector investment in the resilient tourism sector.
1 Conference Board of Canada (Autumn 2013). Travel Markets Outlook.
2 Conference Board of Canada (May-June 2013). Travel Exclusive.
3 MacKellar Cunningham & Associates Ltd. (2013). East Coast Rate Report: New Brunswick Edition.
4 Tourism Industry Association of Canada (Fall 2013). Driving Global Opportunity.
2013 New Brunswick Tourism Season Summary
Canada’s overall tourism sector performance remained weak in 2013, four years post-recession5. In New Brunswick, tourism revenues came from non-residents, while domestic tourism revenues were flat and trailed behind non-tourism demand within the tourism sector6. New Brunswick tourism sector gains were mostly within transportation and travel services. New Brunswick accommodations sold three percent fewer room nights (at two percent lower rates), while provincial park campgrounds reported marginal gains. New Brunswick attractions also saw small gains in attendance, mostly later in the season, between August and October 2013.
In the outlook, moderate employment gains and stubbornly high debt-to-income ratios will continue to constrain spending on discretionary goods, services, and leisure travel1. However, economic prospects are improving, business convention activity is strengthening, and international arrivals continue to expand. The latter will be assisted by the weakening Canadian Dollar, and the Dollar may also lead more Canadians to travel within Canada5.
5 Conference Board of Canada (November-December 2013). Travel Exclusive.
6 Conference Board of Canada (2014). Tourism Sector Performance Monitor – Full-Year 2013.

2 3
Tourism is critical to New Brunswick’s culture, heritage, arts, recreation, and entertainment industries, and it also contributes significantly to New Brunswick’s service industries including transportation and travelling services, accommodations, and food and beverage services.
These industries comprise the tourism sector. In 2012, 30,220 employees worked in the tourism sector, representing 8.6% of New Brunswick’s labour force7. Across New Brunswick, there were 2,929 tourism sector business locations in 20128.
Visits in the province of New Brunswick in 2012 contributed an estimated $1.1 billion in tourism-related spending on accommodations, restaurants, shopping, travel, and travel activities9. Non-resident visitor spending was estimated at $543 million in 2012. The total impact of this visitor spending on provincial GDP has been estimated at $696 million, representing 2.4% of provincial GDP (see Table 1)10. This estimated tourism share of provincial GDP ranks with the primary industries of agriculture, forestry, and fishing.
This economic activity sustained an estimated 17,162 full-time equivalent jobs (FTEs) in 201210. New Brunswick jobs sustained by tourism extend beyond the tourism sector itself, as tourism demand must also be supplied by New Brunswick’s retail and manufacturing industries.
Visitor spending also benefited New Brunswick’s provincial and municipal governments through estimated tax revenues of $99 million and $16 million, respectively, in 201210. This allows for further investment in culture and recreation facilities that benefit the residents of New Brunswick, and provides incremental funding to support education, health care, and other vital programs.
7 Source: Canadian Tourism Human Resource Council
8 Source: Statistics Canada Business Register (June 2012). Location counts are of active businesses within the 29 industry groups that are part of the Canadian Tourism Satellite Account, and have corporate income tax (T2) accounts and GST accounts with annual gross incomes exceeding $30,000.
9 Source: Statistics Canada (2012). Travel Survey of Residents of Canada, and International Travel Survey
10 Source: New Brunswick Department of Tourism, Heritage and Culture
The Importance of Tourism in the New Brunswick Economy
20102009
Shopping / Retail
11%
5%
10%
21%
14%
17%
21%
Recreation / Entertainment
Groceries
Restaurants
Transportation
Vehicle Operation / Fuel
Accommodations
000’s
000’s
20102009
Overseas
Other United States
Mid-Atlantic States
New England States
Western Canada
Ont.QuéAtlantic Canada
NBTotal
Q4
Q3
Q2
Q1
317,800149,100
229,400
706,900
0
50
100
150
200
250
300
350
400
DecNovOctSeptAugJulJunMayAprMarFebJan
33% 48%
4%9%4%
Train 1%
RVs 1%
Commercial Airline 6%
Rented Automobile 4%
Private Automobile 87%
Bus 1%
0
500
1,000
1,500
2,000
2,500
3,000
old chart
old chart
BusinessPersonal
Vacation VFR
Shopping 2%Conferences & Conventions
Figure 2: Categorized 2012 non-resident visitor spending in New Brunswick on visits of one or more nights. Source: Statistics Canada, New Brunswick Department of Tourism, Heritage and Culture

4 5
New Brunswick Tourism Economic Indicator 2012
Total visitor spending $1,117,854,000
Non-resident visitor spending $542,951,000
Tourism GDP $696,014,000
% of Provincial GDP 2.4%
Employment
Total tourism sector businesses 2,929
Total tourism sector employment 30,220
% of provincial labour force 8.6%
FTEs sustained by tourism 17,162
Government revenue attributable to tourism
Federal taxes $158,368,000
Provincial taxes $99,207,000
Municipal taxes $16,063,000
Table 1: Tourism sector employment and economic measures. Source: Statistics Canada, Canadian Tourism Human Resource Council, New Brunswick Department of Tourism, Heritage and Culture

OverseasOther United States
Mid-Atlantic
States
New England
States
Western Canada
OntarioQuébecAtlantic Canada
New Brunswick
Total
0
100,000
200,000
300,000
400,000
500,000
600,000
DecNovOctSeptAugJulJunMayAprMarFebJan
0
500,000
1,000,000
1,500,000
2,000,000
2,500,000
3,000,000
20102009
Shopping / Retail
11%
5%
10%
21%
14%
17%
21%
Recreation / Entertainment
Groceries
Restaurants
Transportation
Vehicle Operation / Fuel
Accommodations
000’s
000’s
20102009
Overseas
Other United States
Mid-Atlantic States
New England States
Western Canada
Ont.QuéAtlantic Canada
NBTotal
Q4
Q3
Q2
Q1
317,800149,100
229,400
706,900
0
50
100
150
200
250
300
350
400
DecNovOctSeptAugJulJunMayAprMarFebJan
33% 48%
4%9%4%
Train 1%
RVs 1%
Commercial Airline 6%
Rented Automobile 4%
Private Automobile 87%
Bus 1%
0
500
1,000
1,500
2,000
2,500
3,000
old chart
old chart
BusinessPersonal
Vacation VFR
Shopping 2%Conferences & Conventions
4 5
In 2012, New Brunswick welcomed nearly three million visits of one or more nights from New Brunswick residents on out-of-town trips, from other parts of Canada, from the United States, and from overseas (see Figure 3).
Figure 3: Visits of one or more nights in New Brunswick, by region of origin. Source: Statistics Canada (2012). Travel Survey of Residents of Canada, and International Travel Survey
Visits in New BrunswickQuarterly VisitsQuarterly non-resident overnight visits to New Brunswick reflecting the seasonality of New Brunswick tourism in 2012 are depicted in Figure 4.
Figure 4: Quarterly non-resident visits of one or more nights in New Brunswick in 2012. Source: Statistics Canada (2012). Travel Survey of Residents of Canada, and the International Travel Survey

OverseasOther United States
Mid-Atlantic
States
New England
States
Western Canada
OntarioQuébecAtlantic Canada
New Brunswick
Total
0
100,000
200,000
300,000
400,000
500,000
600,000
DecNovOctSeptAugJulJunMayAprMarFebJan
0
500,000
1,000,000
1,500,000
2,000,000
2,500,000
3,000,000
20102009
Shopping / Retail
11%
5%
10%
21%
14%
17%
21%
Recreation / Entertainment
Groceries
Restaurants
Transportation
Vehicle Operation / Fuel
Accommodations
000’s
000’s
20102009
Overseas
Other United States
Mid-Atlantic States
New England States
Western Canada
Ont.QuéAtlantic Canada
NBTotal
Q4
Q3
Q2
Q1
317,800149,100
229,400
706,900
0
50
100
150
200
250
300
350
400
DecNovOctSeptAugJulJunMayAprMarFebJan
33% 48%
4%9%4%
Train 1%
RVs 1%
Commercial Airline 6%
Rented Automobile 4%
Private Automobile 87%
Bus 1%
0
500
1,000
1,500
2,000
2,500
3,000
old chart
old chart
BusinessPersonal
Vacation VFR
Shopping 2%Conferences & Conventions
6 7
Monthly Domestic VisitsMonthly visits of one or more nights in New Brunswick by Canadian residents (including New Brunswick residents) are depicted in Figure 5.
Figure 5: Monthly visits of one or more nights in New Brunswick by Canadian residents. Source: Statistics Canada (2012). Travel Survey of Residents of Canada
Trip ReasonsAccording to Statistics Canada’s travel surveys, main trip reasons for New Brunswick visits of one or more nights break down as illustrated in Figure 6. The majority of New Brunswick visits in 2012 were for visiting friends and relatives, or for vacation. Meetings, conferences, conventions, and non-routine business trips represented 13% of main trip reasons. Non-routine shopping trips, personal trips, and trips for educational study were among the 6% of other main trip reasons reported for overnight visits to New Brunswick in 2012.
Figure 6: Main trip reasons for visits of one or more nights in New Brunswick. Source: Statistics Canada (2012). Travel Survey of Residents of Canada, and the International Travel Survey

20102009
Shopping / Retail
11%
5%
10%
21%
14%
17%
21%
Recreation / Entertainment
Groceries
Restaurants
Transportation
Vehicle Operation / Fuel
Accommodations
000’s
000’s
20102009
Overseas
Other United States
Mid-Atlantic States
New England States
Western Canada
Ont.QuéAtlantic Canada
NBTotal
Q4
Q3
Q2
Q1
317,800149,100
229,400
706,900
0
50
100
150
200
250
300
350
400
DecNovOctSeptAugJulJunMayAprMarFebJan
33% 48%
4%9%4%
Train 1%
RVs 1%
Commercial Airline 6%
Rented Automobile 4%
Private Automobile 87%
Bus 1%
0
500
1,000
1,500
2,000
2,500
3,000
old chart
old chart
BusinessPersonal
Vacation VFR
Shopping 2%Conferences & Conventions
6 7
Mode of TransportationNinety-one percent of Canadian residents visiting in New Brunswick for one or more nights travelled by car, as of 2012 (see Figure 7). Statistics Canada’s International Travel Survey reports only mode of entry into Canada rather than primary mode of transportation while on trips, but American transportation patterns are comparable to Canadian resident visitors to New Brunswick.
Figure 7: Primary mode of transportation for trips by Canadian residents visiting in New Brunswick for one or more nights. Source: Statistics Canada (2012). Travel Survey of Residents of Canada

8 9
United States Border CrossingsNew Brunswick border crossings observed a 1% decrease in U.S. resident auto trips of one or more nights in 2013 as compared to 2012, and a 9% decrease in same-day trips (see Table 2).
New Brunswick border crossings saw a 4% decrease in the number of Canadians returning from U.S. auto trips of one or more nights in 2013, and a 5% decrease in same-day trips. Declines in trips of one or more nights began in the second half of 2013, coinciding with the beginning of the decline in the value of the Canadian Dollar relative to the U.S. Dollar.
United States resident border crossings into New Brunswick by auto 2011 2012 2013
% Change 2013 vs. 2012
Same-day trips 651,149 616,015 561,469 -9%
One or more nights 237,450 233,705 231,668 -1%
Canadian residents returning through New Brunswick border crossings by auto
Same-day trips 3,215,748 3,285,316 3,123,060 -5%
One or more nights 503,946 519,782 500,254 -4%
Table 2: United States and Canadian residents crossing New Brunswick borders by automobile. Source: Statistics Canada International Travel Statistics
Airport PassengersThe number of passengers travelling through New Brunswick’s three major airports increased by 6% in 2013, continuing from the 5% increase observed in 2012 (see Table 3).
New Brunswick air passenger movements 2011 2012 2013
% Change 2013 vs. 2012
Total (Fredericton, Moncton, and Saint John airports)
1,061,075 1,114,502 1,181,746 +6%
Table 3: Total passenger movements through New Brunswick’s three major airports. Source: Transport Canada, Advanced enplaned and deplaned passenger movements – Atlantic Region Airports
8 9
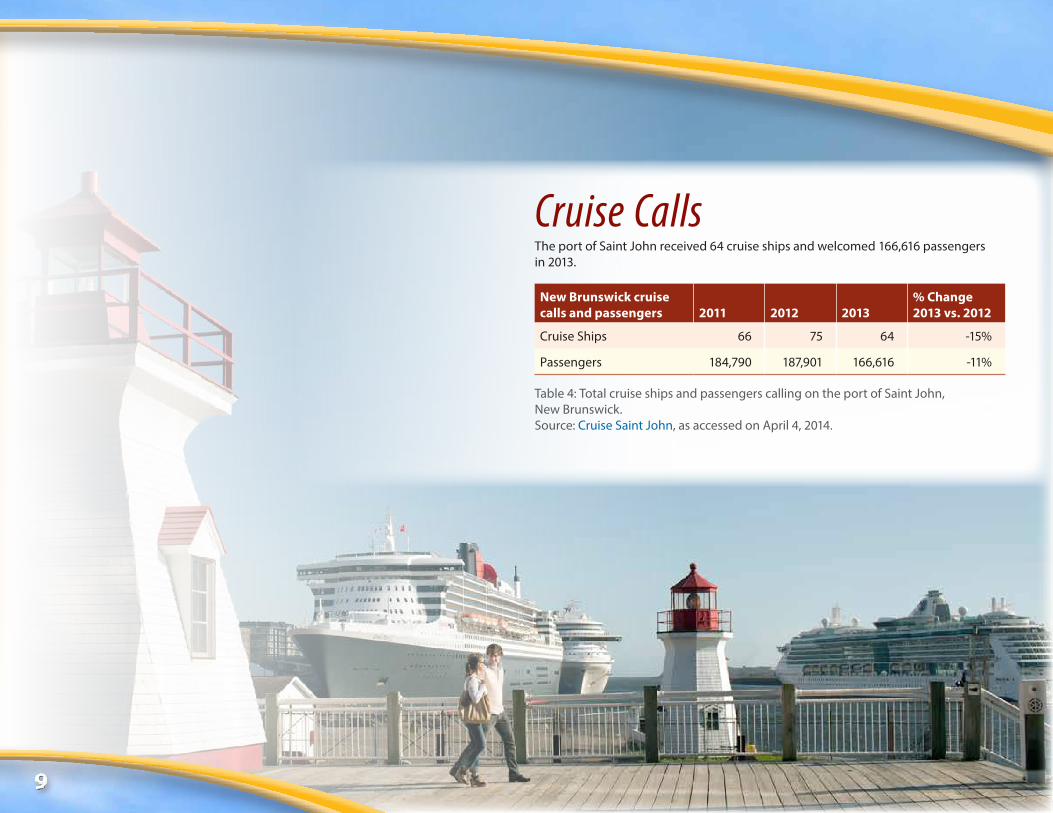
Cruise CallsThe port of Saint John received 64 cruise ships and welcomed 166,616 passengers in 2013.
New Brunswick cruise calls and passengers 2011 2012 2013
% Change 2013 vs. 2012
Cruise Ships 66 75 64 -15%
Passengers 184,790 187,901 166,616 -11%
Table 4: Total cruise ships and passengers calling on the port of Saint John, New Brunswick. Source: Cruise Saint John, as accessed on April 4, 2014.

10 11
New Brunswick accommodations sold 1.6 million room nights in 2013, representing a 3% decline compared to 2012. The number of room nights available, as reported by accommodations included in the provincial occupancy reporting program, also declined by 5% in 2013. This decline in room nights resulted in a one percentage point increase in the provincial accommodation occupancy rate (see Table 5).
The average daily room rate in New Brunswick, as observed in the month of August, declined by 2% to $110.88. New Brunswick accommodations offered room rates below the Atlantic Canadian average, and well below New England rates in 20133.
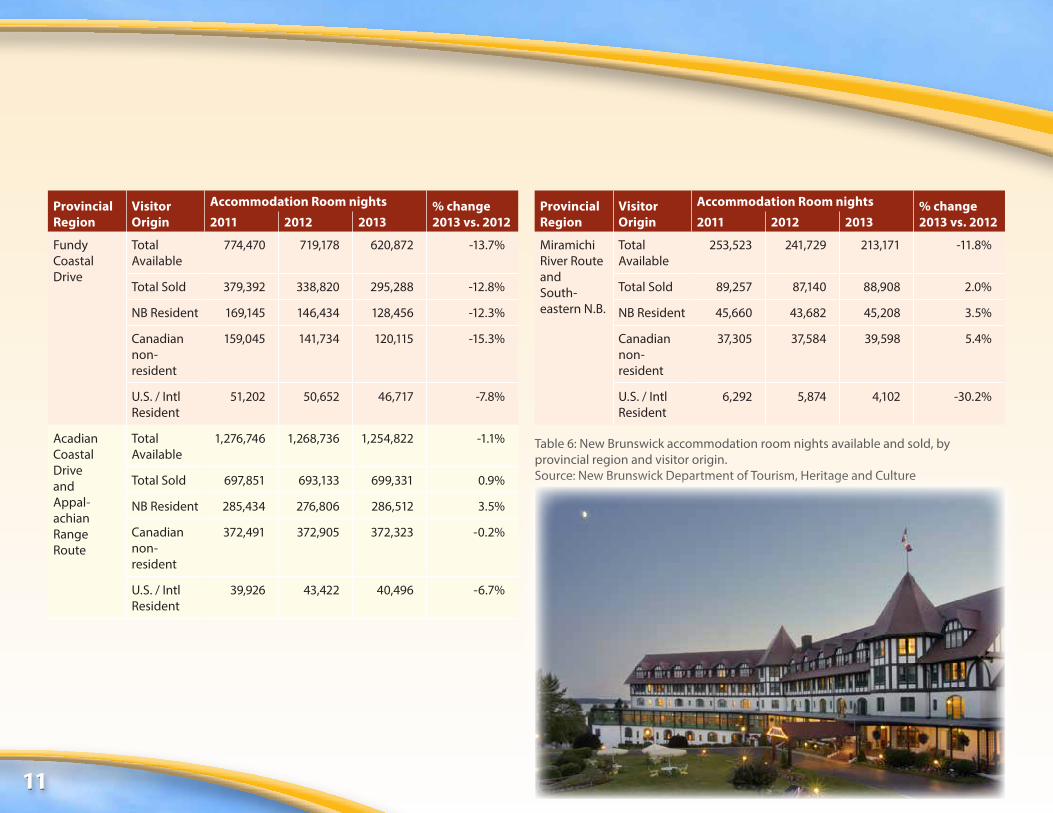
In contrast to the province overall, the Miramichi River and Southeastern New Brunswick area along with the Greater Moncton and Dieppe area maintained room night sales to resident and non-resident Canadian guests (see Table 6). The Greater Fredericton area maintained levels of room nights sold to non-resident Canadians and United States and other international residents. Accommodations in the Acadian Peninsula and Northern New Brunswick maintained levels of room nights sold to New Brunswick residents.
Accommodations 2011 2012 2013% Change 2013 vs. 2012
Room Nights Sold 1,708,792 1,652,770 1,601,019 -3%
Room Nights Available 3,392,056 3,304,395 3,145,690 -5%
Occupancy Rate 50% 50% 51% +1
Average Daily Room Rate
$112.73 $113.02 $110.88 -2%
Table 5: New Brunswick accommodation room nights available and sold, occupancy rates, and average daily room rates. Source: New Brunswick Department of Tourism, Heritage and Culture, and the Conference Board of Canada (Pannell Kerr Forster Consulting Inc., Trends in the Canadian Hotel Industry)
Provincial Region
Visitor Origin
Accommodation Room nights % change 2013 vs. 20122011 2012 2013
Total Province
Total Available
3,392,056 3,304,395 3,145,690 -4.8%
Total Sold 1,708,792 1,652,770 1,601,019 -3.1%
NB Resident 764,083 715,845 691,791 -3.4%
Canadian non-resident
813,129 799,893 782,395 -2.2%
U.S. / Intl Resident
131,580 137,032 126,833 -7.4%
River Valley Scenic Drive
Total Available
1,087,317 1,074,752 1,056,825 -1.7%
Total Sold 542,292 533,677 517,492 -3.0%
NB Resident 263,844 248,923 231,615 -7.0%
Canadian non-resident
244,288 247,670 250,359 1.1%
U.S. / Intl Resident
34,160 37,084 35,518 -4.2%
New Brunswick Accommodations
10 11
Provincial Region
Visitor Origin
Accommodation Room nights % change 2013 vs. 20122011 2012 2013
Fundy Coastal Drive
Total Available
774,470 719,178 620,872 -13.7%
Total Sold 379,392 338,820 295,288 -12.8%
NB Resident 169,145 146,434 128,456 -12.3%
Canadian non-resident
159,045 141,734 120,115 -15.3%
U.S. / Intl Resident
51,202 50,652 46,717 -7.8%
Acadian Coastal Drive and Appal- achian Range Route
Total Available
1,276,746 1,268,736 1,254,822 -1.1%
Total Sold 697,851 693,133 699,331 0.9%
NB Resident 285,434 276,806 286,512 3.5%
Canadian non-resident
372,491 372,905 372,323 -0.2%
U.S. / Intl Resident
39,926 43,422 40,496 -6.7%
Provincial Region
Visitor Origin
Accommodation Room nights % change 2013 vs. 20122011 2012 2013
Miramichi River Route and South-eastern N.B.
Total Available
253,523 241,729 213,171 -11.8%
Total Sold 89,257 87,140 88,908 2.0%
NB Resident 45,660 43,682 45,208 3.5%
Canadian non-resident
37,305 37,584 39,598 5.4%
U.S. / Intl Resident
6,292 5,874 4,102 -30.2%
Table 6: New Brunswick accommodation room nights available and sold, by provincial region and visitor origin. Source: New Brunswick Department of Tourism, Heritage and Culture

12 13
Provincial Park CampgroundsProvincial park campgrounds sold 68,822 campsite nights between June and August 2013, representing a 1% increase from the same period in 2012 (see Table 7). Record-breaking rainfall in the summer of 2013 dissuaded local New Brunswick residents from camping in their nearby provincial parks, but non-local New Brunswick campsite night stays nearly kept resident camping level with 2012. Non-resident campsite night stays in provincial park campgrounds in 2013 increased by 7% over 2012 (June-August, see Table 8).
Campsite Nights Sold Occupancy Rate (%)
2011 2012 2013% Change 2013 vs. 2012 2011 2012 2013
% point change 2013 vs. 2012
June 13,418 13,654 14,571 7% 27.9 28.0 31.0 3.0
July 29,429 27,830 26,787 -4% 58.6 55.3 53.4 -1.9
August 24,984 26,417 27,464 4% 49.9 52.5 54.8 2.3
Total - June - August 67,831 67,901 68,822 1% 45.7 45.5 46.7 1.2
Table 7: Provincial park campground site night sales and occupancy rates by month. Source: New Brunswick Department of Tourism, Heritage and Culture

12 13
Provincial Park Campsite Nights Sold % Change2013 vs. 2012Visitor Origin 2011 2012 2013
New Brunswick Residents 46,831 45,791 45,201 -1%
Atlantic Canada 2,498 2,745 2,821 3%
Ontario 3,722 4,226 4,635 10%
Québec 10,375 11,214 11,879 6%
Western Canada 921 842 824 -2%
New England States 1,737 1,597 1,683 5%
Mid Atlantic States 380 292 361 24%
Other United States 899 825 1,029 25%
Other International 468 369 389 5%
Total 67,831 67,901 68,822 1%
Table 8: Provincial park campground site night sales by visitor origin (June-August). Source: New Brunswick Department of Tourism, Heritage and Culture
14 15
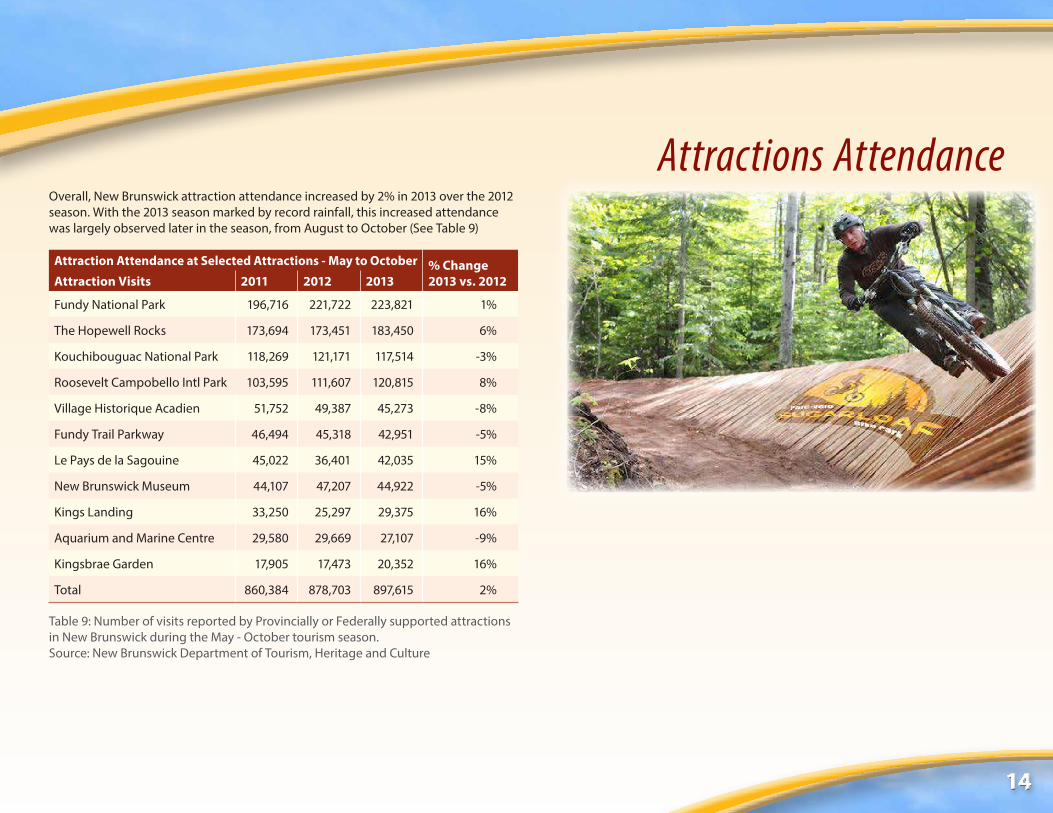
Overall, New Brunswick attraction attendance increased by 2% in 2013 over the 2012 season. With the 2013 season marked by record rainfall, this increased attendance was largely observed later in the season, from August to October (See Table 9)
Attraction Attendance at Selected Attractions - May to October % Change2013 vs. 2012Attraction Visits 2011 2012 2013
Fundy National Park 196,716 221,722 223,821 1%
The Hopewell Rocks 173,694 173,451 183,450 6%
Kouchibouguac National Park 118,269 121,171 117,514 -3%
Roosevelt Campobello Intl Park 103,595 111,607 120,815 8%
Village Historique Acadien 51,752 49,387 45,273 -8%
Fundy Trail Parkway 46,494 45,318 42,951 -5%
Le Pays de la Sagouine 45,022 36,401 42,035 15%
New Brunswick Museum 44,107 47,207 44,922 -5%
Kings Landing 33,250 25,297 29,375 16%
Aquarium and Marine Centre 29,580 29,669 27,107 -9%
Kingsbrae Garden 17,905 17,473 20,352 16%
Total 860,384 878,703 897,615 2%
Table 9: Number of visits reported by Provincially or Federally supported attractions in New Brunswick during the May - October tourism season. Source: New Brunswick Department of Tourism, Heritage and Culture
Attractions Attendance

14 15
Provincial Visitor Information Centres (VICs) counselled 61,132 visitor parties and 311 bus tour groups during their 2013 season (see Table 10). This represented a 13% decrease in visitor party counsels over the 2012 season, and a 16% increase bus tour group counsels compared to the previous season.
Provincial Visitor Information Centre - Counsels % Change2013 vs. 2012Visitor Origin 2011 2012 2013
New Brunswick Residents 4,274 4,717 4,036 -14%
Atlantic Canada 4,835 4,969 4,635 -7%
Ontario 17,899 18,652 14,696 -21%
Québec 22,531 22,858 18,663 -18%
Western Canada 3,606 3,309 3,251 -2%
New England States 4,504 4,489 4,426 -1%
Mid Atlantic States 1,641 1,635 1,670 2%
Other United States 5,896 6,227 6,116 -2%
Other International 3,830 3,771 3,639 -4%
Total 69,016 70,627 61,132 -13%
Bus Tour Groups
Canadian Bus Tours 227 197 265 35%
United States Bus Tours 45 58 43 -26%
Other International Bus Tours 6 14 3 -79%
Total 278 269 311 16%
Grand Total - Counsels 69,294 70,896 61,443 -13%
Provincial Visitor Information Centres
Table 10: Number of visitor parties counselled at the six provincial visitor information centres, by visitor origin. Source: New Brunswick Department of Tourism, Heritage and Culture

16 17
Accommodations Occupancy IndicatorsRoom night: one room occupied for one night in a fixed-roof accommodation participating in New Brunswick’s roofed accommodation reporting program.
Room nights available: total number of units reported as available for sale during the reference time period by fixed-roof accommodations participating in New Brunswick’s roofed accommodation reporting program. This may vary over time due to the addition of accommodations in an area of the province, expansions by existing properties, or closures of some rooms or properties due to renovations or other circumstances.
Room nights sold: total number of units reported as sold during the reference time period by fixed-roof accommodations participating in New Brunswick’s roofed accommodation reporting program.
Occupancy rate: percentage based on the division of the number of rooms reported as sold by the number of rooms reported as available for sale during the reference time period by fixed-roof accommodations participating in New Brunswick’s roofed accommodation reporting program.
Occupancy reporting region, Provincial region: to preserve confidentiality of individual properties’ business operations, accommodation occupancy data are aggregated into 20 occupancy reporting regions. These 20 occupancy reporting regions are further aggregated into 4 provincial scenic drive tourism regions.
The following table lists the provincial regions and their constituent occupancy reporting regions.
Appendix A: New Brunswick Tourism Indicator Definitions

16 17
Provincial RegionOccupancy Reporting Region Code Occupancy Reporting Region Description
River Valley Scenic Drive
A Edmundston (City)
B Québec Border to Grand Falls (Town)
C Grand Falls to Woodstock
D Woodstock (Town) to Fredericton
E Fredericton (City)
F Fredericton to Sussex (Town), Minto, Chipman, Gagetown
Fundy Coastal Drive G Campobello, Deer Island & Grand Manan
I Moncton to Nova Scotia & PEI Borders
J St. Andrews (Town) to Saint John
K Saint John (City)
L Harvey, McAdam, St. Stephen to St. Andrews
S Hillsborough to Alma (via Fundy)
Acadian Coastal Drive and Appalachian Range Route
H Moncton (City) and Dieppe (City)
O Campbellton (City) to Bathurst
P Bathurst (City)
Q Grande-Anse to Neguac
T Tide Head to Saint-Leonard
Miramichi River Route and Southeastern NB
M Shediac to Cape Tormentine
N Fredericton to Miramichi (City)
R Miramichi to Moncton
Table 11: Provincial regions defined for the aggregation of New Brunswick tourism indicator accommodations.
Attractions Attendance IndicatorsAttraction visit: Attendance reported by a New Brunswick attraction in a reference time period (monthly, annual). Data collection methods vary by attraction, and so number of visits may be based on paid admissions, ticket sales, or other means of attendance tracking.

18 18
Appendix B: Statistics Canada Travel Surveys
Visits and Visitor Spending EstimatesThe number of visits and estimates of visitor spending reported in this document rely upon Statistics Canada’s Travel Survey of Residents of Canada (TSRC) and International Travel Survey (ITS).
The New Brunswick Department of Tourism, Heritage and Culture is a partner in these travel surveys along with the majority of Canadian provinces, the Canadian Tourism Commission, and Statistics Canada.
These core travel surveys are the only nationally comparable source of visitation volumes, visitor spending, and travel characteristics for Canada. Nationally, these surveys supply demand-side economic data for the Canadian Tourism Satellite Account, part of Canada’s System of National Accounts.
In 2005, the former Canadian Travel Survey (CTS) was replaced by the Travel Survey of Residents of Canada (TSRC) to conform to the World Tourism Organization’s definition of tourism as travel outside of one’s ‘usual environment.’ The TSRC became the current metric for domestic Canadian tourism as of the reference year 2006.
In 2011, methodological changes were required for the TSRC. These changes included how trips were reported (rostered), the trip recall period (with a 2-month trip recall period replacing the former 1-month trip recall period), and main trip purpose categories (which expanded upon non-routine business and personal trip reasons).
Due to current and planned methodological changes in the TSRC and the Labour Force Survey (upon which the TSRC is based), caution is required in making direct year-over-year comparisons. For this reason, Statistics Canada has produced revision factors to bridge these breaks in the time series. In this report, these revision factors have been used for any year-over-year comparisons of TSRC estimates.
For more detailed information on Statistics Canada’s travel surveys, please refer to:
http://www5.statcan.gc.ca/subject-sujet/theme-theme.action?pid=4007&lang=eng
http://www23.statcan.gc.ca/imdb/p2SV.pl?Function=getSurvey&SDDS=3810&Item_Id=22732&lang=en