BIG DATA AND TOURISM: NEW INDICATORS FOR TOURISM · PDF filebig data and tourism: new...
49
BIG DATA AND TOURISM: NEW INDICATORS FOR TOURISM MANAGEMENT CONCLUSIONS AND RECOMMENDATIONS FOR THE HOTEL INDUSTRY
Transcript of BIG DATA AND TOURISM: NEW INDICATORS FOR TOURISM · PDF filebig data and tourism: new...

BIG DATA AND TOURISM: NEW INDICATORS FOR TOURISM MANAGEMENT
CONCLUSIONS AND RECOMMENDATIONS FOR THE HOTEL INDUSTRY

2 / 48
AuthorsVictor Oliver SustEnrique García IlleraAlbert Solana BerenguéRoberto González GarcíaMaría Victoria Peláez AlonsoMaria José Tomé TorresGenis Roca VerardOriol Lloret AlbertXavier Capellades RamosPablo Rodríguez Rodríguez
Editorial coordinationAnna Miracle Fandos
Design and layout:Hodei EnsunzaMaria Berga
A publication by: and
This report is the property of Telefónica I+D and RocaSalvatella. Commercial use of neither the original work nor any derivative works is permitted. Copying or diffusion is not permitted without the express consent of Telefónica I+D and RocaSalvatella; recognition and mention of its authors is also necessary.
Barcelona, May 2014

3 / 48
Purpose of the studyThe problem of data for the tourist industryStrengths for the tourism industry of using Big Data
Visitors3.1.1. Comparison of visitors between Barcelona and MadridLength of stay3.2.1 Average stay3.2.2. Average stay in Barcelona3.2.3. Average stay in Madrid3.2.4. Comparison between the average stays in Barcelona and Madrid3.2.5. Distribution of nationalities by length of stayTravel between Madrid and BarcelonaAccommodation3.4.1. Areas of the city3.4.2. Distances from the city centreSpending3.5.1. Cumulative average spending by card throughout the stay3.5.2. Average daily spending3.5.3. Cumulative average spending on accommodation by card during the stay3.5.4. Average daily spending on accommodation
IntroductionSpending-based hotel category methodologyOverall recommendationsSpecific action for hotels in Barcelona4.4.1. 5-star hotels in Barcelona (total daily price of more than €140)4.4.2. 4-star hotels in Barcelona (total daily price between €100 and €140)4.4.3. 3-star hotels in Barcelona (total daily price less than €100)Specific action for hotels in Madrid4.5.1. 5-star hotels in Madrid (total daily price of more than €140)4.5.2. 4-star hotels in Madrid (total daily price between €100 and €140)4.5.3. 3-star hotels in Madrid (total daily price less than €100)
Description of the datasets5.1.1. BBVA dataset5.1.2. Telefónica’s datasetPrivacy
List of tablesList of figures
4
10101012
1313141515161718182123232728283033
35
373737383939404041414243
4444444546
474748
1. Executive summary
2. Introduction2.1.2.2. 2.3.
3. Detailed analysis3.1.
3.2.
3.3. 3.4.
3.5.
4. Specific recommendations for hotels
4.1.4.2.4.3. 4.4.
4.5.
5. Methodological note5.1.
5.2.
6. Annex6.1.6.2.
INDEx

1. ExEcutivE summary
4 / 48
Big Data and Tourism is a study produced by Telefónica and RocaSalvatella, which provides a new methodology for improved analysis and knowledge of the Spanish tourism industry.
The purpose of the study is to make use of the opportunities for the sector, in particular the hotel industry, of incorporating macrodata collected from the electronic activity of anonymous foreign tourists into their market research.
Analysis of the vast amount of data produced by digital activity opens up a wide range of opportunities for companies to enhance the services they offer and the management of their business. This study is a first step in understanding the possibilities of Big Data. In this specific case, we are looking to contribute and add value to what is a key sector for the Spanish economy. However, it can be replicated in another economic and social sectors.
One of the document’s main strengths lies in having been able to gather together and cross-reference data from two different companies: Telefónica Móviles España and BBVA. The former provided data about the activities of foreign handsets that used Telefónica’s infrastructure between 7 and 21 October 2012 in Madrid and Barcelona; while BBVA provided data on electronic payments by foreign cards sent through the bank’s terminal network in those cities during the same period. RocaSalvatella and Telefónica I+D have worked on analysing the data and producing the report’s conclusions and recommendations.
The set of tourists who visited Barcelona or Madrid during the analysed period were selected from the following 21 countries included in the study: France, Italy, the United Kingdom, the Netherlands, Portugal, Switzerland, Sweden, Poland, the United States, Belgium, Russia, Norway, Brazil, Denmark, Argentina, Japan, China, India, United Arab Emirates, Saudi Arabia and Singapore. 680,928 mobile handsets and 168,921 cards were included in the study.
Previous studies on tourism in Spain have mostly been based on surveys or interviews with experts carried out by the Ministry of Industry, Energy and Tourism, the main public organisation, or by private companies. This means that, generally speaking, the industry does not have real data about tourists and can only take samples from the population as a whole.
1. ExECUTIvE SUMMARy
Big Data: the potential for data to improve service and business management
The document has been able to gather together and cross-reference data from two different companies: Telefónica Móviles España and BBVA
Conclusions based on actual activity not on surveys or stated intentions

1. ExEcutivE summary
5 / 48
In contrast, the innovative approach achieved through this study is to introduce data based on real actions by users and not on surveys. In other words, real actions have been analysed instead of stated intentions or answers to questions.
This incorporates a type of information that increases knowledge of the industry’s target market produced by the tourists themselves (their mobile phone connecting to the telecom network and their bank card connecting to the POS terminal) into a tourism sector study.
The conclusions drawn have been generated from anonymised, aggregate data that have then been extrapolated through a statistical process ensuring they are completely disassociated pursuant to Spanish law (LOPD 15/1999 and its developing regulations, RD 1720/2007, and Ley General de Telecomunicaciones Ley 32/2003). This completely prevents the identification of any individual based on the data used and so guarantees users’ privacy.
Many different indicators were used to carry out the study. On the one hand, we studied indicators traditionally used by the tourism industry and others that could not be quantified without Big Data analysis. The study has made it possible to obtain information about the following aspects:
Visitors’ main country of originThe country of origin of tourists who opt for Madrid and those who opt for BarcelonaLength of stay by country of originJourneys between the two destinations, Barcelona and MadridDays and areas where foreign visitors prefer to stayAverage daily spending and cumulative spending throughout the entire stay.
The main conclusions drawn concerning each of the variables analysed are set out below. Although the report doesn’t deal with absolute numbers, it could help to gain a further insight on key points:
Visitors’ countries of originThe main tourists who visit Barcelona and Madrid are French, Italian and British. These three nationalities made up 50% of the total number of visitors during the analysed period.
It is not until the ninth position that we find a non-European country, the United States, with a volume of around 4% of total visitors.
In terms of preference between the two cities, Argentinians, Brazilians and Portuguese prioritise Madrid while visitors from Nordic countries choose Barcelona.
••
••••
A methodology that guarantees users’ privacy
Main Conclusions

1. ExEcutivE summary
6 / 48
Length of stay:Overall, the average stay in the cities analysed is a total of 2.24 days. Generally speaking, the length of stay increases by 20% if the visitor arrived on a working day.
Nordic visitors tend to stay longer than tourists from countries such as Russia, Saudi Arabia or the Arab Emirates. Japanese and American citizens limit their visit to 2 days.
In Barcelona, visitors from Nordic countries (Denmark, Norway and Sweden) stay longer than average while in Madrid people from Singapore, India and Saudi Arabia stay longer than average.
People from the same country may behave in contrasting ways depending on the city. For example, India is one of the countries with the longest stays in Madrid but the shortest stays in Barcelona.
Travel between Madrid and Barcelona: Out of the total number of mobile phones analysed, 66% stayed in Barcelona while 31% stayed in Madrid. Just 4% were in both cities during the analysed period.
Accommodation:As a general rule, visitors from countries farther away such as Japan, China and Brazil tend to stay in hotels closer to the centre of the cities, while visitors from nearby countries such as Portugal, France and Belgium choose accommodation farther from the centre.
Visitors to Barcelona are mainly concentrated in 3 areas of the city (Ciutat Vella, Eixample and Sant Martí) and also outside of the city.
In Madrid there is one predominant district, Centro, in the city centre, where almost half of visitors to the city stay. The other half is very fragmented among the rest of the districts.
Visitors from non-European countries and non-Latin American countries mostly stay in 5-star hotels. Switzerland is an exception as it is also in the 5-star list.
Visitors from European countries mainly stay in 4-star hotels, except for French and Portuguese visitors who stay in lower category hotels.
Brazil and Argentina are the only non-European countries that stay in 3-star or lower accommodation.
Sweden is a surprise in that unlike the rest of Nordic countries they also stay in 3-star accommodation together with the French and Portuguese.

1. ExEcutivE summary
7 / 48
Spending:Average cumulative card spending by each visitor during their stay was €161.5 and average card spending per day was €58.5.
The visitors who spent the most during their entire stay were those from Singapore, China, Japan and the Arab Emirates in that order. Visitors who spent the least money were those from nearby countries such as Portugal and France, Nordic countries such as Sweden and Denmark, and Argentina.
As far as the difference between cities is concerned, visitors from Denmark, Norway and Sweden spend more in Madrid than in Barcelona. Tourists from India and Singapore spend more in Barcelona.
Spending on accommodationIf one analyses only spending on accommodation, average spending for the entire stay is around €300 and the average daily expenditure or price per night is €129.
It is important to highlight that average spending on accommodation is higher than overall average spending on all expenditure headings. That is because the total volume of transactions is far higher than the volume of transactions for accommodation alone. The exact figures are given in point 3.5.3.
The group of countries from the Middle East and India spend practically twice as much on accommodation as the rest of countries. Argentinians, French, Portuguese and Brazilians spend the least on accommodation. That is in spite of the fact that 10% of tourists from these countries stay in Madrid or Barcelona for more than 6 days.
Spending on accommodation by tourists in Barcelona is notably higher than in Madrid (around 20%). Part of this additional spending could be due to visitors staying longer in Barcelona than in Madrid, 2.28 days versus 2.15 days. One should also consider that hotels in Barcelona could be more expensive than those in Madrid.

1. ExEcutivE summary
8 / 48
Main recommendations for the hotel industry:
Based on the conclusions drawn from data analysis, the study ends with a series of tactical and strategic recommendations for hotel managers. These recommendations focus on:
Winning more customers and pinpointing the countries on which it is recommended to focus marketing
Detecting areas of the city in which commercial transactions are carried out, Specially, those referring to accommodation.
Ensuring you provide an attractive product suited to customers’ true needs (ideal length of package offers, information about complementary services demanded by nationalities, etc.)
Obviously, any decision in this area should be based on more in-depth analysis covering a longer timeframe, which would make it possible to show seasonal and annual variations. The recommendations include a sample of the kinds of applications that using these data sources could have in a new business intelligence model in the industry.
France, Italy, the United Kingdom, the Netherlands and Portugal: win these customers in their countries of origin.Due to the volume of tourists they provide, it is necessary to work to win customers in the following countries: France, Italy, the United Kingdom, the Netherlands and Portugal.
When one analyses spending by people from these countries, both French and Portuguese have a lower level of spending than people from other countries. Therefore, it is recommended to carry out action to win customers through intermediaries or, in any case, in a very segmented manner to ensure profitability, as they have greater capillarity and expenditure is 100% variable for hotels.
Bear in mind that there is great potential for growth in BRIC countries (Brazil, India, Russia and China). Madrid seems to have the greatest potential for Brazilians and Chinese, while Barcelona has the greatest potential for Russians. India is still a tiny market for both cities.
Finally, it is worth highlighting the purchasing power of visitors from China, which are clearly luxury hotel customers.
We have observed the need to adapt action to win customers based on the hotel’s category and the country in which the action will be carried out. For example, for 5-star hotels in Barcelona it is recommended to carry out action to win customers in countries in the Arabian Peninsula, India and China and for 3-star hotels lower-cost action is recommended in France, the Nordic countries, Brazil and Argentina.
•
•
•
Specific recommendations for hotels in Barcelona

1. ExEcutivE summary
9 / 48
In order to adapt to tourists’ real needs, depending on their nationality, a central hotel should expect more visitors from Japan and countries in the Arabian Peninsula. In contrast, French, Portuguese and Argentinian visitors prefer to stay far from the centre at low prices.
It is relevant to know cumulative spending by nationality and which tourists there are opportunities to sell products or services to nearby the hotel. For example, visitors from China, Russia and Japan spend a considerable amount in fashion shops and consume luxury products in Barcelona. These services may be a new source of income.
5-star hotels in Madrid that want to win customers should focus on countries such as the United States, Switzerland, China and Japan. In contrast, 3-star hotel should focus on neighbouring countries such as France, Italy and Portugal but also far-away countries such as Brazil, Argentina and Singapore.
Although the conclusions mention that most visitors stay in the centre of Madrid, analysis shows that a central location is not a determining factor for visitors from the Arab Emirates or India.
Finally, it is recommended to adapt offers to stays of 2 or 3 nights depending on the country of origin. For example, it is advisable to offer a 3-night package to Indian visitors and a 2-night package to Russians.
It is also relevant to know cumulative spending by nationality and which tourists the hotel may sell new added services to. For example, visitors from China, Japan, the Arabian Peninsula and Russia spend significant amounts in fashion shops and consume luxury products in Madrid. These services may provide a new source of income.
Specific recommendations for hotels in Madrid

2. IntroductIon
10 / 48
The study has a two-fold objective: on the one hand, to demonstrate the possibilities offered by analysing large amounts of data (an option that technology has made possible only relatively recently) when making decisions in an industry as important for the economy as tourism. On the other hand, the aim is to make use of the datasets that large companies such as BBVA and Telefónica can make available to society, which will undoubtedly contribute to a general improvement in decision-making, especially in urban environments.
In order to achieve these two aims, the study analyses, from a business perspective, certain aspects of the behaviour of foreign visitors to Madrid and Barcelona during a very limited period of time. It does so by using duly aggregated and anonymised data, based on the location of base stations to which mobile phones connect during the day and credit card use. The conclusions were applied to one particular aspect of the tourism industry: hotels. The end result is a set of highly-specific business recommendations that a hotel could follow, which would show that having and appropriately analysing such data is relevant when it comes to making business decisions.
The specific aspects of visitor behaviour analysed are based on the following categories:
Visitors: how many come and where do they come from Length of stay: average time by nationalityTravel between the two citiesPreferred hotelsSpending levels: overall and on accommodation
Previous studies on tourism in Spain have mostly been based on surveys or interviews with experts carried out by the Ministry of Industry, Energy and Tourism, the main public organisation, or by private companies.
One option for classifying these studies is to group them by the methodology used to gather data or the data source on the understanding that studies produced for the tourism industry come from data from regular samples that are non-granular in space and time.
2. INTRODUCTION
2.1. Purpose of the study
2.2. The problem of data for the tourist industry
•••••

2. IntroductIon
11 / 48
First of all, studies could be classified by the data gathering methodology:
Surveys: available reports include Tourist Border Movements (FRONTUR), Tourist Spending Surveys (EGATUR) and Spanish Tourist Movement (FAMILITUR), etc.Interviews with industry experts using the Delphi method.Search engine trends: the Google Insight for Search tool currently offers a service showing the volume of most repeated searches by countries and dates.
Studies could also be classified by source gathering data or by the organisation gathering that data together:
INE: Spanish Statistics InstituteEurostat: the European statistics officeIET: Institute of Tourism StudiesAENA: Spanish Airports and Air Navigation. RENFE (railway company)Spanish Port AuthoritiesGeneral and specialised consulting firmsBanksSearch engines
Apart from search engines, AENA, RENFE, Port Authorities and banks, organisations that gather data use survey or interview methods, so they do not have real data from tourists and can only take samples from the population as a whole.
In some cases, such as FRONTUR, they estimate results from administrative records kept by the Directorate-General of Traffic. This available administrative information shows the number of vehicles that cross the border, so it is necessary to estimate how many people are in each vehicle in order to convert the number of vehicles into the number of people.
In other cases, companies such as AENA, RENFE and Port Authorities have exact data about passengers who come to Spain by air, land or sea in their databases. Although they are exact data, this information is only part of what the tourism industry needs and must be cross-referenced against data on tourists’ behaviour once they are in the country.
As far as search engines are concerned, the information they extract is based on searches made by visitors before they arrive in the country. Although increasing attention should be given to this new source of prediction, it does not explain visitors’ behaviour during their stay in Spain.
•
••
•••••••••

2. IntroductIon
12 / 48
The innovative approach taken in producing this report has a set of advantages over traditional methodologies. These are as follows:
Reliability: the data used are based on users’ real actions not on surveys. In other words, real actions have been analysed instead of stated intentions or answers to questions.
Representativeness: adding all of the information sources together, it can be stated that the sample size contains the following: • BBVA data: 15% of all transactions are carried out with cards belonging to foreigners in the province of Madrid. 14% for the province of Barcelona. In both cases, these percentages depend on the area of the province being studied.
• Telefónica data: approximately one third of telephones whose SIM comes from foreign operators end up registering on Telefónica España’s network.
That increases the sample base on which conventional research tends to be based by several orders of magnitude.
Information detail and segmentation capacity: the degree of space/time focus and the ability to describe places and the people who visit them is radically changed due to the sample size and its reliability.
Hybridising data with other current or future sources: since they are structured and geopositioned data, it is possible to cross-reference them with other sources such as social media, open public data and others whether currently in production or potential information sources that may be created or released in the future.
New information flows: a type of information that increases knowledge of the industry’s target market produced by the tourists themselves (their mobile phone connecting to the telecom network and their bank card connecting to the POS terminal) is incorporated into a tourism sector study.
Possibility of new business opportunities: the results of this analysis can be contrasted with internal data from each tourism company to determine whether the supply on offer in each area of the city is in tune with the tourists who visit it.
2.3. Strengths for the tourism industry of using Big Data
•
•
•
•
•
•

FRANCE
ITALY
UNITED KINGDOM
NETHERLANDS
PORTUGAL
SWITZERLAND
SWEDEN
POLAND
UNITED STATES
BELGIUM
RUSSIA
NORWAY
BRAZIL
DENMARK
ARGENTINA
JAPAN
CHINA
INDIA
UNITED ARAB EMIRATES
SAUDI ARABIA
SINGAPORE
OVERALL TOTAL
117.014
114.108
104.909
63.256
39.784
36.518
29.325
28.775
24.706
24.050
18.063
15.355
13.274
12.708
10.028
8.981
8.423
3.231
3.218
2.900
2.302
680.928
83.901
75.146
75.556
47.393
15.569
26.560
21.714
19.550
14.205
16.105
13.905
12.187
5.140
10.555
3.636
5.485
3.762
1.715
1.762
1.698
1.620
457.164
Country Total telephones
Telephones in BCN
%BCN/TOTAL
33.113
38.962
29.353
15.863
24.215
9.958
7.611
9.225
10.501
7.945
4.158
3.168
8.134
2.153
6.392
3.496
4.661
1.516
1.456
1.202
682
223.764
71,7%
65,9%
72,0%
74,9%
39,1%
72,7%
74,0%
67,9%
57,5%
67,0%
77,0%
79,4%
38,7%
83,1%
36,3%
61,1%
44,7%
53,1%
54,8%
58,6%
70,4%
67,1%
28,3%
34,1%
28,0%
25,1%
60,9%
27,3%
26,0%
32,1%
42,5%
33,0%
23,0%
20,6%
61,3%
16,9%
63,7%
38,9%
55,3%
46,9%
45,2%
41,4%
29,6%
32,9%
Telephones in MADRID
%MADRID/TOTAL
3. DetaileD analysis
13 / 48
By analysing the number of active telephones, by country, during the study period, conclusions can be drawn about the main countries of origin of tourists who visit us and their preferred destination, Madrid or Barcelona.
This list of 21 countries used throughout the report is not a continuous ranking. Nationalities have been left out that were among the top 21 so as to avoid redundant conclusions. Instead we gave room to other places of origin that are representative of important supranational areas (Persian Gulf, South America, etc.)
3. DETAIlED ANAlySIS
3.1. Visitors
Table 1:
Unique telephones registered (Telefónica data)
Among the nationalities selected, French, Italian and British tourists were the ones who visited us the most by far. These three countries together made up 50% of the total number of visitors from the 21 countries analysed. This applies similarly to each of the two cities analysed, Barcelona and Madrid.
The United States, which is ninth in the ranking, is the non-European Union country with the highest number of visitors at 3.62% of the total.

17%
FRANCE
13%
15%
51%
ITALY
UNITED KINGDOM
OTHER COUNTRIES
67%33%
BARCELONA
MADRID
67%33%
BARCELONA
MADRID
75%
100%
50%
25%
0%
DENMARK
NORWAY
RUSSIA
NETHERLANDS
SWEDEN
SWITZERLAND
UNITED KINGDOM
FRANCE
POLAND
BELGIUM
ITALY
JAPAN
SAUDI ARABIA
UNITED STATES
UNITED ARAB EMIRATES
INDIA
CHINA
PORTUGAL
BRAZIL
ARGENTINA
SINGAPORE
75%
50%
25%
0%
ARGENTINA
BRAZIL
PORTUGAL
CHINA
INDIA
UNITED ARAB EMIRATES
UNITED STATES
SAUDI ARABIA
ITALY
BELGIUM
POLAND
SINGAPORE
FRANCE
UNITED KINGDOM
SWITZERLAND
SWEDEN
NETHERLANDS
RUSSIA
NORWAY
DENMARKJAPAN
3. DetaileD analysis
14 / 48
Two out of three visitors choose Barcelona (67%) as a destination and one in three choose Madrid (33%).
3.1.1. Comparison of visitors between Barcelona and Madrid
Figure 2:
Distribution of visitors between Barcelona and Madrid (Telefónica data)
Figure 1:
Distribution of visitors by country (Telefónica data)
When preferences between the two cities are compared by country of origin, Argentinians, Brazilians and Portuguese prioritise Madrid as a destination with percentages of more than 60% while visitors from Nordic countries choose Barcelona with percentages of more than 75% of the total.
Figure 3:
City preference, Barcelona over Madrid (Telefónica data)
Figure 4:
City preference, Madrid over Barcelona (Telefónica data)

DENMARK
NORWAY
SWEDEN
SINGAPORE
RUSSIA
POLAND
BRAZIL
SAUDI ARABIA
NETHERLANDS
ARGENTINA
UNITED ARAB EMIRATES
CHINA
PORTUGAL
INDIA
UNITED KINGDOM
BELGIUM
ITALY
JAPAN
UNITED STATES
FRANCE
SWITZERLAND
TOTAL WEIGHTED AVERAGE
2,98
2,91
2,87
2,72
2,66
2,66
2,65
2,63
2,50
2,45
2,30
2,18
2,16
2,15
2,14
2,13
2,11
2,10
2,08
1,94
1,91
2,24
Country Average Total Stay
3. DetaileD analysis
15 / 48
3.2. Length of stay
3.2.1. Average stay Analysis of the number of active telephones by country during the study period shows the average length of time that visitors stay in Spain. There are significant differences between the length of visits to Madrid and Barcelona by different nationalities.
Overall, the total average stay by visitors from the 21 countries analysed is 2.24 days. Generally speaking, the length of stay increases by 20% if the visitor arrived on a working day.
The Nordic countries stand out in staying longer than more far-off countries such as Russia, Saudi Arabia and the Arab Emirates. Visitors from France and Switzerland are at the bottom of the table with the shortest stays. It is surprising to see Japan and the United States at the bottom end of the table with a stay of around 2 days.
People from the same country may behave in contrasting ways depending on the city. For example, India is one of the countries with the longest stays in Madrid but the shortest stays in Barcelona.
Table 2:
Average stay (Telefónica data)

DENMARK
NORWAY
SWEDEN
BRAZIL
RUSSIA
POLAND
ARGENTINA
SINGAPORE
SAUDI ARABIA
NETHERLANDS
UNITED ARAB EMIRATES
BELGIUM
PORTUGAL
UNITED KINGDOM
UNITED STATES
CHINA
JAPAN
ITALY
FRANCE
SWITZERLAND
INDIA
3,18
3,16
2,94
2,92
2,8
2,77
2,73
2,72
2,67
2,55
2,47
2,23
2,22
2,17
2,11
2,1
2,08
2,01
1,99
1,95
1,66
3,76
2,63
2,66
2,47
2,16
2,41
2,53
2,59
2,24
2,43
2,44
1,71
1,74
1,93
1,61
1,82
2,04
1,66
1,63
1,72
1,51
Country Average stay
Average stay starting at a weekend
Average stay starting on
a working day
2,91
3,33
3,19
3,1
2,81
2,85
2,75
2,78
2,85
2,6
2,47
2,42
2,35
2,17
2,41
2,17
2,05
2,1
2,09
2,03
1,73
3. DetaileD analysis
16 / 48
3.2.2. Average stay in Barcelona
Table 3:
Average stays in Barcelona depending on the day on which the visits start and the total (Telefónica data)
Visitors from Nordic countries (Denmark, Norway and Sweden) stay longer than average in Barcelona, while France, Switzerland and India are the countries with the shortest stays.

SINGAPORE
INDIA
SWEDEN
SAUDI ARABIA
BRAZIL
POLAND
NETHERLANDS
ARGENTINA
ITALY
CHINA
RUSSIA
JAPAN
PORTUGAL
UNITED ARAB EMIRATES
UNITED KINGDOM
UNITED STATES
DENMARK
NORWAY
BELGIUM
FRANCE
SWITZERLAND
2,73
2,7
2,67
2,58
2,48
2,42
2,34
2,29
2,29
2,25
2,2
2,14
2,12
2,1
2,06
2,04
1,99
1,97
1,92
1,83
1,81
2,98
2,03
1,83
2,14
2,06
2,16
2,07
2,02
1,83
1,94
1,89
2,12
1,55
1,81
1,59
1,64
1,9
1,55
1,29
1,43
1,52
Country Average stay
Average stay starting at a weekend
Average stay starting on
a working day
2,61
2,31
2,9
2,83
2,7
2,43
2,43
2,47
2,5
2,34
2,3
2,17
2,29
2,14
2,17
2,24
2,08
2,2
2,19
2
1,99
3. DetaileD analysis
17 / 48
3.2.3. Average stay in Madrid
Table 4:
Average stays in Madrid depending on the day on which the visits start and the total (Telefónica data)
Singapore, India and Saudi Arabia all stay longer than the average, while nearby European countries (Switzerland, France and Belgium) have shorter stays.

2
1
–BARCELONA MADRID
2,28 days2,15 days
57%
< 1 day
23%
14%
7%
1 - 3 days
3 - 6 days
> 6 days
57%
< 1 day
23%
14%
7%
1 - 3 days
3 - 6 days
> 6 days
3. DetaileD analysis
18 / 48
3.2.4. Comparison between average stays in Barcelona and Madrid
3.2.5. Distribution of nationalities by length of stay
Figure 5:
Average stay in days in Barcelona and Madrid
(Telefónica data)
Figure 6:
Overall distribution of length of stay
(Telefónica data)
There is a slight difference between Barcelona and Madrid with slightly longer stays in Barcelona (2.28 days) than in Madrid (2.15 days).
If one compares the difference in relation to the arrival day, in Barcelona the length of stay is only 17% longer if the visitors arrive on a working day, while that difference lengthens to 30% in Madrid.
Another way of analysing stays by nationality is to show its distribution according to certain ranges of length of stay, which gives us more significant information than just the average stay figure.
It is surprising how many visitors stay less than one day, 57%, which shortens the average stay. It makes sense to think of them not only as visitors who arrive and leave the country the same day but also as people who arrive in Spain and then go to other places outside of Barcelona and Madrid.
In the following points we will analyse the distribution by countries within these ranges of length of stay for each of the two cities.

SAUDI ARABIA
ARGENTINA
BELGIUM
BRAZIL
CHINA
DENMARK
UNITED ARAB EMIRATES
UNITED STATES
FRANCE
NETHERLANDS
INDIA
ITALY
JAPAN
NORWAY
POLAND
PORTUGAL
UNITED KINGDOM
RUSSIA
SINGAPORE
SWEDEN
SWITZERLAND
44,72%
44,41%
58,61%
36,82%
51,60%
36,51%
47,28%
57,57%
62,91%
47,58%
69,56%
61,95%
55,37%
33,86%
47,26%
61,54%
56,81%
49,23%
41,74%
36,59%
62,50%
28,09%
29,09%
21,11%
34,08%
36,06%
22,18%
28,53%
23,67%
21,00%
22,46%
16,02%
22,12%
34,43%
26,95%
25,17%
19,33%
23,26%
18,27%
29,92%
29,50%
20,51%
Country < 1 day 1 -3 days 3 - 6 days > 6 days
7,99%
8,58%
8,46%
7,25%
3,04%
8,09%
8,51%
6,90%
5,59%
8,58%
9,54%
5,85%
3,37%
10,78%
12,05%
10,02%
6,28%
13,87%
13,08%
9,05%
4,69%
19,20%
17,92%
11,82%
21,86%
9,31%
33,22%
15,67%
11,86%
10,50%
21,39%
4,88%
10,08%
6,82%
28,41%
15,53%
9,11%
13,65%
18,63%
15,26%
24,87%
12,30%
< 1 day1 - 3 days3 - 6 days> 6 days
100%
SAUDI ARABIA
ARGENTINA
BELGIUM
BRAZIL
CHINA
DENMARK
UNITED ARAB EMIRATES
UNITED STATES
FRANCE
NETHERLANDSIN
DIAITALY
JAPAN
NORWAY
POLAND
PORTUGAL
UNITED KINGDOM
RUSSIA
SINGAPORE
SWEDEN
SWITZERLAND
90%
80%
70%
60%
50%
40%
30%
20%
10%
0%% Telephones
3. DetaileD analysis
19 / 48
Table 5:
Percentage distribution of the number of telephones in Barcelona according to four stay length ranges
(Telefónica data)
The countries with greatest representation in the category of stays lasting less than one day are India, France and Switzerland. This category represents 55% of total visitors.
Tourists who stay between 1 and 3 days account for 23% of total visitors. Chinese, Japanese and Brazilians stand out here.
Those who stay between 3 and 6 days account for 15% of the total and the tourists with the highest percentages come from Nordic countries.
Just 6% of the total number of visitors spent more than 6 days visiting within the two-week period analysed. Visitors from Russia, Singapore and Poland stand out in this group as those who stay the longest.
Figure 7:
Distribution by days spent in Barcelona (Telefónica data)

SAUDI ARABIA
ARGENTINA
BELGIUM
BRAZIL
CHINA
DENMARK
UNITED ARAB EMIRATES
UNITED STATES
FRANCE
NETHERLANDS
INDIA
ITALY
JAPAN
NORWAY
POLAND
PORTUGAL
UNITED KINGDOM
RUSSIA
SINGAPORE
SWEDEN
SWITZERLAND
46,18%
59,55%
67,76%
53,55%
49,33%
62,82%
60,00%
62,59%
65,99%
54,65%
40,55%
52,83%
46,07%
60,81%
56,13%
64,31%
60,70%
57,95%
40,56%
54,36%
67,81%
30,33%
18,00%
16,38%
21,92%
31,84%
19,10%
23,17%
17,47%
20,15%
21,69%
28,89%
26,17%
41,36%
22,23%
22,45%
18,04%
22,71%
22,23%
36,19%
21,69%
17,16%
Country < 1 day 1 -3 days 3 - 6 days > 6 days
8,78%
9,80%
7,68%
9,67%
3,42%
5,44%
5,92%
7,48%
5,29%
5,81%
2,08%
6,93%
2,12%
4,15%
9,71%
10,72%
5,74%
6,60%
7,52%
11,35%
5,05%
14,71%
12,65%
8,18%
14,85%
15,41%
12,64%
10,92%
12,45%
8,58%
17,86%
28,48%
14,07%
10,45%
12,82%
11,71%
6,93%
10,85%
13,21%
15,73%
12,60%
9,98%
< 1 day1 - 3 days3 - 6 days> 6 days
100%
% Telephones
SAUDI ARABIA
ARGENTINA
BELGIUM
BRAZIL
CHINA
DENMARK
UNITED ARAB EMIRATES
UNITED STATES
FRANCE
NETHERLANDSIN
DIAITALY
JAPAN
NORWAY
POLAND
PORTUGAL
UNITED KINGDOM
RUSSIA
SINGAPORE
SWEDEN
SWITZERLAND
90%
80%
70%
60%
50%
40%
30%
20%
10%
0%
3. DetaileD analysis
20 / 48
Table 6:
Percentage distribution of the number of telephones in Madrid according to four stay length ranges (Telefónica data)
Figure 8:
Distribution by days spent in Madrid
(Telefónica data)
The countries with the highest percentages in the category of stays lasting less than one day are Switzerland, Belgium and France. This category accounts for 59% of total visitors.
Tourists from Japan, Singapore and China stand out in the set of stays lasting 1 to 3 days, which accounts for 22% of total visitors.
Those who stay between 3 and 6 days account for 15% of the total and the countries with the highest percentages are India, the Netherlands and Singapore.
7% of the total number of visitors spent more than 6 days visiting within the two-week period analysed. Visitors from Sweden, Portugal and Argentina stand out in this group as those who stay the longest.

SAUDI ARABIA
ARGENTINA
BELGIUM
BRAZIL
CHINA
DENMARK
UNITED ARAB EMIRATES
UNITED STATES
FRANCE
NETHERLANDS
INDIA
ITALY
JAPAN
NORWAY
POLAND
PORTUGAL
UNITED KINGDOM
RUSSIA
SINGAPORE
SWEDEN
SWITZERLAND
55,0 %
26,3 %
66,6 %
28,5 %
36,4 %
82,9 %
53,2 %
54,8 %
71,2 %
74,6 %
50,1 %
65,2 %
52,2 %
79,1 %
65,3 %
34,6 %
71,6 %
76,0 %
65,8 %
73,8 %
72,4 %
2,7 %
7,8 %
0,5 %
6,3 %
6,1 %
0,4 %
1,4 %
2,7 %
0,8 %
0,5 %
2,0 %
0,9 %
11,5 %
0,6 %
1,9 %
3,1 %
0,7 %
1,4 %
5,0 %
0,5 %
0,6 %
Country B B M
36,4 %
58,1 %
32,1 %
54,9 %
48,7 %
16,0 %
43,4 %
38,9 %
26,9 %
24,1 %
43,6 %
32,7 %
25,0 %
19,6 %
26,1 %
58,2 %
26,8 %
19,5 %
18,8 %
25,2 %
26,3 %
0,4 %
0,4 %
0,1 %
0,4 %
0,6 %
0,2 %
0,5 %
0,3 %
0,3 %
0,1 %
0,4 %
0,4 %
0,5 %
0,1 %
1,7 %
0,5 %
0,1 %
1,6 %
2,9 %
0,2 %
0,2 %
4,8 %
5,2 %
0,6 %
7,6 %
7,6 %
0,5 %
1,2 %
2,7 %
0,7 %
0,6 %
3,1 %
0,8 %
10,3 %
0,4 %
4,8 %
2,6 %
0,7 %
1,3 %
6,6 %
0,3 %
0,6 %
0,7 %
2,1 %
0,1 %
2,4 %
0,5 %
0,1 %
0,3 %
0,6 %
0,1 %
0,1 %
0,9 %
0,1 %
0,7 %
0,1 %
0,3 %
0,9 %
0,1 %
0,2 %
0,9 %
0,0 %
0,1 %
B M B M M B M B M
3. DetaileD analysis
21 / 48
3.3. Travel between Madrid and Barcelona
We analysed the number of telephones that travelled between the two cities. This gives us an idea of the mobility of tourists between them. In the table below for example, B shows the telephone does not leave Barcelona and B-M-B shows the telephone moved to Madrid and back to Barcelona.
Table 7:
Travel between cities (B-Barcelona, M-Madrid) expressed in percentages. For example, B shows the telephone does not leave Barcelona and B-M-B shows the telephone moved to Madrid and back to Barcelona (Telefónica data)
Out of the total number of mobile phones analysed, 66% stayed in Barcelona while 31% stayed in Madrid. These figures are in line with those in the first section Comparison of visitors between Barcelona and Madrid.
Therefore, 96% of tourists stay in the city they arrived at. So direct mobility between the two cities does not appear to be very high, although they could visit other cities not included in the study. Just 4% of the total number of visitors visited both cities, Madrid and Barcelona.
There are exceptions when visitors are analysed by their country of origin. Japanese, Brazilians and Argentinians are the tourists that had the greatest tendency to visit both cities.
Danish, Norwegians and Russians stand out for their preference to visit Barcelona instead of Madrid, while Portuguese, Argentinians and Brazilians have a preference for Madrid far above the average.

3. DetaileD analysis
22 / 48
As far as travel between cities is concerned, 1.3% of tourists who arrive at Barcelona end up visiting Madrid. The same happens in reverse, 1.3% of visitors who initially arrive at Madrid end their trip in Barcelona.
Japanese, Argentinian and Brazilian tourists stand out as having a far higher tendency than the rest to visit Madrid once they are in Barcelona.
As far as travel from Madrid to Barcelona is concerned, Japanese, Chinese and Brazilians stand out as being far above the average.
There is a small percentage of visitors, around 4%, who travel between the two cities more than once.
Ciut
at V
ella
Eixa
mpl
e
Sant
Mar
tí
BARC
ELO
NA
PRO
VIN
CIA
Les C
orts
Nou
Bar
ris
Gràc
ia
Sarr
ià -
Sant
Ger
vasi
Hor
ta -
Guin
ardó
Sant
s - M
ontju
ïc
SAUDI ARABIA
ARGENTINA
BELGIUM
BRAZIL
CHINA
DENMARK
UNITED ARAB EMIRATES
UNITED STATES
FRANCE
NETHERLANDS
INDIA
ITALY
JAPAN
NORWAY
POLAND
PORTUGAL
UNITED KINGDOM
RUSSIA
SINGAPORE
SWEDEN
SWITZERLAND
TOTAL
79%
18%
33%
16%
24%
35%
44%
26%
20%
32%
46%
28%
20%
27%
29%
8%
32%
28%
20%
48%
37%
28%
5%
24%
18%
15%
27%
16%
20%
39%
13%
18%
21%
21%
48%
30%
19%
20%
19%
23%
40%
16%
20%
24%
5%
21%
18%
36%
26%
24%
16%
20%
21%
21%
19%
19%
13%
15%
20%
19%
25%
25%
23%
17%
23%
21%
10%
3%
3%
7%
3%
2%
4%
3%
3%
1%
0%
4%
6%
2%
1%
1%
4%
3%
0%
2%
1%
3%
0%
1%
1%
5%
2%
1%
0%
0%
3%
1%
0%
1%
1%
3%
0%
1%
1%
1%
0%
3%
1%
1%
0%
2%
1%
1%
3%
2%
2%
0%
1%
2%
0%
3%
0%
1%
3%
1%
1%
1%
0%
0%
0%
1%
0%
0%
0%
1%
2%
0%
4%
0%
0%
2%
0%
1%
2%
0%
3%
2%
0%
1%
0%
1%
0%
1%
0%
2%
0%
0%
3%
0%
0%
0%
0%
0%
0%
0%
2%
0%
0%
0%
0%
0%
0%
0%
0%
0%
0%
0%
0%
0%
0%
0%
0%
0%
0%
0%
0%
0%
1%
0%
0%
0%
0%
0%
0%
0%
0%
0%
2%
29%
24%
18%
11%
20%
10%
10%
38%
24%
15%
23%
8%
22%
24%
48%
17%
17%
17%
14%
18%
21%
País
3. DetaileD analysis
23 / 48
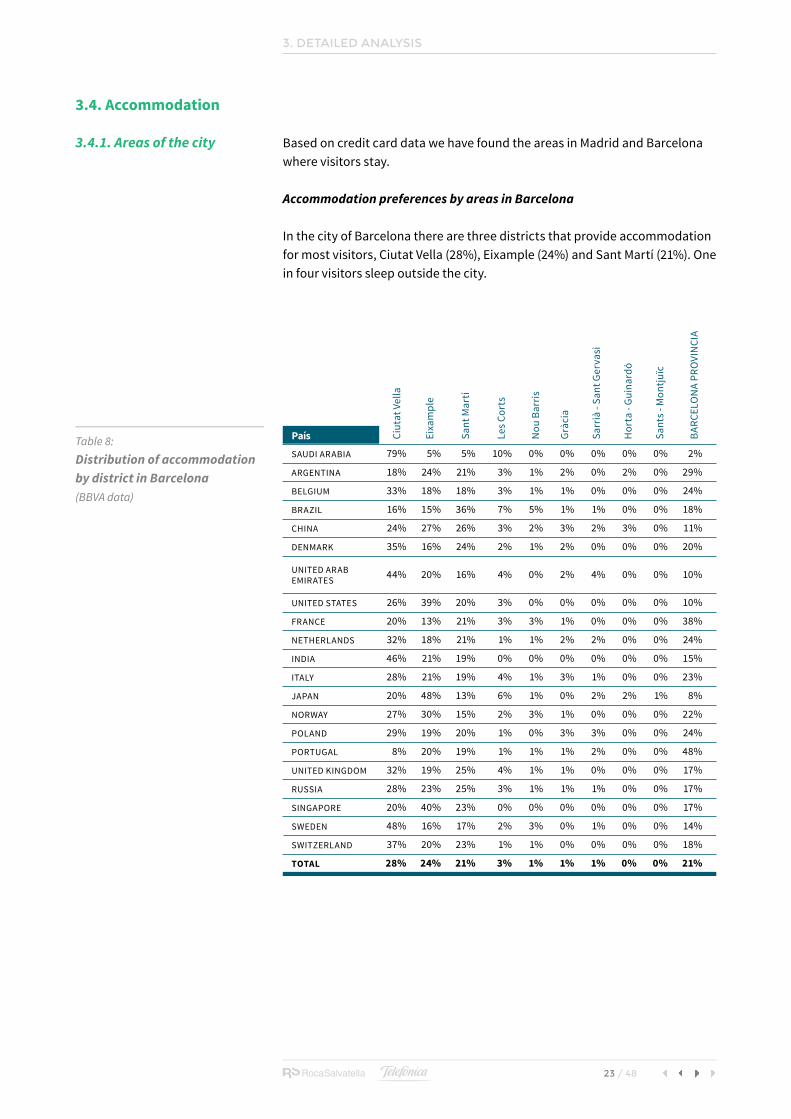
3.4. Accommodation
3.4.1. Areas of the city
Accommodation preferences by areas in Barcelona
Based on credit card data we have found the areas in Madrid and Barcelona where visitors stay.
In the city of Barcelona there are three districts that provide accommodation for most visitors, Ciutat Vella (28%), Eixample (24%) and Sant Martí (21%). One in four visitors sleep outside the city.
Table 8:
Distribution of accommodation by district in Barcelona (BBVA data)

Ciutat Vella
Eixample
Sant Martí
BARCELONA PROVINCIA
Les Corts
Nou Barris
Gràcia
Sarrià - S
ant Gervasi
Horta - G
uinardó
Sants - M
ontjuïc
30%
20%
10%
0%
% Porcentage of overnight stays
3. DetaileD analysis
24 / 48
Most visitors from Saudi Arabia stay in Ciutat Vella, followed by almost half of visitors from Sweden and India.
As far as Japanese are concerned, almost half of them stay in Eixample, followed by the visitors from Singapore (40%) and the United States (39%).
The third district by number of overnight stays is Sant Martí, where 36% of Brazilians and a quarter of Chinese and British stay.
Practically one in four visitors stays outside the city of Barcelona. The main countries in this group are Portugal, France and Argentina.
Figure 9:
Percentage of overnight stays by district in Barcelona
(BBVA data)
Cent
ro
Retir
o
Bara
jas
San
Blas
Sala
man
ca
MAD
RID
PRO
VIN
CIA
Cham
berí
Ciud
ad L
inea
l
Mon
cloa
-Ara
vaca
Villa
de
Valle
cas
Arga
nzue
la
Cara
banc
hel
Cham
artÍn
Tetu
án
Villa
verd
e
Fuen
carr
al-E
l Par
do
SAUDI ARABIA
ARGENTINA
BELGIUM
BRAZIL
CHINA
DENMARK
UNITED ARAB EMIRATES
UNITED STATES
FRANCE
NETHERLANDS
INDIA
ITALY
JAPAN
NORWAY
POLAND
PORTUGAL
UNITED KINGDOM
RUSSIA
SINGAPORE
SWEDEN
SWITZERLAND
TOTAL
46%
55%
34%
45%
40%
47%
27%
52%
34%
45%
24%
54%
41%
38%
44%
21%
37%
59%
69%
53%
46%
44%
8%
20%
18%
15%
10%
8%
13%
9%
11%
14%
13%
10%
16%
5%
6%
9%
13%
9%
0%
8%
10%
11%
8%
4%
8%
11%
12%
9%
27%
6%
13%
10%
9%
7%
2%
19%
17%
16%
12%
7%
6%
10%
11%
10%
12%
2%
8%
4%
10%
5%
2%
4%
8%
6%
9%
6%
5%
1%
13%
13%
4%
5%
0%
2%
6%
6%
4%
4%
5%
3%
2%
5%
5%
8%
6%
3%
2%
3%
9%
9%
1%
9%
5%
6%
6%
3%
6%
6%
4%
2%
3%
5%
8%
2%
2%
6%
3%
4%
11%
6%
5%
8%
2%
10%
5%
3%
0%
6%
6%
5%
4%
2%
5%
2%
5%
2%
7%
2%
4%
1%
16%
3%
13%
4%
0%
3%
7%
0%
0%
3%
5%
4%
0%
0%
2%
4%
3%
4%
7%
2%
3%
1%
3%
2%
3%
4%
0%
0%
2%
0%
0%
5%
2%
2%
8%
0%
2%
1%
3%
8%
5%
1%
3%
1%
3%
0%
1%
4%
3%
1%
2%
0%
0%
3%
1%
1%
0%
2%
2%
1%
1%
0%
0%
3%
0%
1%
2%
1%
2%
0%
1%
1%
1%
2%
0%
1%
1%
1%
0%
2%
0%
2%
0%
3%
0%
1%
1%
2%
0%
1%
1%
3%
4%
2%
1%
2%
0%
0%
0%
1%
0%
1%
1%
0%
4%
0%
0%
0%
1%
1%
3%
1%
1%
0%
0%
1%
1%
1%
0%
1%
1%
1%
0%
0%
0%
0%
0%
0%
0%
1%
1%
1%
3%
0%
0%
0%
0%
1%
0%
0%
6%
0%
0%
0%
0%
0%
0%
0%
0%
1%
0%
0%
0%
0%
0%
0%
0%
1%
0%
1%
0%
0%
0%
0%
0%
0%
0%
0%
0%
0%
0%
0%
0%
0%
0%
0%
0%
0%
0%
1%
0%
0%
0%
0%
0%
0%
0%
0%
8%
7%
12%
5%
3%
5%
4%
5%
11%
9%
2%
7%
2%
4%
8%
14%
9%
7%
13%
8%
5%
8%
País
3. DetaileD analysis
25 / 48
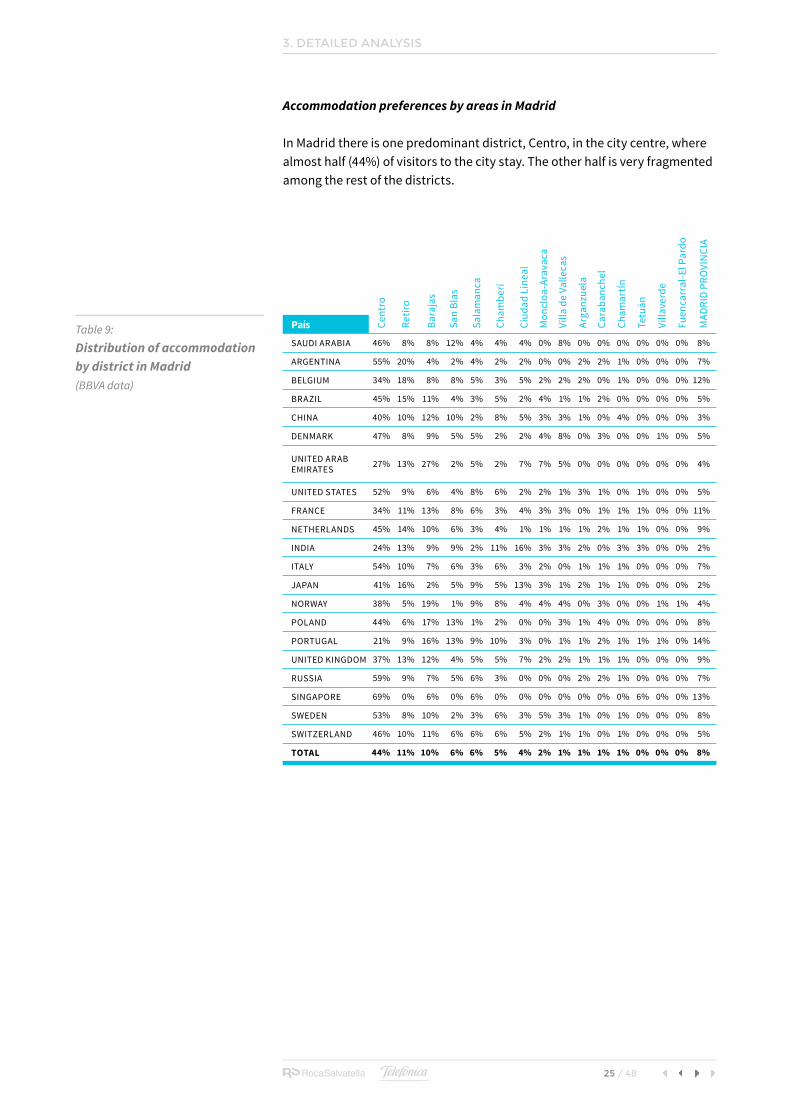
Accommodation preferences by areas in Madrid
In Madrid there is one predominant district, Centro, in the city centre, where almost half (44%) of visitors to the city stay. The other half is very fragmented among the rest of the districts.
Table 9:
Distribution of accommodation by district in Madrid (BBVA data)

CentroRetir
o
Barajas
MADRID PROVINCIA
San Blas
Salamanca
Chamberí
Ciudad Lineal
Moncloa - Aravaca
Villa de Valle
cas
Arganzuela
Carabanchel
Chamartín
Tetuán
Villaverd
e
Fuencarral -
El Pard
o
40%
30%
20%
10%
0%
% Porcentage of overnight stays
INSIDE OUTSIDE
100%
75%
50%
25%
0%
79%
21%
92%
8%
Barcelona Madrid
INSIDE OUTSIDE
100%
75%
50%
25%
0%
79%
21%
92%
8%
Barcelona Madrid
3. DetaileD analysis
26 / 48
Visitors from Singapore, Russia and Argentina have a greater preference for the Centro area with percentages of 69%, 59% and 55% respectively.
Just 8% of visitors stayed outside of the city; this percentage is slightly higher for visitors from Portugal, Singapore and Belgium.
Figure 10:
Percentage of overnight stays by district in Madrid (BBVA data)
Figure 11:
Percentage of overnight stays inside and outside of the city (BBVA data)
In Madrid practically all visitors stay inside the city (92%), while in Barcelona the percentage of tourists who prefer accommodation outside of the city rises to 21%.
Comparison between Barcelona and Madrid in terms of overnight stays inside and outside of the city

SAUDI ARABIA
ARGENTINA
BELGIUM
BRAZIL
CHINA
DENMARK
UNITED ARAB EMIRATES
UNITED STATES
FRANCE
NETHERLANDS
INDIA
ITALY
JAPAN
NORWAY
POLAND
PORTUGAL
UNITED KINGDOM
RUSSIA
SINGAPORE
SWEDEN
SWITZERLAND
2,31
5,62
6,27
4,03
3,31
4,79
2,79
4,07
8,02
7,01
3,22
4,79
2,53
5,5
5,33
7,48
5,72
4,75
2,76
5,09
5,03
Country Barcelona Madrid
5,37
3,66
5,53
3,56
4,15
4,43
5,6
3,47
5,85
4,73
4,2
3,58
2,78
4,22
5,2
6,44
5,23
3,68
6,87
4,4
4,08
3. DetaileD analysis
27 / 48
As part of the study, we analysed the distance to the centre of the city from the accommodation in which tourists stayed and we compared this between the two cities by nationality.
Based on the use of foreign credit cards belonging to tourists, we identified transactions in the accommodation category in which the location of the business is logged. We observed 8,897 accommodation transactions in Madrid and 11,423 accommodation transactions in Barcelona.
The distance to the city centre is measured in a straight line and the units are kilometres. We consider the following to be the city centre of each of the cities: Plaza de Cataluña in Barcelona and Puerta del Sol in Madrid.
As a general rule, visitors from countries farther away such as Japan, China and Brazil tend to stay closer to the city centre, while visitors from nearby countries such as Portugal, France and Belgium choose accommodation farther from the centre. One notable exception is visitors from Singapore and the Middle East, who stayed far from the centre in Madrid but near the centre in Barcelona.
3.4.2. Distances from the city centre
Table 10:
Distance (km) from accommodation to the city centre: Plaza de Cataluña and Puerta del Sol(BBVA data)

600€
500€
400€
300€
100€
200€
0€
SINGAPORE
CHINA
JAPAN
SAUDI ARABIA
UNITED ARAB EMIRATES
RUSSIA
SWITZERLANDIN
DIA
BRAZIL
UNITED STATESITALY
BELGIUM
NETHERLANDS
FRANCE
UNITED KINGDOM
POLAND
DENMARK
ARGENTINA
NORWAY
SWEDEN
PORTUGAL
161,5€
Barcelona Madrid
INSIDE OUTSIDE
100%
75%
50%
25%
0%
79%
21%
92%
8%
Barcelona Madrid
3. DetaileD analysis
28 / 48
Barcelona:The total average distance that visitors stay from the city centre is 5.5 kilometres.
Visitors from Saudi Arabia, Japan and Singapore are those that stay closest to the centre of Barcelona. French, Portuguese and Dutch visitors stay farthest from the centre.
Madrid: The total average distance that visitors stay from Madrid city centre is 4.5 kilometres.
Visitors from Japan, the United States and Brazil are those that stay closest to the city centre. Visitors from Singapore, Portugal and France stay farthest from the centre.
3.5. Spending
3.5.1. Cumulative average spending by card throughout the stay
Another interesting point to analyse is tourists’ spending during their stay. This allows us to detect spending patterns by nationality in each city and estimate the hotel category they stay in based on the amount they spend on accommodation.
Foreign credit cards belonging to tourists show us the total amount spent by each of them during the study period. Therefore, it is the amount spent by card, i.e. the family unit, not the individual tourist. It can also be broken down by city visited and the visitor’s country of origin.
Figure 12:
Average overall spending by card throughout the study period by country and city (BBVA data)
The average cumulative card expenditure by each visitor in Spain during those two weeks was €161.5 (dotted red line).

SAUDI ARABIA
ARGENTINA
BELGIUM
BRAZIL
CHINA
DENMARK
UNITED ARAB EMIRATES
UNITED STATES
FRANCE
NETHERLANDS
INDIA
ITALY
JAPAN
NORWAY
POLAND
PORTUGAL
UNITED KINGDOM
RUSSIA
SINGAPORE
SWEDEN
SWITZERLAND
WEIGHTED AVERAGE SPENDING
276,20 €
98,22 €
121,43 €
143,46 €
419,26 €
112,21 €
291,88 €
140,82 €
105,73 €
107,41 €
181,55 €
122,01 €
298,39 €
139,40 €
124,86 €
92,65 €
116,25 €
204,19 €
378,91 €
94,64 €
161,73 €
152,68 €
Country Barcelona Madrid
293,34 €
105,08 €
122,19 €
137,38 €
459,76 €
107,00 €
201,08 €
131,73 €
115,18 €
117,45 €
170,90 €
125,50 €
299,25 €
101,30 €
110,64 €
90,26 €
114,60 €
198,63 €
532,55 €
92,56 €
182,26 €
174,37 €
3. DetaileD analysis
29 / 48
There are significant differences by country of origin in this section with very high amounts and very low amounts at both extremes.
The visitors who spend the most are those from Singapore, China and Japan, in that order. Visitors from Switzerland, the highest-spending European citizens, are also slightly above average. Visitors who spent the least money in Spain were those from nearby countries such as Portugal and France, Nordic countries such as Sweden and Denmark, and also a non-European country, Argentina.
Comparison of average spending between Barcelona and Madrid
Table 11:
Average spending (€) by card during the stay broken down by nationality and city (BBVA data)
Average spending during the stay by tourists in Madrid is 14% higher than the average amount spent in Barcelona (€174.37 v €15.268).
There is a very significant difference in both cities between spending during the week and spending at the weekend, with 25% higher expenditure during the week. The fact that shops are closed on Sundays could be decisive in this.
The country ranking is similar in both cities with considerably higher expenditure for visitors from countries in the Middle East and Far East.

Barcelona Madrid
250€
200€
150€
50€
100€
0€
CHINA
SINGAPORE
JAPAN
SAUDI ARABIA
SWITZERLAND
UNITED ARAB EMIRATES
RUSSIA
UNITED STATES
BELGIUM
INDIA
FRANCE
UNITED KINGDOM
BRAZILITALY
DENMARK
NORWAY
NETHERLANDS
ARGENTINA
POLAND
PORTUGAL
SWEDEN
58,5€/day
INSIDE OUTSIDE
100%
75%
50%
25%
0%
79%
21%
92%
8%
Barcelona Madrid
3. DetaileD analysis
30 / 48
Since the amount spent tends to build up the longer visitors stay, in this section we have analysed the average daily spending on each card. This allows us to determine which countries spend the most regardless of the number of days they stay in Madrid or Barcelona.
Credit card data can be used to analyse the average spending by card and day, broken down by nationality. This is the result of dividing total spending by the number of days on which the card was active (the difference between the date of the last transaction and the first one). In order to avoid distortion, we have only taken into account cards used on more than one day.
3.5.2. Average daily spending
Figure 13:
Average daily spending by card broken down by country and city (BBVA data)
The average daily spending by each visitor in Spain is €58.5/day (dotted line).
There are significant differences by country of origin in this section with very high amounts and very low amounts at both extremes.
The visitors who spent the most come from China, Singapore, Japan and the Arabian Peninsula.
The visitors who spent the least money in Spain come from Nordic countries such as Sweden and Denmark, neighbouring countries such as Portugal and non-European countries such as Argentina.

SAUDI ARABIA
ARGENTINA
BELGIUM
BRAZIL
CHINA
DENMARK
UNITED ARAB EMIRATES
UNITED STATES
FRANCE
NETHERLANDS
INDIA
ITALY
JAPAN
NORWAY
POLAND
PORTUGAL
UNITED KINGDOM
RUSSIA
SINGAPORE
SWEDEN
SWITZERLAND
103,45
35,98
54,45
49,13
199,65
35,29
118,17
66,74
53,13
42,12
109,37
60,70
143,46
44,11
45,08
41,73
53,57
72,92
139,31
32,19
82,94
2,67
2,73
2,23
2,92
2,10
3,18
2,47
2,11
1,99
2,55
1,66
2,01
2,08
3,16
2,77
2,22
2,17
2,80
2,72
2,94
1,95
Country Daily spending (€) Average stay (days) Total spending (€)
276,20
98,22
121,43
143,46
419,26
112,21
291,88
140,82
105,73
107,41
181,55
122,01
298,39
139,40
124,86
92,65
116,25
204,19
378,91
94,64
161,73
3. DetaileD analysis
31 / 48
Table 12:
Average daily spending in Barcelona by card broken down by nationality(BBVA and Telefónica data)
The order of countries does not significantly change when the cities are compared. Higher levels of spending are between €140 and €200 and the lower range is around €35.

SAUDI ARABIA
ARGENTINA
BELGIUM
BRAZIL
CHINA
DENMARK
UNITED ARAB EMIRATES
UNITED STATES
FRANCE
NETHERLANDS
INDIA
ITALY
JAPAN
NORWAY
POLAND
PORTUGAL
UNITED KINGDOM
RUSSIA
SINGAPORE
SWEDEN
SWITZERLAND
113,70
45,89
63,64
55,40
204,34
53,77
95,75
64,57
62,94
50,19
63,30
54,80
139,84
51,42
45,72
42,58
55,63
90,29
195,07
34,67
100,7
2,58
2,29
1,92
2,48
2,25
1,99
2,10
2,04
1,83
2,34
2,70
2,29
2,14
1,97
2,42
2,12
2,06
2,20
2,73
2,67
1,81
Country Daily spending (€) Average stay (days) Total spending (€)
293,34
105,08
122,19
137,38
459,76
107,00
201,08
131,73
115,18
117,45
170,90
125,50
299,25
101,30
110,64
90,26
114,60
198,63
532,55
92,56
182,26
3. DetaileD analysis
32 / 48
Table 13:
Average daily spending by card in Madrid broken down by nationality(BBVA and Telefónica data)
Although the order of countries is distributed similarly there is slightly higher spending by tourists in Madrid. The upper range is between €140 and €205 and the lower range is from €35 to €45.

Barcelona Madrid
1000€
900€
800€
600€
700€
500€
400€
300€
200€
100€
0€
SAUDI ARABIA
INDIA
UNITED ARAB EMIRATES
CHINA
SWITZERLAND
DENMARK
SINGAPORE
UNITED STATES
RUSSIA
NORWAY
POLAND
UNITED KINGDOM
NETHERLANDSITALY
BELGIUM
SWEDEN
BRAZIL
PORTUGAL
FRANCE
ARGENTINA
JAPAN
298,71 €
INSIDE OUTSIDE
100%
75%
50%
25%
0%
79%
21%
92%
8%
Barcelona Madrid
3. DetaileD analysis
33 / 48
3.5.3. Cumulative average spending on accommodation by card during the stay
Credit card analysis also shows the total spending by each of them on accommodation during the study period. This can also be broken down by city and the visitor’s country of origin.
It is important to mention that average spending on accommodation alone (€298.7, see Figure 14) is far higher than total average spending (€136.5, see Figure 12). The same applies to average daily spending, as detailed in the following point. This may initially seem to make no sense but the difference lies in the number of transactions in each case. The total volume of transactions amounts to more than 253,000, while the number of transactions on accommodation alone is approximately 20,000. Hence, when total spending is averaged out, it is diluted by low-volume transactions and therefore is lower than average spending on accommodation.
Figure 14:
Average spending by card on accommodation during the study period by country and city(Telefónica data and BBVA)
Average total spending on accommodation on each of the visitors’ credit cards in Spain during those two weeks was €298.71 (dotted red line).
As one might expect, there is polarisation here too. There are two main groups for average spending on accommodation. The group of countries from the Middle East and India spend practically twice as much on accommodation as the rest of countries. This could be explained by the fact that the groups or family units who visit us are larger so the cost is higher.
Argentinians, French, Portuguese and Brazilians spend the least on accommodation. That is in spite of the fact that 10% of tourists from these countries stay in Madrid or Barcelona for more than 6 days.

SAUDI ARABIA
ARGENTINA
BELGIUM
BRAZIL
CHINA
DENMARK
UNITED ARAB EMIRATES
UNITED STATES
FRANCE
NETHERLANDS
INDIA
ITALY
JAPAN
NORWAY
POLAND
PORTUGAL
UNITED KINGDOM
RUSSIA
SINGAPORE
SWEDEN
SWITZERLAND
AVERAGE SPENDING ON ACCOMMODATION
909,60
166,58
286,88
250,54
394,41
327,84
561,17
333,38
182,50
331,92
600,43
305,22
279,85
304,26
330,09
180,90
300,88
343,47
429,78
219,06
362,82
311,43
Country Barcelona Madrid
794,61
174,66
228,31
207,96
372,82
340,94
460,18
302,30
175,56
236,99
474,39
224,17
323,41
305,96
234,90
179,84
263,56
263,13
252,86
294,53
367,87
280,16
3. DetaileD analysis
34 / 48
Comparison of average spending on accommodation between Barcelona and Madrid
The ranking of spending by countries is different in Madrid and Barcelona; in addition, the absolute value of spending in Barcelona is considerably lower than in Madrid (around 20%). Part of this additional expenditure could be due to the visitors staying slightly longer in Barcelona than in Madrid, 2.28 days versus 2.15 days. One should also consider that hotels in Barcelona could be more expensive than those in Madrid.
Table 14:
Average spending (€) on accommodation by card throughout the study period broken down by nationality and city (BBVA data)

400€
350€
300€
250€
200€
150€
100€
50€
0€
SAUDI ARABIA
INDIA
UNITED ARAB EMIRATES
SWITZERLANDCHIN
A
UNITED STATES
JAPAN
DENMARK
UNITED KINGDOM
NORWAY
SINGAPORE
ITALY
BELGIUM
RUSSIA
NETHERLANDS
POLAND
FRANCE
SWEDEN
BRAZIL
PORTUGAL
ARGENTINA
Barcelona Madrid
129€
INSIDE OUTSIDE
100%
75%
50%
25%
0%
79%
21%
92%
8%
Barcelona Madrid
3. DetaileD analysis
35 / 48
3.5.4. Average daily spending on accommodation
If one divides total spending on accommodation by visitors from each country by the average stay, that gives the average daily spending on accommodation by country. This figure is very useful in determining visitors’ hotel category preferences for each country.
Figure 15:
Average daily spending by card on accommodation by country and city (Telefónica data and BBVA)
Average daily spending on accommodation (price per night) by each visitor in Spain during those two weeks is €129 (dotted red line).
Daily spending by nationalities follows a similar pattern to cumulative spending. On the one hand, tourists from the Arabian Peninsula and India spend the most on accommodation per day. On the other hand, Argentinians, Portuguese and Brazilians spend the least on accommodation.
As far as the difference between cities is concerned, visitors from Denmark, Norway and Sweden respectively spend an average of 66%, 61% and 48% more in Madrid than in Barcelona. Tourists from India and Singapore spend more in Barcelona: 106% and 71% more, respectively.
Average daily spending by card on accommodation by country and city (price per night)

340,67
61,02
128,65
85,80
187,81
103,09
227,19
158,00
91,71
130,16
361,70
151,85
134,54
96,28
119,17
81,49
138,65
122,67
158,01
74,51
186,06
2,67
2,73
2,23
2,92
2,10
3,18
2,47
2,11
1,99
2,55
1,66
2,01
2,08
3,16
2,77
2,22
2,17
2,80
2,72
2,94
1,95
909,60
166,58
286,88
250,54
394,41
327,84
561,17
333,38
182,50
331,92
600,43
305,22
279,85
304,26
330,09
180,90
300,88
343,47
429,78
219,06
362,82
SAUDI ARABIA
ARGENTINA
BELGIUM
BRAZIL
CHINA
DENMARK
UNITED ARAB EMIRATES
UNITED STATES
FRANCE
NETHERLANDS
INDIA
ITALY
JAPAN
NORWAY
POLAND
PORTUGAL
UNITED KINGDOM
RUSSIA
SINGAPORE
SWEDEN
SWITZERLAND
Country Daily spending (€) Average stay (days) Total spending (€)
307,99
76,27
118,91
83,85
165,7
171,33
219,13
148,19
95,93
101,28
175,70
97,89
151,13
155,31
97,07
84,83
127,94
119,60
92,62
110,31
203,24
2,58
2,29
1,92
2,48
2,25
1,99
2,10
2,04
1,83
2,34
2,70
2,29
2,14
1,97
2,42
2,12
2,06
2,20
2,73
2,67
1,81
794,61
174,66
228,31
207,96
372,82
340,94
460,18
302,30
175,56
236,99
474,39
224,17
323,41
305,96
234,90
179,84
263,56
263,13
252,86
294,53
367,87
SAUDI ARABIA
ARGENTINA
BELGIUM
BRAZIL
CHINA
DENMARK
UNITED ARAB EMIRATES
UNITED STATES
FRANCE
NETHERLANDS
INDIA
ITALY
JAPAN
NORWAY
POLAND
PORTUGAL
UNITED KINGDOM
RUSSIA
SINGAPORE
SWEDEN
SWITZERLAND
Country Daily spending (€) Average stay (days) Total spending (€)
3. DetaileD analysis
36 / 48
Table 15:
Average daily spending on accommodation in Barcelona by card broken down by nationality (BBVA and Telefónica data)
Table 16:
Average daily spending on accommodation in Madrid broken down by nationality
(BBVA and Telefónica data)

4. Specific recommendationS for hotelS
37 / 48
4. SpECIFIC RECOMMENDA-TIONS FOR hOTElS
4.1. Introduction
4.2. Spending-based hotel category methodology
We conclude the study with a series of tactical and strategic recommendations for hotel managers, divided into accommodation category and specific management action.
Winning customers: countries of origin on which to focus marketing work, recommendations concerning channels and communication languages in countries of origin and at the destination.
Location/expansion: areas of interest by nationality
Product configuration: the ideal package length, information about complementary services demanded by different nationalities.
Obviously, any decision-making should be based on more in-depth analysis covering a longer timeframe, which would make it possible to show seasonal and annual variations. Recommendations are included as a sample of the kind of applications that using these data sources could have in a new business intelligence model in the industry.
We used the average daily spending by nationality to select the hotel category based on these data in the above tables. In this case, we propose the following hotel categories based on an average daily rate (ADR):
5-star hotel: ADR more than €140 4-star hotel: ADR between €100 and €1403-star hotel: ADR less than €100
This categorisation allows us to link hotel categories with each country. For example, Belgians’ average spending in Barcelona is €128.65, which would mean a 4-star hotel, while Swiss average spending of €203.24 in Madrid would mean a 5-star hotel.
So, based on the above hotel categorisation, using average spending or ADR to do so, the following can be concluded:
Visitors from non-European countries and non-Latin American countries mostly stay in 5-star hotels. Apart from Switzerland, which is also in the 5-star list.
•
•
•
•••

4. Specific recommendationS for hotelS
38 / 48
Visitors from European countries mainly stay in 4-star hotels, except for French and Portuguese visitors who stay in lower category hotels.
Brazil and Argentina are the only non-European countries that stay in 3-star or lower accommodation.
Sweden is a surprise in that unlike the rest of Nordic countries they also stay in 3-star accommodation together with the French and Portuguese.
The main visitor countries in terms of tourist numbers are as follows:
Barcelona province: France, Italy, the United Kingdom and the NetherlandsMadrid province: France, Italy, the United Kingdom and Portugal
For these countries it is considered necessary to carry out action to win customers irrespective of the parameters analysed in the study.
Both French and Portuguese have a lower level of spending than other countries. It is recommended to carry out action to win customers through intermediaries or, in any case, in a very segmented manner to ensure profitability, as they have greater capillarity and expenditure is 100% variable for hotels.
There is great potential for growth in BRIC countries (Brazil, India, Russia and China). Madrid seems to have the greatest potential for Brazilians and Chinese, while Barcelona has the greatest potential for Russians. India is still a tiny market for both cities. It is worth highlighting the purchasing power of visitors from China, which are clearly luxury hotel customers.
There are very large differences in spending on accommodation for some countries. Swedes and Japanese spend much more on accommodation in Madrid than in Barcelona, while tourists from the Arabian Peninsula, India and Italy spend much more in Barcelona.
4.3. Overall recommendations
••
4. Specific recommendationS for hotelS
39 / 48
4.4. Specific action for hotels in Barcelona
4.4.1. 5-star hotels in Barcelona (total daily price of more than €140)
Action to win customers
• SEM / SEO campaigns: • All hotels: Italy, Switzerland, the United States, China, Arab Emirates, India, Saudi Arabia and Singapore. Baidu campaign for China. • Central hotels only: Switzerland, China, India.
• Luxury websites or intermediaries specifically for Switzerland and the United States and using intermediaries operating in all of the aforementioned countries
Languages the website should be translated into: Spanish, English, German, French, Italian.
Location
Tourists from the Arabian Peninsula and India look for a central location in Ciutat Vella and those from the United States and Singapore also stay in central locations but in Eixample. Location is not a determining factor for Chinese, Italians and Swiss.
Offers
The average stay for visitors in these hotels is 2 to 3 days. Offers should be made for that length of stay with long-stay discounts from the fourth night.
Implications for hotel services
There must be hotel staff who speak English, German, Italian, Dutch, French, Mandarin and Arabic.
Meals must be adapted and properly labelled for tourists of these nationalities.
There is an opportunity to sell additional products and services to visitors from China whose average daily spending is very high and who consume luxury products. Offering them related services (dinners in luxury restaurants, reaching agreements with exclusive jewellers, etc.) could constitute a new source of income.

4. Specific recommendationS for hotelS
40 / 48
Action to win customers
• SEM / SEO campaigns: • Spain, France, Italy, the United Kingdom, the Netherlands, Denmark, Russia, Poland and Japan. • Due to the low volume of spending by French people during their stay, for France we recommend daily budget control of campaigns so that the ROI is positive. • Yandex and Google campaign for Russia.
• Luxury websites or intermediaries specifically for Nordic countries as well as using intermediaries operating in all of the aforementioned countries.
Languages the website should be translated into: Spanish, English, German, French, Russian, Italian, Dutch and Japanese.
Location
Customers from these countries are mainly spread among hotels in Ciutat Vella, Eixample, Sant Martí and the outskirts. Japanese are an exception; half of them stay in Eixample.
Offers
2- to 3-day offers should be made for all countries.
Implications for hotel services
Staff in these hotels must be able to speak Spanish, English, French, Russian, German and Japanese.
There is an opportunity for the hotel to sell additional products or services to Russian visitors and also to Japanese visitors who spend considerable amounts in fashion shops in Barcelona. Offering them related services (personal shoppers, organised trips to shops, etc.) could constitute a new source of income.
Action to win customers
• SEM / SEO campaigns: • Spain, France, Sweden, Norway, Portugal, Brazil and Argentina. • Due to the low volume of spending by French people during their stay, for France we recommend daily budget control of campaigns so that the ROI is positive.
4.4.2. 4-star hotels in Barcelona (total daily price between €100 and €140)
4.4.3. 3-star hotels in Barcelona (total daily price less than €100)

4. Specific recommendationS for hotelS
41 / 48
• Luxury websites or intermediaries specifically for Nordic countries as well as using intermediaries operating in all of the aforementioned countries. Since price is a decisive aspect, it is important to be present in all of the mass-market intermediaries used to search for offers and affordable prices
Languages the website should be translated into: Spanish, English, German, French and Portuguese.
Location
Tourists do not generally stay in central hotels (due to the price).
Offers
2- to 3-day offers should be made for all countries. Offers for the French should be more like 2 days and 3 days for Norwegians.
Implications for hotel services
Staff in these hotels should speak Spanish, English, French and Portuguese.
Spending on additional services by these customers is not particularly high so no specific action should be taken.
Action to win customers
• SEM / SEO campaigns: • All hotels: United States, Switzerland, China, Japan, Norway, Denmark, India, Arab Emirates and Saudi Arabia. Baidu campaign for China.
• Luxury websites or intermediaries specifically for Switzerland, the United States and Nordic countries, as well as using intermediaries operating in all of the aforementioned countries.
Languages the website should be translated into: Spanish, English, French and Japanese.
4.5. Specific action for hotels in Madrid
4.5.1. 5-star hotels in Madrid (total daily price of more than €140)

4. Specific recommendationS for hotelS
42 / 48
Location
Most tourists in Madrid always stay in central hotels, especially those from the Americas. A central hotel is not a determining factor in choosing a hotel for citizens of the Arab Emirates and India.
Offers
The average stay by visitors in these hotels is 2 to 3 days; the Swiss stay the shortest length of time and Indians have the longest average stay in Madrid. Offers should be for a two-day stay with long-stay discounts from the third night.
Implications for hotel services
There must be hotel staff who speak English, French, Japanese and Arabic.
Meals must be adapted and properly labelled for tourists of these nationalities.
There is an opportunity to sell additional services to visitors from China, Japan and the Arabian Peninsula whose average daily spending is very high and who consume luxury products. Offering them related services (dinners in luxury restaurants, reaching agreements with exclusive jewellers, etc.) could constitute a new source of income.
Action to win customers
• SEM / SEO campaigns: All hotels: United Kingdom, Netherlands, Belgium, Russia, Sweden and Russia.
• Nordic luxury websites or intermediaries as well as using intermediaries operating in all of the aforementioned countries.
Languages the website should be translated into: Spanish, English, German, French, Dutch and Russian.
Location
Tourists in Madrid almost always stay in central hotels, especially Russians.
Offers
The average stay for visitors in these hotels is 2 days. Offers should be for a two-day stay with long-stay discounts from the third night.
4.5.2. 4-star hotels in Madrid (total daily price between €100 and €140)

4. Specific recommendationS for hotelS
43 / 48
Implications for hotel services
There must be hotel staff who speak English, French, German, Dutch and Russian.
Meals must be adapted and properly labelled for tourists of these nationalities.
There is an opportunity to sell additional products or services to visitors from Russia whose average daily spending is very high and who consume luxury products. Offering them related services (dinners in luxury restaurants, reaching agreements with exclusive jewellers, etc.) could constitute a new source of income.
Action to win customers
• SEM / SEO campaigns: • Spain, France (cost control), Italy, Portugal, Poland, Brazil, Argentina and Singapore.
• Since price is a decisive aspect, it is important to be present in all of the mass-market intermediaries used to search for offers and affordable prices. It is especially recommended to give particular emphasis to intermediaries for France, Portugal and Brazil.
Languages the website should be translated into: Spanish, English, German, French, Portuguese and Italian.
Location
Tourists have a preference for the Centro area in the city centre in Madrid.
Offers
2-day offers should be made for all countries with the possibility of 3 days for tourists from Singapore.
Implications for hotel services
Staff in these hotels must speak Spanish, English, French, Italian and Portuguese.
Spending on additional services by these customers is not particularly high so no specific action should be taken.
4.5.3. 3-star hotels in Madrid (total daily price less than €100)

AMOUNT
DATE
COUNTRY
CARD ID
POS terminal ID
CATEGORY
LATITUDE
LONGITUDE
Amount of the transaction in €
Date and time the payment was made
Country of the credit or debit card issuer
The card’s ID. This is never the same as the card’s real number
ID of the Point of Sale terminal inthe shop where the purchase is made
The shop’s commercial category
The shop’s latitude
The shop’s longitude
Field Description
5. Methodological note
44 / 48
The datasets used in the study are described below, stating what they are like, how they retained and their potential limitations. In both cases, the datasets are limited to the geographical scope of the provinces of Madrid and Barcelona and the period between 7 and 21 October 2012, both inclusive.
The dataset is based on the data gathered by BBVA’s electronic payment systems: transactions carried out by users of credit or debit cards issued by foreign card issuers (foreign customers) in shops that use BBVA POS terminals.
In order to distinguish foreign tourists from expatriates living in Spain we only included foreign cards in the dataset that performed transactions between 7 and 21 October 2012 and that remained in the country for a period of less than 15 days throughout 2012.
The POS terminals covered by this report are those located in the provinces of Madrid and Barcelona.
The study’s conclusions are directly based on the data gathered by BBVA’s electronic payment systems. We have not applied coefficients to deduce all of the payments made by other means.
These data are completely anonymous. We have worked with data aggregated in time and space after duly eliminating information about individuals and legal persons through irreversible processes to guarantee users’ privacy pursuant to the Organic Law on Personal Data protection (Ley Orgánica de Protección de Datos Personales 15/1999) and its regulations (RD 1720/2007). Information from card transactions in shops and cash machines in the city was used for statistical purposes only. Under no circumstances can this analysis be used to trace individual people’s behaviour.
5. METhODOlOG-ICAl NOTE
5.1. Description of the datasets
5.1.1. BBVA dataset
Table 17:
Fields and descriptions of BBVA’s dataset

DATE
COUNTRY
TELEPHONE ID
CELL ID
LATITUDE
LONGITUDE
Date and time the event took place
Country of the operator that issued the telephone’s SIM card
The telephone’s ID. Under no circumstances is it the telephone’s real number
The ID of the base station the telephone was connected to when the event took place
Latitude of the base station’s position
Longitude of the base station’s position
Field Description
5. Methodological note
45 / 48
One aspect to take into account is that credit or debit card payments are only part of the total payments in the shop since approximately 50% of spending in shops is carried out using cash. This percentage fluctuates depending on the shop’s category and its surrounding area but also cultural biases inherent to the user’s nationality. None of the results presented in this report is an extrapolation used to deduce total spending by foreign tourists. In all cases, the figures shown are those gathered by BBVA’s electronic payment systems and they should not be taken as absolute figures for spending through any means of payment.
The dataset used in this study comes from records of certain network events generated by telephones with a SIM card issued by operators outside of Spain, which are roaming on Telefónica Móviles España’s network. Examples of these kinds of events include turning on the telephone, sending an SMS, making a call or changing coverage area. When one of these events takes place, it is logged together with the base station the telephone is connected to and the time it took place. Since the exact location of each base station is known, that gives an approximate idea of where the telephone is at that time.
Logs basically have the following format:
5.1.2. Telefónica’s dataset
Table 18:
Fields and descriptions of Telefónica’s dataset
To comply with data protection regulations and ensure privacy, these logs are anonymous since the real telephone number is replaced with a unique identifier in a way that makes it impossible to carry out the process in reverse (you cannot obtain the telephone number from the identifier). However, furthermore, the logs are not used individually: they are always aggregated in order to identify general behaviour (normally by nationality) and never individually. As if that were not enough, the identity of the owners of roaming telephones (those used in this study) is information that Telefónica Móviles España never possesses as they are not its own subscribers. In view of all this, it is totally impossible to individually identify the owners of those telephones.

5. Methodological note
46 / 48
As with all datasets, there are certain limitations of which one needs to be aware. The telephone’s location is not totally precise as what we have is actually the base station’s location. That is not too problematic in urban environments as the density of base stations there is high enough to provide reasonable precision; but it can be in rural areas. There may be another limitation when extrapolating total data from the information obtained. One specific example is that not all telephones used by Russian tourists who visit Spain connect to Telefónica’s network, which means that if one wants to know the total number of Russian telephones then some extrapolation is necessary that could introduce certain errors. In this report all of the data presented are not extrapolated, so they cannot be taken as absolute. However, we think that nevertheless they provide a pretty clear idea of the situation.
This report has been drawn up based on anonymised, aggregate data that have then been extrapolated through a statistical process ensuring they are completely disassociated pursuant to Spanish law (LOPD 15/1999 and its developing regulations, RD 1720/2007, and Ley General de Telecomunicaciones 32/2003). This completely prevents the identification of any individual based on the data used and so guarantees users’ privacy. The data and recommendations described are based on the data gathered as described in 5.1.1 and 5.1.2. Coefficients have not been used to extrapolate all of the indicators in this report. Data was processed subject to a responsible code of conduct by all parties and processing was carried out solely in order to encourage progress in transforming society and tourism.
5.2. Privacy

6. ANNEX
47 / 48
Unique telephones registered (Telefónica data)
Average stay (Telefónica data)
Average stays in Barcelona depending on the day on which the visits start and the total (Telefónica data)
Average stays in Madrid depending on the day on which the visits start and the total (Telefónica data)
Percentage distribution of the number of telephones in Barcelona according to four stay length ranges (Telefónica data)
Percentage distribution of the number of telephones in Madrid according to four stay length ranges (Telefónica data)
Travel between cities (B-Barcelona, M-Madrid) expressed in percentages. For example, B shows the telephone does not leave Barcelona and B-M-B shows the telephone moved to Madrid and back to Barcelona (Telefónica data)
Distribution of accommodation by district in Barcelona (BBVA data)
Distribution of accommodation by district in Madrid (BBVA data)
Distance (km) from accommodation to the city centre: Plaza de Cataluña and Puerta del Sol (BBVA data)
Average spending (€) by card during the stay broken down by nationality and city (BBVA data)
Average daily spending in Barcelona by card broken down by nationality (BBVA and Telefónica data)
Average daily spending by card in Madrid broken down by nationality (BBVA and Telefónica data)
Average spending (€) on accommodation by card throughout the study period broken down by nationality and city (BBVA data)
Average daily spending on accommodation in Barcelona by card broken down by nationality (BBVA and Telefónica data)
Average daily spending on accommodation in Madrid broken down by nationality (BBVA and Telefónica data)
Fields and descriptions of BBVA’s dataset
Fields and descriptions of Telefónica’s dataset
Table 1:
Table 2:
Table 3:
Table 4:
Table 5:
Table 6:
Table 12:
Table 14:
Table 16:
Table 7:
Table 11:
Table 13:
Table 15:
Table 17:
Table 18:
Table 8:
Table 9:
Table 10:
6.1. List of tables
6. ANNEx
13
15
16
17
19
20
21
23
25
29
32
36
44
45
31
34
36
27

6. ANNEX
48 / 48
6.2. List of figures
Distribution of visitors by country (Telefónica data)
Distribution of visitors between Barcelona and Madrid (Telefónica data)
City preference, Barcelona over Madrid (Telefónica data)
City preference, Madrid over Barcelona (Telefónica data)
Average stay in days in Barcelona and Madrid (Telefónica data)
Overall distribution of length of stay (Telefónica data)
Distribution by days spent in Barcelona (Telefónica data)
Distribution by days spent in Madrid (Telefónica data)
Percentage of overnight stays by district in Barcelona (BBVA data)
Percentage of overnight stays by district in Madrid (BBVA data)
Percentage of overnight stays inside and outside of the city (BBVA data)
Average overall spending by card throughout the study period by country and city (BBVA data)
Average daily spending by card broken down by country and city (BBVA data)
Average spending by card on accommodation during the study period by country and city (Telefónica data and BBVA)
Average daily spending by card on accommodation by country and city (Telefónica data and BBVA)
Figure 1:
Figure 2:
Figure 3:
Figure 4:
Figure 5:
Figure 6:
Figure 7:
Figure 8:
Figure 9:
Figure 10:
Figure 11:
Figure 12:
Figure 13:
Figure 15:
Figure 14:
14
14
14
14
18
18
19
20
24
26
26
28
30
35
33