Idescat. Indicators of the competitive position of tourism ... · 2 INDICATORS OF THE COMPETITIVE...
33
INDICATORS OF THE COMPETITIVE POSITION OF TOURISM IN CATALONIA Àlex Costa Cèlia Gomà Xavier López Statistical Institute of Catalonia Cáceres (Spain), November 14-16, 2006
Transcript of Idescat. Indicators of the competitive position of tourism ... · 2 INDICATORS OF THE COMPETITIVE...

INDICATORS OF THE COMPETITIVE POSITION OF TOURISM IN
CATALONIA Àlex Costa Cèlia Gomà Xavier López Statistical Institute of Catalonia
Cáceres (Spain), November 14-16, 2006

2
INDICATORS OF THE COMPETITIVE POSITION OF TOURISM IN CATALONIA1 Àlex Costa Cèlia Gomà Xavier López Statistical Institute of Catalonia Presentation
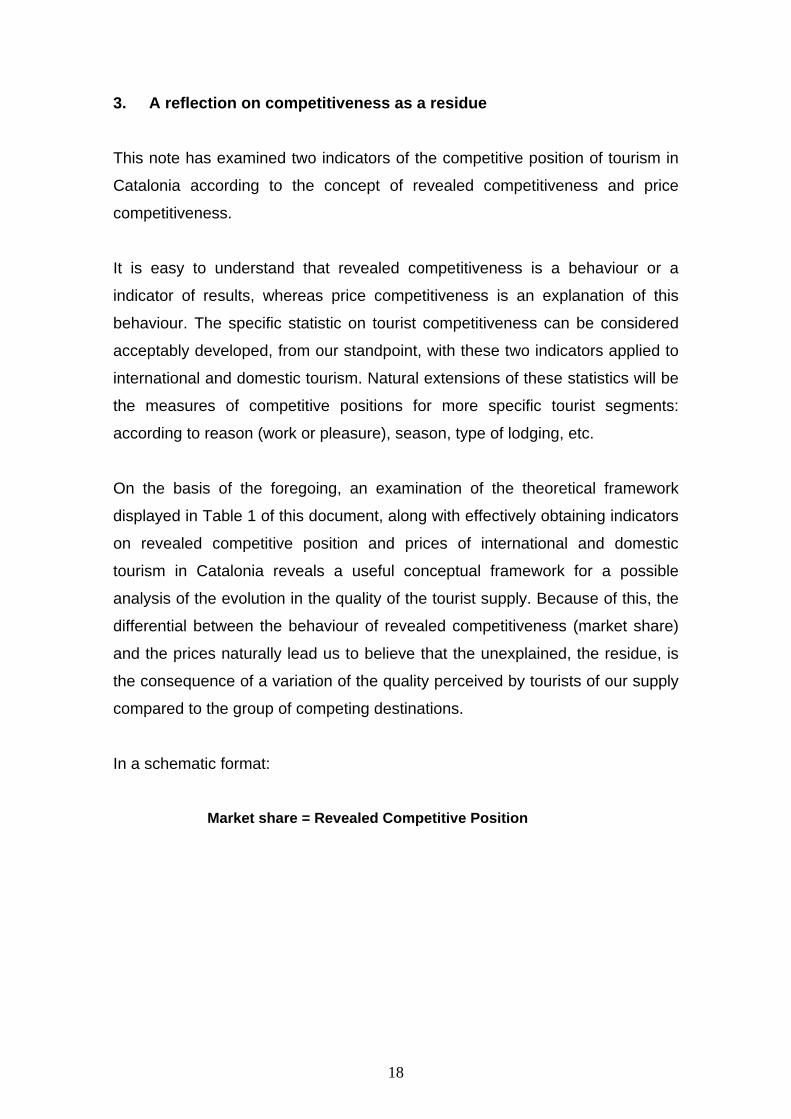
Spain received 55.6 million foreign tourists during 2005, making it the second
most visited country in the world, with a 6.9% share in total world-wide tourism
(808 million). It falls behind France (76.9 million tourists) but ahead of countries
with longstanding tourist traditions like Italy, with 37.9 million tourists, or major
economies linked globally, such as the United States (50.5 million tourists) and
Great Britain (30.4 million).
In this context, within Spain Catalonia occupies an outstanding position: it is the
top destination in Spain for international tourists. In 2005, one out of every four
tourists who came to Spain chose Catalonia as their destination, for a total of
fourteen million foreign visitors.
Despite the importance of the tourist sector in Catalonia, as judging by the
revenue it generates and the financing of the trade deficit, there is no
measurement of the evolution of its competitiveness. This specific situation
obtains not only in Catalonia, but also all around Spain. Only the Central Bank
of Spain has made a few calculations of the competitive position of tourism,
although it does not publish any indicator on a regular basis. According to our
information, of all the autonomous regions only Andalusia generates a periodic
indicator of the competitive position of tourism in terms of prices, and the
Balearic Islands also have a recent precise study.
1 The brevity of this note has required us to eliminate certain information of interest. For further information, feel free to contact the authors: [email protected], [email protected], [email protected]

3
This note assumes that specific statistics on competitiveness must be based on
two types of indicators of competitive position: 1) the revealed competitive
position is understood as market share, and 2) the indicator of competitive
position in terms of prices, calculated according to the methodology that the
Central Bank of Spain applies for industrial competitiveness.
From a statistical standpoint, this method avoids two approaches to
competitiveness we deem to be somewhat unspecific or inoperative. First is the
multidimensional concept of competitiveness, in which competitiveness is
related to a set of explanatory factors having to do with innovation, the cost of
R&D, GDP per inhabitant, and so forth. We believe that this might be useful
from an analytical standpoint, although it does not lead to specific statistics on
competitiveness.
A second approach that we have not considered is quality. This factor is very
important when analysing competitiveness, but it is a highly complex statistical
approach, which is why a statistical calculation of the competitiveness in quality
terms will not be undertaken. However, in relation to this concept a hypothesis
can admittedly be useful: "the residual" nature of competitiveness in terms of
quality. If an evolution in price competitiveness and an evolution in effective
competitiveness exist, measured as market share, the residue or the part that
cannot be explained by prices of revealed competitiveness might be compared
to the evolution in quality. This would not be the first time that economists
approached a complex concept in terms of residue. This approach is reflected
in Table 1. The indicator on the behaviour of competitiveness and the
explanatory factor in the market are the statistical ones chosen to generate the
competitiveness statistics (plotted indicators).

4
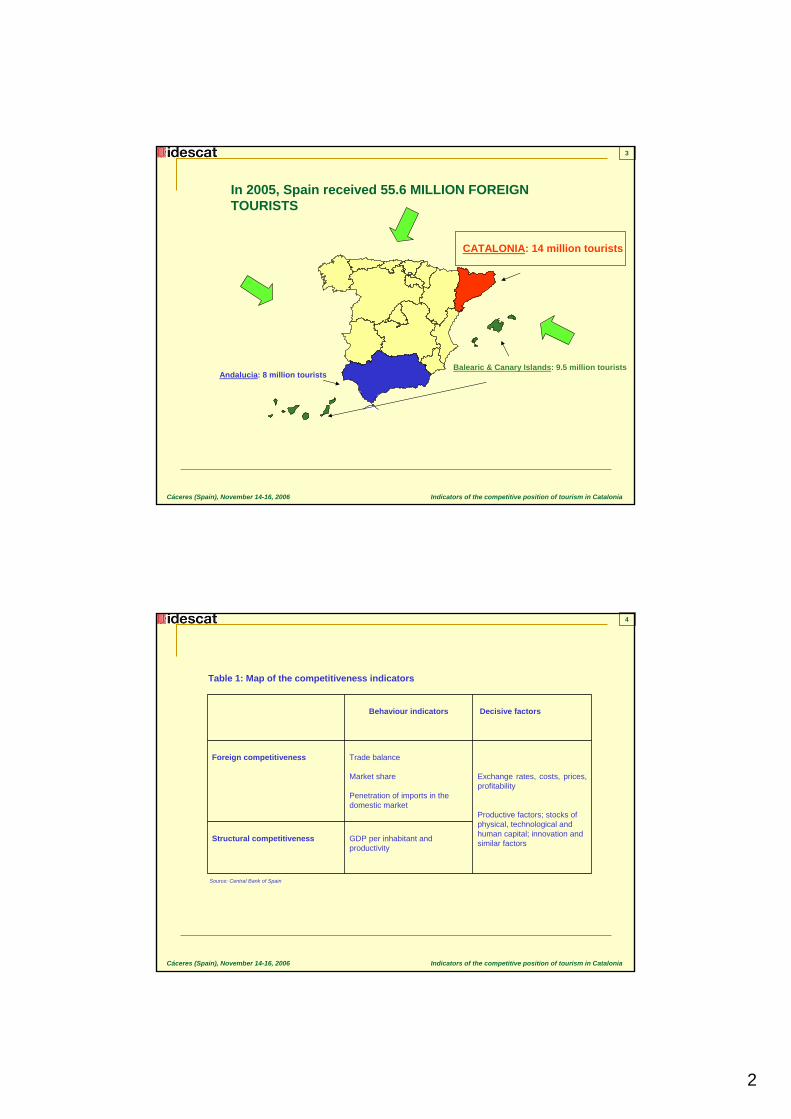
Table 1: Map of the competitiveness indicators
Behaviour indicators Explanatory factors
In the market - Trade balance
- Market shares
- Penetration of imports
- Prices and exchange rates
- Quality of the services available
Outside the market - GDP per inhabitant
- Apparent productivity
- Work costs, income
- Productive factors, expenditures
on R&D, innovation and similar
factors
1. Indicators on the Revealed Competitive Position of Tourism (IPCRT)
An operative way of approaching the evolution in the competitiveness directly in
the market (revealed competitiveness) involves examining the market share of
the agents who participate. The evolution of the market share of any agent can
be viewed as an indicator of the changes in the relative level of
competitiveness. The calculation of the market share, a simple quotient, is easy
to calculate and its meaning is both relevant and simple.
International tourism
This encompasses international tourism and the entire world, and we calculated
the quotient between the number of tourists who came to Catalonia (receiving
tourism) divided by the number of tourists all over the whole world. The
statistical source is the World Tourism Organization (WTO), but as rarely it
examines destinations at sub-state level, for us to find out how many tourist
came to Catalonia we had to examine the information from the Institute of
Tourist Studies (IET), which for Spain as a whole is provided by the OMT.
Between 1997 and 2005, this market share rose from 1.25% to 1.74%. As
shown in Graph 1, in Catalonia this upswing has not been steady (2000 and
2004 were bad), but the market share has risen as a whole. The variation is
deceptively small: Catalonia is a small destination in the world-wide market,
5
meaning that five-tenths difference between 1997 and 2005 actually means
twice the number of foreign tourists.
Graph 1: Market share of Catalonia and Spain in world-wide international tourism (tourists)
0
1
2
3
4
5
6
7
8
1997 1998 1999 2000 2001 2002 2003 2004 2005
Catalonia Spain Source: WTO and IET
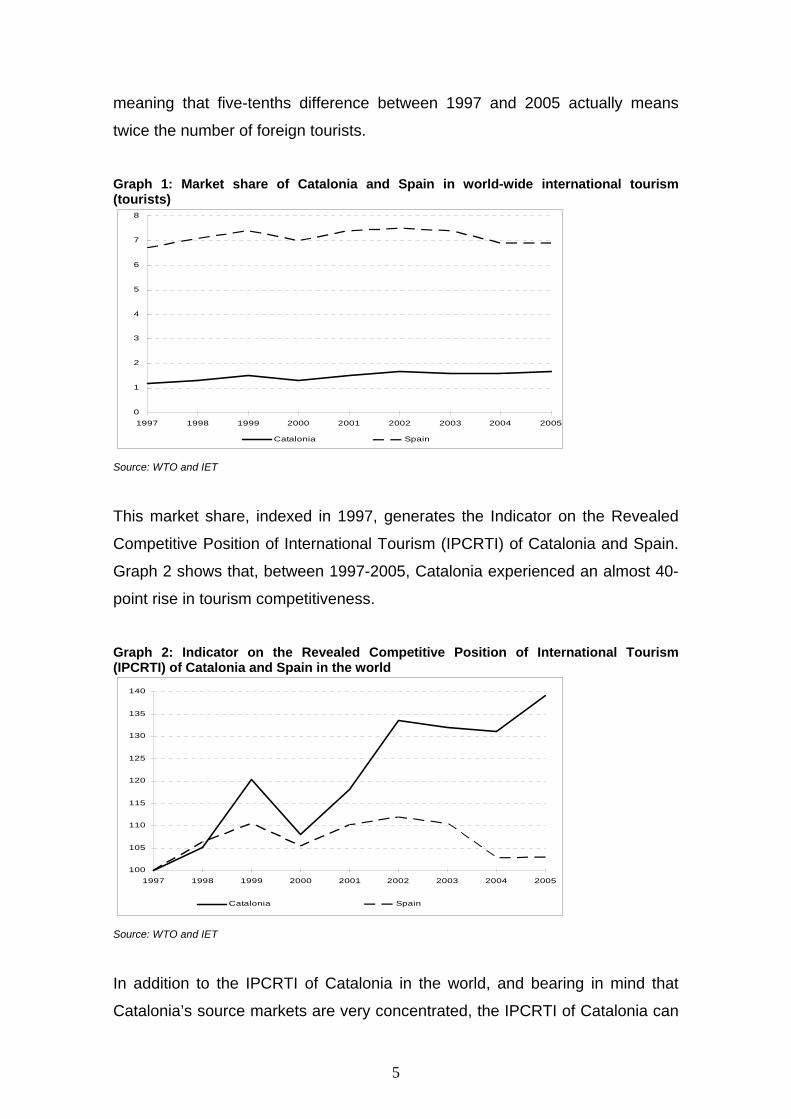
This market share, indexed in 1997, generates the Indicator on the Revealed
Competitive Position of International Tourism (IPCRTI) of Catalonia and Spain.
Graph 2 shows that, between 1997-2005, Catalonia experienced an almost 40-
point rise in tourism competitiveness.
Graph 2: Indicator on the Revealed Competitive Position of International Tourism (IPCRTI) of Catalonia and Spain in the world
100
105
110
115
120
125
130
135
140
1997 1998 1999 2000 2001 2002 2003 2004 2005
Catalonia Spain
Source: WTO and IET
In addition to the IPCRTI of Catalonia in the world, and bearing in mind that
Catalonia’s source markets are very concentrated, the IPCRTI of Catalonia can

6
be constructed in six prominent countries (United Kingdom, Germany, France,
the Netherlands, Italy and Belgium), which account for 70% of total arrivals.
Thus, Catalonia’s market share has been calculated in terms of those six
source markets, dividing the arrivals from these countries to Catalonia,
according to the WTO, between the total arrivals from these countries to
anywhere in the world, according to Eurostat. Graph 3 shows these results,
indexed for 1999.
Graph 3: Indicator on the Revealed Competitive Position of International Tourism (IPCRTI) of Catalonia. Six main source markets.
85
90
95
100
105
110
115
1999 2000 2001 2002 2003
Catalonia Spain
Source: IET and Eurostat
The different results of the IPCRTI for the entire world and for different source
markets are quite coherent, yet they reveal the relativity of these measures.
This relativity is not only derived from different territorial areas; it can also be
consequence of the indicator in question. Here we have used the indicator on
the number of tourists, which is the one available internationally. If available,
also the data on the number of overnight stays or tourist expenditures could
also be indicative. As shown below, when analysing domestic tourism
(interregional within Spain) the possibilities are much greater; thus, a decision
must be taken before calculating the share that will lead to the indicator on the
revealed competitive position of domestic tourism (IPCRTD).

7
Domestic tourism
Different indicators and different statistical sources can be examined in
reference to interregional domestic tourism in Spain. Bearing in mind that cost
groups are very difficult to obtain, the most reasonable indicators are physical:
the number of tourists or the number of overnight stays. The two best statistical
sources are the Spanish Domestic and Outbound Tourism Survey (Familitur)
conducted by the IET and the INE’s Hotel Occupancy Survey.
Although the hotel survey can be considered more trustworthy than the
household survey, is more partial than Familitur since it only includes tourists
lodged in hotels. Solely using the Hotel Occupancy Survey means that only the
competitive position of hotel tourism is determined. Other segments to consider,
in terms of the type of lodging, include campsite tourism, rural tourism and
apartment rentals. This type of segmentation also could be done according to
the reason for the trip (work or pleasure), the season (high or off) and the type
of trip (package or direct). There is no doubt that knowledge of these segments
can also be useful to make an accurate diagnosis of the competitive capacity of
Catalan tourism.
In this approach the most general survey is used, the one by Familitur,
according to tourists and overnight stays, as is the survey on hotel occupation,
also according to tourists and overnight stays. In order to compare the
indicators on international tourism, it is better to use tourists, whereas the most
significant share from an economic standpoint (more related to the cost) is the
one derived from overnight stays.

8
Graph 4: Share of Catalonia’s total market in domestic tourism in Spain (tourists and overnight stays)
10,5%
11,0%
11,5%
12,0%
12,5%
13,0%
13,5%
1999 2000 2001 2002 2003 2004
Tourists Overnight stays
Source: Generated by the authors based on the IET’s Spanish Domestic and Outbound Tourism Survey (Familitur)
Graph 5: Catalonia’s Indicator on the Revealed Competitive Position of Domestic Tourism (IPCRTD) (tourists and overnight stays)
96
100
104
108
112
116
1999 2000 2001 2002 2003 2004
Tourists Overnight stays
Source: Generated by the authors based on the IET’s Spanish Domestic and Outbound Tourism Survey (Familitur)
Graph 6: Catalonia’s market share in domestic hotel tourism in Spain (tourists and overnight stays)
13,0%
13,5%
14,0%
14,5%
15,0%
15,5%
1999 2000 2001 2002 2003 2004
Tourists Overnight stays
Source: Generated by the authors based on the IET’s Spanish Domestic and Outbound Tourism Survey (Familitur)

9
In Graphs 5 and 7, the evolution in the competitiveness of Catalan tourism can
be seen from 1999 to the 2004, measured through the Indicator on the
Revealed Competitive Position of Domestic Tourism (IPCRTD), for tourism as a
whole and tourists lodged in hotels.
The above graphs reveal a significant correlation between both indicators,
tourists and overnight stays. In any event, a more detailed analysis of the
different signals from each indicator over time could be conducted. Additionally,
the methodological nature of this study underscores this possibility. Graph 7: Catalonia’s Indicator on the Revealed Competitive Position of Domestic Tourism in hotels (IPCRTD in hotels) (tourists and overnight stays)
94
96
98
100
102
104
1999 2000 2001 2002 2003 2004
Tourists Overnight stays
Source: INE’s Hotel Occupancy Survey
Although the two sources examined have different diagnoses of
competitiveness, this does not mean that the results are contradictory. This
case is a good illustration of the possible segmentations of an analysis of
competitiveness. While Familitur examines tourism as a whole, the INE’s Hotel
Occupancy Survey only includes, logically, tourists staying in hotels.
It is entirely possible that in this period the market shares and, therefore, the
revealed competitiveness behave opposite in each of these segments of the
Catalan tourism sector, with the result that while Catalonia’s revealed
competitiveness rose from the 1999 to the 2004 in terms of tourists and
overnight stays, its revealed competitiveness in hotel tourism fell.

10
2. Indicator on the Competitive Position of Tourism Prices (IPCPT)
Following the traditional competitive position methodology in terms of prices
applied for international trade and used by the Central Bank of Spain,
constructing an indicator of competitiveness in terms of prices is viable. Again
we examine international tourism and domestic tourism separately.
The indicator on the competitive position of tourism prices is the result of two
factors: the evolution in prices of our and the competitors’ supply, and the
evolution in the exchange rate in the event of different currencies. The first
factor is called the Relative Price Index (RPI), whereas the second is gathered
by the Nominal Effective Exchange Rate (NEER). The product of these two
indicators is the Real Effective Exchange Rate (REER). The NEER is equivalent
to the Competitive Position Indicator (CPI). In short, for tourism in period t,
therefore:
CPIt = NEERt * RPIt
It is important to bear in mind that the price of our supply will be compared to
the price of our competitors, in which each competitor has a representative
weighting of its capacity to compete with us. Finally, it should also be noted that
we are talking about prices; therefore, the higher the index the worse our
competitive position, and vice-versa.
International tourism
Regarding international tourism, the statistical source used to generate the
sender/receiver matrix is the World Tourism Organization (WTO). This
organisation publishes tourists arrivals from almost the countries in the world,
according to the country of origin; thus, for any given year it is possible to
construct the matrix of arrivals according to source country. This study has been
undertaken for 2000 to 2002, and then the average has been examined. The
matrix could contain at most 53,000 cells (the product of 230 x 230 countries),

11
but fortunately for our purposes we only need to cover a relatively small number
of countries to register a relatively high percentage of tourists. Specifically, with
66 sending countries and 77 receiving countries (totally 5,100 cells) we reach
85% of total the world-wide tourist arrivals. In practice, each of our annual
matrices contains 230 (sending countries) by 135 (receiving countries), which
has enabled us to classify 95% of the world-wide arrivals.
On the other hand, the countries to examine out of the total group of countries
with information available have been selected according to the three following
criteria: a) countries that compete with Catalonia as they receive tourists coming
from four or more countries which are also the origin of our tourists, b)
significant weight in total world-wide arrivals (more than two million tourists) and
c) significant weight in arrivals from the countries that are senders for Catalonia
(more than one million tourists). a list of 55 competing countries was derived
from this list (including Spain itself). The arrivals of tourists with origin and
destination to some of these 55 countries represent 77% of world-wide arrivals.
This, then, means the index has broad coverage. An additional 18% of the
tourists, up to 95% of the total, are classified as the Rest of the World, and as
such are included when constructing the weighting, although not in the
calculation of the NEER nor of the RPI. Only 5% of tourists can be described as
not classified.
To calculate the weightings, we have adopted the method of double weighting
of the exports by tourism, weighting of the imports and a final combination in
synthetic weightings. The process is identical in the domestic and international
market, ignoring the number of competitors involved and the fact that in
international indices there is a Rest of the World category.
Once the number of countries is determined and the weightings are calculated,
in order to calculate the competitive position rates we only need indicators on
prices of each of the countries on the index and the currency exchange rates.
In the tourism sector, it us natural to consider two types of prices: the prices that
are specifically related to tourist activity (hotel prices in package tours, lodging,

12
passenger transport, restaurants, etc.) and the prices of other products, more
closely associated with overall prices in the destination country. When the first
type of prices are considered, it is useful to differentiate between the origin cost
and the destination cost. This approach is very convincing, although it is
different to employ in international tourism. If an ad hoc sustained study is not
undertaken (to obtain series) in the country of origin on the evolution in tourist
prices, the options are quite limited: only the CPI has international coverage
making it possible to calculate the Relative Price Index (RPI) in groups of
countries as has been done here. Therefore, the CPI (obtained from the
database of the International Monetary Fund [IMF]) is the indicator used to
generate the RPI.
This option is reasonable if we believe that there is a correlation between the
general evolution of prices at a destination and the prices of the tourist supply
that it offers. At any rate, a possible improvement on this approach would be to
use some specific heading within the CPI, instead of the general index, more
closely linked to tourist consumption. The breakdown (splitters) is reasonable as
the nomenclature is standardised internationally in the COICOP.
The exchange rates do not present many problems: they indicate the number of
units that needed of one currency to obtain a unit of another, and this
information is available daily. For countries that are members of the European
Monetary Union, having a single currency reduces the indicator of the
competitive position to a relative price indicator. For countries outside the
Union, in this report cash exchange rates have been used with monthly
averages of daily data. There are a variety of possible sources of statistics.
The European Central Bank publishes official exchange rates of euros for 28
countries, extended to 35 as of April of 2005. Unfortunately, many of the
currencies we are interested in are not included in this list, or they have only
been included recently. For those currencies, we have used the same strategy
that the Central Bank of Spain uses: calculating the exchange rate crossed
between the currency and the dollar (provided by the International Monetary
Fund and, exceptionally, by local sources) and between the dollar and euro

13
according to the Central Bank of Spain. In the case of Cuba and Puerto Rico,
although for different reasons, their international transactions are considered to
be made in United States dollars.
With all the aforementioned elements - defining competitors, weightings and
prices (prices and exchange rates) - the competitive position index in terms of
prices for international tourism in Catalonia calculations (IPCPTI), broken down
into the Relative Price Index (RPI) and the Nominal Effective Exchange Rate
(NEER) is calculated. The results for Catalonia and Spain are shown in Graphs
8 and 9.
In this context, between 1995 and 2001 (Graph 8), we can detect in Catalonia
an appreciation in the Spanish currency (the first peseta, later the euro) and an
improvement in the relative prices that resolved in relative stability of the
competitive position of tourism. In the following years, there is a clear loss in
competitiveness, not only because of a lack of improvements in the relative
prices but also because of steep appreciation in the euro.
In Spain as a whole (Graph 9), which had remained relatively stable between
1995 and 2002, 2003 and 2004 witnessed a considerable decline, although
during 2005 it remained steady. The cause of this evolution is basically the
appreciation in the euro compared to other world currencies. The five years
between 1995 and 1999, the tendency for first the peseta and then the euro to
appreciate was counterbalanced by containment of inflation in inland regions,
so that during this period the competitive position of tourism in Spain did not
fluctuate significantly. In the following years (since 2000), the appreciation of the
euro was stronger, while at the same time the gains in relative prices
disappeared. Therefore, the competitive position worsened, especially in 2003
and 2004.

14
Graph 8: Catalonia’s competitive position in terms of prices in international tourism (IPCPTI)
90
95
100
105
110
115
1995 1996 1997 1998 1999 2000 2001 2002 2003 2004 2005
IPCPT NEER REER Source: Generated by the authors based on data of the WTO, the IMF and the IET.
Graph 9: Competitive position in terms of prices in international tourism
90
95
100
105
110
115
1995 1996 1997 1998 1999 2000 2001 2002 2003 2004 2005
IPCPT NEER REER
Source: Generated by the authors based on data from the WTO, the IMF and the IET.
Domestic tourism
As for the internal market, in tourism of Spaniards within Spain, two basic
sources and two indicators can be used. The sources are the IET’s Familitur
and the INE’s Hotel Occupancy Survey. For the reasons mentioned in the
previous section of this study, it was decided to generate the weightings based
on information on overnight stays from the hotel occupancy survey. Although
that entails only part of incoming tourism, the reliability of the crossed
information can be considered higher in the hotel occupancy survey. On the
other hand, there is no doubt that overnight stays are a physical unit closer to

15
the economic meaning of inflows of tourists without taking into account the
duration of the trip.
Therefore, the basis information is a matrix of average annual overnight stays in
Spain, distributed by Spanish autonomous community of origin (sending
tourism) and destination (receiving tourism). This produces a matrix of 18x18,
including each autonomous region along with Ceuta and Melilla, and it is
calculated with information from three years (from 2000 to 2002). The average
of those three years is the basis for the weighting of the index.
The matrix indicates that in the period from 2000 to 2002, the Spanish
autonomous regions with the most overnight stays by Spanish tourists was
Andalusia (16.0 million), followed by Catalonia (12.5 million) and Valencia (11.5
million). The community coming in next in the ranking, Madrid, lags far behind
the leading ones (6.4 million). Clearly, the three autonomous communities on
the Mediterranean coast total 47% of total overnight stays by Spaniards. This
emphasizes the fact that in Catalonia domestic tourism (say, Catalan people
visiting Catalonia) accounts for more than half of the total overnight stays,
whereas in eastern Andalusia this percentage hovers at 41% and in Valencia
Community at 26%.
Once the basic information with which the competitive position of prices is
specified, we must outline the treatment of the three questions that are required
for the calculation: determining the set of countries to consider (the
competitors), determining the weighting, and finally, determining the Relative
Price Indicator (RPI).
In order to define the competitors, the treatment is much more direct than in the
international tourism. All eighteen autonomous regions in Spain have been
regarded as part of the index, so the matrix of overnight stays is the matrix used
to calculate the weighting.
To calculate weighting, as in the case of international tourism, we have adopted
the method of double weighting of exports by tourism, bilateral weighting of

16
imports and a final combination in synthetic weighting. In the domestic market,
the counties with a greater weight on Catalonia’s competitiveness index are
Andalusia (17.4%), Valencia (14.9%), the Balearic Islands (12.3%) and Madrid
(10%).
The third factor to examine has to do with the prices to take into account. The
approach is identical to the one used in for international tourism. Again, it might
be sensible to differentiate between prices of tourist products and overall prices,
as well as to distinguish between the prices in origin from the prices in
destination. Also, whereas in international tourism the availability of information
leads us to only take into account the CPI, here other options can be
implemented. In addition to the general CPI, data from the CPI of the Horeca
sector (hotels, restaurants and coffee bars, the most tourist-oriented headings
in the COICOP) can be used, as well as Hotel Price Index (HPI) from the INE’s
own survey. Results from the RPI will appear according to these three types of
prices, to evaluate the differential created by these indicators in Catalonia’s
indicator of competitive position in terms of prices of domestic tourism
(IPCPTD).
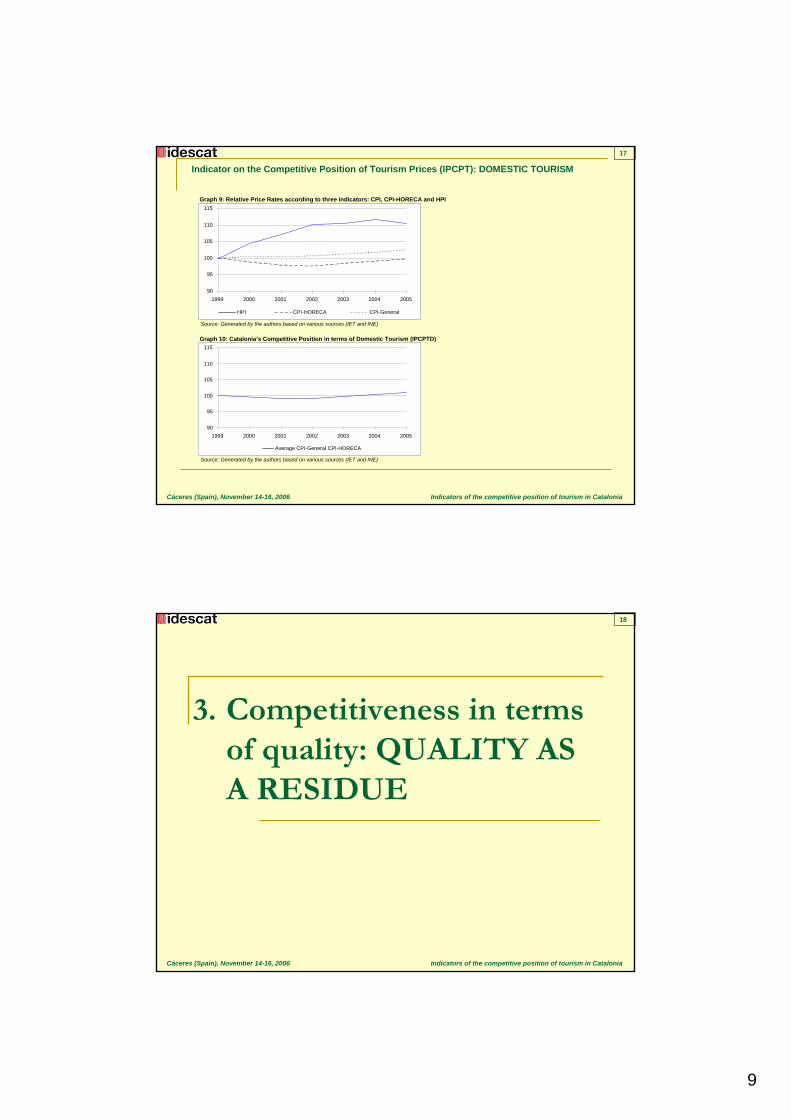
Graph 10 shows that the RPI is quite different depending on the price indicator
used, namely the general CPI, the CPI from the Horeca sector or the HPI (Hotel
Price Index from the supply side).
Graph 10: Relative Price Indices according to three indicators: CPI, CPI-Horeca and HPI
90
95
100
105
110
115
1999 2000 2001 2002 2003 2004 2005
HPI CPI-Horeca CPI-General Source: Generated by the authors based on various sources (IET and INE).

17
By examining these differentials it is clear that determining the price indicator is
relevant for determining the evolution in the competitiveness indicator.
Considering the degree of consolidation of the CPI, and its comparability with
the international tourism indicator, it is considered wise to use the CPI , but with
a special weighting in the specifically tourist-related rubric, that is, the CPI-
Horeca. From the data available at Idescat, these rubrics represent nearly 50%
of tourists’ total expenditures. Thus, the price indicator ultimately used is an
approach equivalent to a simple average of the RPI according to the CPI and
the RPI according to the CPI-Horeca. The results are shown in Graph 11. A
certain stability of the competitive index in terms of prices for domestic tourism
as a whole is reflected.
In view of the price indicator from the HPI and the revealed competitiveness
derived from the data from the hotel survey, this stability can be compatible with
a loss in competitiveness in the specific sector of hotel lodging.
Graph 11: Catalonia’s competitive position in terms of prices of domestic tourism (IPCPTD)
90
95
100
105
110
115
1999 2000 2001 2002 2003 2004 2005
Average CPI-General CPI-Horeca Source: Generated by the authors based on various sources (IET and INE).
18
3. A reflection on competitiveness as a residue
This note has examined two indicators of the competitive position of tourism in
Catalonia according to the concept of revealed competitiveness and price
competitiveness.
It is easy to understand that revealed competitiveness is a behaviour or a
indicator of results, whereas price competitiveness is an explanation of this
behaviour. The specific statistic on tourist competitiveness can be considered
acceptably developed, from our standpoint, with these two indicators applied to
international and domestic tourism. Natural extensions of these statistics will be
the measures of competitive positions for more specific tourist segments:
according to reason (work or pleasure), season, type of lodging, etc.
On the basis of the foregoing, an examination of the theoretical framework
displayed in Table 1 of this document, along with effectively obtaining indicators
on revealed competitive position and prices of international and domestic
tourism in Catalonia reveals a useful conceptual framework for a possible
analysis of the evolution in the quality of the tourist supply. Because of this, the
differential between the behaviour of revealed competitiveness (market share)
and the prices naturally lead us to believe that the unexplained, the residue, is
the consequence of a variation of the quality perceived by tourists of our supply
compared to the group of competing destinations.
In a schematic format:
Market share = Revealed Competitive Position

19
With IPCR being the indicator on revealed competitive position
IPCR = F (explanatory factors of competitiveness)
F (CPI on prices, CPI on quality of tourist services, CPI on quality of the environment)
= F (IPCP, IPCQ)
Therefore, the (overall) quality can be defined as a residue:
IPCQ = F (IPCR - IPCP)
It should be mentioned that the concept of quality compared to residue is
adapted to the consumer’s perception in the market, which values the
quality/price ratio of goods and services. This quality will not be necessarily an
objective and absolute quality, rather relative and subjective: what the
consumer perceives. In effect, if a promotional campaign is undertaken that
increases the appeal of Barcelona as a cultural capital compared to other
possible destinations, this will generate an improvement in the perceived
relative quality compared to alternative destinations, though from an objective
standpoint nothing has changed.
The results of the indicators on revealed competitive price and position show
relatively contradictory behaviour in this document, as an increase in revealed
competitiveness is detected at the same time as less competitiveness in prices.
This means that there is an important residue or behaviour of competitiveness
that is not explained by prices. The diagnosis in this case is that Catalonia has
undergone a significant improvement in the perceived quality of the tourist
supply.
In the field of statistics on competitiveness, it is difficult to further specify the
previous diagnosis on the improvement of the quality in our tourist supply. We
believe that only by a qualitative study by experts we could furnish accurate
reasons on what has improved this quality. However, this study would fall
outside the scope of standard statistics.

20

ANNEX: Power-point presentation

1
INDICATORS OF THE COMPETITIVE POSITION OF TOURISM IN CATALONIA
Àlex CostaCèlia GomàXavier LópezStatistical Institute of CataloniaCáceres (Spain), November 14-16, 2006
1
Objective: to be achieved by the STATISTICAL SYSTEM OF CATALONIA
TO GENERATE THE SPECIFIC STATISTICSON THE COMPETITIVENESS OF TOURISM
IN CATALONIA
Indicators of the competitive position of tourism in CataloniaCáceres (Spain), November 14-16, 2006
2
2
Indicators of the competitive position of tourism in CataloniaCáceres (Spain), November 14-16, 2006
In 2005, Spain received 55.6 MILLION FOREIGN TOURISTS
Balearic & Canary Islands: 9.5 million touristsAndalucia: 8 million tourists
CATALONIA: 14 million tourists
3
Table 1: Map of the competitiveness indicators
GDP per inhabitant and productivity
Structural competitiveness
Exchange rates, costs, prices, profitability
Productive factors; stocks of physical, technological and human capital; innovation and similar factors
Trade balance
Market share
Penetration of imports in the domestic market
Foreign competitiveness
Decisive factors Behaviour indicators
Source: Central Bank of Spain
Indicators of the competitive position of tourism in CataloniaCáceres (Spain), November 14-16, 2006
4

3
Indicators of the competitive position of tourism in CataloniaCáceres (Spain), November 14-16, 2006
Table 2: New map of the competitiveness indicators
- Work costs, income
- Productive factors, expenditures on R&D, innovation and similar factors
- GDP per inhabitant
- Apparent productivity
Outside the market
- Price and exchange rates
- Quality of the services available
- Trade balance
- Market share
- Penetration of imports
In the market
Explanatory factorsBehaviour indicators
Source: Generated by the authors
5
Objective: to be achieved by the STATISTICAL SYSTEM OF CATALONIA
Indicators of the competitive position of tourism in CataloniaCáceres (Spain), November 14-16, 2006
- Market share: REVEALED COMPETITIVENESS (IPCR)
- Prices: PRICE COMPETITIVENESS (IPCP)
- Competitiveness in terms of quality: QUALITY AS A RESIDUE
TO GENERATE THE SPECIFIC STATISTICSON THE COMPETITIVENESS OF TOURISM
IN CATALONIA
6

4
1. Indicators on the Revealed Competitive Position of Tourism (IPCRT)
Indicators of the competitive position of tourism in CataloniaCáceres (Spain), November 14-16, 2006
7
Necessary information: The evolution of the market
share of agents participating.
MARKET SHARE CALCULATION:
Receptor tourism (number of tourists who came to Catalonia) [1]
Number of tourists all over the whole word [2]
[1] Source: Instituto de Estudios Turísticos (IET)
[2] Source: World Tourism Organization (WTO)
Indicators of the competitive position of tourism in CataloniaCáceres (Spain), November 14-16, 2006
Indicators on the Revealed Competitive Position of Tourism (IPCRT)
8

5
Indicators of the competitive position of tourism in CataloniaCáceres (Spain), November 14-16, 2006
Graph 1: Catalonia and Spain0s market share in worldwide international tourism (tourists)
Source: WTO and IET
Graph 2: Indicator on the Revealed Competitive Position of International Tourism (IPCRTI) for Catalonia and Spain in the world
0
1
2
3
4
5
6
7
8
1997 1998 1999 2000 2001 2002 2003 2004 2005
Catalonia Spain
100
105
110
115
120
125
130
135
140
1997 1998 1999 2000 2001 2002 2003 2004 2005
Catalonia Spain
Source: WTO and IET
Indicators on the Revealed Competitive Position of Tourism (IPCRT): INTERNATIONAL TOURISM9
Indicators of the competitive position of tourism in CataloniaCáceres (Spain), November 14-16, 2006
Graph 3: Indicator on the Revealed Competitive Position of International Tourism (IPCRTI) for Catalonia. Six main markets
Source: IET and Eurostat
Indicators on the Revealed Competitive Position of Tourism (IPCRT): INTERNATIONAL TOURISM
85
90
95
100
105
110
115
1999 2000 2001 2002 2003
Catalonia Spain
THREE
MAIN
MARKETS
3.1. Germany
3.2. France
3.3. United Kingdom
75
80
85
90
95
100
1999 2000 2001 2002 2003 2004
Catalonia Spain
85
95
105
115
125
135
145
1999 2000 2001 2002 2003
Catalonia Spain
75
80
85
90
95
100
105
110
115
1999 2000 2001 2002 2003 2004
Catalonia Spain
10

6
Indicators of the competitive position of tourism in CataloniaCáceres (Spain), November 14-16, 2006
Indicators on the Revealed Competitive Position of Tourism (IPCRT): DOMESTIC TOURISM
Graph 4: Share of Catalonia’s total market in domestic tourism in Spain (tourists and overnight stays)
Source: Generated by the authors based on the IET’s Spanish Domestic and Outbound Tourism Survey (Familitur)
Graph 5: Catalonia’s Indicator on the Revealed Competitive Position of Domestic Tourism (IPCRTD) (tourists and overnight stays)
10,5%
11,0%
11,5%
12,0%
12,5%
13,0%
13,5%
1999 2000 2001 2002 2003 2004
Tourists Overnight stays
96
100
104
108
112
116
1999 2000 2001 2002 2003 2004
Tourists Overnight stays
Source: Generated by the authors based on the IET’s Spanish Domestic and Outbound Tourism Survey (Familitur)
11
Indicators of the competitive position of tourism in CataloniaCáceres (Spain), November 14-16, 2006
Indicators on the Revealed Competitive Position of Tourism (IPCRT): DOMESTIC TOURISM
Graph 6: Catalonia’s market share in domestic hotel tourism in Spain (tourists and overnight stays)
Source: Generated by the authors based on the INE’s Hotel Occupancy Survey
Graph 7: Catalonia’s Indicator on the Revealed Competitive Position of Domestic Tourism in hotels (IPCRTD in hotels) (tourists and overnight stays)
Source: INE’s Hotel Occupancy Survey
13,0%
13,5%
14,0%
14,5%
15,0%
15,5%
1999 2000 2001 2002 2003 2004
Tourists Overnight stays
94
96
98
100
102
104
1999 2000 2001 2002 2003 2004
Tourists Overnight stays
12

7
2. Indicator on the Competitive Position of Tourism Prices (IPCPT)
Indicators of the competitive position of tourism in CataloniaCáceres (Spain), November 14-16, 2006
13
Indicators of the competitive position of tourism in CataloniaCáceres (Spain), November 14-16, 2006
Indicator on the competitive position of tourism prices (IPCPT)
Is the result of two factors:
1. Evolution in prices of our supply and the competitors’
Relative Price Index (RPI)
2. Evolution in the exchange rate in the event of different currencies
Nominal Effective Exchange Rate (NEER)
RPI * NEER = REER (1)
(1) Real Effective Exchange Rate
REER ≈ CPI (2)
(2) Competitive Position Indicator
Where each of the terms is calculated:
NEERt = 100 * ∏Hi=1 (ei,0/ei,t)wi
100 * (pt/p0)CPIt = pt/p*t = [∏H
i=1 (p*i,t/p*i,0)wi]
H number of excellent territorieswi weights of the competing territoriespi,t and p*i,t domestic and international pricesei,t exchange rate
14

8
Indicators of the competitive position of tourism in CataloniaCáceres (Spain), November 14-16, 2006
Decisions to take:
a) Indicator Coverage → Which countries need to be included
b) Weighting of competitors countries’ system:
- b.1 Method of bilateral weighting- b.2 Method of double weighting- b.3 Method of expert weighting- b.4 Method of consumer weighting
c) Indicators of price selection
Indicator on the competitive position of tourism prices (IPCPT)
15
Indicators of the competitive position of tourism in CataloniaCáceres (Spain), November 14-16, 2006
Indicator on the Competitive Position of Tourism Prices (IPCPT): INTERNATIONAL TOURISM
Graph 8: Catalonia’s Competitive Position in terms of prices in international tourism (IPCPTI)
Source: Generated by the authors based on data of the WTO, the IMF and the IET
90
95
100
105
110
115
1995 1996 1997 1998 1999 2000 2001 2002 2003 2004 2005
IPCPT NEER REER
1995-2001 → • Appreciation in the Spanish currency (first the peseta, laterthe euro)
• Improvement in the relative prices that resolved in relative stability of the competitive position of tourism
In the following years → Clear loss in competitiveness (lack of improvements in the relative prices and steep appreciation of the euro)
16
9
Indicators of the competitive position of tourism in CataloniaCáceres (Spain), November 14-16, 2006
Indicator on the Competitive Position of Tourism Prices (IPCPT): DOMESTIC TOURISM
Graph 9: Relative Price Rates according to three indicators: CPI, CPI-HORECA and HPI
Source: Generated by the authors based on various sources (IET and INE)
Graph 10: Catalonia’s Competitive Position in terms of Domestic Tourism (IPCPTD)
Source: Generated by the authors based on various sources (IET and INE)
90
95
100
105
110
115
1999 2000 2001 2002 2003 2004 2005
HPI CPI-HORECA CPI-General
90
95
100
105
110
115
1999 2000 2001 2002 2003 2004 2005
Average CPI-General CPI-HORECA
17
3. Competitiveness in terms of quality: QUALITY AS A RESIDUE
Indicators of the competitive position of tourism in CataloniaCáceres (Spain), November 14-16, 2006
18

10
Indicators of the competitive position of tourism in CataloniaCáceres (Spain), November 14-16, 2006
In a schematic format:
Market share = Revealed Competitive Position
With IPCR being the indicator on revealed competitive position
IPCR = F (explanatory factors of competitiveness)
F (CPI on prices, CPI on quality of tourist services, CPI on quality of the environment) = F (IPCP, IPCQ)
Therefore, the (overall) quality can be defined as a residue:
IPCQ = F (IPCR - IPCP)
Competitiveness in terms of quality: QUALITY AS A RESIDUE
19
4. Final considerations
Indicators of the competitive position of tourism in CataloniaCáceres (Spain), November 14-16, 2006
20

11
Objective: to be achieved by the STATISTICAL SYSTEM OF CATALONIA
Indicators of the competitive position of tourism in CataloniaCáceres (Spain), November 14-16, 2006
Final considerations
Based on Law 2/2006, dated 6th March 2006, on the Statistical Plan for Catalonia for the period 2006-2009 → This regulates and plans statistics that are of interest to the government of Catalonia and sets the main strategic areas and goals and the activities associated with them.
For example, reports on industrial competitiveness and tourism competitiveness
TO GENERATE THE SPECIFIC STATISTICSON THE COMPETITIVENESS OF TOURISM
IN CATALONIA
21
Variables in the reports:
TOURISM COMPETITIVENESS
Indicators of the competitive position of tourism in CataloniaCáceres (Spain), November 14-16, 2006
Final considerations
INDUSTRIAL COMPETITIVENESS
ACTION
RESPONSIBLE ORGANISMS
OBJECTIVE
ORIGIN OF THE INFORMATION
REGULARITY
VARIABLES
DISSEMINATION
AVAILABILITY
COST
• New
• Idescat and Eco&Fin department
• Development IPCPT
• Data from statistics
• Annual
• IPCP, IPCR, prices, IPCQ…
• Internet
• 4th quarter of 2006
• 11,000 euros
• Developing
• Idescat
• Industrial indicators
• Data from statistics
• Quarterly
• REER, NEER, CPI…
• Internet
• Quarters of 2006
• Less than 6,000 euros
22

12
Indicators of the competitive position of tourism in CataloniaCáceres (Spain), November 14-16, 2006
This is reflected in the following legal documents:
23
INDICATORS OF THE COMPETITIVE POSITION OF TOURISM IN CATALONIA
Àlex CostaCèlia GomàXavier LópezStatistical Institute of CataloniaCáceres (Spain), November 14-16, 2006
24