Network-Based Marketing: Identifying Likely Adopters via ... · Awareness or adoption spreads from...
22
arXiv:math/0606278v2 [math.ST] 8 Sep 2006 Statistical Science 2006, Vol. 21, No. 2, 256–276 DOI: 10.1214/088342306000000222 c Institute of Mathematical Statistics, 2006 Network-Based Marketing: Identifying Likely Adopters via Consumer Networks Shawndra Hill, Foster Provost and Chris Volinsky Abstract. Network-based marketing refers to a collection of marketing techniques that take advantage of links between consumers to increase sales. We concentrate on the consumer networks formed using direct interactions (e.g., communications) between consumers. We survey the diverse literature on such marketing with an emphasis on the statis- tical methods used and the data to which these methods have been applied. We also provide a discussion of challenges and opportunities for this burgeoning research topic. Our survey highlights a gap in the literature. Because of inadequate data, prior studies have not been able to provide direct, statistical support for the hypothesis that network linkage can directly affect product/service adoption. Using a new data set that represents the adoption of a new telecommunications service, we show very strong support for the hypothesis. Specifically, we show three main results: (1) “Network neighbors”—those consumers linked to a prior customer—adopt the service at a rate 3–5 times greater than baseline groups selected by the best practices of the firm’s marketing team. In addition, analyzing the network allows the firm to acquire new customers who otherwise would have fallen through the cracks, because they would not have been identified based on traditional attributes. (2) Statistical models, built with a very large amount of geographic, de- mographic and prior purchase data, are significantly and substantially improved by including network information. (3) More detailed network information allows the ranking of the network neighbors so as to permit the selection of small sets of individuals with very high probabilities of adoption. Key words and phrases: Viral marketing, word of mouth, targeted marketing, network analysis, classification, statistical relational learn- ing. Shawndra Hill is a Doctoral Candidate and Foster Provost is Associate Professor, Department of Information, Operations and Management Sciences, Leonard N. Stern School of Business, New York University, New York, New York 10012-1126, USA e-mail: [email protected]; [email protected]. Chris Volinsky is Director, Statistics Research Department, AT&T Labs Research, Shannon Laboratory, Florham Park, New Jersey 07932, USA e-mail: [email protected]. 1. INTRODUCTION Network-based marketing seeks to increase brand recognition and profit by taking advantage of a so- This is an electronic reprint of the original article published by the Institute of Mathematical Statistics in Statistical Science, 2006, Vol. 21, No. 2, 256–276. This reprint differs from the original in pagination and typographic detail. 1
Transcript of Network-Based Marketing: Identifying Likely Adopters via ... · Awareness or adoption spreads from...

arX
iv:m
ath/
0606
278v
2 [
mat
h.ST
] 8
Sep
200
6
Statistical Science
2006, Vol. 21, No. 2, 256–276DOI: 10.1214/088342306000000222c© Institute of Mathematical Statistics, 2006
Network-Based Marketing: IdentifyingLikely Adopters via ConsumerNetworksShawndra Hill, Foster Provost and Chris Volinsky
Abstract. Network-based marketing refers to a collection of marketingtechniques that take advantage of links between consumers to increasesales. We concentrate on the consumer networks formed using directinteractions (e.g., communications) between consumers. We survey thediverse literature on such marketing with an emphasis on the statis-tical methods used and the data to which these methods have beenapplied. We also provide a discussion of challenges and opportunitiesfor this burgeoning research topic. Our survey highlights a gap in theliterature. Because of inadequate data, prior studies have not been ableto provide direct, statistical support for the hypothesis that networklinkage can directly affect product/service adoption. Using a new dataset that represents the adoption of a new telecommunications service,we show very strong support for the hypothesis. Specifically, we showthree main results: (1) “Network neighbors”—those consumers linkedto a prior customer—adopt the service at a rate 3–5 times greater thanbaseline groups selected by the best practices of the firm’s marketingteam. In addition, analyzing the network allows the firm to acquire newcustomers who otherwise would have fallen through the cracks, becausethey would not have been identified based on traditional attributes. (2)Statistical models, built with a very large amount of geographic, de-mographic and prior purchase data, are significantly and substantiallyimproved by including network information. (3) More detailed networkinformation allows the ranking of the network neighbors so as to permitthe selection of small sets of individuals with very high probabilities ofadoption.
Key words and phrases: Viral marketing, word of mouth, targetedmarketing, network analysis, classification, statistical relational learn-ing.
Shawndra Hill is a Doctoral Candidate and Foster
Provost is Associate Professor, Department of
Information, Operations and Management Sciences,
Leonard N. Stern School of Business, New York
University, New York, New York 10012-1126, USA
e-mail: [email protected]; [email protected].
Chris Volinsky is Director, Statistics Research
Department, AT&T Labs Research, Shannon
Laboratory, Florham Park, New Jersey 07932, USA
e-mail: [email protected].
1. INTRODUCTION
Network-based marketing seeks to increase brandrecognition and profit by taking advantage of a so-
This is an electronic reprint of the original articlepublished by the Institute of Mathematical Statistics inStatistical Science, 2006, Vol. 21, No. 2, 256–276. Thisreprint differs from the original in pagination andtypographic detail.
1

2 S. HILL, F. PROVOST AND C. VOLINSKY
cial network among consumers. Instances of network-based marketing have been called word-of-mouth mar-
keting, diffusion of innovation, buzz marketing andviral marketing (we do not consider multilevel mar-keting, which has become known as “network” mar-keting). Awareness or adoption spreads from con-sumer to consumer. For example, friends or acquain-tances may tell each other about a product or ser-vice, increasing awareness and possibly exercisingexplicit advocacy. Firms may use their websites tofacilitate consumer-to-consumer advocacy via prod-uct recommendations (Kautz, Selman and Shah, 1997)or via on-line customer feedback mechanisms (Del-larocas, 2003). Consumer networks may also provideleverage to the advertising or marketing strategy ofthe firm. For example, in this paper we show howanalysis of a consumer network improves targetedmarketing.
This paper makes two contributions. First we sur-vey the burgeoning methodological research litera-ture on network-based marketing, in particular onstatistical analyses for network-based marketing. Wereview the research questions posed, and the dataand analytic techniques used. We also discuss chal-lenges and opportunities for research in this area.The review allows us to postulate necessary data re-quirements for studying the effectiveness of network-based marketing and to highlight the lack of currentresearch that satisfies those requirements. Specifi-cally, research must have access both to direct linksbetween consumers and to direct information on theconsumers’ product adoption. Because of inadequatedata, prior studies have not been able to provide di-rect, statistical support (Van den Bulte and Lilien,2001) for the hypothesis that network linkage candirectly affect product/service adoption.
The second contribution is to provide empiricalsupport that network-based marketing indeed canimprove on traditional marketing techniques. We in-troduce telecommunications data that present a nat-ural testbed for network-based marketing models,in which communication linkages as well as productadoption rates can be observed. For these data, weshow three main results: (1) “Network neighbors”—those consumers linked to a prior customer—adoptthe service at a rate 3–5 times greater than baselinegroups selected by the best practices of the firm’smarketing team. In addition, analyzing the networkallows the firm to acquire new customers who other-wise would have fallen through the cracks, because
they would not have been identified based on tradi-tional attributes. (2) Statistical models, built with avery large amount of geographic, demographic andprior purchase data, are significantly and substan-tially improved by including network information.(3) More sophisticated network information allowsthe ranking of the network neighbors so as to permitthe selection of small sets of individuals with veryhigh probabilities of adoption.
2. NETWORK-BASED MARKETING
There are three, possibly complementary, modesof network-based marketing.
Explicit advocacy : Individuals become vocal ad-vocates for the product or service, recommendingit to their friends or acquaintances. Particular indi-viduals such as Oprah, with her monthly book clubreading list, may represent “hubs” of advocacy inthe consumer relationship network. The success ofThe Da Vinci Code, by Dan Brown, may be dueto its initial marketing: 10,000 books were deliveredfree to readers thought to be influential enough (e.g.,individuals, booksellers) to stimulate the traffic inpaid-for editions (Paumgarten, 2003). When firmsgive explicit incentives to consumers to spread in-formation about a product via word of mouth, ithas been called viral marketing, although that termcould be used to describe any network-based mar-keting where the pattern of awareness or adoptionspreads from consumer to consumer.
Implicit advocacy : Even if individuals do not speakabout a product, they may advocate implicitly throughtheir actions—especially through their own adop-tion of the product. Designer labeling has a longtradition of using consumers as implicit advocates.Firms commonly capitalize on influential individu-als (such as athletes) to advocate products simplyby conspicuous adoption. More recently, firms havetried to induce the same effect by convincing par-ticularly “cool” members of smaller social groups toadopt products (Gladwell, 1997; Hightower, Bradyand Baker, 2002).
Network targeting : The third mode of network-based marketing is for the firm to market to priorpurchasers’ social-network neighbors, possibly with-out any advocacy at all by customers. For networktargeting, the firm must have some means to identifythese social neighbors.
These three modes may be used in combination.A well-cited example of viral marketing combines

NETWORK-BASED MARKETING 3
network targeting and implicit advocacy:The Hotmail free e-mail service appended to thebottom of every outgoing e-mail message the hy-perlinked advertisement, “Get your free e-mail atHotmail,” thereby targeting the social neighbors ofevery current user (Montgomery, 2001), while tak-ing advantage of the user’s implicit advocacy. Hot-mail saw an exponentially increasing customer base.Started in July 1996, in the first month alone Hot-mail acquired 20,000 customers. By September 1996the firm had acquired over 100,000 accounts, and byearly 1997 it had over 1 million subscribers.
Traditional marketing methods do not appeal tosome segments of consumers. Some consumers ap-parently value the appearance of being on the cut-ting edge or “in the know,” and therefore derivesatisfaction from promoting new, exciting products.The firm BzzAgents (Walker, 2004) has managed toentice voluntary (unpaid) marketing of new prod-ucts. Furthermore, although more and more infor-mation has become available on products, parsingsuch information is costly to the consumer. Explicitadvocacy, such as word-of-mouth advocacy, can bea useful way to filter out noise.
A key assumption of network-based marketingthrough explicit advocacy is that consumers prop-agate “positive” information about products afterthey either have been made aware of the product bytraditional marketing vehicles or have experiencedthe product themselves. Under this assumption, aparticular subset of consumers may have greater valueto firms because they have a higher propensity topropagate product information (Gladwell, 2002),based on a combination of their being particularlyinfluential and their having more friends (Richard-son and Domingos, 2002). Firms should want to findthese influencers and to promote useful behavior.
3. LITERATURE REVIEW
Many quantitative statistical methods used in em-pirical marketing research assume that consumersact independently. Typically, many explanatory at-tributes are collected on each actor and used in mul-tivariate modeling such as regression or tree induc-tion. In contrast, network-based marketing assumesinterdependency among consumer preferences. Wheninterdependencies exist, it may be beneficial to ac-count for their effects in targeting models. Tradi-tionally in statistical research, interdependencies aremodeled as part of a covariance structure, either
within a particular observational unit (as in the caseof repeated measures experiments) or between ob-servational units. Studies of network-based market-ing instead attempt to measure these interdepen-dencies through implicit links, such as matching ongeographic or demographic attributes, or throughexplicit links, such as direct observation of commu-nications between actors. In this section, we reviewthe different types of data and the range of statisti-cal methods that have been used to analyze them,and we discuss the extent to which these methodsnaturally accommodate networked data.
Work in network-based marketing spans the fieldsof statistics, economics, computer science, sociology,psychology and marketing. In this section, we or-ganize prominent work in network-based marketingby six types of statistical research: (1) econometricmodeling, (2) network classification modeling, (3)surveys, (4) designed experiments with conveniencesamples, (5) diffusion theory and (6) collaborativefiltering and recommender systems. In each case, weprovide an overview of the approach and a discus-sion of a prominent example. This (brief ) survey isnot exhaustive. In the final subsection, we discusssome of the statistical challenges inherent in incor-porating this network structure.
3.1 Econometric Models
Econometrics is the application of statistical meth-ods to the empirical estimation of economic rela-tionships. In marketing this often means the esti-mation of two simultaneous equations: one for themarketing organization or firm and one for the mar-ket. Regression and time-series analysis are foundat the core of econometric modeling, and economet-ric models are often used to assess the impact of atarget marketing campaign over time.
Econometric models have been used to study theimpact of interdependent preferences on rice con-sumption (Case, 1991), automobile purchases (Yangand Allenby, 2003) and elections (Linden, Smith andYork, 2003). For each of the aforementioned studies,geography is used in part as a proxy for interde-pendence between consumers, as opposed to direct,explicit communication. However, different methodsare used in the analysis. Most recently, Yang andAllenby (2003) suggested that traditional randomeffects models are not sufficient to measure the in-terdependencies of consumer networks. They devel-oped a Bayesian hierarchical mixture model where

4 S. HILL, F. PROVOST AND C. VOLINSKY
interdependence is built into the covariance struc-ture through an autoregressive process. This frame-work allows testing of the presence of interdepen-dence through a single parameter. It also can incor-porate the effects of multiple networks, each with itsown estimated dependence structure. In their ap-plication, they use geography and demography tocreate a “network” of consumers in which links arecreated between consumers who exhibit geographicor demographic similarity. The authors showed thatthe geographically defined network of consumers ismore useful than the demographic network for ex-plaining consumer behavior as it relates to purchas-ing Japanese cars. Although they do not have dataon direct communication between consumers, theframework presented by Yang and Allenby (2003)could be extended to explicit network data wherelinks are created between consumers through theirexplicit communication as opposed to demographicor geographic similarity.
A drawback of this approach is that the interde-pendence matrix has size n2, where n is the num-ber of consumers; consumer networks are extremelylarge and prohibit parameter estimation using thismethod. Sparse matrix techniques or clever cluster-ing of the observations would be a natural extension.
3.2 Network Classification Models
Network classification models use knowledge ofthe links between entities in a network to estimatea quantity of interest for those entities. Typically,in such a model an entity is influenced most bythose directly connected to it, but is also affectedto a lesser extent by those further away. Some net-work classification models use an entire network tomake predictions about a particular entity on thenetwork; Macskassy and Provost (2004) provided abrief survey. However, most methods have been ap-plied to small data sets and have not been applied toconsumer data. Much research in network classifica-tion has grown out of the pioneering work by Klein-berg (1999) on hubs and authorities on the Inter-net, and out of Google’s PageRank algorithm (Brinand Page, 1998), which (to oversimplify) identifiesthe most influential members of a network by howmany influential others “point” to them. Althoughneither study uses statistical models, both are re-lated to well-understood notions of degree central-ity and distance centrality from the field of social-network analysis.
One paper that models a consumer network formaximizing profit is by Richardson and Domingos(2002), in which a social network of customers ismodeled as a Markov random field. The probabilitythat a given customer will buy a given product is afunction of the states of her neighbors, attributesof the product and whether or not the customerwas marketed to. In this framework it is possibleto assign a “network value” to every customer byestimating the overall benefit of marketing to thatcustomer, including the impact that the marketingaction will have on the rest of the network (e.g.,through word of mouth). The authors tested theirmodel on a database of movie reviews from an In-ternet site and found that their proposed method-ology outperforms non-network methods for esti-mating customer value. Their network formulationuses implicit links (customers are linked when a cus-tomer reads a review by another customer and sub-sequently reviews the item herself ) and implicit pur-chase information (they assume a review of an itemimplies a purchase and vice versa).
3.3 Surveys
Most research in this area does not have infor-mation on whether consumers actually talk to eachother. To address this shortcoming, some studies usesurvey sampling to collect comprehensive data onconsumers’ word-of-mouth behavior. By samplingindividuals and contacting them, researchers can col-lect data that are difficult (or impossible) to ob-tain directly by observing network-based marketingphenomena (Bowman and Narayandas, 2001). Thestrength of these studies lies in the data, includ-ing the richness and flexibility of the answers thatcan be collected from the responders. For instance,researchers can acquire data about how customersfound out about a product and how many othersthey told about the product. An advantage is thatresearchers can design their sampling scheme to con-trol for any known confounding factors and can de-vise fully balanced experimental designs that testtheir hypotheses. Since the purpose of models builtfrom survey data is description, simple statisticalmethods like logistic regression or analysis of vari-ance (ANOVA) typically are used.
Bowman and Narayandas (2001) surveyed morethan 1700 purchasers of 60 different products whopreviously had contacted the manufacturer of thatproduct. The purchasers were asked specific ques-tions about their interaction with the manufacturer

NETWORK-BASED MARKETING 5
and its impact on subsequent word-of-mouth behav-ior. The authors were able to capture whether thecustomers told others of their experience and if so,how many people they told. The authors found thatself-reported “loyal” customers were more likely totalk to others about the products when they weredissatisfied, but interestingly not more likely whenthey were satisfied. Although studies like thiscollect some direct data on consumers’ word-of-mouthbehavior, the researchers do not know whichof the consumers’ contacts later purchased the prod-uct. Therefore, they cannot address whether word-of-mouth actually affects individual sales.
3.4 Designed Experiments with Convenience
Samples
Designed experiments enable researchers to studynetwork-based marketing in a controlled setting. Al-though the subjects typically comprise a conveniencesample (such as those undergraduates who answeran ad in the school newspaper), the design of the ex-periment can be completely randomized. This is un-like the studies that rely on secondary data sourcesor data from the Web. Typically ANOVA is used todraw conclusions.
Frenzen and Nakamoto (1993) studied the factorsthat influence individuals’ decisions to disseminateinformation through a market via word-of-mouth.The subjects were presented with several scenar-ios that represented different products and market-ing strategies, and were asked whether they wouldtell trusted and nontrusted acquaintances about theproduct/sale. They studied the effect of the cost/valuemanipulations on the consumers’ willingness to shareinformation actively with others, as a function of thestrength of the social tie. In this study, the authorsdid not allow the subjects to construct their explicitconsumer network; instead, they asked the partici-pants to hypothesize about their networks. The ex-periments used the data from a convenience sam-ple to generalize over a complete consumer network.The authors also employed simulations in their study.They found that the stronger the moral hazard (therisk of problematic behavior) presented by the infor-mation, the stronger the ties must be to foster infor-mation propagation. Generally, the authors showedthat network structure and information characteris-tics interact when individuals form their informationtransmission decisions.
3.5 Diffusion Models
Diffusion theory provides tools, both quantitativeand qualitative, to assess the likely rate of diffu-sion of a technology or product. Qualitatively, re-searchers have identified numerous factors that facil-itate or hinder technology adoption (Fichman, 2004),as well as social factors that influence product adop-tion (Rogers, 2003). Quantitative diffusion researchinvolves empirical testing of predictions from diffu-sion models, often informed by economic theory.
The most notable and most influential diffusionmodel was proposed by Bass (1969). The Bass modelof product diffusion predicts the number of userswho will adopt an innovation at a given time t. Ithypothesizes that the rate of adoption is a functionsolely of the current proportion of the populationwho have adopted. Specifically, let F (t) be the cu-mulative proportion of adopters in the population.The diffusion equation, in its simplest form, modelsF (t) as a function of p, the intrinsic adoption rate,and q, a measure of social contagion. When q > p,this equation describes an S-shaped curve, whereadoption is slow at first, takes off exponentially andtails off at the end. This model can effectively modelword-of-mouth product diffusion at the aggregate,societal level.
In general, the empirical studies that test andextend accepted theories of product diffusion relyon aggregate-level data for both the customer at-tributes and the overall adoption of the product(Ueda, 1990; Tout, Evans and Yakan, 2005); theytypically do not incorporate individual adoption. Mod-els of product diffusion assume that network-basedmarketing is effective. Since understanding when dif-fusion occurs and the extent to which it is effective isimportant for marketers, these methods may bene-fit from using individual-level data. Data on explicitnetworks would enable the extension of existing dif-fusion models, as well as the comparison of resultsusing individual- versus aggregate-level data.
In his first study, Bass tested his model empir-ically against data for 11 consumer durables. Themodel yielded good predictions of the sales peakand the timing of the peak when applied to his-torical data. Bass used linear regression to estimatethe parameters for future sales predictions, measur-ing the goodness of fit (R2 value) of the model for11 consumer durable products. The success of theforecasts suggests that the model may be useful inproviding long-range forecasting for product sales

6 S. HILL, F. PROVOST AND C. VOLINSKY
or adoption. There has been considerable follow-upwork on diffusion since this groundbreaking work.Mahajan, Muller and Kerin (1984) review this work.Recent work on product diffusion explores the ex-tent to which the Internet (Fildes, 2003) as well asglobalization (Kumar and Krishnan, 2002) play arole in product diffusion.
3.6 Collaborative Filtering and Recommender
Systems
Recommender systems make personalized recom-mendations to individual consumers based on de-mographic content and link data (Adomavicius andTuzhilin, 2005). Collaborative filtering methods fo-cus on the links between consumers; however, thelinks are not direct. They associate consumers witheach other based on shared purchases or similar rat-ings of shared products.
Collaborative filtering is related to explicit con-sumer network-based marketing because both tar-get marketing tasks benefit from learning from datastored in multiple tables (Getoor, 2005). For ex-ample, Getoor and Sahami (1999), Huang, Chungand Chen (2004) and Newton and Greiner (2004)established the connection between the recommen-dation problem and statistical relational learningthrough the application of probabilistic relationalmodels (PRM’s) (Getoor, Friedman, Koller and Pf-effer, 2001). However, neither group used explicitlinks between customers for learning. Recommen-dation systems may well benefit from informationabout explicit consumer interaction as an additional,perhaps quite important, aspect of similarity.
3.7 Research Opportunities and Statistical
Challenges
We see that there is a burgeoning body of workthat addresses consumers’ interactions and their ef-fects on purchasing. To our knowledge the forego-ing types represent the main statistical approachestaken in research on network-based marketing. Ineach approach, there are assumptions made in thedata collection or in the analysis that restrict themfrom providing strong and direct support for the hy-pothesis that network-based marketing indeed canimprove on traditional techniques. Surveys and con-venience samples can suffer from small and possi-bly biased samples. Collaborative filtering modelshave large samples, but do not measure direct linksbetween individuals. Models in network classifica-tion and econometrics historically have used proxies
like geography instead of data on direct communica-tions, and almost all studies have no accurate, spe-cific data on which (and what) customers purchase.
To paint a complete picture of network influencefor a particular product, the ideal data set wouldhave the following properties: (1) large and unbiasedsample, (2) comprehensive covariate information onsubjects, (3) measurement of direct communicationbetween subjects and (4) accurate information onsubjects’ purchases. The data set we present in thenext section has all of these properties and we willdemonstrate its value for statistical research intonetwork influence. The question of how to analyzesuch data brings up many statistical issues:
Data-set size. Network-based marketing data setsoften arise from Internet or telecommunications ap-plications and can be quite large. When observationsnumber in the millions (or hundreds of millions),the data become unwieldy for the typical data an-alyst and often cannot be handled in memory bystandard statistical analysis software. Even if thedata can be loaded, their size renders the interac-tive style of analysis common with tools like R orSplus painfully slow. In Internet or telecommunica-tions studies, there often are two massive sources ofdata: all actors (web sites, communicators), alongwith their descriptive attributes, and the transac-tions among these actors. One solution is to com-press the transaction information into attributes tobe included in the actors’ attribute set. It has beenshown that file squashing (DuMouchel, Volinsky etal., 1999), which attempts to combine the best fea-tures of preprocessed data with random sampling,can be useful for customer attrition prediction. Du-Mouchel et al. claimed that squashing can be usefulwhen dealing with up to billions of records. However,there may be a loss of important information whichcan be captured only by complex network structure.
More sophisticated network information derivedfrom transactional data can also be incorporatedinto the matrix of customer information by deriv-ing network attributes such as degree distributionand time spent on the network (which we demon-strate below). Similarly, other types of data suchas geographical data or temporal data, which oth-erwise would need to be handled by some sophisti-cated methodology, can be folded into the analysisby creating new covariates. It remains an open ques-tion whether clever data engineering can extract alluseful information to create a set of covariates for

NETWORK-BASED MARKETING 7
traditional analysis. For example, knowledge of com-munication with specific sets of individuals can beincorporated, and may provide substantial benefit(Perlich and Provost, 2006).
Once the data are combined, the remaining dataset still may be quite large. While much data min-ing research is focused on scaling up the statisticaltoolbox to today’s massive data sets, random sam-pling remains an effective way to reduce data to amanageable size while maintaining the relationshipswe are trying to discover, if we assume the networkinformation is fully encoded in the derived variables.The amount of sampling necessary will depend onthe computing environment and the complexity ofthe model, but most modern systems can handledata sets of tens or hundreds of thousands of ob-servations. When sampling, care must be taken tostratify by any attributes that are of particular in-terest or to oversample those attributes that haveextremely skewed distributions.
Low incidence of response. In applications wherethe response is a consumer’s purchase or reactionto a marketing event, it is common to have a verylow response rate, which can result in poor fit andreduced ability to detect significant effects for stan-dard techniques like logistic regression. If there arenot many independent attributes, one solution isPoisson regression, which is well suited for rare events.Poisson regression requires forming buckets of ob-servations based on the independent attributes andmodeling the aggregate response in these buckets asa Poisson random variable. This requires discretiza-tion of any continuous independent attributes, whichmay not be desirable. Also, if there are even a mod-erate number of independent attributes, the bucketswill be too sparse to allow Poisson modeling. Othersolutions that have been proposed include oversam-pling positive responses and/or undersampling neg-ative responses. Weiss (2004) gave an overview of theliterature on these and related techniques, showingthat there is mixed evidence as to their effective-ness. Other studies of note include the following.Weiss and Provost (2003) showed that, given a fixedsample size, the optimal class proportion in train-ing data varies by domain and by ultimate objec-tive (but can be determined); generally speaking, toproduce probability estimates or rankings, a 50:50distribution is a good default. However, Weiss andProvost’s results are only for tree induction. Japkow-icz and Stephen (2002) experimented with neuralnetworks and support-vector machines, in addition
to tree induction, showing (among other things) thatsupport-vector machines are insensitive to class im-balance. However, they considered primarily noise-free data. Other techniques to deal with unbalancedresponse attributes include ensemble (Chan and Stolfo,1998; Mease, Wyner and Buja, 2006) and multi-phase rule induction (Clearwater and Stern, 1991;Joshi, Kumar and Agarwal, 2001). This is an areain need of more systematic empirical and theoreticalstudy.
Separating word-of-mouth from homophily. Unlessthere is information about the content of communi-cations, one cannot conclude that there was word-of-mouth transmission of information about the product.Social theory tells us that people who communi-cate with each other are more likely to be similar toeach other, a concept called homophily (Blau, 1977;McPherson, Smith-Lovin and Cook, 2001). Homophilyis exhibited for a wide variety of relationships anddimensions of similarity. Therefore, linked consumersprobably are like-minded, and like-minded consumerstend to buy the same products. One way to ad-dress this issue in the analysis is to account forconsumer similarity using propensity scores (Rosen-baum and Rubin, 1984). Propensity scores were de-veloped in the context of nonrandomized clinical tri-als and attempt to adjust for the fact that the statis-tical profile of patients who received treatment maybe different than the profile of those who did not,and that these differences could mask or enhancethe apparent effect of the treatment. Let T repre-sent the treatment, X represent the independentattributes excluding the treatment and Y representthe response. Then the propensity score PS(x) =P (T = 1|X = x). By matching propensity scores inthe treatment and control groups using typical indi-cators of homophily like demographic data, we canaccount (partially) for the possible confoundednessof other independent attributes.
Incorporating extended network structure. Data withnetwork structure lend themselves to a robust set ofnetwork-centric analyses. One simple method (em-ployed in our analysis) is to create attributes fromthe network data and plug them into a traditionalanalysis. Another approach is to let each actor be in-fluenced by her neighborhood modeled as a Markovrandom field. Domingos and Richardson (2001) usedthis technique to assign every node a “network value.”A node with high network value (1) has a high prob-ability of purchase, (2) is likely to give the product

8 S. HILL, F. PROVOST AND C. VOLINSKY
a high rating, (3) is influential on its neighbors’ rat-ings and (4) has neighbors like itself. Hoff, Rafteryand Handcock (2002) defined a Markov-chain MonteCarlo method to estimate latent positions of the ac-tors for small social-network data sets. This embedsthe actors in an unobserved “social space,” whichcould be more useful than the actual transactionsthemselves for predicting sales. The field of statis-tical relational learning (Getoor, 2005) has recentlyproduced a wide variety of methods that could beapplicable. Often these models allow influence topropagate through the network.
Missing data. Missing data in network transac-tions are common—often only part of a network isobservable. For instance, firms typically have trans-actional data on their customers only or may haveone class of communication (e-mail) but not another(cellular phone). One attempt to account for thesemissing edges is to use network structure to assigna probability of a missing edge everywhere an edgeis not present. Thresholding this probability createspseudo-edges, which can be added to the network,perhaps with a lesser weight (Agarwal and Pregi-bon, 2004). This is closely related to the link predic-
tion problem, which tries to predict where the nextlinks will be (Liben-Nowell and Kleinberg, 2003).One extension of the PRM framework models link
structure through the use of reference uncertainty
and existence uncertainty. The extension includes aunified generative model for both content and re-lational structure, where interactions between theattributes and link structure are modeled (Getoor,Friedman, Koller and Taskar, 2003).
4. DATA SET AND PRIMARY HYPOTHESIS
This section details our data set, derived primarilyfrom a direct-mail marketing campaign to potentialcustomers of a new communications service (laterwe augment the primary data with a large set ofconsumer-specific attributes). The firm’s marketingteam identified and marketed to a list of prospectsusing its standard methods. We investigate whethernetwork-related effects or evidence of “viral” infor-mation spread are present in this group. As we willdescribe, the firm also marketed to a group we iden-tified using the network data, which allows us totest our hypotheses further. We are not permittedto disclose certain details, including specifics aboutthe service being offered and the exact size of thedata set.
4.1 Initial Data Details
In late 2004, a telecommunications firm undertooka large direct-mail marketing campaign to potential
Table 1
Descriptive statistics for the marketing segments (see Section 4.1 for details)
Segment Loyalty Intl Tech1 Tech2 Early Adopt Offer % of list %NN
1 3 Y Hi 1–7 Med–Hi P1 1.6 0.632 3 Y Med 1–7 Med–Hi P1 2.4 1.263 2 Y Hi 1–4 Hi P1 1.7 0.084 2 Y Med 1–4 Hi P1 1.7 0.105 1 Y Hi 1–4 Hi P1 0.1 0.226 1 Y Med 1–4 Hi P1 0.1 0.257 3 N Hi 1–7 Med–Hi P2 10.9 0.508 3 N Med 1–7 Med–Hi P2 13.1 0.839 2 N Hi 1–4 Hi P2 17.5 0.04
10 2 N Med 1–4 Hi P2 11.0 0.0711 1 N Hi 1–4 Hi P2 5.3 0.1412 1 N Med 1–4 Hi P2 7.7 0.2513 3 N Hi 1–7 Med–Hi P2 2.0 0.6314 1, 2 N Hi 1–4 Hi P2 2.0 0.1515 1 Y ? ? ? P3 2.0 1.0116 1 N ? ? ? P2 1.6 0.4617 3 N Hi 1–7 Med–Hi P2+ 2.0 0.7018 1, 2 N Hi 1–4 Hi P2+ 2.0 0.1519 1, 2, 3 Y Hi 1–7 Med–Hi P3 1.8 0.6720 2 N Hi, Med 1–4 Hi L1 6.0 0.0521 2 N Hi, Med 1–4 Hi L2 6.0 0.05

NETWORK-BASED MARKETING 9
customers of a new communications service. Thisservice involved new technology and, because of this,it was believed that marketing would be most suc-cessful to those consumers who were thought to be“high tech.”
In keeping with standard practice, the marketingteam collected attributes on a large set of prospects—consumers whom they believed to be potentialadopters of the service. The marketing team useddemographic data, customer relationship data, andvarious other data sources to create profitability andbehavioral models to identify prospective targets—consumers who would receive a targeted mailing.The data the marketing team provided us with didnot contain the underlying customer attributes (e.g.,demographics), but instead included values for de-rived attributes that defined 21 marketing segments(Table 1) that were used for campaign managementand post hoc analyses. The sample included millionsof consumers. The team believed that the differentsegments would have varying response rates and itwas important to separate the segments in this wayto learn the most from the campaign.
An important derived variable was loyalty, a three-level score based on previous relationships with thefirm, including previous orders of this and other ser-vices. Roughly, loyalty level 3 comprises customerswith moderate-to-long tenure and/or those who havesubscribed to a number of services in the past. Loy-alty level 2 comprises those customers with whichthe firm has had some limited prior experiences.Loyalty level 1 comprises consumers who did nothave service with the firm at the time of mailing;little (if any) information is available on them. Pre-vious analyses have shown that loyalty and tenureattributes have substantial impact on response tocampaigns.
Other important attributes were based on demo-graphics and other customer characteristics. The at-tribute Intl is an indicator of whether the prospecthad previously ordered any international services;Tech1 (hi, med or low) and Tech2 (1–10, where 1=high tech) are scores derived from demographics andother attributes that estimate the interest and abil-ity of the customer to use a high-tech service; EarlyAdopt is a proprietary score that estimates the like-lihood of the customer to use a new product, basedon previous behavior. We also show the Offer, in-dicating that different segments received differentmarketing messages: P1–P3 indicate different post-cards that were sent, L1 and L2 indicate different
letters, and a “+” indicates that a “call blast” ac-companied the mailing. In defining the segments,those groups with high loyalty values were permittedlower values from the technology and early adoptionmodels. Segments 15 and 16 were provided by an ex-ternal vendor; there were insufficient data on theseprospects to fit our Tech and Early Adopt models,as indicated by a “?” in Table 1.
4.2 Primary Hypothesis and Network Neighbors
The research goal we consider here is whether re-laxing the assumption of independence between con-sumers can improve demonstrably the estimationof response likelihood. Thus, our first hypothesis isthat someone who has direct communication witha current subscriber is more likely herself to adoptthe service. It should be noted that the firm knowsonly of communications initiated by one of its cus-tomers through a service of the firm, so the net-work data are incomplete (considerably), especiallyfor the lower loyalty groups. Data on communica-tions events include anonymous identifiers for thetransactors, a time stamp and the transaction dura-tion. For the purposes of this research, all data arerendered anonymous so that individual identities areprotected.
In pursuit of our hypothesis, we constructed anattribute called network neighbor (or NN)—a flagthat indicates whether the targeted consumer hadcommunicated with a current user of the service in atime period prior to the marketing campaign. Over-all, 0.3% of the targets are network neighbors. In Ta-ble 1, the percentage of network neighbors (%NN)is broken down by segment.
In addition, the marketing team invited us to cre-ate our own segment, which they also would target.Our “segment 22” consisted of network neighborsthat were not already on the current list of targets.To make sure our list contained viable prospects, themarketing team calculated the derived technologyand early adopter scores for the consumers on ourlist. They filtered based on these scores, but theyrelaxed the thresholds used to limit their originallist. For instance, someone with loyalty = 1 neededa Tech2 score less than 4 to merit inclusion on theinitial list; this threshold was relaxed for our list toTech2 less than 7. In this way, the marketing teamallowed prospects who missed inclusion on the firstcut to make it into segment 22 if they were net-work neighbors. However, the marketing team stillavoided targeting customers who they believed had

10 S. HILL, F. PROVOST AND C. VOLINSKY
Table 2
Data categories
Target= Y Target= N
NN = Y NN targets NN nontargetsSegments 1–22Relative size = 0.015 Relative size = 0.10Prospects identified by marketing models and whoalso are network neighbors. Those in segment 22have reduced thresholds on the marketing modelscores.
Consumers who were network neighbors, but werenot marketed to because they scored poorly onmarketing models.
NN = N Non-NN targets Non-NN nontargetsSegments 1–21Relative size = 1 Relative size > 8Prospects identified by marketing models but whoare not network neighbors.
Consumers who were not network neighbors andalso were not considered to be good prospects bythe marketing model.
Notes. The data for our study are broken down into targets and network neighbors. The “relative size” value shows thenumber of prospects who show up in each group, relative to the non-NN target group.
very small probabilities of a purchase. For thosenetwork neighbors who did not score high enoughto warrant inclusion in segment 22, we still trackedtheir purchase records to see if any of them sub-scribed to the service in the absence of the market-ing campaign; see below. Overall, the profile of thecandidates in our segment 22 was considered to besubpar in terms of demographics, affinity and tech-nological capability. Notably, for our final conclu-sions, these targets are potential customers the firmwould have otherwise ignored. The size of segment22 was about 1.2% of the marketing list.
To summarize, the above process divides the pros-pect universe along two dimensions: (1) targets—those consumers identified by the marketing mod-els as being worthy of solicitation—and (2) network
neighbors—those who had direct communication witha subscriber. Table 2 shows the relative size for eachcombination (using the non-network-neighbor tar-gets as the reference set). Note the non-NN nontar-gets, who neither are network neighbors nor are theydeemed to be good prospects. This group is the ma-jority of the prospect space and includes consumersthat the firm has very little information about, be-cause they are low-usage communicators or do notsubscribe to any services with the firm.
4.3 Modeling with Consumer-Specific Data
To determine whether relaxing the independenceassumption (using the network data) improves mod-eling, we fit models using a wide range of demo-graphic and consumer-specific independent attributes
(many of which are known or believed to affect theestimated likelihood of purchase). Overall, we col-lected the values for over 150 attributes to assesstheir effect on sales likelihood and their interactionswith the network-neighbor variable. These values in-cluded the following:
• Loyalty data: We obtained finer-grained loyaltyinformation than the simple categorization describedabove, including past spending, types of service,how often the customer responded to prior mail-ings, a loyalty score generated by a proprietarymodel and information about length of tenure.
• Geographic data: Geographic data were necessaryfor the direct mail campaign. These data includecity, state, zip code, area code and metropolitancity code.
• Demographic data: These include information suchas gender, education level, credit score, head ofhousehold, number of children in the household,age of members in the household, occupation andhome ownership. Some of this information wasinferred at the census tract level from the geo-graphic data.
• Network attributes: As mentioned earlier, we ob-served communications of current subscribers withother consumers. In addition to the simple network-neighbor flag described earlier, we derived moresophisticated attributes from prospects’ commu-nication patterns. We will return to these in Sec-tion 5.6.

NETWORK-BASED MARKETING 11
4.4 Data Limitations
We encountered missing values for customers acrossall loyalty levels. The amount of missing informa-
tion is directly related to the level of experience wehave had with the customer just prior to the directmailing. For example, geography data are availablefor all targets across all three loyalty levels. On the
other hand, as the number of services and tenurewith the firm decline, so does the amount of infor-mation (e.g., transactions) available for each target.Given the difference in information as loyalty varies,we grouped customers by loyalty level and treated
the levels separately in our analyses. This stratifica-tion leaves three groups that are mostly internallyconsistent with respect to missing values.
The overall response rate is very low. As discussed
above, this presents challenges inherent with a heav-ily skewed response variable. For example, an analy-sis that stratifies over many different attributes mayhave several strata with no sales at all, renderingthese strata mostly useless. The data set is large,
which helps to ameliorate this problem, but in turnpresents logistical problems with many sophisticatedstatistical analyses. In this paper, we restrict our-selves to relatively straightforward analyses.
4.5 Loyalty Distribution
A look at the distribution of the loyalty groupsacross the four categories (Figure 1) of prospectsshows that the firm targeted customers in the higher
loyalty groups relatively heavily. The network-neighbortarget group appears to skew toward the less loyalprospects; this is due to the fact that segment 22,which makes up a large part of the network-neighbor
population, comprises predominantly low-loyalty con-sumers.
5. ANALYSIS
Next we will show direct, statistical evidence that
consumers who have communicated with prior cus-tomers are more likely to become customers. Weshow this in several ways, including using our ownbest efforts to build competing targeting models and
conducting thorough assessments of predictive abil-ity on out-of-sample data. Then we consider moresophisticated network attributes and show that tar-geting can be improved further.
5.1 Network-Based Marketing Improves
Response
Segmentation provides an ideal setting to test thesignificance and magnitude of any improvement inmodeling by including network-neighbor informa-tion, while stratifying by many attributes known tobe important, such as loyalty and tenure. The re-sponse variable is the take rate for the targets in thetwo months following the direct mailing. The takerate is the proportion of the targeted consumers whoadopted the service within a specified period follow-ing the offer. For each segment, we performed a sim-ple logistic regression for the independent network-neighbor attribute versus the dependent sales re-sponse. In Figure 2, we graphically present parame-ter estimates (equivalent to log-odds ratios) for thenetwork attribute along with 95% confidence inter-vals for 20 of the 21 segments (segment 5 had onlya small number of network-neighbor prospects andzero network-neighbor sales, and therefore had aninfinite log odds). Figure 2 shows that in all 20 seg-ments the network-neighbor effect is positive (theparameter estimate is greater than zero), demon-strating an increased take rate for the network-neighborgroup within each segment. For 17 of these seg-ments, the log-odds ratio is significantly differentfrom the null hypothesis value of 0 (p < 0.05), in-dicating that being a network neighbor significantlyaffected sales in those segments.
While odds ratios allow for tests of significance ofan independent variable, they are not as directlyinterpretable as comparisons of take rates of thenetwork-neighbor and non-network-neighbor groupsin a given segment. The take rates for the network
Fig. 2. Results of logistic regression. Parameter estimatesplotted as log-odds ratios with 95% confidence intervals. Thenumber plotted at the value of the parameter estimate refersback to segment numbers from Table 1.

12 S. HILL, F. PROVOST AND C. VOLINSKY
Fig. 1. Loyalty distribution by customer category. The three bars show the relative sizes of the three loyalty groups for ourfour data categories. The network neighbors (NN) show a much larger proportion of low-loyalty consumers than the non-NNgroup.
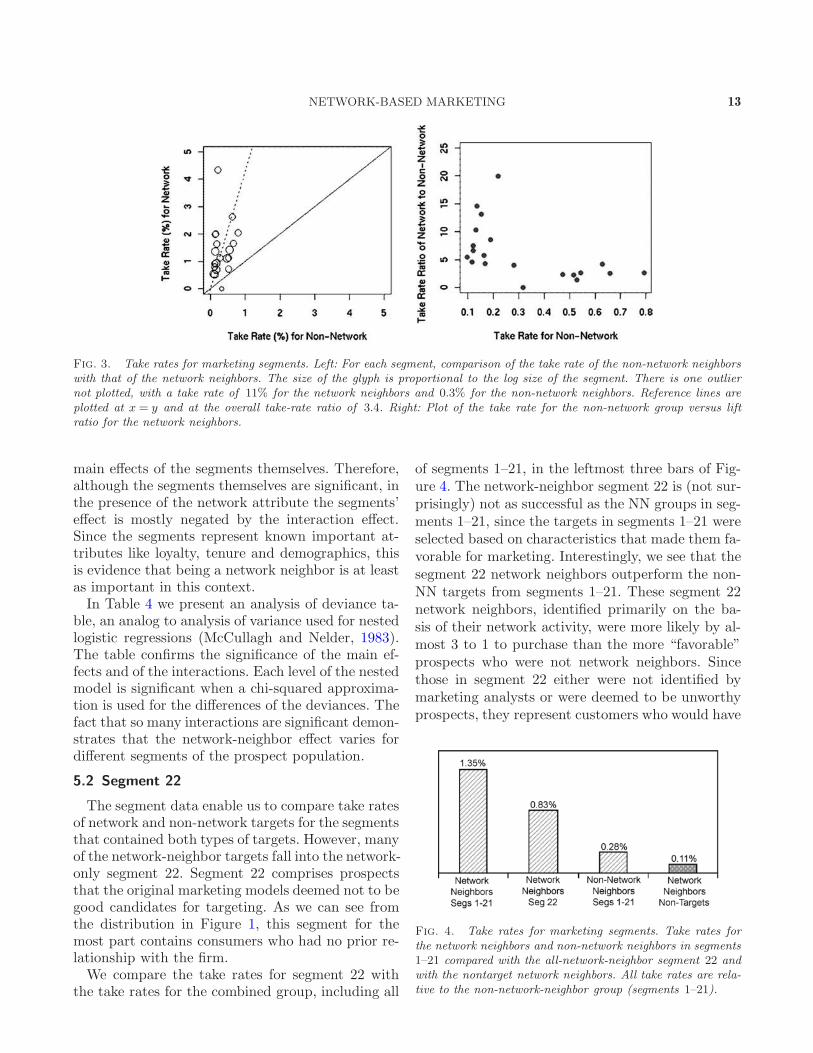
neighbors are plotted versus the non-network neigh-bors in Figure 3, where the size of the point is pro-portional to the log size of the segment. All segmentshave higher take rates in the network-neighbor sub-group, except for the one segment that had no network-neighbor sales (the smallest sample size). Over theentire data set, the network-neighbors’ take rateswere greater by a factor of 3.4. This value is plottedin Figure 3 as a dotted line with slope = 3.4. Theright-hand plot of Figure 3 shows the relationshipbetween each segment’s take rate and its lift ratio,defined as the take rate for NN divided by the takerate for non-NN. The plot shows that the benefit ofbeing a network neighbor is greater for those seg-ments with lower overall take rates.
As Figure 3 shows, some of the segments had muchhigher take rates than others. To assess statisticalsignificance of the network-neighbor effect after ac-counting for this segment effect, we ran a logisticregression across all segments, including the main ef-fects for the network-neighbor attribute, dummy at-tributes for each segment and the interaction termsbetween the two. Two of the interaction terms hadto be deleted: one from segment 22, which only hadnetwork-neighbor cases, and one from the segmentwith no sales from the network neighbors. We rana full logistic regression and used stepwise variableselection.
The results of the logistic regression reiterate thesignificance of being a network neighbor. The finalmodel can be found in Table 3. The coefficient of2.0 for the network-neighbor attribute in the final
model is an estimate of the log odds, which we ex-ponentiate to get an odds ratio of 7.49, with a 95%confidence interval of (5.64, 9.94). More than halfof the segment effects and most of the interactionsbetween the network-neighbor attribute and thosesegment effects are significant. The interpretation ofthese interactions is important. Note that the mag-nitudes of the interaction coefficients are negativeand very close in magnitude to the coefficients of the
Table 3
Coefficients and confidence intervals for the final segmentmodel
Attribute Coeff (c.i.) Significancea
Network neighbor (NN) 2.0 (1.7, 2.3) **Segment = 1 1.7 (0.9, 2.5) **Segment = 2 1.8 (1.2, 2.4) **Segment = 4 2.1 (1.3, 3.0) **Segment = 5 1.9 (0.4, 3.3) **Segment = 6 1.9 (1.2, 2.5) **Segment = 7 1.4 (1.0, 1.9) **Segment = 8 1.3 (0.9, 1.7) **Segment = 17 1.5 (0.7, 2.2) **Segment = 19 2.2 (1.6, 2.9) **NN × Segment = 1 −1.1 (−2.1, 0.0) *NN × Segment = 2 −0.9 (−1.7, −0.2) **NN × Segment = 4 −1.8 (−4.0, 0.4) **NN × Segment = 6 −1.5 (−2.6, −0.6) **NN × Segment = 7 −1.2 (−1.7, −0.6) **NN × Segment = 8 −0.8 (−1.3, −0.4) **NN × Segment = 17 −1.6 (−2.8, −0.5) **NN × Segment = 19 −1.1 (−1.9, −0.3) **
aSignificance of the attributes in the logistic regression modelis shown at the 0.05 (*) and 0.01 (**) levels.
NETWORK-BASED MARKETING 13
Fig. 3. Take rates for marketing segments. Left: For each segment, comparison of the take rate of the non-network neighborswith that of the network neighbors. The size of the glyph is proportional to the log size of the segment. There is one outliernot plotted, with a take rate of 11% for the network neighbors and 0.3% for the non-network neighbors. Reference lines areplotted at x = y and at the overall take-rate ratio of 3.4. Right: Plot of the take rate for the non-network group versus liftratio for the network neighbors.
main effects of the segments themselves. Therefore,although the segments themselves are significant, inthe presence of the network attribute the segments’effect is mostly negated by the interaction effect.Since the segments represent known important at-tributes like loyalty, tenure and demographics, thisis evidence that being a network neighbor is at leastas important in this context.
In Table 4 we present an analysis of deviance ta-ble, an analog to analysis of variance used for nestedlogistic regressions (McCullagh and Nelder, 1983).The table confirms the significance of the main ef-fects and of the interactions. Each level of the nestedmodel is significant when a chi-squared approxima-tion is used for the differences of the deviances. Thefact that so many interactions are significant demon-strates that the network-neighbor effect varies fordifferent segments of the prospect population.
5.2 Segment 22
The segment data enable us to compare take ratesof network and non-network targets for the segmentsthat contained both types of targets. However, manyof the network-neighbor targets fall into the network-only segment 22. Segment 22 comprises prospectsthat the original marketing models deemed not to begood candidates for targeting. As we can see fromthe distribution in Figure 1, this segment for themost part contains consumers who had no prior re-lationship with the firm.
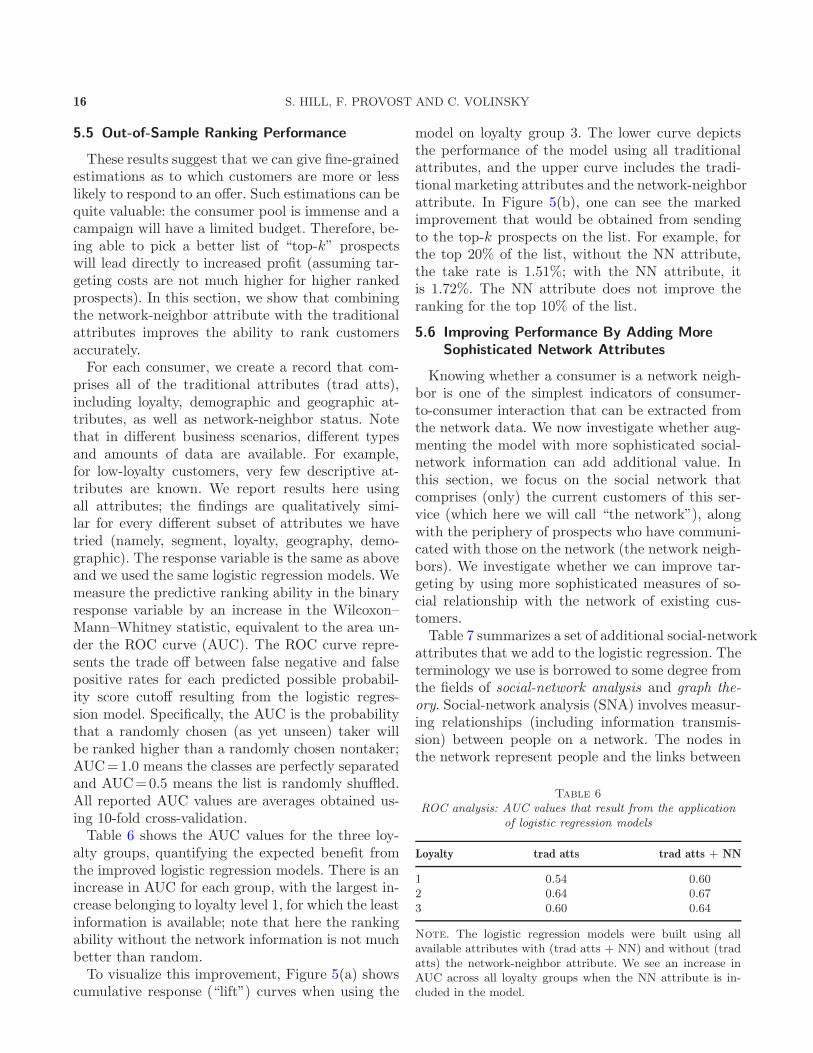
We compare the take rates for segment 22 withthe take rates for the combined group, including all
of segments 1–21, in the leftmost three bars of Fig-ure 4. The network-neighbor segment 22 is (not sur-prisingly) not as successful as the NN groups in seg-ments 1–21, since the targets in segments 1–21 wereselected based on characteristics that made them fa-vorable for marketing. Interestingly, we see that thesegment 22 network neighbors outperform the non-NN targets from segments 1–21. These segment 22network neighbors, identified primarily on the ba-sis of their network activity, were more likely by al-most 3 to 1 to purchase than the more “favorable”prospects who were not network neighbors. Sincethose in segment 22 either were not identified bymarketing analysts or were deemed to be unworthyprospects, they represent customers who would have
Fig. 4. Take rates for marketing segments. Take rates forthe network neighbors and non-network neighbors in segments1–21 compared with the all-network-neighbor segment 22 andwith the nontarget network neighbors. All take rates are rela-tive to the non-network-neighbor group (segments 1–21).

14 S. HILL, F. PROVOST AND C. VOLINSKY
Table 4
Analysis of deviance table for the network-neighbor study
Variable Deviance DF Change in deviance Significancea
Intercept 11200Segment 10869 9 63 **Segment + NN 10733 1 370 **Segment + NN + interactions 10687 8 41 **
aSignificance of the group of attributes at each step is shown at the 0.05 (*) and 0.01(**) levels.
“fallen through the cracks” in the traditional mar-keting process.
5.3 Improving a Multivariate Targeting Model
Now we will assess whether the NN attribute canimprove a multivariate targeting model by incorpo-rating all that we know or can find out (over 150different attributes) about the targets, including ge-ography, demographics and other company-specificattributes, from internal and external sources (seeSection 3.2).
As discussed in Section 3.7, we tried to address(as well as possible) an important causal questionthat arises: Is this network-neighbor effect due toword of mouth or simply due to homophily? Theobserved effect may not be indicating viral propa-gation, but instead may simply demonstrate a veryeffective way to find like-minded people. This theo-retical distinction may not matter much to the firmfor this particular type of marketing process, butis important to make, for example, before design-ing future campaigns that try to take advantage ofword-of-mouth behavior.
Although we cannot control for unobserved simi-larities, we can be as careful as possible in our anal-ysis to ensure that the statistical profile of the NNprospects is the same as the profile for the non-NNcases. Since our data set contains many more non-NN cases than NN cases, we match each NN casewith a single non-NN case that is as close as possi-ble to it by calculating propensity scores using all ofthe explanatory attributes considered (as describedin Section 3.7). At the end of this matching process,the NN group is as close as is reasonably possible instatistical properties to the non-NN group.
Due to heterogeneity of data sources across thethree loyalty groups, we used the propensity scoresto create a matched data set for each group. For each
(individually), we fitted a full logistic regression in-cluding interactions and selected a final model us-ing stepwise variable selection. All attributes werechecked for outliers, transformations and collinear-ity with other attributes, and we removed or com-bined the attributes that accounted for any signifi-cant correlations.
Table 5 shows the results of the logistic regres-sions, which show the attributes that were foundto be significant, those that were negatively cor-related with take rate, and those that had inter-actions with the NN attribute. Each of the threemodels found the network-neighbor attribute to besignificant along with several others. The signifi-cant attributes tended to be attributes regardingthe prospects’ previous relationships with the firm,such as previous international services, tenure withfirm, churn identifiers and revenue spent with thefirm. These attributes are typically correlated withdemographic attributes, which explains the lack ofsignificance of many of the demographic attributesconsidered. Interestingly, tenure with firm is signif-icant in loyalty groups 1 and 2, but with differentsigns. In the most loyal group, tenure is negativelycorrelated, but in the mid-level loyalty group it ispositive. This unexpected result may be due to dif-fering compositions of the two groups; those con-sumers with long tenure in the most loyal groupmight be people who just never change services,while long tenure in the other group might be anindicator that they are gaining more trust in thecompany. In loyalty group 1, there is limited infor-mation about previous services with the firm. Forthose customers, knowing whether the customer hasresponded to any previous marketing campaigns hasa significant effect.
Table 5 also shows parameter estimates for NNand the take rates in the three loyalty groups. Thetake rates are highest in the group with the most

NETWORK-BASED MARKETING 15
Table 5
Results of multivariate model
Loyalty3 2 1
Significant NN NN NNattributes Discount calling plan (-)(I) Discount calling plan (-) Previous responder to
Level of Int’l Comm.(I) Tenure with firm mailing# of devices in house (-) Referral plan High Tech MsgRevenue band High Tech model score (I) Letter (vs. postcard)Tenure with firm (-) Region of country indicator Recent responder to mailingInternational communicator Belonged to loyalty program User of incentive credit cardBelonged to loyalty program Chumer (-) Any children in house (-)Referral plan College gradType of previous service Tenure at residence (-)Credit score Any children in house (-)Number of adults in house Child < 18 at home (-)
Beta hat for NN(95% CI) 0.68 (0.46, 0.91) 0.99 (0.49, 1.49) 0.84 (0.52, 1.16)
Take rate 0.9% 0.4% 0.3%
Notes. Significant attributes from logistic regressions across loyalty levels (p < 0.05). Bold indicates significance at 0.01 level;(-) indicates the effect of the variable was negative; (I) indicates a significant interaction with the NN variable.
loyalty but, interestingly, this group gets the leastlift (smallest parameter estimate) from the NN at-tribute. So the impact of network-neighbor is strongerfor those market segments with lower loyalty, whereactual take rates are weakest.
5.4 Consumers Not Targeted
As discussed above, only a select subset of ournetwork-neighbor list was subject to marketing, basedon relaxed thresholds on eligibility criteria. The re-mainder of the list, the nontarget network neighbors,made up the majority. Potential customers were omit-ted for various reasons: they were not believed tohave high-tech capacity; they were on a do-not-contactlist; address information was unreliable, and so on.Nonetheless, we were able to identify whether theypurchased the product in the follow-up time period.The take rate for this group was 0.11%, and is shownrelative to the target groups as the rightmost bar inFigure 4. Although they were not even marketed to,
their take rate is almost half that for the non-NNtargets—chosen as some of the best prospects by themarketing team. This group comprises consumerswithout any known favorable characteristics thatwould have put them on the list of prospects. Thefact that they are network neighbors alone supportsa relatively high take rate, even in the absence ofdirect marketing. This lends some support to an ex-planation of word-of-mouth propagation rather thanhomophily.
Finally, we will briefly discuss the remainder ofthe consumer space—the non-NN nontarget group.Unfortunately, it is very difficult to estimate a takerate in this category, which could be considered abaseline rate for all of the other take rates. To dothis, we would need to estimate the size of the spaceof all prospects. This includes all of the prospects thefirm knows about, as well as customers of the firm’scompetitors and consumers who might purchase thisproduct that do not have current telecommunica-tions service with any provider. It has been estab-lished that the size of the communications marketis difficult to estimate (Poole, 2004); our best esti-mates of this baseline take rate put it at well below0.01%, at least an order of magnitude less than eventhe nontarget network neighbors.
On the other hand, a by-product of our studyis that we can upper-bound the effect of the massmarketing campaigns in general by comparing thetarget-NN group and the nontarget-NN group. Thedifference in take rates between the targeted net-work neighbors and the nontargeted network neigh-bors is about 10 to 1. This difference cannot all beattributed to the marketing effect, since the targetedgroup was specifically chosen to be better prospectsand it is likely that more of them would have signedup for the service even in the total absence of mar-keting. However, it does seem reasonable to call thisfactor of 10 an upper bound on the effect of themarketing.
16 S. HILL, F. PROVOST AND C. VOLINSKY
5.5 Out-of-Sample Ranking Performance
These results suggest that we can give fine-grainedestimations as to which customers are more or lesslikely to respond to an offer. Such estimations can bequite valuable: the consumer pool is immense and acampaign will have a limited budget. Therefore, be-ing able to pick a better list of “top-k” prospectswill lead directly to increased profit (assuming tar-geting costs are not much higher for higher rankedprospects). In this section, we show that combiningthe network-neighbor attribute with the traditionalattributes improves the ability to rank customersaccurately.
For each consumer, we create a record that com-prises all of the traditional attributes (trad atts),including loyalty, demographic and geographic at-tributes, as well as network-neighbor status. Notethat in different business scenarios, different typesand amounts of data are available. For example,for low-loyalty customers, very few descriptive at-tributes are known. We report results here usingall attributes; the findings are qualitatively simi-lar for every different subset of attributes we havetried (namely, segment, loyalty, geography, demo-graphic). The response variable is the same as aboveand we used the same logistic regression models. Wemeasure the predictive ranking ability in the binaryresponse variable by an increase in the Wilcoxon–Mann–Whitney statistic, equivalent to the area un-der the ROC curve (AUC). The ROC curve repre-sents the trade off between false negative and falsepositive rates for each predicted possible probabil-ity score cutoff resulting from the logistic regres-sion model. Specifically, the AUC is the probabilitythat a randomly chosen (as yet unseen) taker willbe ranked higher than a randomly chosen nontaker;AUC=1.0 means the classes are perfectly separatedand AUC=0.5 means the list is randomly shuffled.All reported AUC values are averages obtained us-ing 10-fold cross-validation.
Table 6 shows the AUC values for the three loy-alty groups, quantifying the expected benefit fromthe improved logistic regression models. There is anincrease in AUC for each group, with the largest in-crease belonging to loyalty level 1, for which the leastinformation is available; note that here the rankingability without the network information is not muchbetter than random.
To visualize this improvement, Figure 5(a) showscumulative response (“lift”) curves when using the
model on loyalty group 3. The lower curve depictsthe performance of the model using all traditionalattributes, and the upper curve includes the tradi-tional marketing attributes and the network-neighborattribute. In Figure 5(b), one can see the markedimprovement that would be obtained from sendingto the top-k prospects on the list. For example, forthe top 20% of the list, without the NN attribute,the take rate is 1.51%; with the NN attribute, itis 1.72%. The NN attribute does not improve theranking for the top 10% of the list.
5.6 Improving Performance By Adding More
Sophisticated Network Attributes
Knowing whether a consumer is a network neigh-bor is one of the simplest indicators of consumer-to-consumer interaction that can be extracted fromthe network data. We now investigate whether aug-menting the model with more sophisticated social-network information can add additional value. Inthis section, we focus on the social network thatcomprises (only) the current customers of this ser-vice (which here we will call “the network”), alongwith the periphery of prospects who have communi-cated with those on the network (the network neigh-bors). We investigate whether we can improve tar-geting by using more sophisticated measures of so-cial relationship with the network of existing cus-tomers.
Table 7 summarizes a set of additional social-networkattributes that we add to the logistic regression. Theterminology we use is borrowed to some degree fromthe fields of social-network analysis and graph the-
ory. Social-network analysis (SNA) involves measur-ing relationships (including information transmis-sion) between people on a network. The nodes inthe network represent people and the links between
Table 6
ROC analysis: AUC values that result from the applicationof logistic regression models
Loyalty trad atts trad atts + NN
1 0.54 0.602 0.64 0.673 0.60 0.64
Note. The logistic regression models were built using allavailable attributes with (trad atts + NN) and without (tradatts) the network-neighbor attribute. We see an increase inAUC across all loyalty groups when the NN attribute is in-cluded in the model.

NETWORK-BASED MARKETING 17
Fig. 5. ( a) Lift curves. Power of the segmentation curves for models built with all attributes with (trad atts) and without(trad atts + NN) network-neighbor attribute. The model with the NN attribute outperforms the model without it. For example,if the firm sent out 50% of the mailing, they would get 70% of the positive responses with the NN compared to receiving only63% of the responses without it. (b) Top-k analysis. Consumers are ranked by the probability scores from the logistic regressionmodel. The model that includes the NN attribute outperforms the model without. For example, for the top 20% of targets, thetake rate is 1.51% without the NN attribute and 1.72% with the NN attribute.
them represent relationships between the nodes. TheSNA measures help quantify intuitive social notions,such as connectedness, influence, centrality, socialimportance and so on. Graph theory helps to un-derstand problems better by representing them asinterconnected nodes, and provides vocabulary andmethods for operating mathematically.
Three of the attributes that we introduce can bederived from a prospect’s local neighborhood (theset of immediate communication partners on thenetwork; recall that these all are current customers).Degree measures the number of direct connections anode has. Within the local neighborhood, we alsocount the number of Transactions, and the lengthof those transactions (Seconds of communication).
The network is made up of many disjoint sub-graphs. Given a graph G = (V, E), where V is a setof vertices (nodes) and E is a set of links betweenthem, the connected components of G are the sets ofvertices such that all vertices in each set are mutu-ally connected (reachable by some path) and no two
vertices in different sets are connected. The size ofthe connected component may be an indicator forawareness of and positive views about the product.If a prospect is linked to a large set of “friends” allof whom have adopted the service, she may be morelikely to adopt herself. Connected component size isthe size of the largest connected component (in thenetwork) to which the prospect is connected.
We also move beyond a prospect’s local neigh-borhood. Observing the local neighborhoods of aprospect’s local neighbors, we can define a measureof social similarity. We define social similarity asthe size of the overlap in the immediate networkneighborhoods of two consumers. Max similarity isthe maximum social similarity between the prospectand any neighbors of the prospect. Finally, the firmalso can observe the prior dynamics of its customers.In particular, the firm can observe which customerscommunicated before and/or after their adoption aswell as the date customers signed up. Using this in-formation, we define influencers as those subscribers
Table 7
Network attribute descriptions
Attribute Description
Degree Number of unique customers communicated with before the mailingTransactions Number of transactions to/from customers before the mailingSeconds of communication Number of seconds communicated with customers before mailingConnected to influencer Is an influencer in prospect’s local neighborhood?Connected component size Size of the connected component prospect belongs toMax similarity Max overlap in local neighborhood with any existing neighboring customer

18 S. HILL, F. PROVOST AND C. VOLINSKY
Table 8
ROC analysis
Attribute(s) AUC
Transactions 0.68Seconds of communication 0.68Degree 0.59Connected to influencer 0.53Connected component size 0.55Similarity 0.55All network 0.71All traditional (loyalty, demographic, geographic) 0.66All traditional + all network 0.71
Note. AUC values result from logistic regression models builton each of the constructed network attributes individually, aswell as in combination. Results are presented for loyalty-level3 customers.
who signed up for the service and, subsequently, wesee one of their network neighbors sign up for theservice. Connected to influencer is an indicator ofwhether the prospect is connected to one of theseinfluencers. We appreciate that we do not actuallyknow if there was true influence.
We use all of the aforementioned attributes andshow AUC values for these predictive models in Ta-ble 8. We find that some of these network attributeshave considerable predictive power individually andhave even more value when combined. This is indi-cated by AUCs of 0.68 for both transactions and sec-onds of communication. We do not find high AUCsindividually for connected component size, similar-ity or connected to influencer. Ultimately, we findthat the logistic regression model built with the net-work attributes results in an AUC of 0.71 comparedto an AUC of 0.66 without the network attributes—using only the traditional marketing attributes de-scribed in previous sections. (Recall that this repre-sents the ability to rank the network neighbors, whoalready have especially high take rates as a group,as we have shown.)
Interestingly, when we combine the traditional at-tributes with the network attributes, there is no ad-ditional gain in AUC, even though many of theseattributes were shown to be significant in the broaderanalysis above. The similarities represented implic-itly or explicitly in the network attributes seem toaccount for all useful information captured by tradi-tional demographics and other marketing attributes.That traditional demographics and other marketingattributes do not add value is not only of theoret-ical interest, but practical as well—for example, in
cases such as this where demographic data must bepurchased.
Our result is further confirmed by the lift andtake rate curves displayed in Figure 6(a) and (b), re-spectively. One can achieve substantially higher takerates using the new network attributes as comparedto using the traditional attributes. For example, wefind that for the top 20% of the targeted list, with-out the network attributes, the take rate is 2.2%;with the network attributes, it is 3.1%. Likewise, atthe top 10% of the list, the take rate with the net-work attributes is 4.4% compared to 2.9% withoutthem.
6. LIMITATIONS
We believe our study to be the first to combinedata on direct customer communication with dataon product adoption to show the effect of network-based marketing statistically. However, there are lim-itations in our study that are important to pointout.
There are several types of missing, incomplete orunreliable data which could influence our results. Wehave records of all of the communication (using thefirm’s service) to and from current customers of theservice. That is not true for all the network-neighborconsumers. As such, we do not have complete infor-mation about the network-neighbor targets (as wellas the non-network-neighbor targets). In addition,some of the attributes we used were collected bypurchasing data from external sources. These dataare known to be at least partially erroneous andoutdated, although it is not well known how muchso. An additional problem is joining data on cus-tomers from external sources to internal communi-cation data, leading to missing data or sometimesjust blatantly incorrect data. Finally, telecommuni-cations firms are not legally able to collect informa-tion regarding the actual content of the communi-cation, so we are not able to determine if the con-sumers in question discussed the product. In thisregard, our data are inferior to some other domainswhere content is visible, such as Internet bulletinboards or product discussion forums.
We expect the network-neighbor effect to manifestitself differently for different types of products. Mostof the studies done to date on viral marketing havefocused on the types of products that people arelikely to talk about, such as a new, high-tech gad-get or a recently released movie. We expect there

NETWORK-BASED MARKETING 19
Fig. 6. (a) Lift curves. Power of segmentation curves for models built with all traditional attributes, with (trad atts + net)and without (trad atts) the network attributes. If the firm sent out 50% of the mailing, they would have received 77% of thepositive responses with the network attributes compared to receiving 63% of the responses without the network attributes. (b)Top-k analysis. The model including the network attributes (trad atts + net) outperforms the model without them (trad atts).For example, for the top 20% of target ranked by score, the take rate is 2.2% without the network attributes and 3.1% withthe network attributes.
to be less buzz for less “sexy” products, like a newdeodorant or a sale on grapes at the supermarket.The study presented in this paper involves a newtelecommunications service, which involves a newtechnology and features that consumers have per-haps never been exposed to before. The firm hopesthe new technology and features are such that theywould encourage word of mouth.
What can we say about other products that mightnot be quite so buzz-worthy? To study this, we com-pared the new service studied here to a roll-out ofanother product by the same firm. This other prod-uct was simply a new pricing plan for an older telecom-munications service. Customers who signed up forthis new plan could stand to save a significant amountof money, depending on their current usage patterns.However, the range and variety of telecommunica-tions pricing plans in the marketplace is so exten-sive and so confusing to the typical consumer thatwe do not believe that this is the type of productthat would generate a lot of discussion between con-sumers. We refer to the two products as the pricing
plan and the new technology. For the pricing plan,we have the same knowledge of the network as we dofor the new technology. For those consumers who be-long to the pricing plan, we know who they commu-nicate with and then we can follow these network-neighbor candidates to see if they ultimately sign upfor the plan. We construct a measure of “networkneighborness” as follows. For a series of consecutivemonths, we gather data for all customers who or-dered the product in that month. We calculate the
percentage of these new customers who were net-work neighbors, that is, those who had previouslycommunicated with a user of the product. This per-centage is a measurement of the proportion of newsales being driven by network effects. By comparingthis percentage across two products, we get insightinto which product stimulates network effects more.
We now look at this value for our two productsover an 8-month period. The time period for thetwo products was chosen so that it would be withinthe first year after the product was broadly avail-able. The results are shown in Figure 7. The twomain points to take away are that the new servicehas a higher percent of purchasers who are networkneighbors and also an increasing one (except for thedip in month 5). In contrast the pricing plan has aflat network-neighbor percentage, never increasingabove 3%.
Interestingly, the dip in the plot for the new ser-vice corresponds exactly to the month of the directmarketing discussed earlier. Before the campaign,we can see that the network-neighbor effect was in-creasing, that more and more of the purchasers ina given month were network neighbors. During themass marketing campaign, we exposed many non-network neighbors to the service and many of themended up purchasing it, temporarily dropping thenetwork-neighbor percentage. After the campaign,we see the network-neighbor percentage starting toincrease again.
This network-neighborness measure should not beconfused with the success of the product, as the pric-ing plan was quite successful from a sales perspec-

20 S. HILL, F. PROVOST AND C. VOLINSKY
Fig. 7. Network-neighborness plot for new service versuspricing plan.
tive, but it does suggest that the pricing plan is aproduct that has less of a network-based spread ofinformation. This difference might be due to the newservice creating more word-of-mouth or perhaps weare seeing the effects of homophily. People who inter-act with each other are more likely to be similar intheir propensity for purchasing the new service thanin their propensity for purchasing a particular pric-ing plan. Again, the effects of word of mouth versushomophily are difficult to discern without knowingthe content of the communication.
7. DISCUSSION
One of the main concerns for any firm is when,how and to whom they should market their prod-ucts. Firms make marketing decisions based on howmuch they know about their customers and poten-tial customers. They may choose to mass marketwhen they do not know much. With more informa-tion, they may market directly based on some ob-served characteristics. We provide strong evidencethat whether and how well a consumer is linked toexisting customers is a powerful characteristic onwhich to base direct marketing decisions. Our re-sults indicate that a firm can benefit from the useof social networks to predict the likelihood of pur-chasing. Taking the network data into account im-proves significantly and substantially on both thefirm’s own marketing “best practices” and our bestefforts to collect and model with traditional data.
The sort of directed network-based marketing thatwe study here has applicability beyond traditionaltelecommunciations companies. For example, eBayrecently purchased Internet-telephony upstart Skype
for $2.6 billion; they now also will have large-scale,explicit data on who talks to whom. With gmail,Google’s e-mail service, Google now has access toexplicit networks of consumer interrelationships andalready is using gmail for marketing; directed network-based marketing might be a next step. Various systemshave emerged recently that provide explicit link-ages between acquaintances (e.g., MySpace, Friend-ster, Facebook), which could be fruitful fields fornetwork-based marketing. As more consumers cre-ate interlinked blogs, another data source arises. Moregenerally, these results suggest that such linkage datapotentially could be a sort of data considered for ac-quisition by many types of firms, as purchase datanow are being collected routinely by many types ofretail firms through loyalty cards. Even academicdepartments could benefit from such data; for ex-ample, the enrollment in specialized classes couldbe bolstered by “marketing” to those linked to ex-isting students. Such links exist (e.g., via e-mail).It remains to design tactics for using them that areacceptable to all.
It is tempting to argue that we have shown thatcustomers discuss the product and that discussionhelps to improve take rates. However, word of mouthis not the only possible explanation for our result. Asdiscussed in detail above, it may be that the networkis a powerful source of information on consumerhomophily, which is in accord with social theories(Blau, 1977; McPherson, Smith-Lovin and Cook, 2001).We have tried to control for homophily by using apropensity-matched sample to produce our logisticregression model. However, it may well be that di-rect communications between people is a better in-dicator of deep similarity than any demographic orgeographic attributes. Either cause, homophily orword of mouth, is interesting both theoretically andpractically.
ACKNOWLEDGMENTS
We would like to thank DeDe Paul and DeepakAgarwal of AT&T, as well as Chris Dellarocas ofthe University of Maryland, for useful discussionsand helpful suggestions. We would also like to thankthree anonymous reviewers who offered insightfulcomments on previous drafts.
REFERENCES
Adomavicius, G. and Tuzhilin, A. (2005). Toward the nextgeneration of recommender systems: A survey of the state-of-the-art and possible extensions. IEEE Trans. Knowledgeand Data Engineering 17 734–749.

NETWORK-BASED MARKETING 21
Agarwal, D. and Pregibon, D. (2004). Enhancing commu-
nities of interest using Bayesian stochastic blockmodels.
In Proc. Fourth SIAM International Conference on Data
Mining. SIAM, Philadelphia.
Bass, F. M. (1969). A new product growth for model con-
sumer durables. Management Sci. 15 215–227.
Blau, P. M. (1977). Inequality and Heterogeneity : A Primi-
tive Theory of Social Structure. Free Press, New York.
Bowman, D. and Narayandas, D. (2001). Managing
customer-initiated contacts with manufacturers: The im-
pact on share of category requirements and word-of-mouth
behavior. J. Marketing Research 38 281–297.
Brin, S. and Page, L. (1998). The anatomy of a large-scale
hypertextual Web search engine. Computer Networks and
ISDN Systems 30 107–117.
Case, A. C. (1991). Spatial patterns in household demand.
Econometrica 59 953–965.
Chan, E. and Stolfo, S. (1998). Toward scalable learning
with non-uniform class and cost distributions: A case study
in credit card fraud detection. In Proc. Fourth Interna-
tional Conference on Knowledge Discovery and Data Min-
ing 164–168. AAAI Press, Menlo Park, CA.
Clearwater, S. H. and Stern, E. G. (1991). A rule-
learning program in high-energy physics event classifica-
tion. Computer Physics Communications 67 159–182.
Dellarocas, C. (2003). The digitization of word of mouth:
Promise and challenges of online feedback mechanisms.
Management Sci. 49 1407–1424.
Domingos, P. and Richardson, M. (2001). Mining the net-
work value of customers. In Proc. Seventh ACM SIGKDD
International Conference on Knowledge Discovery and
Data Mining 57–66. ACM Press, New York.
DuMouchel, W., Volinsky, C., Johnson, T., Cortes,
C. and Pregibon, D. (1999). Squashing flat files flatter.
In Proc. Fifth ACM SIGKDD International Conference on
Knowledge Discovery and Data Mining 6–15. ACM Press,
New York.
Fichman, R. G. (2004). Going beyond the dominant
paradigm for information technology innovation research:
Emerging concepts and methods. J. Assoc. Information
Systems 5 314–355.
Fildes, R. (2003). Review of New-Product Diffusion Models,
by V. Mahajan, E. Muller and Y. Wind, eds. Internat. J.
Forecasting 19 327–328.
Frenzen, J. and Nakamoto, K. (1993). Structure, cooper-
ation, and the flow of market information. J. Consumer
Research 20 360–375.
Getoor, L. (2005). Tutorial on statistical relational learning.
Inductive Logic Programming, 15th International Confer-
ence. Lecture Notes in Comput. Sci. 3625 415. Springer,
Berlin.
Getoor, L., Friedman, N., Koller, D. and Pfeffer, A.
(2001). Learning probabilistic relational models. In Rela-
tional Data Mining (S. Dzeroski and N. Lavrac, eds.) 307–
338. Springer, Berlin.
Getoor, L., Friedman, N., Koller, D. and Taskar, B.
(2003). Learning probabilistic models of link structure. J.
Mach. Learn. Res. 3 679–707. MR1983942
Getoor, L. and Sahami, M. (1999). Using probabilistic rela-tion models for collaborative filtering. In Proc. WEBKDD1999, San Diego, CA.
Gladwell, M. (1997). The coolhunt. The New YorkerMarch 17, 78–88.
Gladwell, M. (2002). The Tipping Point : How Little ThingsCan Make a Big Difference. Back Bay Books, Boston.
Hightower, R., Brady, M. K. and Baker, T. L. (2002).Investigating the role of the physical environment in hedo-nic service consumption: An exploratory study of sportingevents. J. Business Research 55 697–707.
Hoff, P. D., Raftery, A. E. and Handcock, M. S. (2002).Latent space approaches to social network analysis. J.Amer. Statist. Assoc. 97 1090–1098. MR1951262
Huang, Z., Chung, W. and Chen, H. C. (2004). A graphmodel for E-commerce recommender systems. J. Amer.Soc. Information Science and Technology 55 259–274.
Japkowicz, N. and Stephen, S. (2002). The class imbalanceproblem: A systematic study. Intelligent Data Analysis 6429–449.
Joshi, M., Kumar, V. and Agarwal, R. (2001). Evaluatingboosting algorithms to classify rare classes: Comparisonand improvements. In Proc. IEEE International Confer-ence on Data Mining 257–264. IEEE Press, Piscataway,NJ.
Kautz, H., Selman, B. and Shah, M. (1997). Referralweb: Combining social networks and collaborative filter-ing. Comm. ACM 40(3) 63–65.
Kleinberg, J. (1999). Authoritative sources in a hyperlinkedenvironment. J. ACM 46 604–632. MR1747649
Kumar, V. and Krishnan, T. V. (2002). Multinational dif-fusion models: An alternative framework. Marketing Sci.21 318–330.
Liben-Nowell, D. and Kleinberg, J. (2003). The link pre-diction problem for social networks. In Proc. Twelfth Inter-national Conference on Information and Knowledge Man-agement 556–559. ACM Press, New York.
Linden, G., Smith, B. and York, J. (2003). Ama-zon.com recommendations—Item-to-item collaborative fil-tering. IEEE Internet Computing 7 76–80.
Macskassy, S. and Provost, F. (2004). Classification innetworked data: A toolkit and a univariate case study.CeDER Working Paper #CeDER-04-08, Stern School ofBusiness, New York University.
Mahajan, V., Muller, E. and Kerin, R. (1984). Introduc-tion strategy for new products with positive and negativeword-of-mouth. Management Sci. 30 1389–1404.
McCullagh, P. and Nelder, J. A. (1983). Generalized Lin-ear Models. Chapman and Hall, New York. MR0727836
McPherson, M., Smith-Lovin, L. and Cook, J. (2001).Birds of a feather: Homophily in social networks. AnnualReview of Sociology 27 415–444.
Mease, D., Wyner, A. and Buja, A. (2006). Boosted clas-sification trees and class probability/quantile estimation.J. Mach. Learn. Res. To appear.
Montgomery, A. L. (2001). Applying quantitative market-ing techniques to the Internet. Interfaces 31(2) 90–108.
Newton, J. and Greiner, R. (2004). Hierarchical proba-bilistic relational models for collaborative filtering. In Proc.

22 S. HILL, F. PROVOST AND C. VOLINSKY
Workshop on Statistical Relational Learning, 21st Interna-tional Conference on Machine Learning. Banff, Alberta,Canada.
Paumgarten, N. (2003). No. 1 fan dept. acknowledged. TheNew Yorker May 5.
Perlich, C. and Provost, F. (2006). Distribution-based ag-gregation for relational learning with identifier attributes.Machine Learning 62 65–105.
Poole, D. (2004). Estimating the size of the telephone uni-verse. A Bayesian Mark-recapture approach. In Proc. TenthACM SIGKDD International Conference on KnowledgeDiscovery and Data Mining 659–664. ACM Press, NewYork.
Richardson, M. and Domingos, P. (2002). Miningknowledge-sharing sites for viral marketing. In Proc. EighthACM SIGKDD International Conference on KnowledgeDiscovery and Data Mining 61–70. ACM Press, New York.
Rogers, E. M. (2003). Diffusion of Innovations, 5th ed. FreePress, New York.
Rosenbaum, P. R. and Rubin, D. B. (1984). Reducingbias in observational studies using subclassification on the
propensity score. J. Amer. Statist. Assoc. 79 516–524.Tout, K., Evans, D. J. and Yakan, A. (2005). Collabora-
tive filtering: Special case in predictive analysis. Internat.J. Computer Mathematics 82 1–11. MR2159280
Ueda, T. (1990). A study of a competitive Bass model whichtakes into account competition among firms. J. OperationsResearch Society of Japan 33 319–334.
Van den Bulte, C. and Lilien, G. L. (2001). Medical inno-vation revisited: Social contagion versus marketing effort.American J. Sociology 106 1409–1435.
Walker, R. (2004). The hidden (in plain sight) persuaders.The New York Times Magazine Dec. 5, 69–75.
Weiss, G. and Provost, F. (2003). Learning when train-ing data are costly: The effect of class distribution on treeinduction. J. Artificial Intelligence Research 19 315–354.
Weiss, G. M. (2004). Mining with rarity: A unifying frame-work. ACM SIGKDD Explorations Newsletter 6 7–19.
Yang, S. and Allenby, G. M. (2003). Modeling interde-pendent consumer preferences. J. Marketing Research 40282–294.