NEATH PORT TALBOT COUNTY BOROUGH COUNCILCOUN-161209-REP-CDG-U.doc.pdf · 1 coun-161209-rep-cdg-u...
31
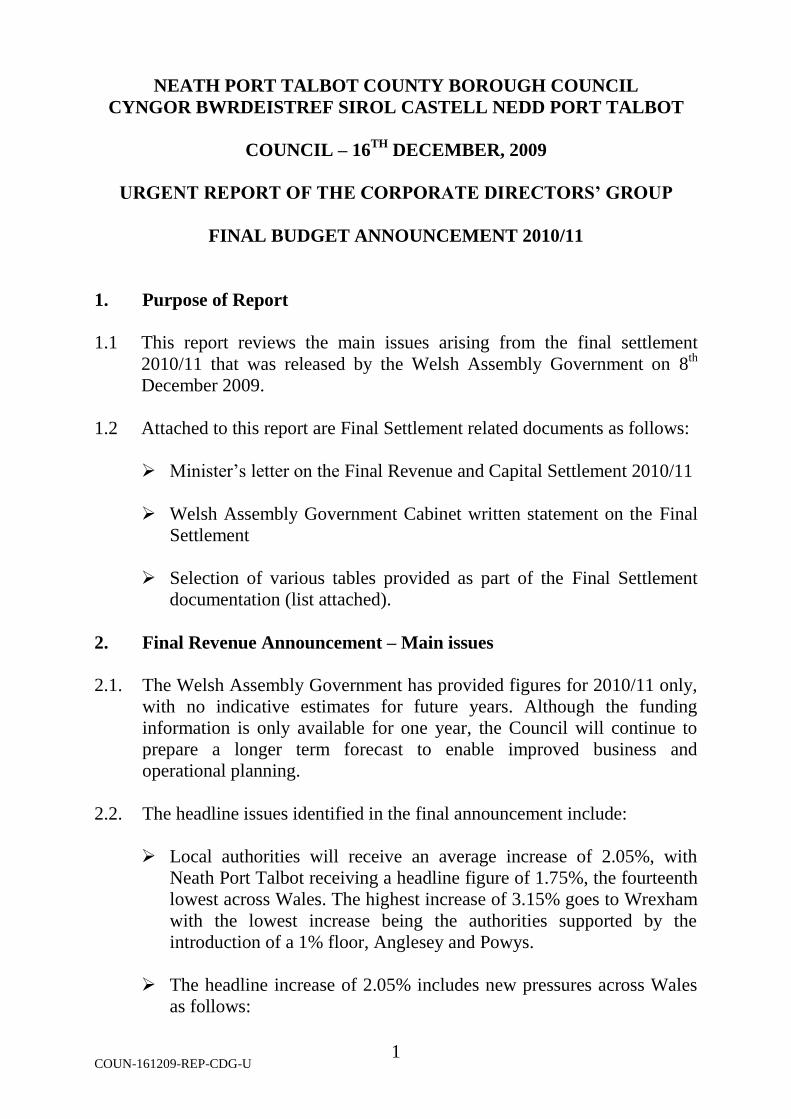
COUN-161209-REP-CDG-U 1 NEATH PORT TALBOT COUNTY BOROUGH COUNCIL CYNGOR BWRDEISTREF SIROL CASTELL NEDD PORT TALBOT COUNCIL – 16 TH DECEMBER, 2009 URGENT REPORT OF THE CORPORATE DIRECTORS’ GROUP FINAL BUDGET ANNOUNCEMENT 2010/11 1. Purpose of Report 1.1 This report reviews the main issues arising from the final settlement 2010/11 that was released by the Welsh Assembly Government on 8 th December 2009. 1.2 Attached to this report are Final Settlement related documents as follows: Minister’s letter on the Final Revenue and Capital Settlement 2010/11 Welsh Assembly Government Cabinet written statement on the Final Settlement Selection of various tables provided as part of the Final Settlement documentation (list attached). 2. Final Revenue Announcement – Main issues 2.1. The Welsh Assembly Government has provided figures for 2010/11 only, with no indicative estimates for future years. Although the funding information is only available for one year, the Council will continue to prepare a longer term forecast to enable improved business and operational planning. 2.2. The headline issues identified in the final announcement include: Local authorities will receive an average increase of 2.05%, with Neath Port Talbot receiving a headline figure of 1.75%, the fourteenth lowest across Wales. The highest increase of 3.15% goes to Wrexham with the lowest increase being the authorities supported by the introduction of a 1% floor, Anglesey and Powys. The headline increase of 2.05% includes new pressures across Wales as follows:
Transcript of NEATH PORT TALBOT COUNTY BOROUGH COUNCILCOUN-161209-REP-CDG-U.doc.pdf · 1 coun-161209-rep-cdg-u...
COUN-161209-REP-CDG-U 1
NEATH PORT TALBOT COUNTY BOROUGH COUNCIL
CYNGOR BWRDEISTREF SIROL CASTELL NEDD PORT TALBOT
COUNCIL – 16TH
DECEMBER, 2009
URGENT REPORT OF THE CORPORATE DIRECTORS’ GROUP
FINAL BUDGET ANNOUNCEMENT 2010/11
1. Purpose of Report
1.1 This report reviews the main issues arising from the final settlement
2010/11 that was released by the Welsh Assembly Government on 8th
December 2009.
1.2 Attached to this report are Final Settlement related documents as follows:
Minister’s letter on the Final Revenue and Capital Settlement 2010/11
Welsh Assembly Government Cabinet written statement on the Final
Settlement
Selection of various tables provided as part of the Final Settlement
documentation (list attached).
2. Final Revenue Announcement – Main issues
2.1. The Welsh Assembly Government has provided figures for 2010/11 only,
with no indicative estimates for future years. Although the funding
information is only available for one year, the Council will continue to
prepare a longer term forecast to enable improved business and
operational planning.
2.2. The headline issues identified in the final announcement include:
Local authorities will receive an average increase of 2.05%, with
Neath Port Talbot receiving a headline figure of 1.75%, the fourteenth
lowest across Wales. The highest increase of 3.15% goes to Wrexham
with the lowest increase being the authorities supported by the
introduction of a 1% floor, Anglesey and Powys.
The headline increase of 2.05% includes new pressures across Wales
as follows:
COUN-161209-REP-CDG-U 2
All Wales
£m
Neath Port
Talbot
£m
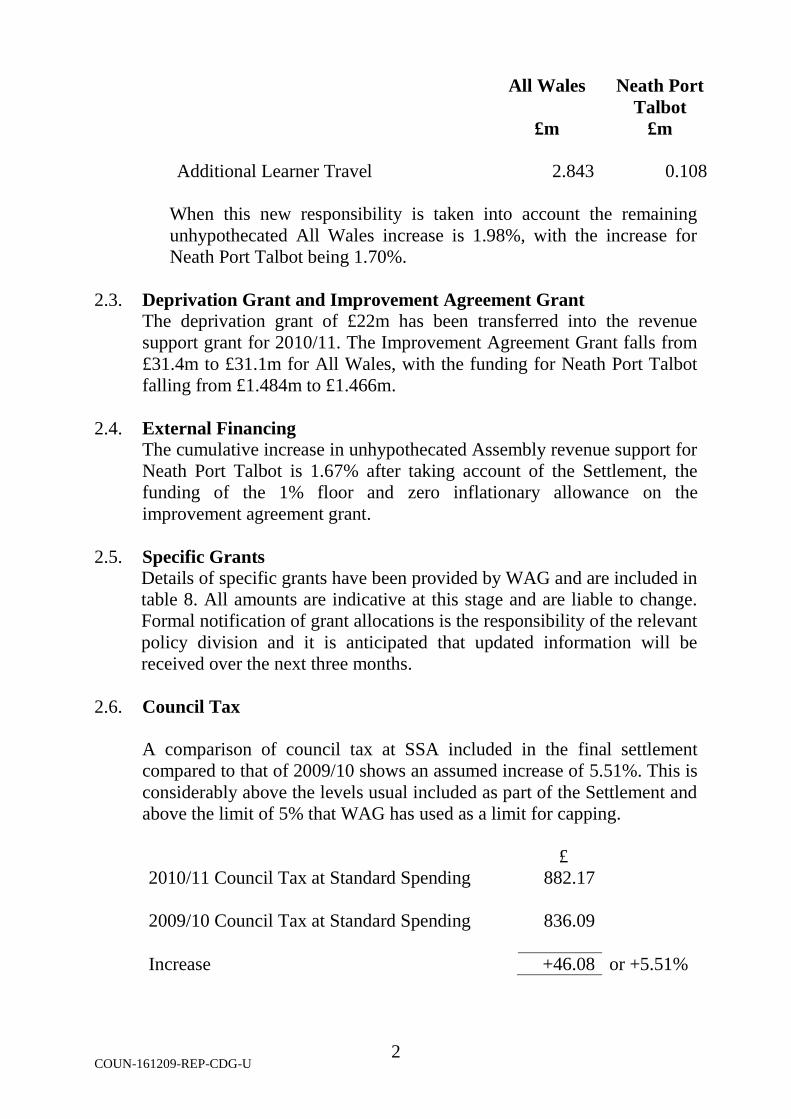
Additional Learner Travel 2.843 0.108
When this new responsibility is taken into account the remaining
unhypothecated All Wales increase is 1.98%, with the increase for
Neath Port Talbot being 1.70%.
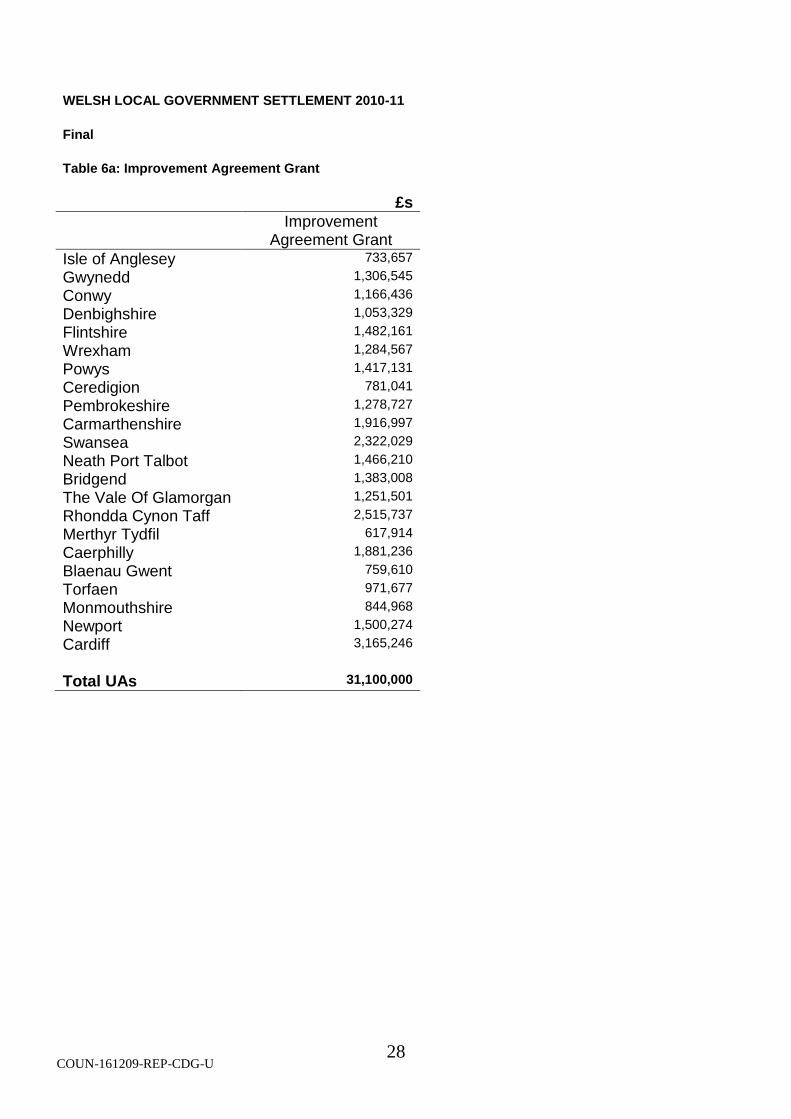
2.3. Deprivation Grant and Improvement Agreement Grant
The deprivation grant of £22m has been transferred into the revenue
support grant for 2010/11. The Improvement Agreement Grant falls from
£31.4m to £31.1m for All Wales, with the funding for Neath Port Talbot
falling from £1.484m to £1.466m.
2.4. External Financing
The cumulative increase in unhypothecated Assembly revenue support for
Neath Port Talbot is 1.67% after taking account of the Settlement, the
funding of the 1% floor and zero inflationary allowance on the
improvement agreement grant.
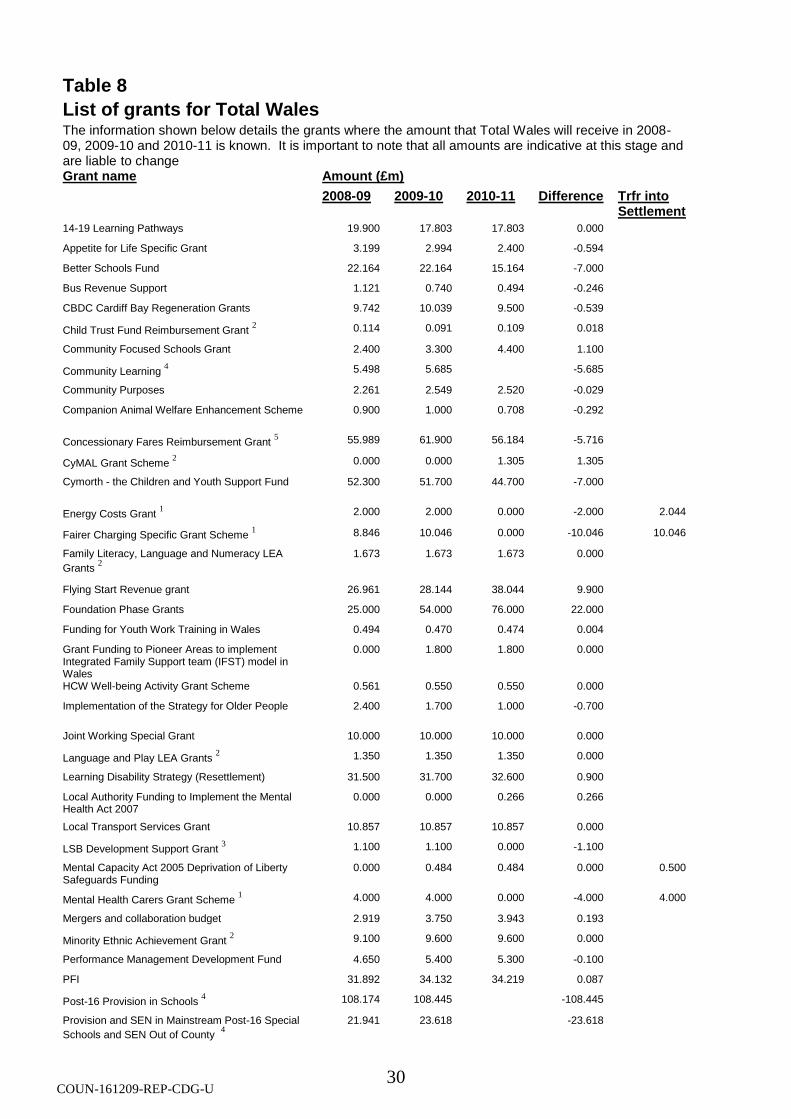
2.5. Specific Grants
Details of specific grants have been provided by WAG and are included in
table 8. All amounts are indicative at this stage and are liable to change.
Formal notification of grant allocations is the responsibility of the relevant
policy division and it is anticipated that updated information will be
received over the next three months.
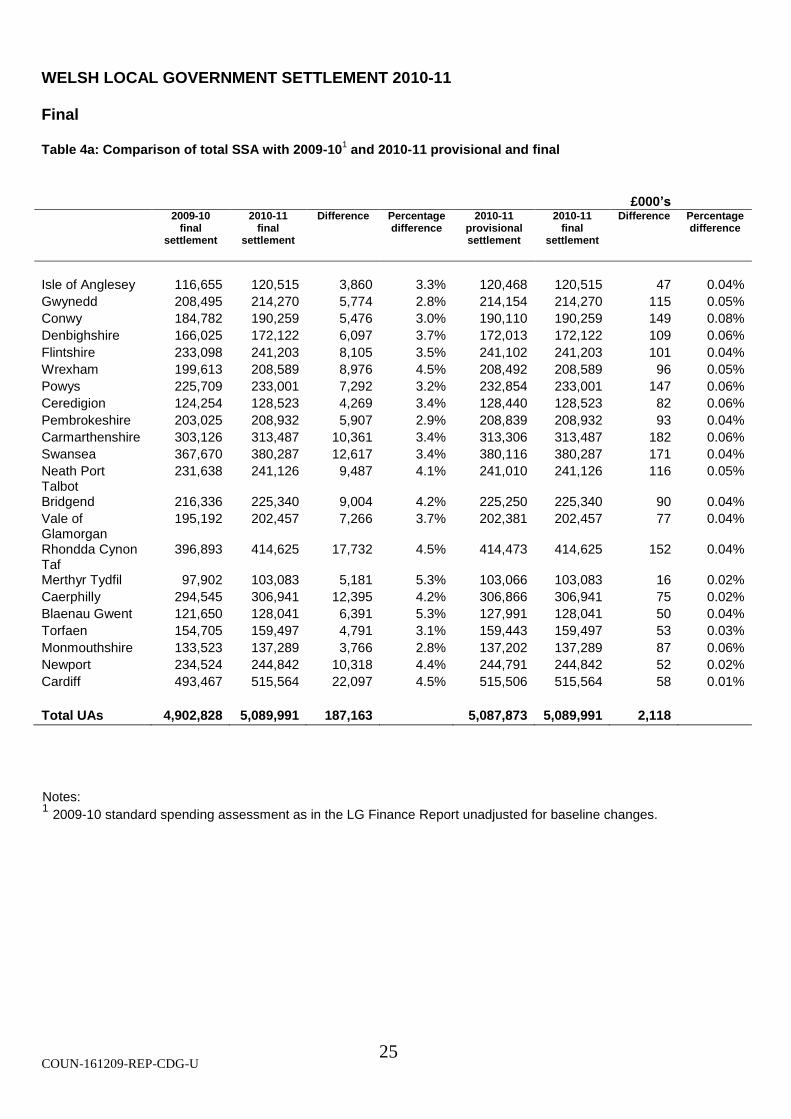
2.6. Council Tax
A comparison of council tax at SSA included in the final settlement
compared to that of 2009/10 shows an assumed increase of 5.51%. This is
considerably above the levels usual included as part of the Settlement and
above the limit of 5% that WAG has used as a limit for capping.
£
2010/11 Council Tax at Standard Spending 882.17
2009/10 Council Tax at Standard Spending 836.09
Increase +46.08 or +5.51%
COUN-161209-REP-CDG-U 3
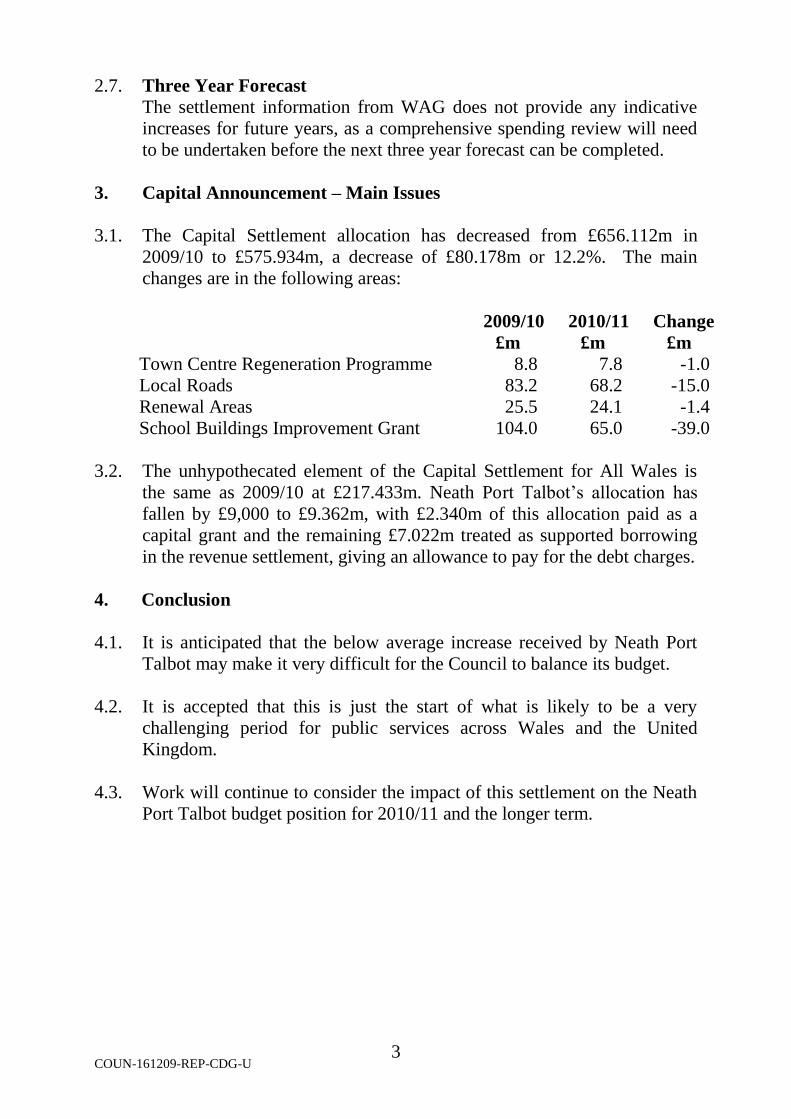
2.7. Three Year Forecast
The settlement information from WAG does not provide any indicative
increases for future years, as a comprehensive spending review will need
to be undertaken before the next three year forecast can be completed.
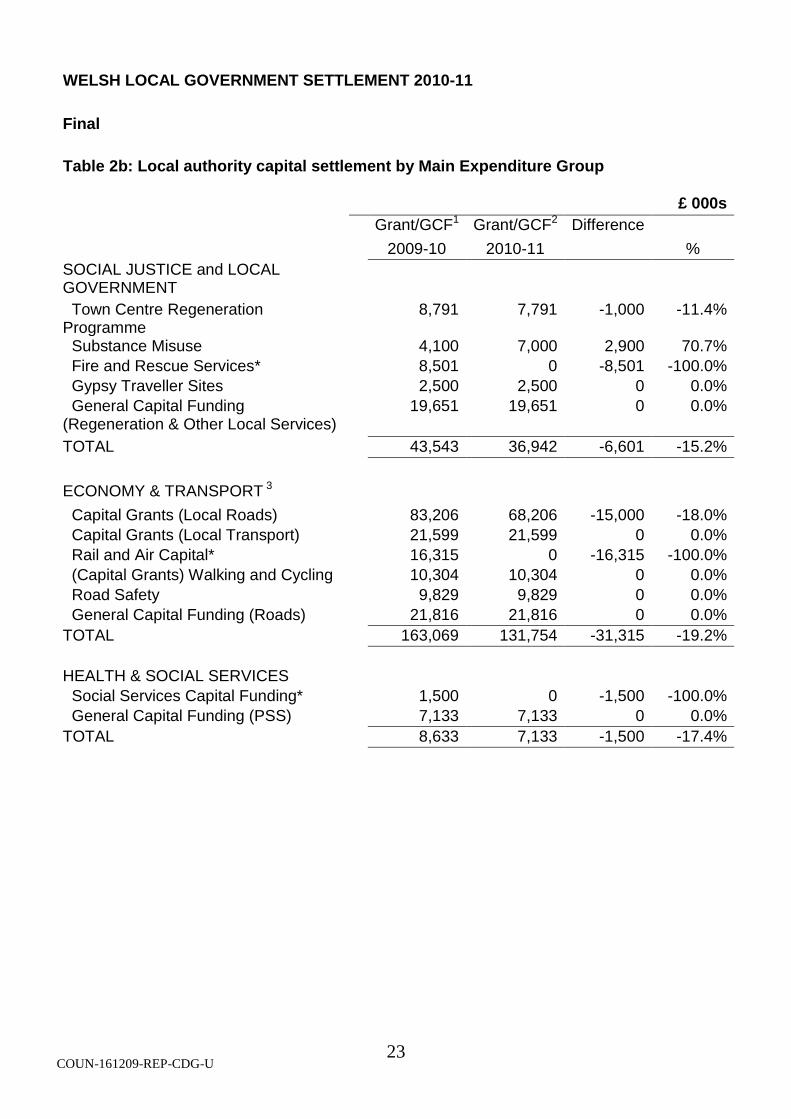
3. Capital Announcement – Main Issues
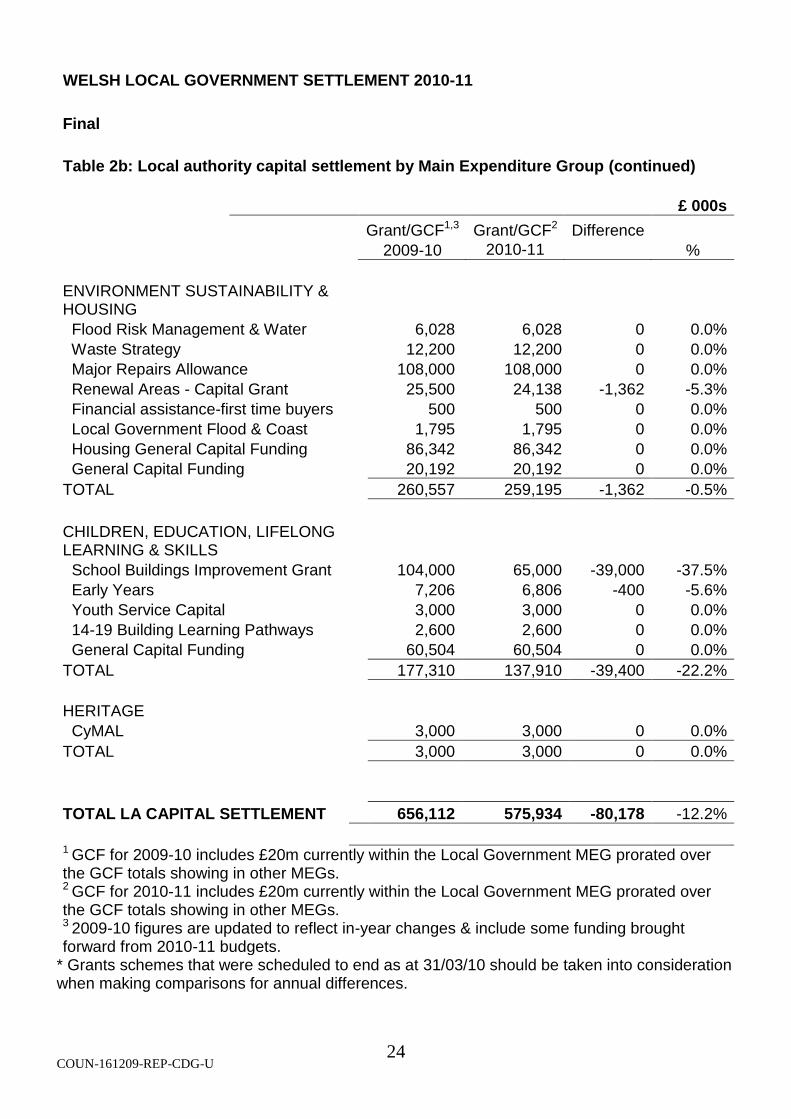
3.1. The Capital Settlement allocation has decreased from £656.112m in
2009/10 to £575.934m, a decrease of £80.178m or 12.2%. The main
changes are in the following areas:
2009/10
£m
2010/11
£m
Change
£m
Town Centre Regeneration Programme 8.8 7.8 -1.0
Local Roads 83.2 68.2 -15.0
Renewal Areas 25.5 24.1 -1.4
School Buildings Improvement Grant 104.0 65.0 -39.0
3.2. The unhypothecated element of the Capital Settlement for All Wales is
the same as 2009/10 at £217.433m. Neath Port Talbot’s allocation has
fallen by £9,000 to £9.362m, with £2.340m of this allocation paid as a
capital grant and the remaining £7.022m treated as supported borrowing
in the revenue settlement, giving an allowance to pay for the debt charges.
4. Conclusion
4.1. It is anticipated that the below average increase received by Neath Port
Talbot may make it very difficult for the Council to balance its budget.
4.2. It is accepted that this is just the start of what is likely to be a very
challenging period for public services across Wales and the United
Kingdom.
4.3. Work will continue to consider the impact of this settlement on the Neath
Port Talbot budget position for 2010/11 and the longer term.
COUN-161209-REP-CDG-U 4
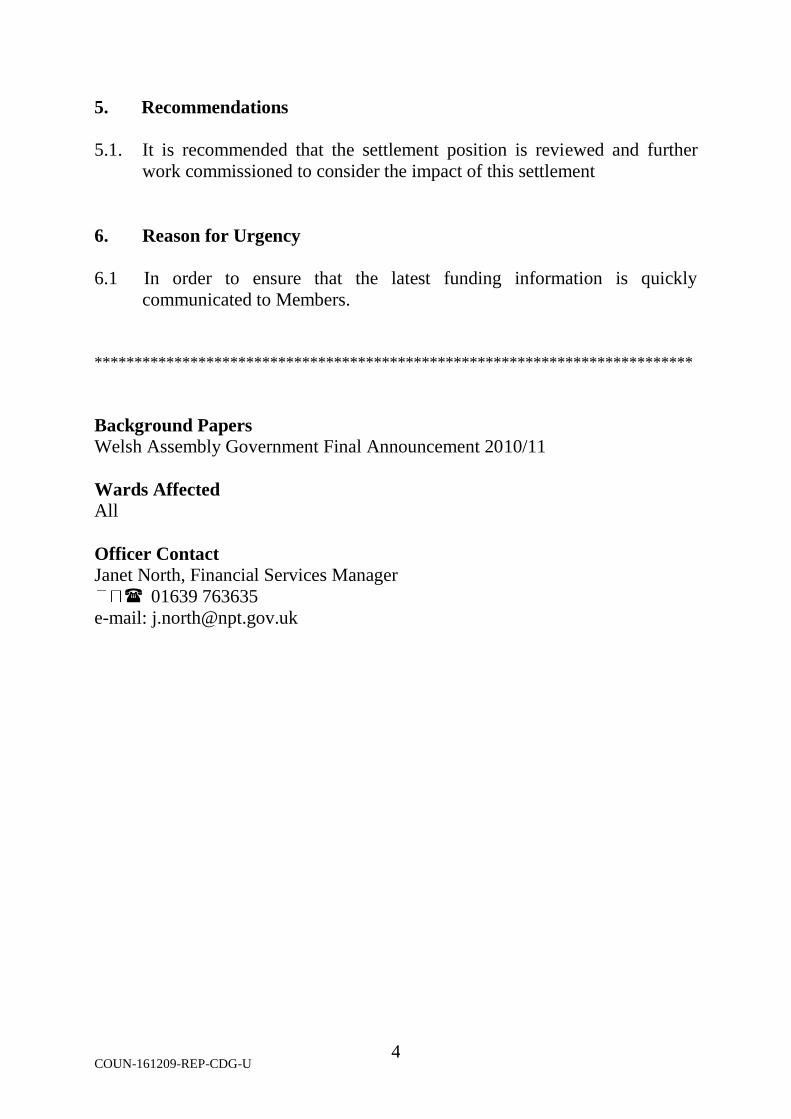
5. Recommendations
5.1. It is recommended that the settlement position is reviewed and further
work commissioned to consider the impact of this settlement
6. Reason for Urgency
6.1 In order to ensure that the latest funding information is quickly
communicated to Members.
***************************************************************************
Background Papers Welsh Assembly Government Final Announcement 2010/11
Wards Affected
All
Officer Contact Janet North, Financial Services Manager
01639 763635
e-mail: [email protected]
COUN-161209-REP-CDG-U 5
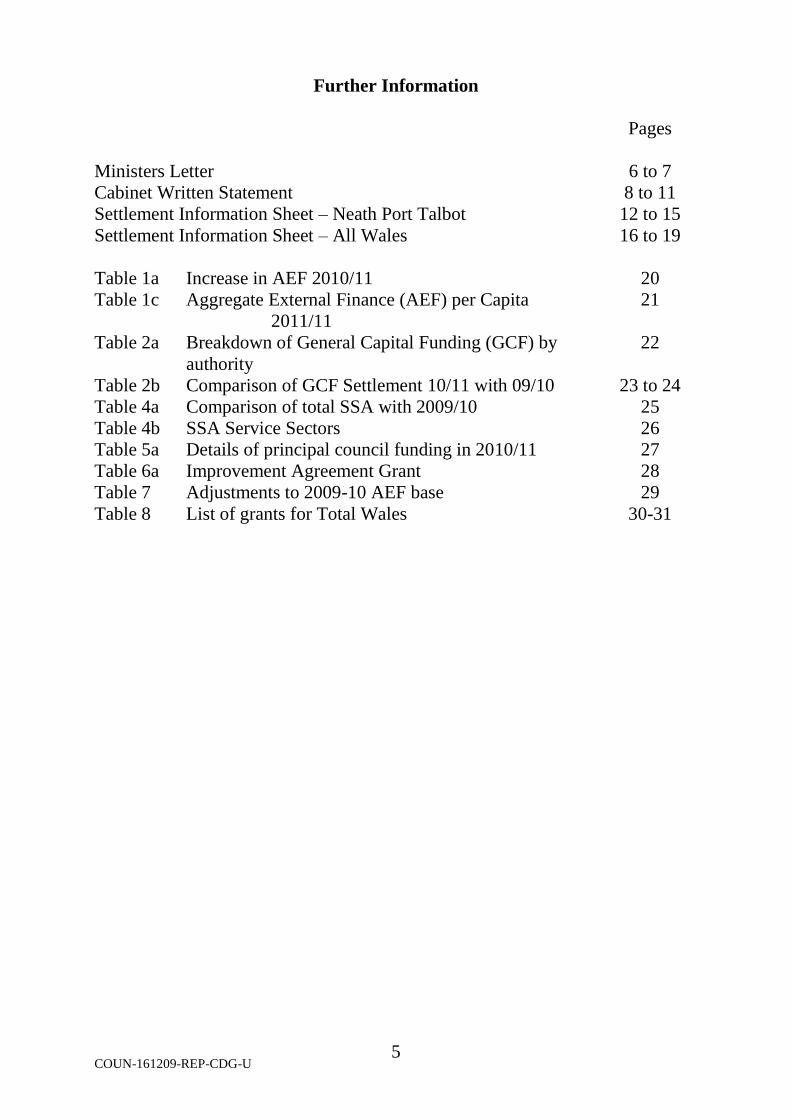
Further Information
Pages
Ministers Letter 6 to 7
Cabinet Written Statement 8 to 11
Settlement Information Sheet – Neath Port Talbot 12 to 15
Settlement Information Sheet – All Wales 16 to 19
Table 1a Increase in AEF 2010/11 20
Table 1c Aggregate External Finance (AEF) per Capita
2011/11
21
Table 2a Breakdown of General Capital Funding (GCF) by
authority
22
Table 2b Comparison of GCF Settlement 10/11 with 09/10 23 to 24
Table 4a Comparison of total SSA with 2009/10 25
Table 4b SSA Service Sectors 26
Table 5a Details of principal council funding in 2010/11 27
Table 6a Improvement Agreement Grant 28
Table 7 Adjustments to 2009-10 AEF base 29
Table 8 List of grants for Total Wales 30-31
COUN-161209-REP-CDG-U 6
COUN-161209-REP-CDG-U 7
COUN-161209-REP-CDG-U 8
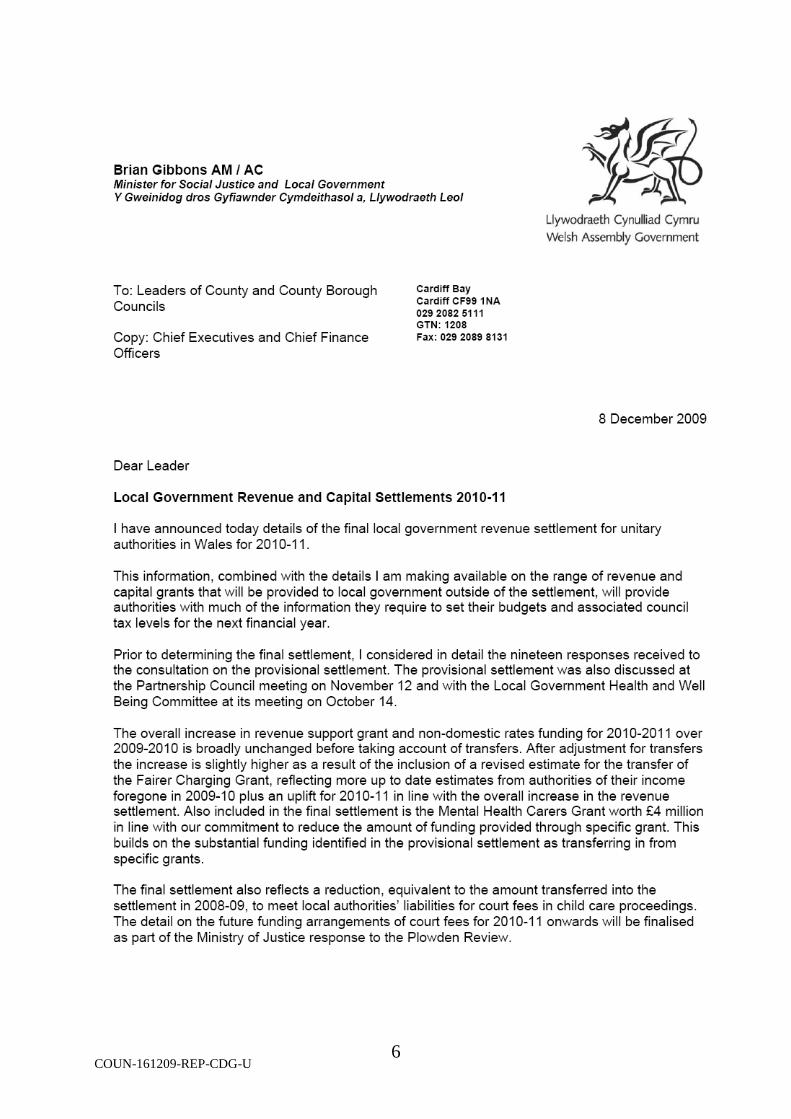
CABINET WRITTEN STATEMENT TITLE: FINAL LOCAL GOVERNMENT REVENUE AND CAPITAL
SETTLEMENTS 2010-11 DATE: 8 December 2009 BY: BRIAN GIBBONS, MINISTER FOR SOCIAL JUSTICE AND LOCAL
GOVERNMENT Today I am announcing the details of the final revenue and capital settlements
for the 22 unitary authorities in Wales for 2010-11.
The Overall Settlement
In preparing the final settlement I have given careful consideration to the
responses I received through the consultation on the provisional settlement. I
discussed the settlement with Welsh local government at the Partnership
Council meeting on 12 November and with the Local Government Health and
Well Being Committee at its meeting on October 14.
Next year, before accounting for transfers, local authorities in Wales will receive an average increase of 2.1% on the previous year’s revenue settlement. This is broadly unchanged from the provisional settlement announcement I made on 13 October.
COUN-161209-REP-CDG-U 9
The final settlement confirms the inclusion of a floor mechanism to ensure that
all authorities receive a minimum increase of 1 per cent.
Included in the final settlement are a further two specific grants in line with our
commitment to reduce the amount of hypothecated funding provided outside
the revenue support grant. This builds on the substantial funding identified in
the provisional settlement as transferring in from specific grants. These are
the Mental Health Carers Grant (£4 million) and the Fairer Charging Grant
(£10.3 million).
The final settlement also reflects a reduction, equivalent to the amount
transferred into the settlement in 2008-09, to meet local authorities’ liabilities
for court fees in child care proceedings. The detail on the future funding
arrangements of court fees for 2010-11 onwards will be finalised as part of the
Ministry of Justice response to the Plowden Review.
Specific Revenue Grants
I am also providing local authorities with details of the specific grants they can
expect to receive in 2010-11 although details of a small number of post 16
education grants will not be available until early in the new year. Revenue
Support Grant and Specific Grants taken together will provide authorities with
a comprehensive picture of the funding the Assembly Government will provide
in 2010-11, to allow them to budget effectively. In addition to the £4 billion
authorities will receive through the settlement, they will also receive over £600
million in specific grants. Included within this are major grants for areas such
as concessionary fares; waste management; Foundation Stage and
Supporting People.
Distribution between Authorities
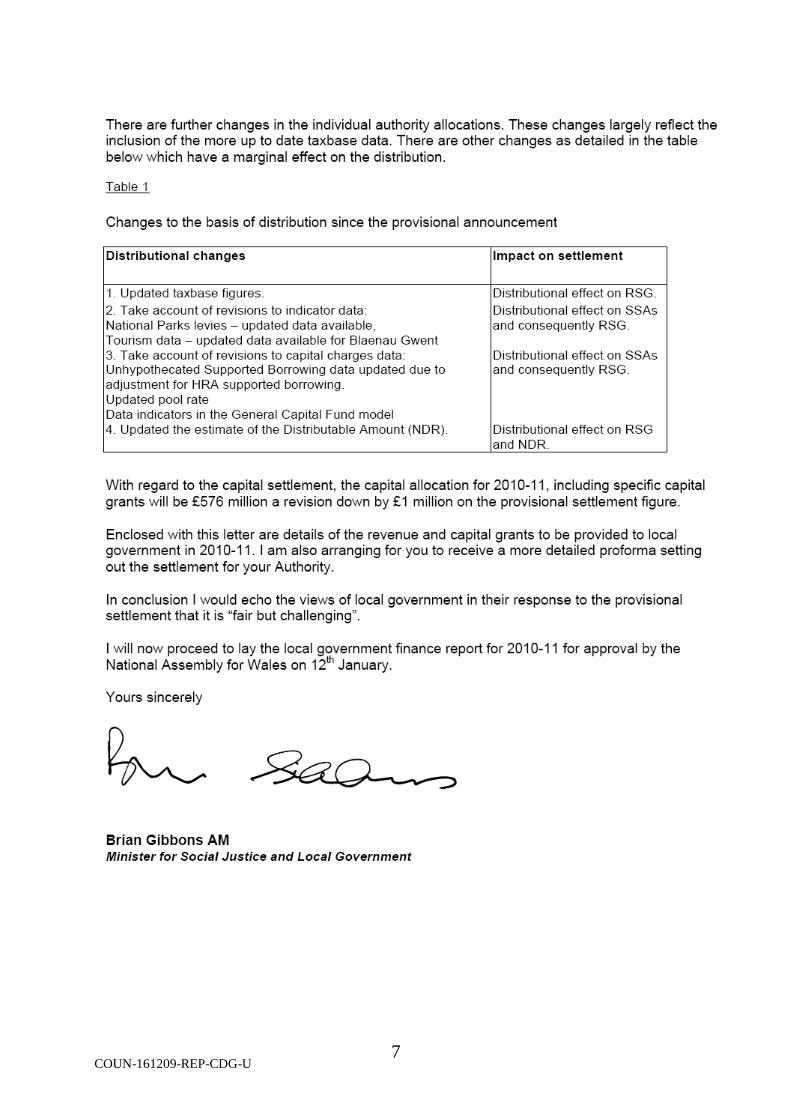
Table 1 attached details the distribution of the revenue settlement amongst the twenty two authorities. The introduction of the most up-to date taxbase figures provided by authorities have resulted in some minor changes to the
COUN-161209-REP-CDG-U 10
allocations for individual authorities compared with the provisional settlement.
Also reflected in the final settlement allocations are some minor data updates
and revisions.
Capital Settlement
With regard to the capital settlement, the capital allocation for 2010-11,
including specific capital grants will be £576 million a revision down by £1
million on the provisional settlement figure.
The General Capital Fund totals some £217 million. This is unhypothecated
capital funding of which £54 million is paid as capital grant, the remainder,
some £162 million, is provided as support for borrowing.
Further detailed tables will be made available on the Welsh Assembly
Government’s internet site.
The overall package, as Local Government has acknowledged on the
announcement of the provisional settlement, is fair but challenging in all the
circumstances. It is essential that both the Assembly Government and Local
Government now work together to seize the opportunity to establish better,
more cost effective and innovative ways of delivering high quality services to
the people of Wales in the far tougher public expenditure conditions that lie
ahead. Our signing of the “New Understanding” on 12 November provides an
excellent foundation for making progress. .
The motion to the National Assembly for Wales to approve the local
government finance report for 2010-11 is due to be debated on the 12th
January.
COUN-161209-REP-CDG-U 11
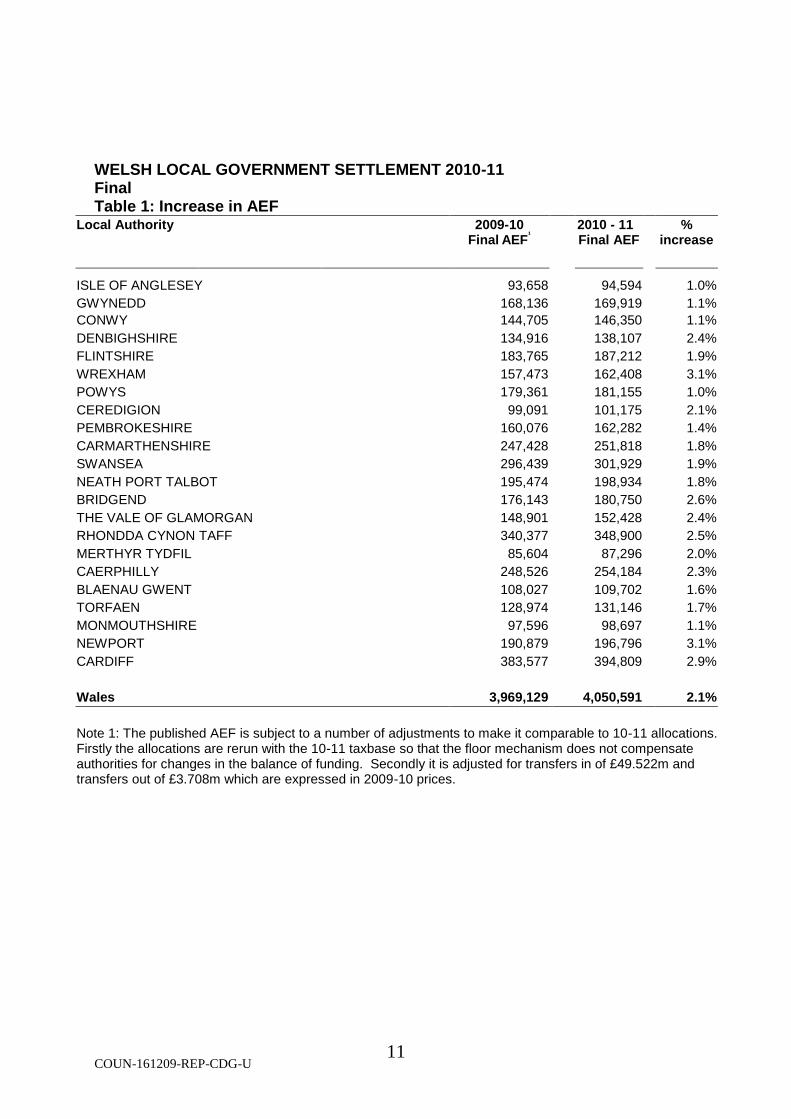
WELSH LOCAL GOVERNMENT SETTLEMENT 2010-11 Final Table 1: Increase in AEF
Local Authority 2009-10 Final
AEF
¹
2010 - 11 Final AEF
% increase
ISLE OF ANGLESEY 93,658 94,594 1.0%
GWYNEDD 168,136 169,919 1.1%
CONWY 144,705 146,350 1.1%
DENBIGHSHIRE 134,916 138,107 2.4%
FLINTSHIRE 183,765 187,212 1.9%
WREXHAM 157,473 162,408 3.1%
POWYS 179,361 181,155 1.0%
CEREDIGION 99,091 101,175 2.1%
PEMBROKESHIRE 160,076 162,282 1.4%
CARMARTHENSHIRE 247,428 251,818 1.8%
SWANSEA 296,439 301,929 1.9%
NEATH PORT TALBOT 195,474 198,934 1.8%
BRIDGEND 176,143 180,750 2.6%
THE VALE OF GLAMORGAN 148,901 152,428 2.4%
RHONDDA CYNON TAFF 340,377 348,900 2.5%
MERTHYR TYDFIL 85,604 87,296 2.0%
CAERPHILLY 248,526 254,184 2.3%
BLAENAU GWENT 108,027 109,702 1.6%
TORFAEN 128,974 131,146 1.7%
MONMOUTHSHIRE 97,596 98,697 1.1%
NEWPORT 190,879 196,796 3.1%
CARDIFF 383,577 394,809 2.9%
Wales 3,969,129 4,050,591 2.1%
Note 1: The published AEF is subject to a number of adjustments to make it comparable to 10-11 allocations. Firstly the allocations are rerun with the 10-11 taxbase so that the floor mechanism does not compensate authorities for changes in the balance of funding. Secondly it is adjusted for transfers in of £49.522m and transfers out of £3.708m which are expressed in 2009-10 prices.
COUN-161209-REP-CDG-U 12
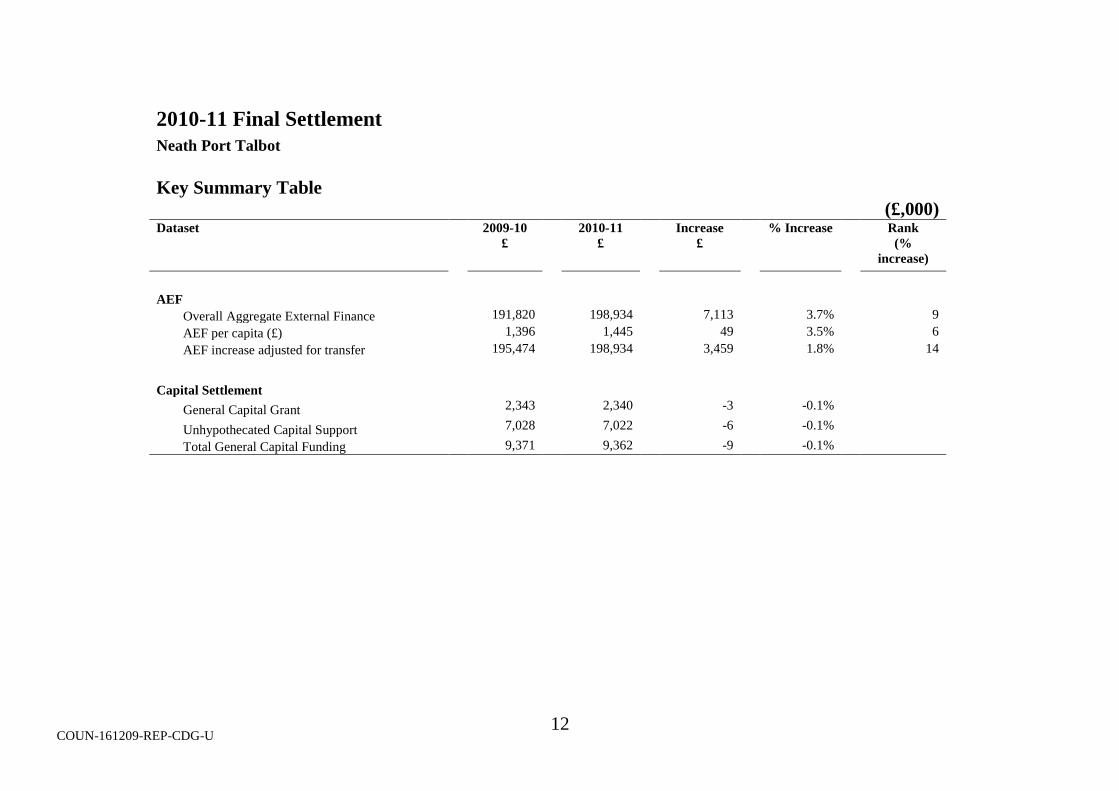
2010-11 Final Settlement
Neath Port Talbot
Key Summary Table
534 (£,000) Dataset 2009-10
£
2010-11
£
Increase
£
% Increase Rank
(%
increase)
AEF
Overall Aggregate External Finance 191,820 198,934 7,113 3.7% 9
AEF per capita (£) 1,396 1,445 49 3.5% 6
AEF increase adjusted for transfer 195,474 198,934 3,459 1.8% 14
Capital Settlement
General Capital Grant 2,343 2,340 -3 -0.1%
Unhypothecated Capital Support 7,028 7,022 -6 -0.1%
Total General Capital Funding 9,371 9,362 -9 -0.1%
COUN-161209-REP-CDG-U 13
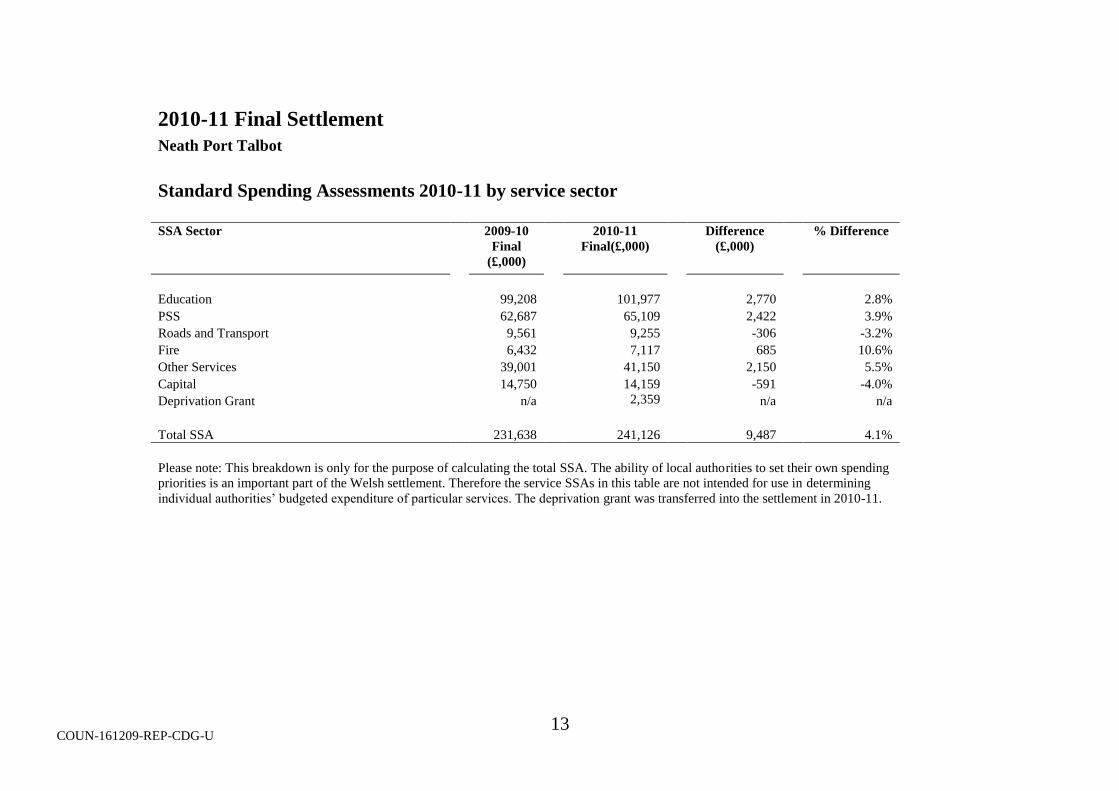
2010-11 Final Settlement
Neath Port Talbot
Standard Spending Assessments 2010-11 by service sector
SSA Sector 2009-10
Final
(£,000)
2010-11
Final(£,000)
Difference
(£,000)
% Difference
Education 99,208 101,977 2,770 2.8%
PSS 62,687 65,109 2,422 3.9%
Roads and Transport 9,561 9,255 -306 -3.2%
Fire 6,432 7,117 685 10.6%
Other Services 39,001 41,150 2,150 5.5%
Capital 14,750 14,159 -591 -4.0%
Deprivation Grant n/a 2,359 n/a n/a
Total SSA 231,638 241,126 9,487 4.1%
Please note: This breakdown is only for the purpose of calculating the total SSA. The ability of local authorities to set their own spending
priorities is an important part of the Welsh settlement. Therefore the service SSAs in this table are not intended for use in determining
individual authorities’ budgeted expenditure of particular services. The deprivation grant was transferred into the settlement in 2010-11.
COUN-161209-REP-CDG-U 14
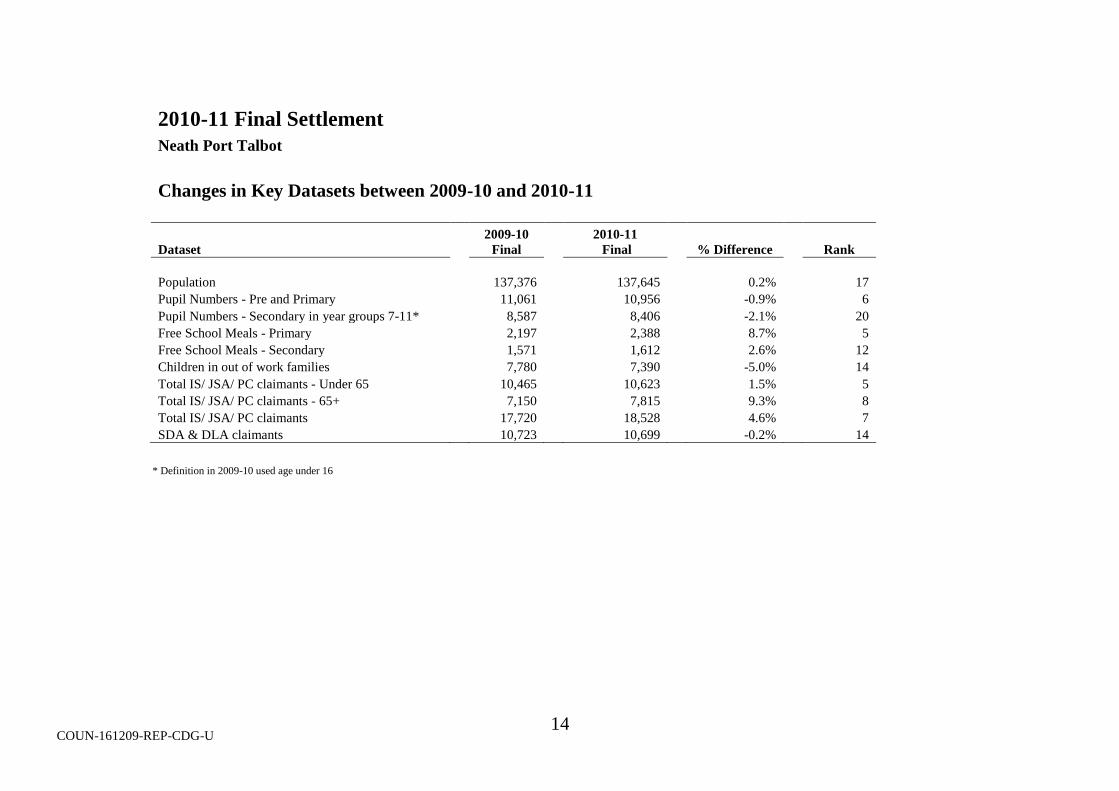
2010-11 Final Settlement
Neath Port Talbot
Changes in Key Datasets between 2009-10 and 2010-11
Dataset
2009-10
Final
2010-11
Final % Difference Rank
Population 137,376 137,645 0.2% 17
Pupil Numbers - Pre and Primary 11,061 10,956 -0.9% 6
Pupil Numbers - Secondary in year groups 7-11* 8,587 8,406 -2.1% 20
Free School Meals - Primary 2,197 2,388 8.7% 5
Free School Meals - Secondary 1,571 1,612 2.6% 12
Children in out of work families 7,780 7,390 -5.0% 14
Total IS/ JSA/ PC claimants - Under 65 10,465 10,623 1.5% 5
Total IS/ JSA/ PC claimants - 65+ 7,150 7,815 9.3% 8
Total IS/ JSA/ PC claimants 17,720 18,528 4.6% 7
SDA & DLA claimants 10,723 10,699 -0.2% 14
* Definition in 2009-10 used age under 16
COUN-161209-REP-CDG-U 15
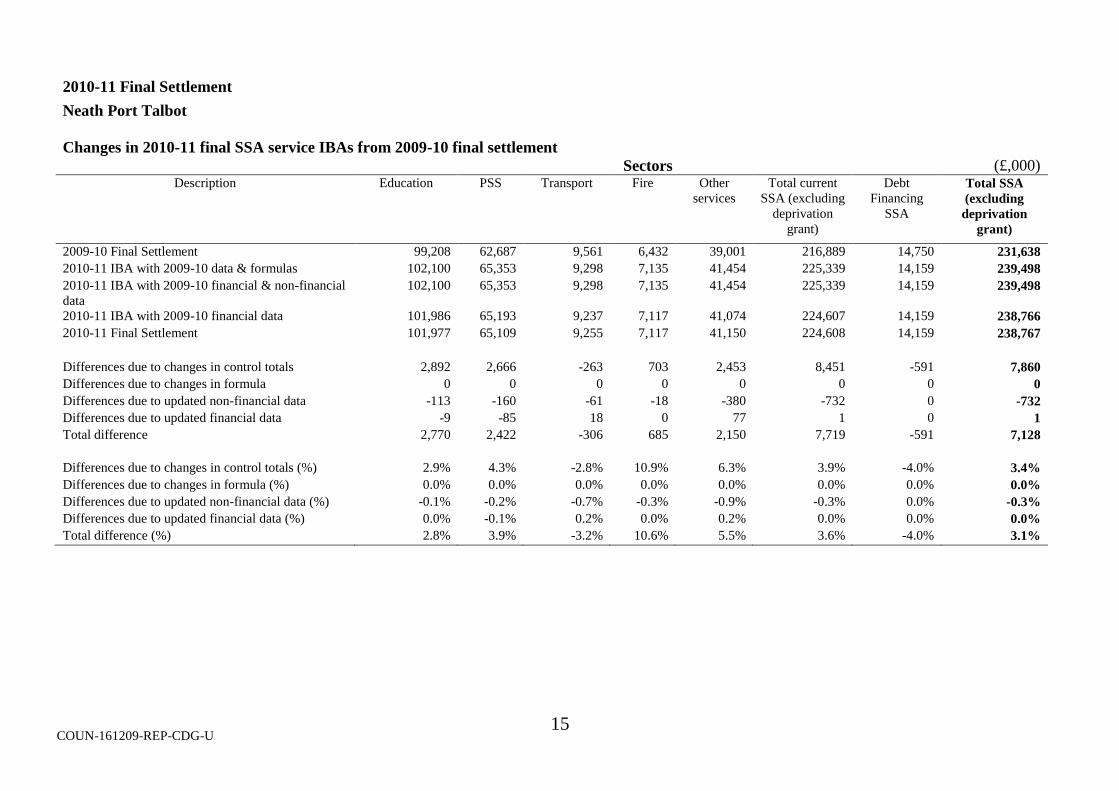
2010-11 Final Settlement
Neath Port Talbot
Changes in 2010-11 final SSA service IBAs from 2009-10 final settlement
Sectors (£,000) Description Education PSS Transport Fire Other
services
Total current
SSA (excluding
deprivation
grant)
Debt
Financing
SSA
Total SSA
(excluding
deprivation
grant)
2009-10 Final Settlement 99,208 62,687 9,561 6,432 39,001 216,889 14,750 231,638
2010-11 IBA with 2009-10 data & formulas 102,100 65,353 9,298 7,135 41,454 225,339 14,159 239,498
2010-11 IBA with 2009-10 financial & non-financial
data
102,100 65,353 9,298 7,135 41,454 225,339 14,159 239,498
2010-11 IBA with 2009-10 financial data 101,986 65,193 9,237 7,117 41,074 224,607 14,159 238,766
2010-11 Final Settlement 101,977 65,109 9,255 7,117 41,150 224,608 14,159 238,767
Differences due to changes in control totals 2,892 2,666 -263 703 2,453 8,451 -591 7,860
Differences due to changes in formula 0 0 0 0 0 0 0 0
Differences due to updated non-financial data -113 -160 -61 -18 -380 -732 0 -732
Differences due to updated financial data -9 -85 18 0 77 1 0 1
Total difference 2,770 2,422 -306 685 2,150 7,719 -591 7,128
Differences due to changes in control totals (%) 2.9% 4.3% -2.8% 10.9% 6.3% 3.9% -4.0% 3.4%
Differences due to changes in formula (%) 0.0% 0.0% 0.0% 0.0% 0.0% 0.0% 0.0% 0.0%
Differences due to updated non-financial data (%) -0.1% -0.2% -0.7% -0.3% -0.9% -0.3% 0.0% -0.3%
Differences due to updated financial data (%) 0.0% -0.1% 0.2% 0.0% 0.2% 0.0% 0.0% 0.0%
Total difference (%) 2.8% 3.9% -3.2% 10.6% 5.5% 3.6% -4.0% 3.1%
COUN-161209-REP-CDG-U 16
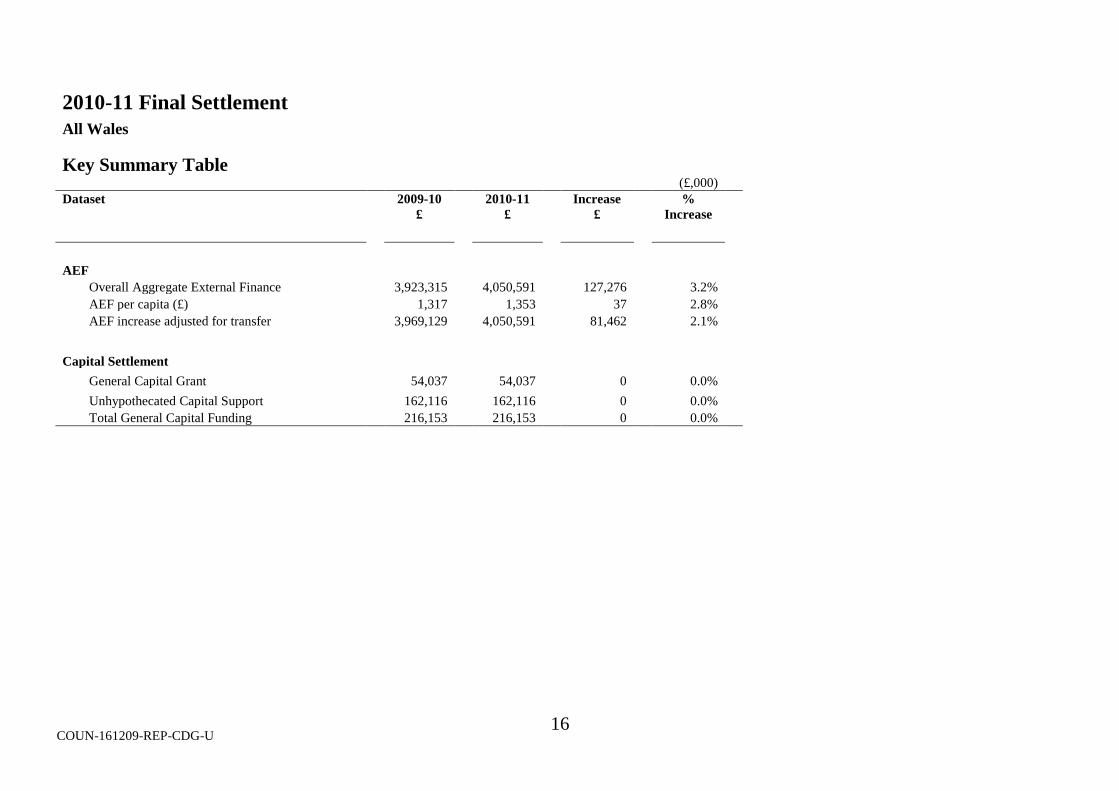
2010-11 Final Settlement
All Wales
Key Summary Table
596 (£,000)
Dataset 2009-10
£
2010-11
£
Increase
£
%
Increase
AEF
Overall Aggregate External Finance 3,923,315 4,050,591 127,276 3.2%
AEF per capita (£) 1,317 1,353 37 2.8%
AEF increase adjusted for transfer 3,969,129 4,050,591 81,462 2.1%
Capital Settlement
General Capital Grant 54,037 54,037 0 0.0%
Unhypothecated Capital Support 162,116 162,116 0 0.0%
Total General Capital Funding 216,153 216,153 0 0.0%
COUN-161209-REP-CDG-U 17
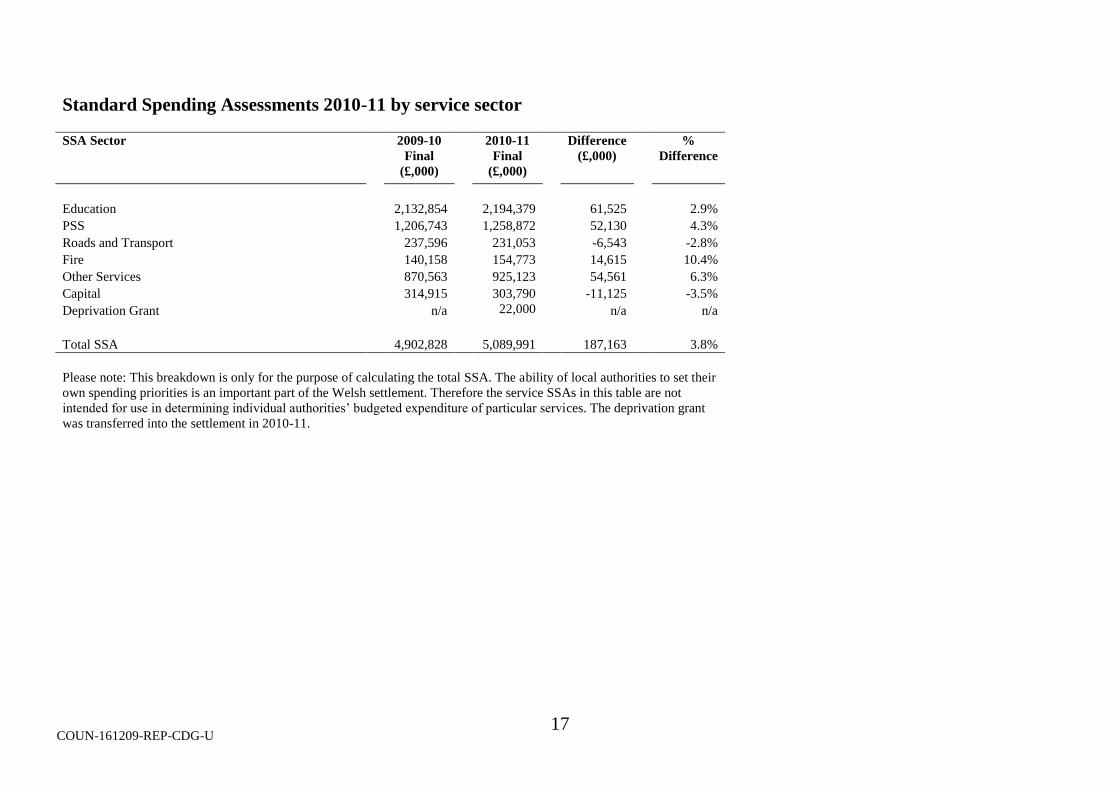
Standard Spending Assessments 2010-11 by service sector
SSA Sector 2009-10
Final
(£,000)
2010-11
Final
(£,000)
Difference
(£,000)
%
Difference
Education 2,132,854 2,194,379 61,525 2.9%
PSS 1,206,743 1,258,872 52,130 4.3%
Roads and Transport 237,596 231,053 -6,543 -2.8%
Fire 140,158 154,773 14,615 10.4%
Other Services 870,563 925,123 54,561 6.3%
Capital 314,915 303,790 -11,125 -3.5%
Deprivation Grant n/a 22,000 n/a n/a
Total SSA 4,902,828 5,089,991 187,163 3.8%
Please note: This breakdown is only for the purpose of calculating the total SSA. The ability of local authorities to set their
own spending priorities is an important part of the Welsh settlement. Therefore the service SSAs in this table are not
intended for use in determining individual authorities’ budgeted expenditure of particular services. The deprivation grant
was transferred into the settlement in 2010-11.
COUN-161209-REP-CDG-U 18
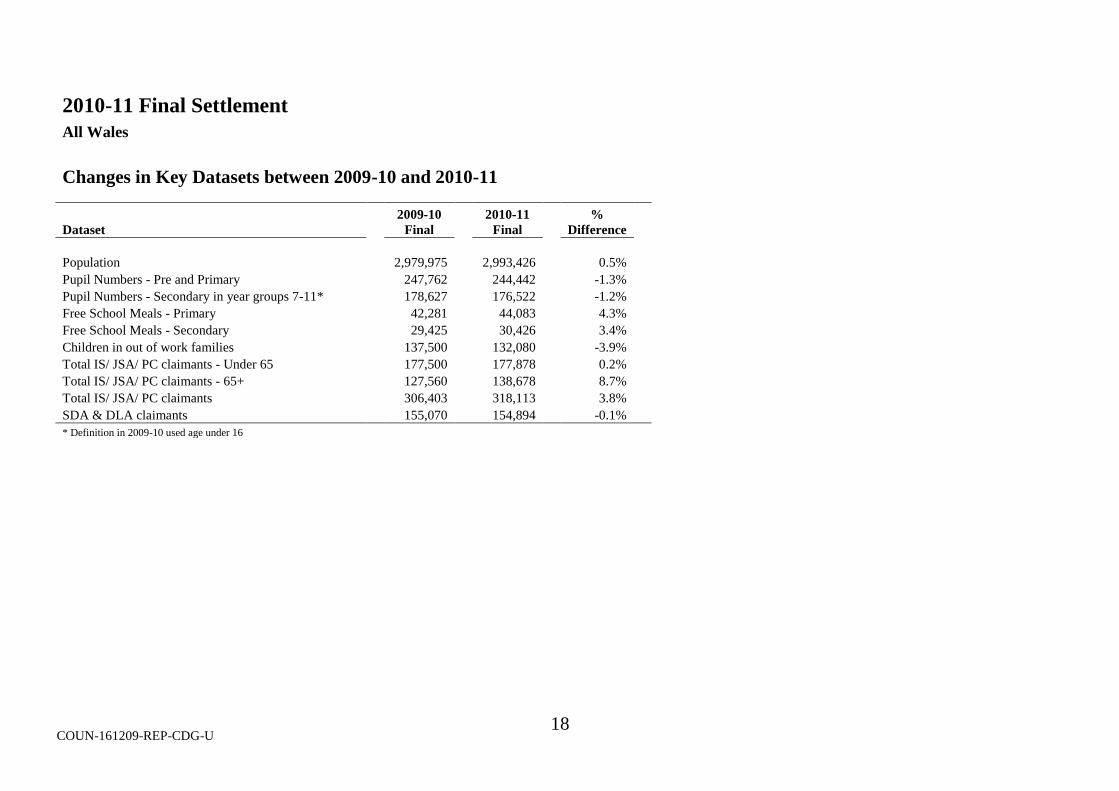
2010-11 Final Settlement
All Wales
Changes in Key Datasets between 2009-10 and 2010-11
Dataset
2009-10
Final
2010-11
Final
%
Difference
Population 2,979,975 2,993,426 0.5%
Pupil Numbers - Pre and Primary 247,762 244,442 -1.3%
Pupil Numbers - Secondary in year groups 7-11* 178,627 176,522 -1.2%
Free School Meals - Primary 42,281 44,083 4.3%
Free School Meals - Secondary 29,425 30,426 3.4%
Children in out of work families 137,500 132,080 -3.9%
Total IS/ JSA/ PC claimants - Under 65 177,500 177,878 0.2%
Total IS/ JSA/ PC claimants - 65+ 127,560 138,678 8.7%
Total IS/ JSA/ PC claimants 306,403 318,113 3.8%
SDA & DLA claimants 155,070 154,894 -0.1%
* Definition in 2009-10 used age under 16
COUN-161209-REP-CDG-U 19
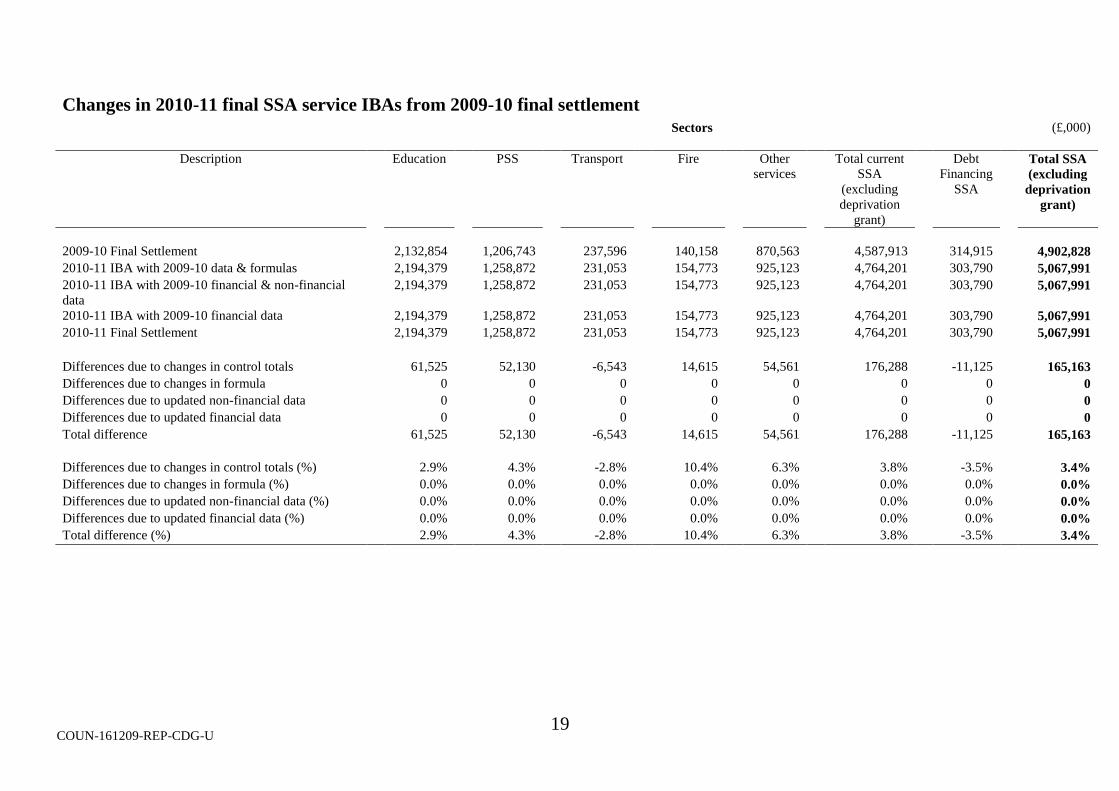
Changes in 2010-11 final SSA service IBAs from 2009-10 final settlement
Sectors (£,000)
Description Education PSS Transport Fire Other
services
Total current
SSA
(excluding
deprivation
grant)
Debt
Financing
SSA
Total SSA
(excluding
deprivation
grant)
2009-10 Final Settlement 2,132,854 1,206,743 237,596 140,158 870,563 4,587,913 314,915 4,902,828
2010-11 IBA with 2009-10 data & formulas 2,194,379 1,258,872 231,053 154,773 925,123 4,764,201 303,790 5,067,991
2010-11 IBA with 2009-10 financial & non-financial
data
2,194,379 1,258,872 231,053 154,773 925,123 4,764,201 303,790 5,067,991
2010-11 IBA with 2009-10 financial data 2,194,379 1,258,872 231,053 154,773 925,123 4,764,201 303,790 5,067,991
2010-11 Final Settlement 2,194,379 1,258,872 231,053 154,773 925,123 4,764,201 303,790 5,067,991
Differences due to changes in control totals 61,525 52,130 -6,543 14,615 54,561 176,288 -11,125 165,163
Differences due to changes in formula 0 0 0 0 0 0 0 0
Differences due to updated non-financial data 0 0 0 0 0 0 0 0
Differences due to updated financial data 0 0 0 0 0 0 0 0
Total difference 61,525 52,130 -6,543 14,615 54,561 176,288 -11,125 165,163
Differences due to changes in control totals (%) 2.9% 4.3% -2.8% 10.4% 6.3% 3.8% -3.5% 3.4%
Differences due to changes in formula (%) 0.0% 0.0% 0.0% 0.0% 0.0% 0.0% 0.0% 0.0%
Differences due to updated non-financial data (%) 0.0% 0.0% 0.0% 0.0% 0.0% 0.0% 0.0% 0.0%
Differences due to updated financial data (%) 0.0% 0.0% 0.0% 0.0% 0.0% 0.0% 0.0% 0.0%
Total difference (%) 2.9% 4.3% -2.8% 10.4% 6.3% 3.8% -3.5% 3.4%
COUN-161209-REP-CDG-U 20
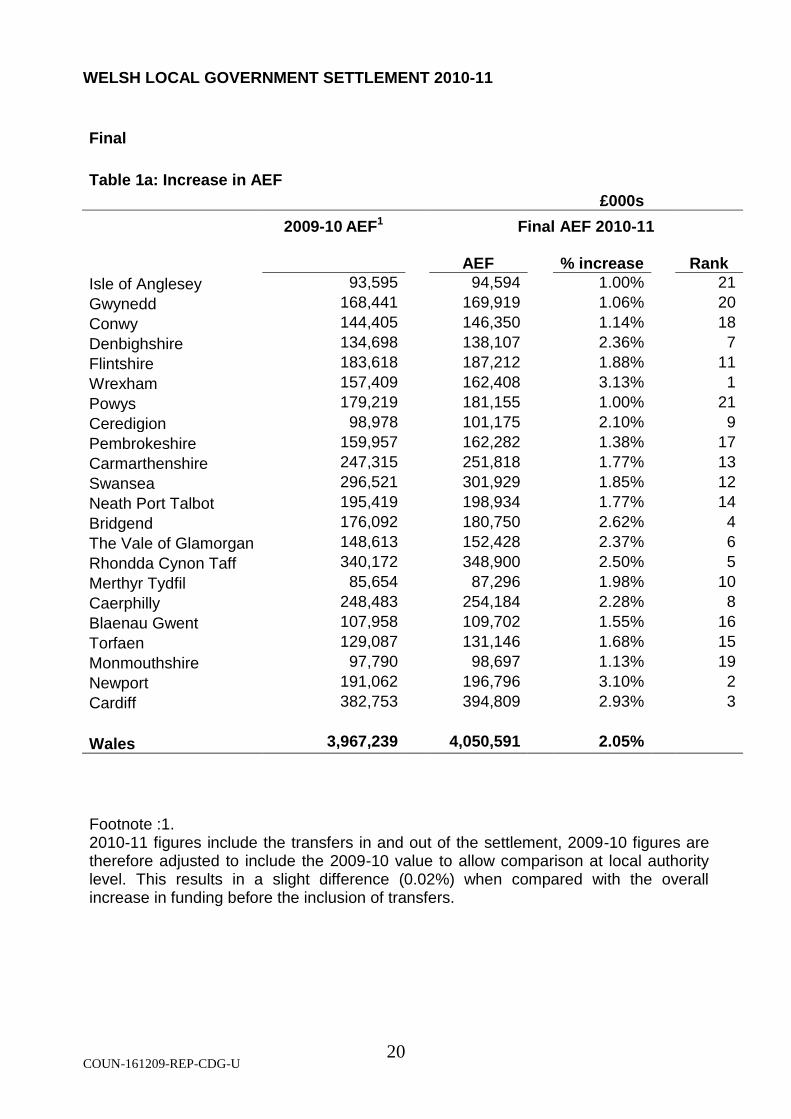
WELSH LOCAL GOVERNMENT SETTLEMENT 2010-11
Final
Table 1a: Increase in AEF
£000s
2009-10 AEF1 Final AEF 2010-11
AEF % increase Rank
Isle of Anglesey 93,595 94,594 1.00% 21
Gwynedd 168,441 169,919 1.06% 20
Conwy 144,405 146,350 1.14% 18
Denbighshire 134,698 138,107 2.36% 7
Flintshire 183,618 187,212 1.88% 11
Wrexham 157,409 162,408 3.13% 1
Powys 179,219 181,155 1.00% 21
Ceredigion 98,978 101,175 2.10% 9
Pembrokeshire 159,957 162,282 1.38% 17
Carmarthenshire 247,315 251,818 1.77% 13
Swansea 296,521 301,929 1.85% 12
Neath Port Talbot 195,419 198,934 1.77% 14
Bridgend 176,092 180,750 2.62% 4
The Vale of Glamorgan 148,613 152,428 2.37% 6
Rhondda Cynon Taff 340,172 348,900 2.50% 5
Merthyr Tydfil 85,654 87,296 1.98% 10
Caerphilly 248,483 254,184 2.28% 8
Blaenau Gwent 107,958 109,702 1.55% 16
Torfaen 129,087 131,146 1.68% 15
Monmouthshire 97,790 98,697 1.13% 19
Newport 191,062 196,796 3.10% 2
Cardiff 382,753 394,809 2.93% 3
Wales 3,967,239 4,050,591 2.05%
Footnote :1. 2010-11 figures include the transfers in and out of the settlement, 2009-10 figures are therefore adjusted to include the 2009-10 value to allow comparison at local authority level. This results in a slight difference (0.02%) when compared with the overall increase in funding before the inclusion of transfers.
COUN-161209-REP-CDG-U 21
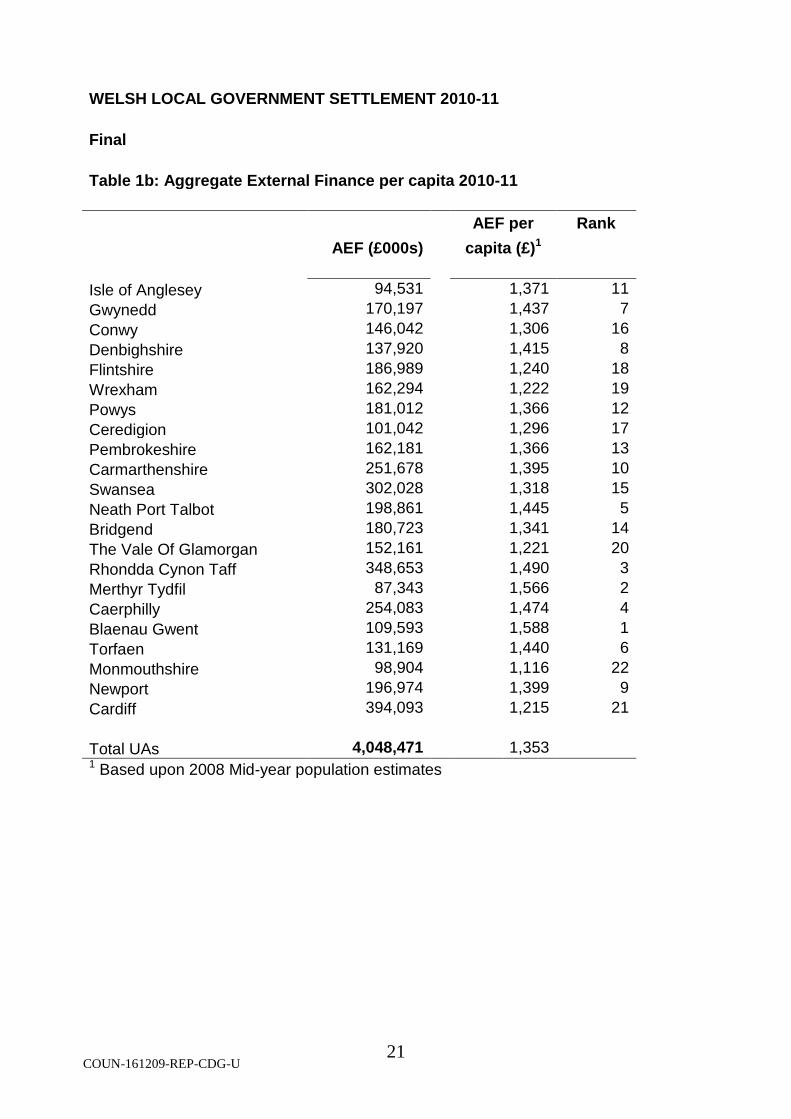
WELSH LOCAL GOVERNMENT SETTLEMENT 2010-11
Final
Table 1b: Aggregate External Finance per capita 2010-11
AEF per Rank
AEF (£000s) capita (£)1
Isle of Anglesey 94,531 1,371 11
Gwynedd 170,197 1,437 7
Conwy 146,042 1,306 16
Denbighshire 137,920 1,415 8
Flintshire 186,989 1,240 18
Wrexham 162,294 1,222 19
Powys 181,012 1,366 12
Ceredigion 101,042 1,296 17
Pembrokeshire 162,181 1,366 13
Carmarthenshire 251,678 1,395 10
Swansea 302,028 1,318 15
Neath Port Talbot 198,861 1,445 5
Bridgend 180,723 1,341 14
The Vale Of Glamorgan 152,161 1,221 20
Rhondda Cynon Taff 348,653 1,490 3
Merthyr Tydfil 87,343 1,566 2
Caerphilly 254,083 1,474 4
Blaenau Gwent 109,593 1,588 1
Torfaen 131,169 1,440 6
Monmouthshire 98,904 1,116 22
Newport 196,974 1,399 9
Cardiff 394,093 1,215 21
Total UAs 4,048,471 1,353 1 Based upon 2008 Mid-year population estimates
COUN-161209-REP-CDG-U 22
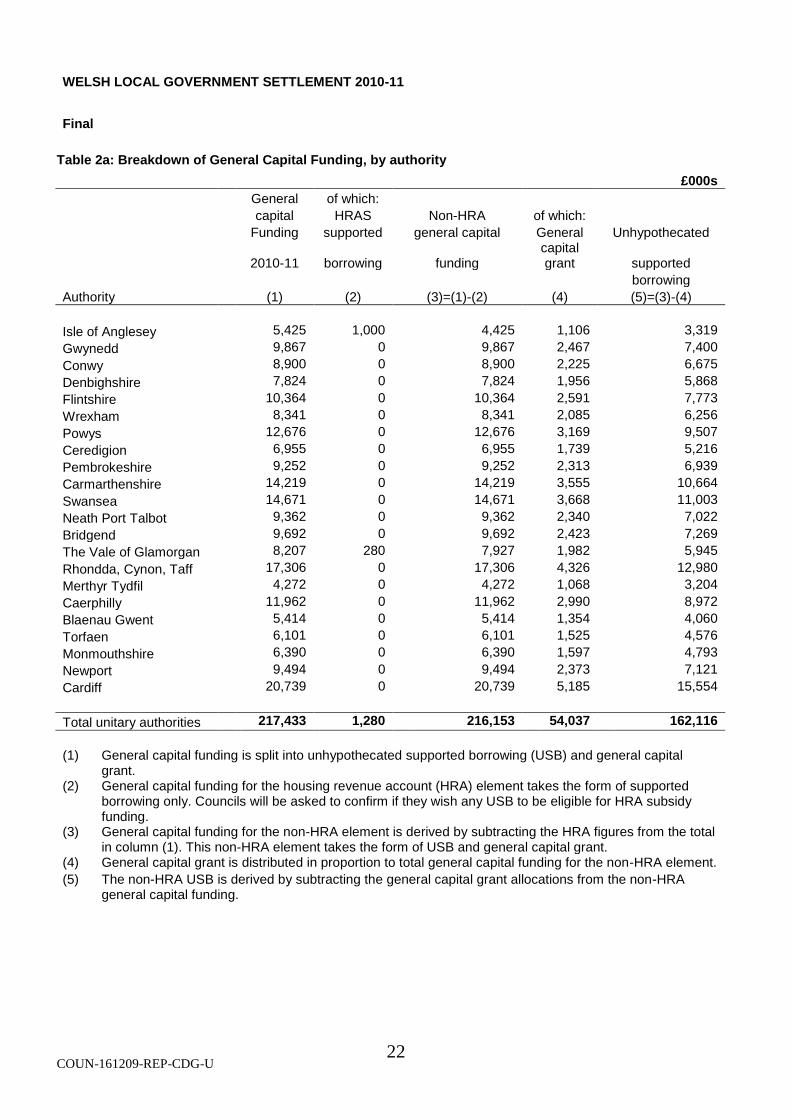
WELSH LOCAL GOVERNMENT SETTLEMENT 2010-11
Final
Table 2a: Breakdown of General Capital Funding, by authority
£000s
General of which:
capital HRAS Non-HRA of which:
Funding supported general capital General Unhypothecated
2010-11 borrowing funding capital grant supported
borrowing
Authority (1) (2) (3)=(1)-(2) (4) (5)=(3)-(4)
Isle of Anglesey 5,425 1,000 4,425 1,106 3,319
Gwynedd 9,867 0 9,867 2,467 7,400
Conwy 8,900 0 8,900 2,225 6,675
Denbighshire 7,824 0 7,824 1,956 5,868
Flintshire 10,364 0 10,364 2,591 7,773
Wrexham 8,341 0 8,341 2,085 6,256
Powys 12,676 0 12,676 3,169 9,507
Ceredigion 6,955 0 6,955 1,739 5,216
Pembrokeshire 9,252 0 9,252 2,313 6,939
Carmarthenshire 14,219 0 14,219 3,555 10,664
Swansea 14,671 0 14,671 3,668 11,003
Neath Port Talbot 9,362 0 9,362 2,340 7,022
Bridgend 9,692 0 9,692 2,423 7,269
The Vale of Glamorgan 8,207 280 7,927 1,982 5,945
Rhondda, Cynon, Taff 17,306 0 17,306 4,326 12,980
Merthyr Tydfil 4,272 0 4,272 1,068 3,204
Caerphilly 11,962 0 11,962 2,990 8,972
Blaenau Gwent 5,414 0 5,414 1,354 4,060
Torfaen 6,101 0 6,101 1,525 4,576
Monmouthshire 6,390 0 6,390 1,597 4,793
Newport 9,494 0 9,494 2,373 7,121
Cardiff 20,739 0 20,739 5,185 15,554
Total unitary authorities 217,433 1,280 216,153 54,037 162,116
(1) General capital funding is split into unhypothecated supported borrowing (USB) and general capital
grant. (2) General capital funding for the housing revenue account (HRA) element takes the form of supported
borrowing only. Councils will be asked to confirm if they wish any USB to be eligible for HRA subsidy funding.
(3) General capital funding for the non-HRA element is derived by subtracting the HRA figures from the total in column (1). This non-HRA element takes the form of USB and general capital grant.
(4) General capital grant is distributed in proportion to total general capital funding for the non-HRA element.
(5) The non-HRA USB is derived by subtracting the general capital grant allocations from the non-HRA general capital funding.
COUN-161209-REP-CDG-U 23
WELSH LOCAL GOVERNMENT SETTLEMENT 2010-11
Final
Table 2b: Local authority capital settlement by Main Expenditure Group
£ 000s
Grant/GCF1 Grant/GCF2 Difference
2009-10 2010-11 %
SOCIAL JUSTICE and LOCAL GOVERNMENT
Town Centre Regeneration Programme
8,791 7,791 -1,000 -11.4%
Substance Misuse 4,100 7,000 2,900 70.7%
Fire and Rescue Services* 8,501 0 -8,501 -100.0%
Gypsy Traveller Sites 2,500 2,500 0 0.0%
General Capital Funding (Regeneration & Other Local Services)
19,651 19,651 0 0.0%
TOTAL 43,543 36,942 -6,601 -15.2%
ECONOMY & TRANSPORT 3
Capital Grants (Local Roads) 83,206 68,206 -15,000 -18.0%
Capital Grants (Local Transport) 21,599 21,599 0 0.0%
Rail and Air Capital* 16,315 0 -16,315 -100.0%
(Capital Grants) Walking and Cycling 10,304 10,304 0 0.0%
Road Safety 9,829 9,829 0 0.0%
General Capital Funding (Roads) 21,816 21,816 0 0.0%
TOTAL 163,069 131,754 -31,315 -19.2%
HEALTH & SOCIAL SERVICES
Social Services Capital Funding* 1,500 0 -1,500 -100.0%
General Capital Funding (PSS) 7,133 7,133 0 0.0%
TOTAL 8,633 7,133 -1,500 -17.4%
COUN-161209-REP-CDG-U 24
WELSH LOCAL GOVERNMENT SETTLEMENT 2010-11
Final
Table 2b: Local authority capital settlement by Main Expenditure Group (continued)
£ 000s
Grant/GCF1,3 Grant/GCF2 Difference
2009-10 2010-11 %
ENVIRONMENT SUSTAINABILITY & HOUSING
Flood Risk Management & Water 6,028 6,028 0 0.0%
Waste Strategy 12,200 12,200 0 0.0%
Major Repairs Allowance 108,000 108,000 0 0.0%
Renewal Areas - Capital Grant 25,500 24,138 -1,362 -5.3%
Financial assistance-first time buyers 500 500 0 0.0%
Local Government Flood & Coast 1,795 1,795 0 0.0%
Housing General Capital Funding 86,342 86,342 0 0.0%
General Capital Funding 20,192 20,192 0 0.0%
TOTAL 260,557 259,195 -1,362 -0.5%
CHILDREN, EDUCATION, LIFELONG LEARNING & SKILLS
School Buildings Improvement Grant 104,000 65,000 -39,000 -37.5%
Early Years 7,206 6,806 -400 -5.6%
Youth Service Capital 3,000 3,000 0 0.0%
14-19 Building Learning Pathways 2,600 2,600 0 0.0%
General Capital Funding 60,504 60,504 0 0.0%
TOTAL 177,310 137,910 -39,400 -22.2%
HERITAGE
CyMAL 3,000 3,000 0 0.0%
TOTAL 3,000 3,000 0 0.0%
TOTAL LA CAPITAL SETTLEMENT 656,112 575,934 -80,178 -12.2%
1 GCF for 2009-10 includes £20m currently within the Local Government MEG prorated over the GCF totals showing in other MEGs. 2 GCF for 2010-11 includes £20m currently within the Local Government MEG prorated over the GCF totals showing in other MEGs. 3 2009-10 figures are updated to reflect in-year changes & include some funding brought forward from 2010-11 budgets.
* Grants schemes that were scheduled to end as at 31/03/10 should be taken into consideration when making comparisons for annual differences.
COUN-161209-REP-CDG-U 25
WELSH LOCAL GOVERNMENT SETTLEMENT 2010-11 Final
Table 4a: Comparison of total SSA with 2009-10
1 and 2010-11 provisional and final
£000’s 2009-10
final settlement
2010-11 final
settlement
Difference Percentage difference
2010-11 provisional settlement
2010-11 final
settlement
Difference Percentage difference
Isle of Anglesey 116,655 120,515 3,860 3.3% 120,468 120,515 47 0.04%
Gwynedd 208,495 214,270 5,774 2.8% 214,154 214,270 115 0.05%
Conwy 184,782 190,259 5,476 3.0% 190,110 190,259 149 0.08%
Denbighshire 166,025 172,122 6,097 3.7% 172,013 172,122 109 0.06%
Flintshire 233,098 241,203 8,105 3.5% 241,102 241,203 101 0.04%
Wrexham 199,613 208,589 8,976 4.5% 208,492 208,589 96 0.05%
Powys 225,709 233,001 7,292 3.2% 232,854 233,001 147 0.06%
Ceredigion 124,254 128,523 4,269 3.4% 128,440 128,523 82 0.06%
Pembrokeshire 203,025 208,932 5,907 2.9% 208,839 208,932 93 0.04%
Carmarthenshire 303,126 313,487 10,361 3.4% 313,306 313,487 182 0.06%
Swansea 367,670 380,287 12,617 3.4% 380,116 380,287 171 0.04%
Neath Port Talbot
231,638 241,126 9,487 4.1% 241,010 241,126 116 0.05%
Bridgend 216,336 225,340 9,004 4.2% 225,250 225,340 90 0.04%
Vale of Glamorgan
195,192 202,457 7,266 3.7% 202,381 202,457 77 0.04%
Rhondda Cynon Taf
396,893 414,625 17,732 4.5% 414,473 414,625 152 0.04%
Merthyr Tydfil 97,902 103,083 5,181 5.3% 103,066 103,083 16 0.02%
Caerphilly 294,545 306,941 12,395 4.2% 306,866 306,941 75 0.02%
Blaenau Gwent 121,650 128,041 6,391 5.3% 127,991 128,041 50 0.04%
Torfaen 154,705 159,497 4,791 3.1% 159,443 159,497 53 0.03%
Monmouthshire 133,523 137,289 3,766 2.8% 137,202 137,289 87 0.06%
Newport 234,524 244,842 10,318 4.4% 244,791 244,842 52 0.02%
Cardiff 493,467 515,564 22,097 4.5% 515,506 515,564 58 0.01%
Total UAs 4,902,828 5,089,991 187,163 5,087,873 5,089,991 2,118
Notes: 1 2009-10 standard spending assessment as in the LG Finance Report unadjusted for baseline changes.
COUN-161209-REP-CDG-U 26
WELSH LOCAL GOVERNMENT SETTLEMENT 2010-11
Final
Table 4b: SSA Service Sectors 2010-11
£000s
Education
PSS Roads & Transport
Fire Other Services
Deprivation
Capital Total
Isle of Anglesey 50,380 27,163 7,050 3,263 21,313 508 7,981 117,659
Gwynedd 89,009 46,088 14,657 5,598 40,076 494 14,093 210,014
Conwy 76,293 48,230 10,347 5,282 34,109 174 11,720 186,155
Denbighshire 72,283 41,394 9,130 4,590 28,523 169 10,949 167,038
Flintshire 105,790 53,090 11,659 7,118 42,411 225 14,443 234,736
Wrexham 86,255 51,555 8,888 6,242 35,914 322 11,894 201,070
Powys 99,195 47,577 16,866 6,174 40,973 48 16,293 227,126
Ceredigion 52,166 27,575 8,750 3,636 23,671 107 9,007 124,911
Pembrokeshire 89,153 46,262 12,154 5,517 37,543 366 13,122 204,117
Carmarthenshire 132,959 73,646 17,203 8,403 53,048 1,195 19,212 305,666
Swansea 154,797 98,152 14,701 10,675 66,434 969 24,700 370,428
Neath Port Talbot 99,762 63,539 9,561 6,432 38,926 2,359 14,750 235,330
Bridgend 96,467 53,816 9,748 6,308 38,028 758 13,125 218,250
The Vale of Glamorgan
90,824 45,078 9,229 5,835 34,072 167 10,915 196,121
Rhondda Cynon Taff
176,722 101,617 15,819 10,998 67,109 4,223 25,991 402,479
Merthyr Tydfil 43,239 26,991 3,236 2,618 15,764 2,146 6,528 100,522
Caerphilly 134,511 74,642 12,610 8,085 49,219 2,466 16,830 298,363
Blaenau Gwent 50,854 33,275 4,996 3,255 20,587 2,625 9,483 125,076
Torfaen 70,510 39,470 5,375 4,286 24,982 452 10,681 155,755
Monmouthshire 58,892 29,727 7,291 4,149 25,910 0 8,044 134,013
Newport 104,101 60,628 8,253 6,595 41,073 716 14,886 236,250
Cardiff 210,167 130,706 20,071 15,099 89,739 1,511 30,269 497,561
Wales 2,144,330 1,220,220 237,596 140,158 869,422 22,000 314,915 4,948,642
Note: These SSAs have been adjusted for the transfers in and out in Table 7.
COUN-161209-REP-CDG-U 27
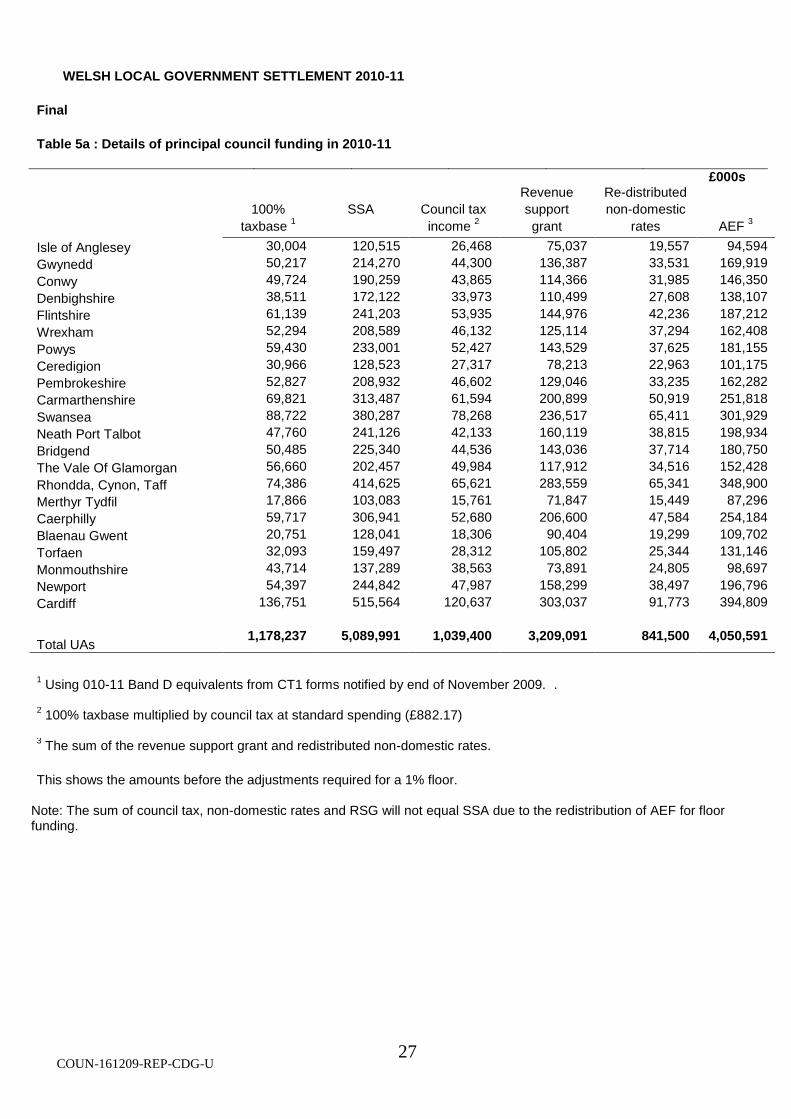
WELSH LOCAL GOVERNMENT SETTLEMENT 2010-11
Final
Table 5a : Details of principal council funding in 2010-11
£000s Revenue Re-distributed
100% SSA Council tax support non-domestic
taxbase 1 income
2 grant rates AEF
3
Isle of Anglesey 30,004 120,515 26,468 75,037 19,557 94,594
Gwynedd 50,217 214,270 44,300 136,387 33,531 169,919
Conwy 49,724 190,259 43,865 114,366 31,985 146,350
Denbighshire 38,511 172,122 33,973 110,499 27,608 138,107
Flintshire 61,139 241,203 53,935 144,976 42,236 187,212
Wrexham 52,294 208,589 46,132 125,114 37,294 162,408
Powys 59,430 233,001 52,427 143,529 37,625 181,155
Ceredigion 30,966 128,523 27,317 78,213 22,963 101,175
Pembrokeshire 52,827 208,932 46,602 129,046 33,235 162,282
Carmarthenshire 69,821 313,487 61,594 200,899 50,919 251,818
Swansea 88,722 380,287 78,268 236,517 65,411 301,929
Neath Port Talbot 47,760 241,126 42,133 160,119 38,815 198,934
Bridgend 50,485 225,340 44,536 143,036 37,714 180,750
The Vale Of Glamorgan 56,660 202,457 49,984 117,912 34,516 152,428
Rhondda, Cynon, Taff 74,386 414,625 65,621 283,559 65,341 348,900
Merthyr Tydfil 17,866 103,083 15,761 71,847 15,449 87,296
Caerphilly 59,717 306,941 52,680 206,600 47,584 254,184
Blaenau Gwent 20,751 128,041 18,306 90,404 19,299 109,702
Torfaen 32,093 159,497 28,312 105,802 25,344 131,146
Monmouthshire 43,714 137,289 38,563 73,891 24,805 98,697
Newport 54,397 244,842 47,987 158,299 38,497 196,796
Cardiff 136,751 515,564 120,637 303,037 91,773 394,809
Total UAs 1,178,237 5,089,991 1,039,400 3,209,091 841,500 4,050,591
1 Using 010-11 Band D equivalents from CT1 forms notified by end of November 2009. .
2 100% taxbase multiplied by council tax at standard spending (£882.17)
3 The sum of the revenue support grant and redistributed non-domestic rates.
This shows the amounts before the adjustments required for a 1% floor. Note: The sum of council tax, non-domestic rates and RSG will not equal SSA due to the redistribution of AEF for floor funding.
COUN-161209-REP-CDG-U 28
WELSH LOCAL GOVERNMENT SETTLEMENT 2010-11
Final
Table 6a: Improvement Agreement Grant
£s
Improvement Agreement Grant
Isle of Anglesey 733,657
Gwynedd 1,306,545
Conwy 1,166,436
Denbighshire 1,053,329
Flintshire 1,482,161
Wrexham 1,284,567
Powys 1,417,131
Ceredigion 781,041
Pembrokeshire 1,278,727
Carmarthenshire 1,916,997
Swansea 2,322,029
Neath Port Talbot 1,466,210
Bridgend 1,383,008
The Vale Of Glamorgan 1,251,501
Rhondda Cynon Taff 2,515,737
Merthyr Tydfil 617,914
Caerphilly 1,881,236
Blaenau Gwent 759,610
Torfaen 971,677
Monmouthshire 844,968
Newport 1,500,274
Cardiff 3,165,246
Total UAs 31,100,000
COUN-161209-REP-CDG-U 29
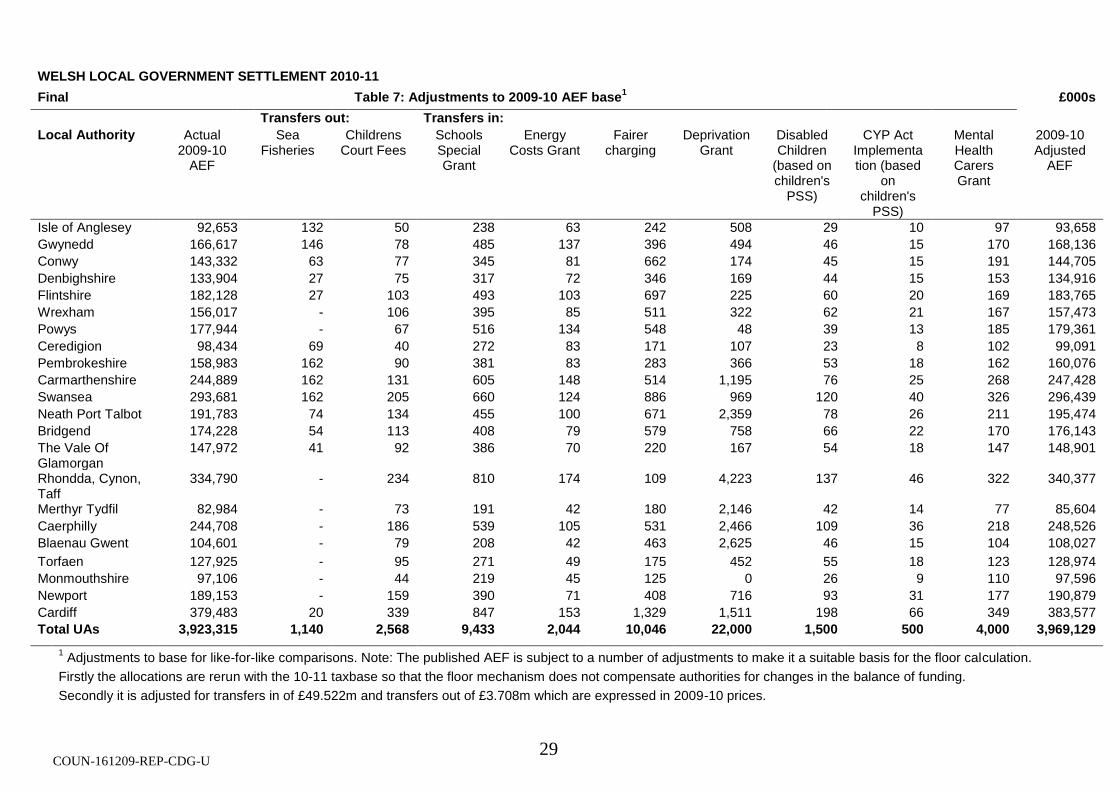
WELSH LOCAL GOVERNMENT SETTLEMENT 2010-11
Final Table 7: Adjustments to 2009-10 AEF base1 £000s
Transfers out: Transfers in:
Local Authority Actual 2009-10
AEF
Sea Fisheries
Childrens Court Fees
Schools Special Grant
Energy Costs Grant
Fairer charging
Deprivation Grant
Disabled Children
(based on children's
PSS)
CYP Act Implementation (based
on children's
PSS)
Mental Health Carers Grant
2009-10 Adjusted
AEF
Isle of Anglesey 92,653 132 50 238 63 242 508 29 10 97 93,658
Gwynedd 166,617 146 78 485 137 396 494 46 15 170 168,136
Conwy 143,332 63 77 345 81 662 174 45 15 191 144,705
Denbighshire 133,904 27 75 317 72 346 169 44 15 153 134,916
Flintshire 182,128 27 103 493 103 697 225 60 20 169 183,765
Wrexham 156,017 - 106 395 85 511 322 62 21 167 157,473
Powys 177,944 - 67 516 134 548 48 39 13 185 179,361
Ceredigion 98,434 69 40 272 83 171 107 23 8 102 99,091
Pembrokeshire 158,983 162 90 381 83 283 366 53 18 162 160,076
Carmarthenshire 244,889 162 131 605 148 514 1,195 76 25 268 247,428
Swansea 293,681 162 205 660 124 886 969 120 40 326 296,439
Neath Port Talbot 191,783 74 134 455 100 671 2,359 78 26 211 195,474
Bridgend 174,228 54 113 408 79 579 758 66 22 170 176,143
The Vale Of Glamorgan
147,972 41 92 386 70 220 167 54 18 147 148,901
Rhondda, Cynon, Taff
334,790 - 234 810 174 109 4,223 137 46 322 340,377
Merthyr Tydfil 82,984 - 73 191 42 180 2,146 42 14 77 85,604
Caerphilly 244,708 - 186 539 105 531 2,466 109 36 218 248,526
Blaenau Gwent 104,601 - 79 208 42 463 2,625 46 15 104 108,027
Torfaen 127,925 - 95 271 49 175 452 55 18 123 128,974
Monmouthshire 97,106 - 44 219 45 125 0 26 9 110 97,596
Newport 189,153 - 159 390 71 408 716 93 31 177 190,879
Cardiff 379,483 20 339 847 153 1,329 1,511 198 66 349 383,577
Total UAs 3,923,315 1,140 2,568 9,433 2,044 10,046 22,000 1,500 500 4,000 3,969,129
1 Adjustments to base for like-for-like comparisons. Note: The published AEF is subject to a number of adjustments to make it a suitable basis for the floor calculation.
Firstly the allocations are rerun with the 10-11 taxbase so that the floor mechanism does not compensate authorities for changes in the balance of funding.
Secondly it is adjusted for transfers in of £49.522m and transfers out of £3.708m which are expressed in 2009-10 prices.
COUN-161209-REP-CDG-U 30
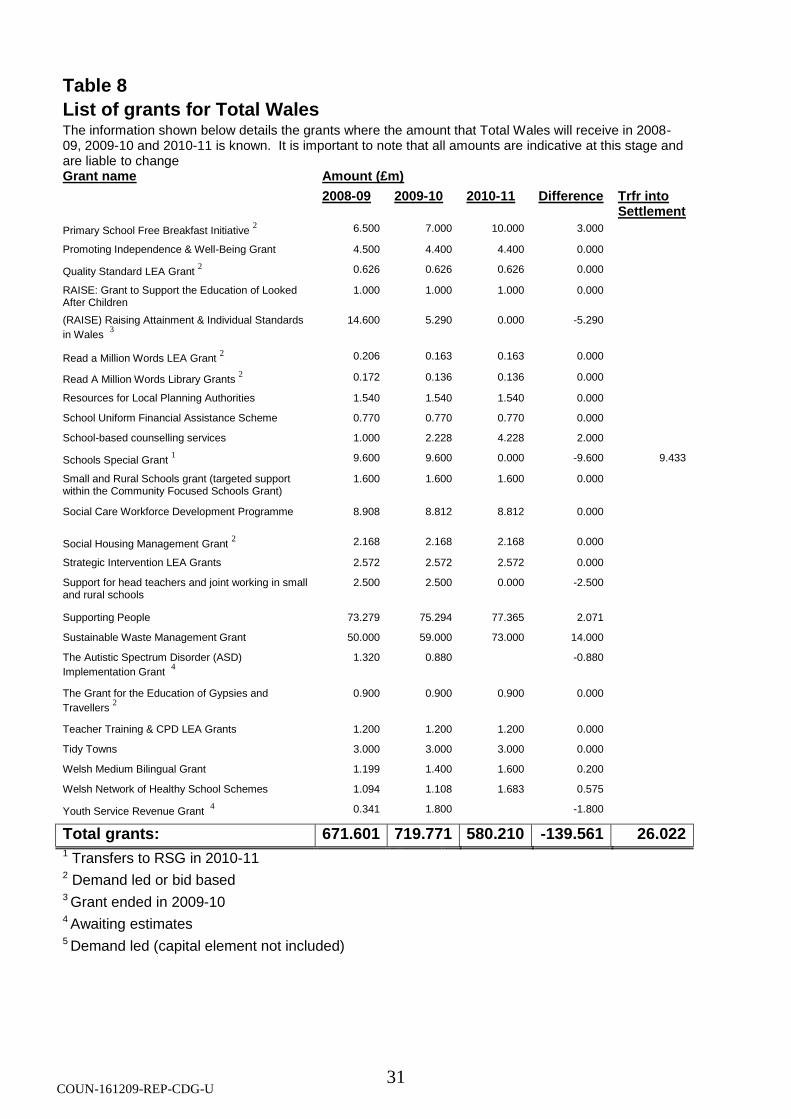
Table 8
List of grants for Total Wales
The information shown below details the grants where the amount that Total Wales will receive in 2008-09, 2009-10 and 2010-11 is known. It is important to note that all amounts are indicative at this stage and are liable to change Grant name Amount (£m)
2008-09 2009-10 2010-11 Difference Trfr into Settlement
14-19 Learning Pathways 19.900 17.803 17.803 0.000
Appetite for Life Specific Grant 3.199 2.994 2.400 -0.594
Better Schools Fund 22.164 22.164 15.164 -7.000
Bus Revenue Support 1.121 0.740 0.494 -0.246
CBDC Cardiff Bay Regeneration Grants 9.742 10.039 9.500 -0.539
Child Trust Fund Reimbursement Grant 2 0.114 0.091 0.109 0.018
Community Focused Schools Grant 2.400 3.300 4.400 1.100
Community Learning 4 5.498 5.685 -5.685
Community Purposes 2.261 2.549 2.520 -0.029
Companion Animal Welfare Enhancement Scheme 0.900 1.000 0.708 -0.292
Concessionary Fares Reimbursement Grant 5 55.989 61.900 56.184 -5.716
CyMAL Grant Scheme 2 0.000 0.000 1.305 1.305
Cymorth - the Children and Youth Support Fund 52.300 51.700 44.700 -7.000
Energy Costs Grant 1 2.000 2.000 0.000 -2.000 2.044
Fairer Charging Specific Grant Scheme 1 8.846 10.046 0.000 -10.046 10.046
Family Literacy, Language and Numeracy LEA
Grants 2
1.673 1.673 1.673 0.000
Flying Start Revenue grant 26.961 28.144 38.044 9.900
Foundation Phase Grants 25.000 54.000 76.000 22.000
Funding for Youth Work Training in Wales 0.494 0.470 0.474 0.004
Grant Funding to Pioneer Areas to implement Integrated Family Support team (IFST) model in Wales
0.000 1.800 1.800 0.000
HCW Well-being Activity Grant Scheme 0.561 0.550 0.550 0.000
Implementation of the Strategy for Older People 2.400 1.700 1.000 -0.700
Joint Working Special Grant 10.000 10.000 10.000 0.000
Language and Play LEA Grants 2 1.350 1.350 1.350 0.000
Learning Disability Strategy (Resettlement) 31.500 31.700 32.600 0.900
Local Authority Funding to Implement the Mental Health Act 2007
0.000 0.000 0.266 0.266
Local Transport Services Grant 10.857 10.857 10.857 0.000
LSB Development Support Grant 3 1.100 1.100 0.000 -1.100
Mental Capacity Act 2005 Deprivation of Liberty Safeguards Funding
0.000 0.484 0.484 0.000 0.500
Mental Health Carers Grant Scheme 1 4.000 4.000 0.000 -4.000 4.000
Mergers and collaboration budget 2.919 3.750 3.943 0.193
Minority Ethnic Achievement Grant 2 9.100 9.600 9.600 0.000
Performance Management Development Fund 4.650 5.400 5.300 -0.100
PFI 31.892 34.132 34.219 0.087
Post-16 Provision in Schools 4 108.174 108.445 -108.445
Provision and SEN in Mainstream Post-16 Special
Schools and SEN Out of County 4
21.941 23.618 -23.618
COUN-161209-REP-CDG-U 31
Table 8
List of grants for Total Wales
The information shown below details the grants where the amount that Total Wales will receive in 2008-09, 2009-10 and 2010-11 is known. It is important to note that all amounts are indicative at this stage and are liable to change Grant name Amount (£m)
2008-09 2009-10 2010-11 Difference Trfr into Settlement
Primary School Free Breakfast Initiative 2 6.500 7.000 10.000 3.000
Promoting Independence & Well-Being Grant 4.500 4.400 4.400 0.000
Quality Standard LEA Grant 2 0.626 0.626 0.626 0.000
RAISE: Grant to Support the Education of Looked After Children
1.000 1.000 1.000 0.000
(RAISE) Raising Attainment & Individual Standards
in Wales 3
14.600 5.290 0.000 -5.290
Read a Million Words LEA Grant 2 0.206 0.163 0.163 0.000
Read A Million Words Library Grants 2 0.172 0.136 0.136 0.000
Resources for Local Planning Authorities 1.540 1.540 1.540 0.000
School Uniform Financial Assistance Scheme 0.770 0.770 0.770 0.000
School-based counselling services 1.000 2.228 4.228 2.000
Schools Special Grant 1 9.600 9.600 0.000 -9.600 9.433
Small and Rural Schools grant (targeted support within the Community Focused Schools Grant)
1.600 1.600 1.600 0.000
Social Care Workforce Development Programme 8.908 8.812 8.812 0.000
Social Housing Management Grant 2 2.168 2.168 2.168 0.000
Strategic Intervention LEA Grants 2.572 2.572 2.572 0.000
Support for head teachers and joint working in small and rural schools
2.500 2.500 0.000 -2.500
Supporting People 73.279 75.294 77.365 2.071
Sustainable Waste Management Grant 50.000 59.000 73.000 14.000
The Autistic Spectrum Disorder (ASD)
Implementation Grant 4
1.320 0.880 -0.880
The Grant for the Education of Gypsies and
Travellers 2
0.900 0.900 0.900 0.000
Teacher Training & CPD LEA Grants 1.200 1.200 1.200 0.000
Tidy Towns 3.000 3.000 3.000 0.000
Welsh Medium Bilingual Grant 1.199 1.400 1.600 0.200
Welsh Network of Healthy School Schemes 1.094 1.108 1.683 0.575
Youth Service Revenue Grant 4 0.341 1.800 -1.800
Total grants: 671.601 719.771 580.210 -139.561 26.022 1 Transfers to RSG in 2010-11 2 Demand led or bid based 3 Grant ended in 2009-10 4 Awaiting estimates 5 Demand led (capital element not included)