NBR Series (1240) -...
39
NBR Series Device Management Supports Management Module SM-CSI1021 Titlepage
Transcript of NBR Series (1240) -...

NBR Series
Device Management
Supports Management Module SM-CSI1021
Titlep
age
D e v i c e M a n a g e m e n t Page 2 N B R S e r i e s
Copyright NoticeDocument 1240. Copyright © 2001-present by Aprisma Management Technologies, Inc. All rights reserved worldwide. Use, duplication, or disclosure by the United States government is subject to the restrictions set forth in DFARS 252.227-7013(c)(1)(ii) and FAR 52.227-19.Liability DisclaimerAprisma Management Technologies, Inc. (“Aprisma”) reserves the right to make changes in specifications and other information contained in this document without prior notice. In all cases, the reader should contact Aprisma to inquire if any changes have been made.
The hardware, firmware, or software described in this manual is subject to change without notice.
IN NO EVENT SHALL APRISMA, ITS EMPLOYEES, OFFICERS, DIRECTORS, AGENTS, OR AFFILIATES BE LIABLE FOR ANY INCIDENTAL, INDIRECT, SPECIAL, OR CONSEQUENTIAL DAMAGES WHATSOEVER (INCLUDING BUT NOT LIMITED TO LOST PROFITS) ARISING OUT OF OR RELATED TO THIS MANUAL OR THE INFORMATION CONTAINED IN IT, EVEN IF APRISMA HAS BEEN ADVISED OF, HAS KNOWN, OR SHOULD HAVE KNOWN, THE POSSIBILITY OF SUCH DAMAGES.
Trademark, Service Mark, and Logo InformationSPECTRUM, IMT, and the SPECTRUM IMT/VNM logo are registered trademarks of Aprisma Management Technologies, Inc., or its affiliates. APRISMA, APRISMA MANAGEMENT TECHNOLOGIES, the APRISMA MANAGEMENT TECHNOLOGIES logo, MANAGE WHAT MATTERS, DCM, VNM, SpectroGRAPH, SpectroSERVER, Inductive Modeling Technology, Device Communications Manager, SPECTRUM Security Manager, and Virtual Network Machine are unregistered trademarks of Aprisma Management Technologies, Inc., or its affiliates. For a complete list of Aprisma trademarks, service marks, and trade names, go tohttp://www.aprisma.com/manuals/trademark-list.htm.
All referenced trademarks, service marks, and trade names identified in this document, whether registered or unregistered, are the intellectual property of their respective owners. No rights are granted by Aprisma Management Technologies, Inc., to use such marks, whether by implication, estoppel, or otherwise. If you have comments or concerns
about trademark or copyright references, please send an e-mail to [email protected]; we will do our best to help.
Restricted Rights Notice(Applicable to licenses to the United States government only.)This software and/or user documentation is/are provided with RESTRICTED AND LIMITED RIGHTS. Use, duplication, or disclosure by the government is subject to restrictions as set forth in FAR 52.227-14 (June 1987) Alternate III(g)(3) (June 1987), FAR 52.227-19 (June 1987), or DFARS 52.227-7013(c)(1)(ii) (June 1988), and/or in similar or successor clauses in the FAR or DFARS, or in the DOD or NASA FAR Supplement, as applicable. Contractor/manufacturer is Aprisma Management Technologies, Inc. In the event the government seeks to obtain the software pursuant to standard commercial practice, this software agreement, instead of the noted regulatory clauses, shall control the terms of the government's license.Virus DisclaimerAprisma makes no representations or warranties to the effect that the licensed software is virus-free.
Aprisma has tested its software with current virus-checking technologies. However, because no antivirus system is 100 percent effective, we strongly recommend that you write-protect the licensed software and verify (with an antivirus system in which you have confidence) that the licensed software, prior to installation, is virus-free.
Contact InformationAprisma Management Technologies, Inc.273 Corporate DrivePortsmouth, NH 03801Phone: 603-334-2100U.S. toll-free: 877-468-1448Web site: http://www.aprisma.com

D e v i c e M a n a g e m e n t Page 3 N B R S e r i e s
ContentsINTRODUCTION 4
Purpose and Scope ........................................................4Required Reading ...........................................................4Supported Devices..........................................................5The SPECTRUM Model ..................................................6
TASKS 8
DEVICE VIEWS 9
Chassis Device View ......................................................9Logical Module Icon...................................................10
Interface Device View ...................................................14Interface Icons ...........................................................14
Port Configuration View/Administrative Status Label ....................................................15
Port Type Label......................................................15MAC Address Label/Interface Model
Information View .............................................16Network Information Panel/Network
Address Label .................................................16Interface Performance View/Logical
Gauge Label ...................................................17Interface Options Panel .............................................18
Filter .......................................................................18Network Information...............................................18Interface Description ..............................................18
Gauge Control Panel................................................. 18Physical Device View.................................................... 19Telnet ............................................................................ 20
CONFIGURATION VIEWS 21
Device Configuration View............................................ 22Interface Configuration Table .................................... 22
FDDI Port Configuration View....................................... 24Port Configuration View Banner ................................ 24Port Management...................................................... 24
SMT Device Configuration View ................................... 25Station Configuration View ........................................ 25SMT Information........................................................ 27Router Redundancy .................................................. 28
PERFORMANCE VIEWS 29
Device Performance View............................................. 30Port Performance View................................................. 30
APPLICATION VIEWS 31
Application Icons ....................................................... 32Supported Applications ............................................. 32
MODEL INFORMATION VIEW 34
INDEX 35

D e v i c e M a n a g e m e n t Page 4 N B R S e r i e s
Introduction
This section introduces the SPECTRUM Device Management documentation for NBR devices.
This introduction to the NBR documentation contains the following information:
• Purpose and Scope• Required Reading• Supported Devices (Page 5)• The SPECTRUM Model (Page 6)
Purpose and ScopeUse this documentation as a guide for managing NBR devices with the SPECTRUM management module. The documentation describes the icons, menus, and views that enable you to remotely monitor, configure, and troubleshoot NBR devices through software models in your SPECTRUM database.
Only information specific to the supported management modules is included under this topic. For general information about device management using SPECTRUM and for explanation of basic SPECTRUM functionality
and navigation techniques, refer to the documentation listed under Required Reading.
Required ReadingTo use this documentation effectively, you must be familiar with the information covered by the other SPECTRUM online documentation topics listed below.
• Getting Started with SPECTRUM for Operators
• Getting Started with SPECTRUM for Administrators
• How To Manage Your Network with SPECTRUM
• SPECTRUM Views• SPECTRUM Menus• SPECTRUM Icons
I n t r o d u c t i o n S u p p o r t e d D e v i c e s
D e v i c e M a n a g e m e n t Page 5 N B R S e r i e s
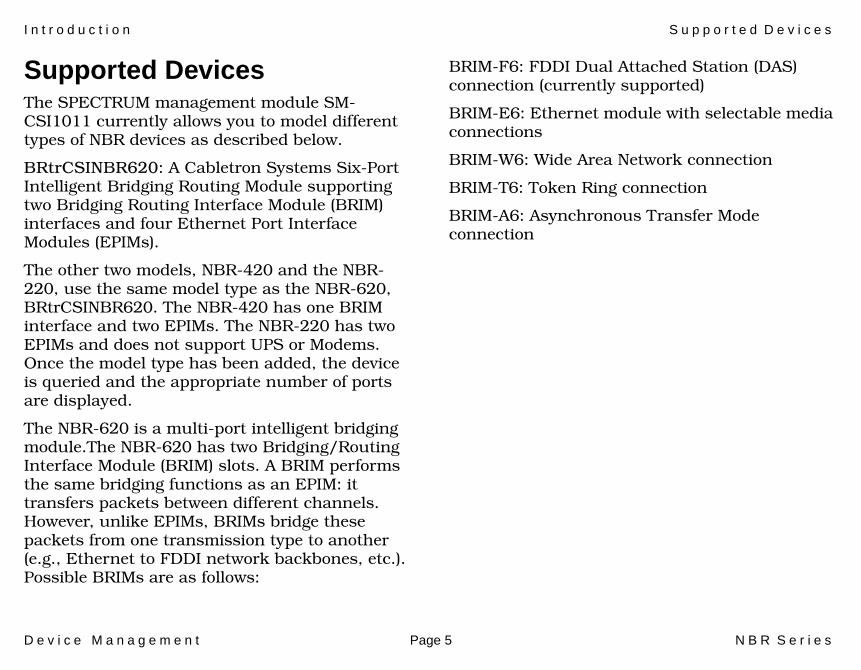
Supported DevicesThe SPECTRUM management module SM-CSI1011 currently allows you to model different types of NBR devices as described below.
BRtrCSINBR620: A Cabletron Systems Six-Port Intelligent Bridging Routing Module supporting two Bridging Routing Interface Module (BRIM) interfaces and four Ethernet Port Interface Modules (EPIMs).
The other two models, NBR-420 and the NBR-220, use the same model type as the NBR-620, BRtrCSINBR620. The NBR-420 has one BRIM interface and two EPIMs. The NBR-220 has two EPIMs and does not support UPS or Modems. Once the model type has been added, the device is queried and the appropriate number of ports are displayed.
The NBR-620 is a multi-port intelligent bridging module.The NBR-620 has two Bridging/Routing Interface Module (BRIM) slots. A BRIM performs the same bridging functions as an EPIM: it transfers packets between different channels. However, unlike EPIMs, BRIMs bridge these packets from one transmission type to another (e.g., Ethernet to FDDI network backbones, etc.). Possible BRIMs are as follows:
BRIM-F6: FDDI Dual Attached Station (DAS) connection (currently supported)
BRIM-E6: Ethernet module with selectable media connections
BRIM-W6: Wide Area Network connection
BRIM-T6: Token Ring connection
BRIM-A6: Asynchronous Transfer Mode connection
I n t r o d u c t i o n T h e S P E C T R U M M o d e l
D e v i c e M a n a g e m e n t Page 6 N B R S e r i e s
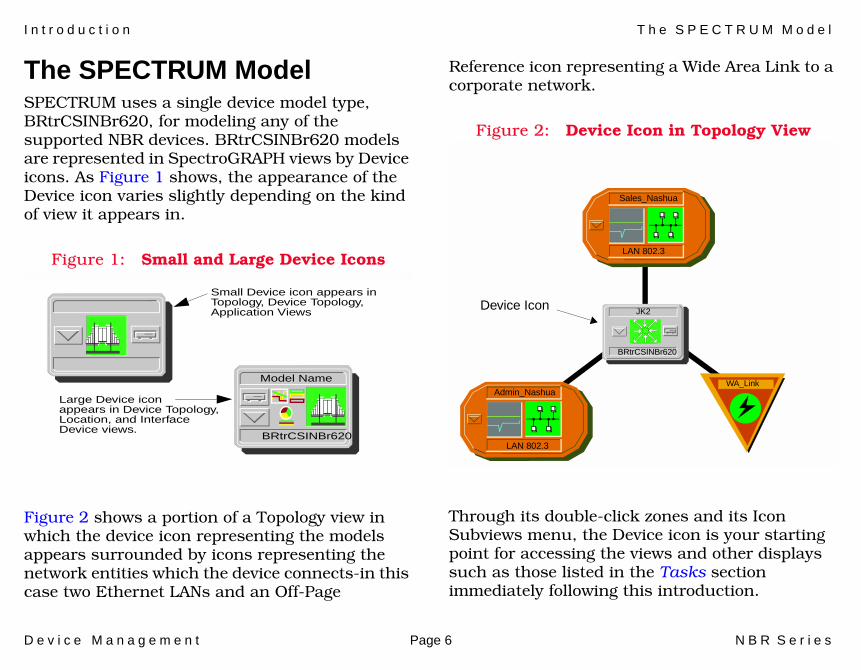
The SPECTRUM ModelSPECTRUM uses a single device model type, BRtrCSINBr620, for modeling any of the supported NBR devices. BRtrCSINBr620 models are represented in SpectroGRAPH views by Device icons. As Figure 1 shows, the appearance of the Device icon varies slightly depending on the kind of view it appears in.
Figure 1: Small and Large Device Icons
Figure 2 shows a portion of a Topology view in which the device icon representing the models appears surrounded by icons representing the network entities which the device connects-in this case two Ethernet LANs and an Off-Page
Reference icon representing a Wide Area Link to a corporate network.
Figure 2: Device Icon in Topology View
Through its double-click zones and its Icon Subviews menu, the Device icon is your starting point for accessing the views and other displays such as those listed in the Tasks section immediately following this introduction.
Small Device icon appears inTopology, Device Topology, Application Views
Large Device iconappears in Device Topology,Location, and Interface Device views.
Model Name
BRtrCSINBr620
Admin_Nashua
LAN 802.3
Sales_Nashua
LAN 802.3
Device Icon JK2
BRtrCSINBr620
WA_Link

I n t r o d u c t i o n T h e S P E C T R U M M o d e l
D e v i c e M a n a g e m e n t Page 7 N B R S e r i e s
The rest of the documentation for this management module is organized according to view type, as follows.
• Device Views (Page 9)• Configuration Views (Page 21)• Application Views (Page 31)• Model Information View (Page 34)
D e v i c e M a n a g e m e n t Page 8 N B R S e r i e s
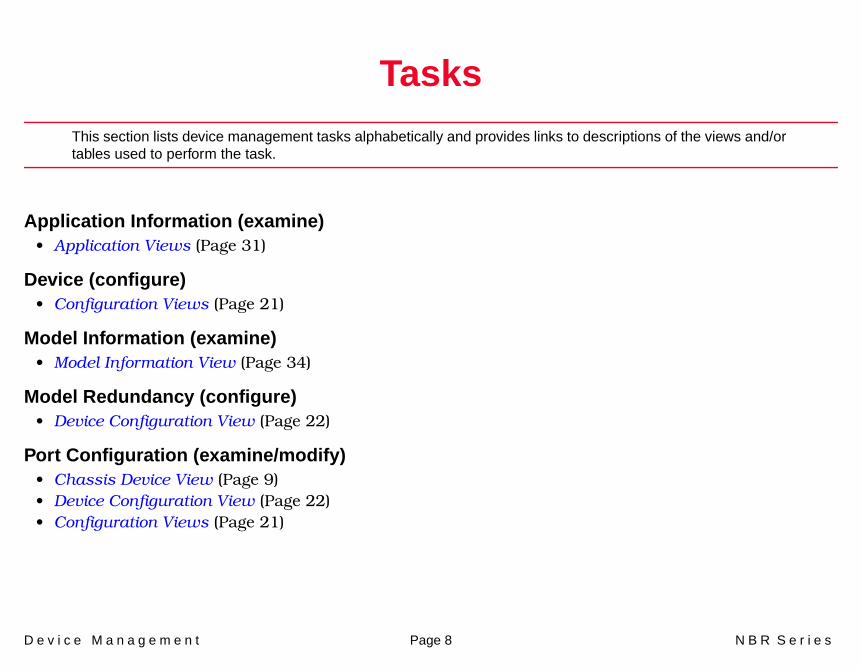
Tasks
This section lists device management tasks alphabetically and provides links to descriptions of the views and/or tables used to perform the task.
Application Information (examine)• Application Views (Page 31)
Device (configure)• Configuration Views (Page 21)
Model Information (examine)• Model Information View (Page 34)
Model Redundancy (configure)• Device Configuration View (Page 22)
Port Configuration (examine/modify)• Chassis Device View (Page 9)• Device Configuration View (Page 22)• Configuration Views (Page 21)

D e v i c e M a n a g e m e n t Page 9 N B R S e r i e s
Device Views
This section describes the Device views and subviews available for models of NBR series devices in SPECTRUM.
Device views use icons and labels to represent the modeled device and its components, such as modules, ports, and applications. There are two types of Device views for these models.
• Chassis Device View (Page 9)• Interface Device View (Page 14)• Physical Device View (Page 19)
The Chassis View displays a logical view of the NBR-620 device and its interfaces. From this view you can access performance, configuration, and status information about the bridge, ethernet and BRIM ports.
The Interface View displays a logical view of the NBR-620’s interfaces and provides access to information on their performance, status, and configuration.
The Physical View displays a physical representation of the device. This view provides access to module information only.
Chassis Device ViewThe Chassis Device View’s representation of the NBR-620 includes smaller icons representing the ports and applications of the NBR-620. These port and application representations provide access to detailed information about the module, the repeater stack, bridging, and the ports. Figure 3 displays a detail view of the NBR Chassis (Logical) Device View’s logical module representation and the menu selections available by clicking the right mouse button on each zone of the module.

D e v i c e V i e w s C h a s s i s D e v i c e V i e w
D e v i c e M a n a g e m e n t Page 10 N B R S e r i e s
Logical Module IconEach zone in the NBR-620 Chassis Device View, its related menu, and its double-click zones is described below.
Figure 3: Chassis Device View
BridgingNBR620 MultiPort Bridge/Router
BD C AFWD FWDFWDFWD
FDDIA CON1B CON2
FDDI FWDE
Channel PerformanceEnable/Disable Bridge Channel
Port NotesEnable/Disable PortPort Configuration View
Channel NotesChannel PerformanceEnable/Disable Bridge Channel
Bridge PerformanceBridge DetailBridge Model InformationEthernet Special DatabaseSpanning Tree InformationStatic Database TableTransparent Bridge Info
NBR620 Model InformationNBR620 Configuration
Module NotesApplication View
Bridging Menu SelectionsFDDI BRIM Menu Selections BRIM Menu Selections
Module Menu SelectionsBridge Channel Menu SelectionsBRIM Port Menu Selections
FDDI PerformanceFDDI ConfigurationFDDI Station ListFDDI Model InformationHub Detail

D e v i c e V i e w s
D e v i c e M a n a g e m e n t Page 11 N B R S e r i e s
Module TypeThe type of module being displayed. Table 1 outlines the menu selections available per module, excluding generic menu options such as Navigate, Utilities, Notes and Alarms.
Click on this button to display the menu selections defined in Table 2, which provide access to views displaying information collected by the bridge installed in the NBR-620. Table 2 outlines the menu selections available, excluding
generic options such as Navigate, Utilities, Notes, and Alarms.
Click on this button to display the menu selections defined in Table 3, which provide access to views displaying information collected by the FDDI BRIM installed in the NBR-620. Table 3 outlines the menu selections available, excluding generic
Table 1: Module Menu Selections
Menu Selection Description
Model Information Opens the Model Information View.
Configuration Opens the Configuration View.
Application View Opens the Application View.
Module Notes Opens the Module Notes View.
Bridging
Table 2: Bridging Menu Selections
Menu Selection Description
Bridge Performance Opens the Bridge Performance View.
Bridge Detail Opens the Bridge Detail View.
Bridge Model Information
Opens the Bridge Model Information View.
Ethernet Special Database
Opens the Ethernet Special Database View.
Spanning Tree Information
Opens the Spanning Tree Information View.
Static Database Table
Opens the Static Database Table View.
Transparent Bridge Info
Opens the Transparent Bridge Information View.
FDDI
D e v i c e V i e w s
D e v i c e M a n a g e m e n t Page 12 N B R S e r i e s
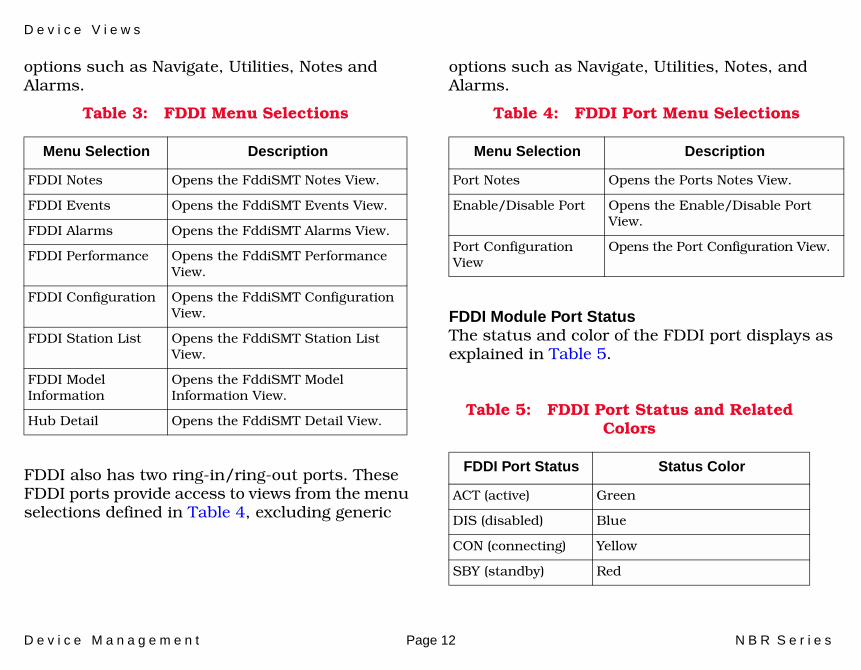
options such as Navigate, Utilities, Notes and Alarms.
FDDI also has two ring-in/ring-out ports. These FDDI ports provide access to views from the menu selections defined in Table 4, excluding generic
options such as Navigate, Utilities, Notes, and Alarms.
FDDI Module Port StatusThe status and color of the FDDI port displays as explained in Table 5.
Table 3: FDDI Menu Selections
Menu Selection Description
FDDI Notes Opens the FddiSMT Notes View.
FDDI Events Opens the FddiSMT Events View.
FDDI Alarms Opens the FddiSMT Alarms View.
FDDI Performance Opens the FddiSMT Performance View.
FDDI Configuration Opens the FddiSMT Configuration View.
FDDI Station List Opens the FddiSMT Station List View.
FDDI Model Information
Opens the FddiSMT Model Information View.
Hub Detail Opens the FddiSMT Detail View.
Table 4: FDDI Port Menu Selections
Menu Selection Description
Port Notes Opens the Ports Notes View.
Enable/Disable Port Opens the Enable/Disable Port View.
Port Configuration View
Opens the Port Configuration View.
Table 5: FDDI Port Status and Related Colors
FDDI Port Status Status Color
ACT (active) Green
DIS (disabled) Blue
CON (connecting) Yellow
SBY (standby) Red

D e v i c e V i e w s
D e v i c e M a n a g e m e n t Page 13 N B R S e r i e s
Bridge Channel PortsThe NBR-620 has six ports: four bridge channel RJ45 ports and two BRIM (Bridging Routing Interface Modules) ports. The NBR-420 has one BRIM interface and two EPIMs and the NBR-220 has two EPIMs. The port icon provides ‘at-a-glance’ information about the port. Figure 4 illustrates a detail of the Port Icon-Device Chassis View. Table 6 provides a description of the Bridge Port Status colors.
Figure 4: Port Icon - Device Chassis View
Table 6: Bridge Channel Port Status Colors
These channel ports provide access to views from the menu selections defined in Table 7, excluding generic options such as Navigate, Utilities, Notes and Alarms.
Status Color Description
OFF Blue The port is disabled.
BLK Yellow The port is in a blocking state.
BRKN Red The port is in a broken state.
A FWD
Bridge Port Channel - The letter uniquely identifies the port’s chann
Bridge Port Status - The port’s status.
FWD Green The port is forwarding network traffic.
LSTN Yellow The port is in a listening state.
LRN Yellow The port is in a learning state.
Table 7: Port Menu Selections
Menu Selection Description
Channel Notes Opens the Channel Notes View.
Channel Performance Opens the Channel Performance View.
Enable/Disable Bridge Channel
Enables or disables the selected channel.

D e v i c e V i e w s I n t e r f a c e D e v i c e V i e w
D e v i c e M a n a g e m e n t Page 14 N B R S e r i e s
Interface Device ViewAccess: Highlight the NBR-620 device icon and select Device -> Interface from the Icon Subviews menu.
This view provides information on the operational status of the interface and allows you to enable or disable the port. Figure 5 is an example of an Interface Device View.
Figure 5: Interface Device View
Interface IconsFigure shows a close-up of an Interface icon from an Interface Device view. Most of the informational labels on the icon also provide double-click access to other views, as explained in the following label descriptions.
Figure 6: NBR-620 Interface Icon
File View Tools Bookmarks
FinInterface
Network Infor- AddressPhy Addr
1 ONETHERNET
0
Model Con-Descrip-Loca-
Network System Up Manufac-Device Serial Primary-Appli-
2 ONFDDI
0
SNMP
3 ONOTHER
0
0:0:1D:17:2F:3C
8:0:1D:17:2F:3C
8:0:4E:6:2E:7
Device View Banner
Interface
Device Icon Panel
Interface Icons
Interface Icon Panel
Options Panel
HelpSpectroGRAPH:
i
EthernetEthernet0
0
3 ON
0:0:30:68:6F:1B132.127.118.24
1 Interface Number Label
2 IF Status Label
3 Interface Type Label
4 Network Type Label
5 Physical Address Label
6 IP Address Label
7 Gauge Label
(1) (2)
(3)(4)(5)(6)(7)

D e v i c e V i e w s
D e v i c e M a n a g e m e n t Page 15 N B R S e r i e s
Device Topology View/Interface Number LabelDouble-clicking on this label of the Interface Icon accesses the NBR-620 Device Topology (DevTop) View. The label also displays the number of this interface.
Port Configuration View/Administrative Status LabelThis label provides access to configuration views specific to the port. Double-clicking on this label on the ETHERNET icon opens the Port Configuration View. Double-clicking on this label on the FDDI icon opens the BRIM Interface Configuration View. You can also access these views by highlighting the ETHERNET/FDDI icon and selecting Configuration from the Icon Subviews menu. Each view provides the following information:
Interface IndexIndicates the value identifying the port.
Interface TypeIndicates the type of interface for the port.
Operation StatusIndicates the current operating condition of the port for which the entry exists. Possible entries are: On, Off, and Test.
Admin. StatusIndicates the current administrative state of the port for which the entry exists. Possible entries: On, Off, and Test.
IF DescriptionA description of the interface.
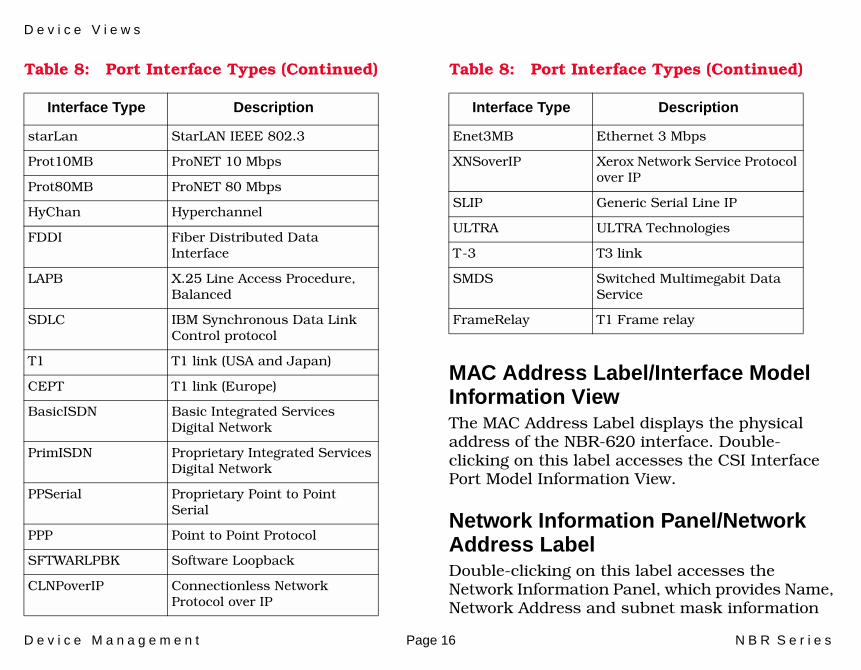
Port Type LabelThe Port Type Label displays the type of NBR-620 interface. Possible interface types are shown in Table 8.
Table 8: Port Interface Types
Interface Type Description
Other None of the following
Reg1822 Regular 1822
HDH1822 HDLC Distant Host protocol
DDNX25 Defense Data Network X.25
rfc877X25 RFC877 X.25
Ethernet Ethernet CSMA/CD
iso88023 ISO CSMA/CD
iso88024 ISO token bus
iso88025 ISO token ring
iso88026 ISO man
D e v i c e V i e w s
D e v i c e M a n a g e m e n t Page 16 N B R S e r i e s
MAC Address Label/Interface Model Information ViewThe MAC Address Label displays the physical address of the NBR-620 interface. Double-clicking on this label accesses the CSI Interface Port Model Information View.
Network Information Panel/Network Address LabelDouble-clicking on this label accesses the Network Information Panel, which provides Name, Network Address and subnet mask information
starLan StarLAN IEEE 802.3
Prot10MB ProNET 10 Mbps
Prot80MB ProNET 80 Mbps
HyChan Hyperchannel
FDDI Fiber Distributed Data Interface
LAPB X.25 Line Access Procedure, Balanced
SDLC IBM Synchronous Data Link Control protocol
T1 T1 link (USA and Japan)
CEPT T1 link (Europe)
BasicISDN Basic Integrated Services Digital Network
PrimISDN Proprietary Integrated Services Digital Network
PPSerial Proprietary Point to Point Serial
PPP Point to Point Protocol
SFTWARLPBK Software Loopback
CLNPoverIP Connectionless Network Protocol over IP
Table 8: Port Interface Types (Continued)
Interface Type Description
Enet3MB Ethernet 3 Mbps
XNSoverIP Xerox Network Service Protocol over IP
SLIP Generic Serial Line IP
ULTRA ULTRA Technologies
T-3 T3 link
SMDS Switched Multimegabit Data Service
FrameRelay T1 Frame relay
Table 8: Port Interface Types (Continued)
Interface Type Description

D e v i c e V i e w s
D e v i c e M a n a g e m e n t Page 17 N B R S e r i e s
for the interface. Any of the network information entries from this panel can be displayed on the Network Address Label. Refer to Interface Options Panel (Page 18) for more information.
Interface Performance View/Logical Gauge LabelDouble-clicking on this label of the Interface Icon accesses the Performance View for the interface. You can also access this view by highlighting the ETHERNET/FDDI icon and selecting Performance from the Icon Subviews menu. This area is also a Logical Gauge, which is described in the next section. The Performance View summarizes network traffic flow in packets for this interface, providing the following information:
Multi-Attribute Line GraphThe Multi-Attribute Line Graph provides a general indication of network activity. The attributes are pre-selected and use colors to represent different statistics.
Table 9: Color and Statistical Definitions
Statistic Color Description
% Transmitted white The percentage of the total number of packets that have been transmitted, device-wide, during uptime.
% Discarded orange The percentage of the total number of packets that have been discarded, device-wide, during uptime.
% Error red The percentage of the total number of error packets that have occurred, device-wide, during uptime.
% Host Bound yellow The percentage of the total number of packets that have been delivered to the local host from the port during uptime.
In Packet Rate light blue The total number of packets that have been received, device-wide, during uptime.
Out Packet Rate
turquoise The total number of packets that have been transmitted, device-wide, during uptime.
Total Packet Rate
royal blue The total number of packets that have been transmitted and received, device-wide, during uptime.
D e v i c e V i e w s
D e v i c e M a n a g e m e n t Page 18 N B R S e r i e s
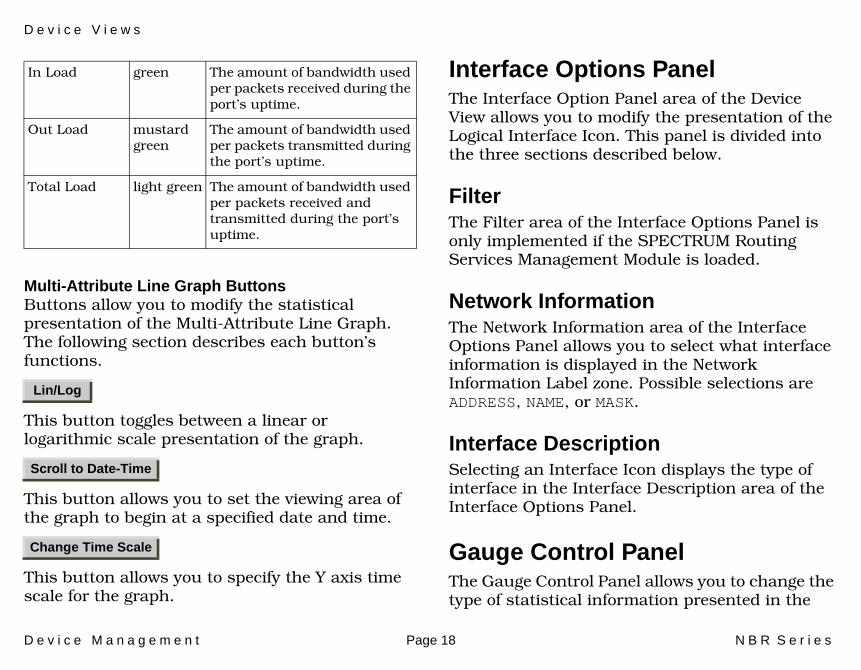
Multi-Attribute Line Graph ButtonsButtons allow you to modify the statistical presentation of the Multi-Attribute Line Graph. The following section describes each button’s functions.
This button toggles between a linear or logarithmic scale presentation of the graph.
This button allows you to set the viewing area of the graph to begin at a specified date and time.
This button allows you to specify the Y axis time scale for the graph.
Interface Options PanelThe Interface Option Panel area of the Device View allows you to modify the presentation of the Logical Interface Icon. This panel is divided into the three sections described below.
FilterThe Filter area of the Interface Options Panel is only implemented if the SPECTRUM Routing Services Management Module is loaded.
Network InformationThe Network Information area of the Interface Options Panel allows you to select what interface information is displayed in the Network Information Label zone. Possible selections are ADDRESS, NAME, or MASK.
Interface DescriptionSelecting an Interface Icon displays the type of interface in the Interface Description area of the Interface Options Panel.
Gauge Control PanelThe Gauge Control Panel allows you to change the type of statistical information presented in the
In Load green The amount of bandwidth used per packets received during the port’s uptime.
Out Load mustard green
The amount of bandwidth used per packets transmitted during the port’s uptime.
Total Load light green The amount of bandwidth used per packets received and transmitted during the port’s uptime.
Lin/Log
Scroll to Date-Time
Change Time Scale

D e v i c e V i e w s P h y s i c a l D e v i c e V i e w
D e v i c e M a n a g e m e n t Page 19 N B R S e r i e s
Logical Gauge area of the Logical Interface Icon. For more information, refer to the SPECTRUM Views documentation.
Physical Device ViewThis section describes the module information available from the NBR-620 Physical Device View, which displays a physical representation of the NBR-620 module. Figure 7 provides an example of an NBR-620 Physical Device View.
From the Icon Subviews menu for the NBR-620 device icon, select Device -> Physical.
Figure 7: NBR-620 Physical Device View
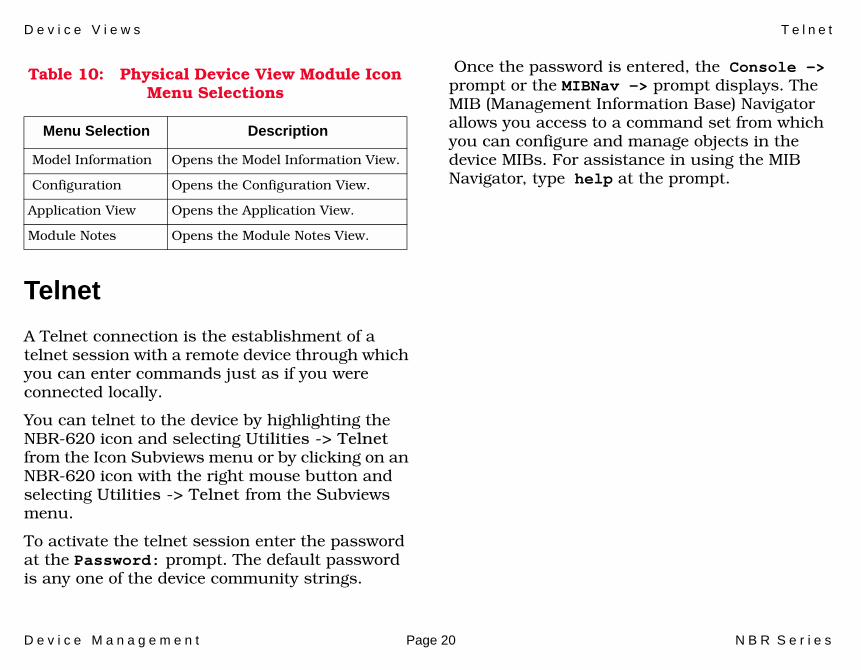
The menu available from the NBR-620 module icon in the NBR-620 Physical Device View is described in Table 10, excluding the generic menu options such as Navigate, Utilities, Notes and Alarms.
* File View Help?
Primary Landscape 0x00400000 - VNM eskimo - NBR620 of
NBR-620 MULTI PORT BRIDGE ROUTER WITH
PORT B PORT A
RCVTRSCOLSTDBY
PW
CO B A
Model ContactDescrip-Location
Net Addr
Prime-
Sys Up Manufac-Device
Serial
COPORT CPORT D
D e v i c e V i e w s T e l n e t
D e v i c e M a n a g e m e n t Page 20 N B R S e r i e s
Telnet
A Telnet connection is the establishment of a telnet session with a remote device through which you can enter commands just as if you were connected locally.
You can telnet to the device by highlighting the NBR-620 icon and selecting Utilities -> Telnet from the Icon Subviews menu or by clicking on an NBR-620 icon with the right mouse button and selecting Utilities -> Telnet from the Subviews menu.
To activate the telnet session enter the password at the Password: prompt. The default password is any one of the device community strings.
Once the password is entered, the Console -> prompt or the MIBNav -> prompt displays. The MIB (Management Information Base) Navigator allows you access to a command set from which you can configure and manage objects in the device MIBs. For assistance in using the MIB Navigator, type help at the prompt.
Table 10: Physical Device View Module Icon Menu Selections
Menu Selection Description
Model Information Opens the Model Information View.
Configuration Opens the Configuration View.
Application View Opens the Application View.
Module Notes Opens the Module Notes View.
D e v i c e M a n a g e m e n t Page 21 N B R S e r i e s
Configuration Views
This section describes configuration views available for NBR devices in SPECTRUM.
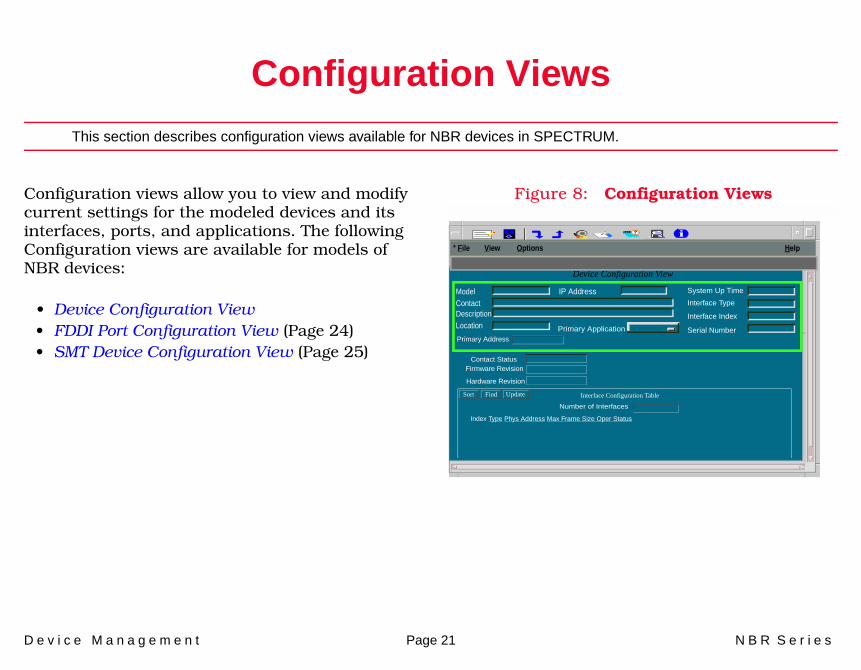
Configuration views allow you to view and modify current settings for the modeled devices and its interfaces, ports, and applications. The following Configuration views are available for models of NBR devices:
• Device Configuration View• FDDI Port Configuration View (Page 24)• SMT Device Configuration View (Page 25)
Figure 8: Configuration Views
Primary Application
System Up Time
Interface Type
Interface Index
Serial Number
IP AddressModel ContactDescriptionLocation
* File View Help Options
Contact Status
Primary Address
Number of Interfaces
Device Configuration View
Interface Configuration TableSort Find Update
Index Type Phys Address Max Frame Size Oper Status
i
Firmware Revision
Hardware Revision

C o n f i g u r a t i o n V i e w s D e v i c e C o n f i g u r a t i o n V i e w
D e v i c e M a n a g e m e n t Page 22 N B R S e r i e s
Device Configuration ViewAccess: From the Icon Subviews menu for the device icon, select Configuration.
This view provides status and configuration information about the device as a whole as well as on a port-by-port basis. It also provides button access to an Interface Address Translation table and to a subview that lets you establish redundancy for the model. Fields and column headings within the Device Configuration view and its subviews are explained in detail in the SPECTRUM Views documentation.
The Device Configuration View provides the following information:
Contact StatusThis field indicates if a connection with the device has been established.
Firmware RevisionThe firmware revision for the device being modeled.
Hardware RevisionThe hardware revision for the device being modeled.
Interface Configuration TableThe Interface Configuration Table provides the following configuration information for each of the NBR-620’s ports:
Number of InterfacesThe number of interfaces available from this device.
IndexThe number of the interface.
TypeThe type of hardware interface for the port. Possible interface types and a brief description of each type are shown in Table 11.
Phy AddressThe Ethernet (MAC) address of the port.
Max Frame SizeThe maximum frame size for the NBR-620 interfaces.
Oper StatusThe current operational state of this port (Up, Down, or Testing).

C o n f i g u r a t i o n V i e w s D e v i c e C o n f i g u r a t i o n V i e w
D e v i c e M a n a g e m e n t Page 23 N B R S e r i e s
Table 11: NBR-620 Interface Types
Interface Type Description
other None of the following
regular1822 Regular 1822
hdh1822 HDLC Distant Host protocol
ddn-X25 Defense Data Network X.25
rfc877-x25 RFC877 X.25
ethernet-csmacd Ethernet CSMA/CD
iso88023-csmacd ISO CSMA/CD
iso88024-tokenRing ISO token bus
iso88025-tokenRing ISO token ring
iso88026-man ISO man
starLan StarLAN IEEE 802.3
proteon-10Mbit ProNET 10 Mbps
proteon-80Mbit ProNET 80 Mbps
fddi Fiber Distributed Data Interface
lapb X.25 Line Access Procedure, Balanced
sdlc IBM Synchronous Data Link Control protocol
ds1 T1 link (USA and Japan)
e1 T1 link (Europe)
basicISDN Basic Integrated Services Digital Network
primaryISDN Proprietary Integrated Services Digital Network
propPointToPointSerial Proprietary Point to Point Serial
ppp Point to Point protocol
softwareLoopback Software Loopback
eon Connectionless Network Protocol over IP
ethernet-3Mbit Ethernet 3 Mbps
nsip Xerox Network Service Protocol over IP
slip Generic Serial Line IP
ultra ULTRA Technologies
sip Switched Multimegabit Data Service
frame-relay T1 Frame relay
Table 11: NBR-620 Interface Types
C o n f i g u r a t i o n V i e w s F D D I P o r t C o n f i g u r a t i o n V i e w
D e v i c e M a n a g e m e n t Page 24 N B R S e r i e s
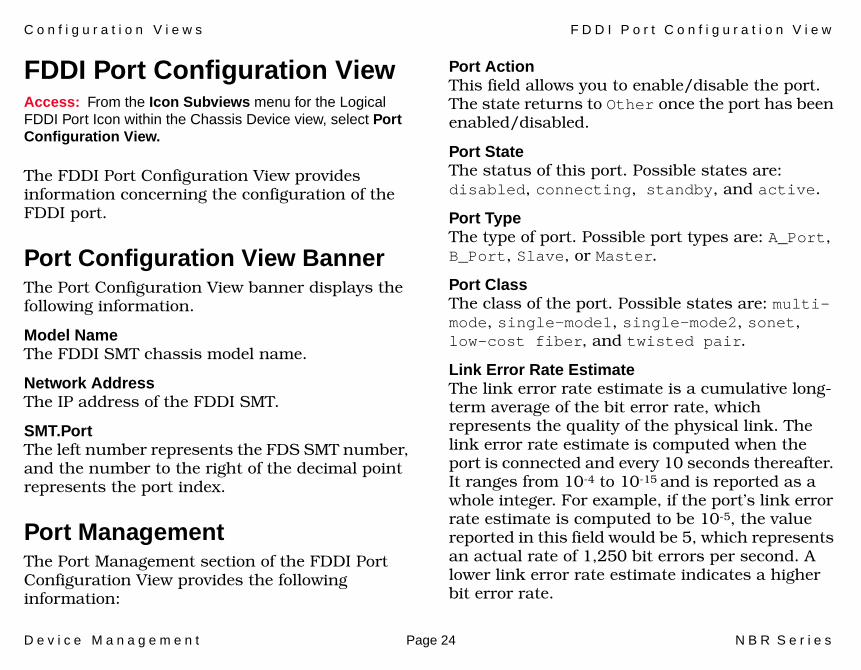
FDDI Port Configuration ViewAccess: From the Icon Subviews menu for the Logical FDDI Port Icon within the Chassis Device view, select Port Configuration View.
The FDDI Port Configuration View provides information concerning the configuration of the FDDI port.
Port Configuration View BannerThe Port Configuration View banner displays the following information.
Model NameThe FDDI SMT chassis model name.
Network AddressThe IP address of the FDDI SMT.
SMT.PortThe left number represents the FDS SMT number, and the number to the right of the decimal point represents the port index.
Port ManagementThe Port Management section of the FDDI Port Configuration View provides the following information:
Port ActionThis field allows you to enable/disable the port. The state returns to Other once the port has been enabled/disabled.
Port State The status of this port. Possible states are: disabled, connecting, standby, and active.
Port TypeThe type of port. Possible port types are: A_Port, B_Port, Slave, or Master.
Port ClassThe class of the port. Possible states are: multi-mode, single-mode1, single-mode2, sonet, low-cost fiber, and twisted pair.
Link Error Rate EstimateThe link error rate estimate is a cumulative long-term average of the bit error rate, which represents the quality of the physical link. The link error rate estimate is computed when the port is connected and every 10 seconds thereafter. It ranges from 10-4 to 10-15 and is reported as a whole integer. For example, if the port’s link error rate estimate is computed to be 10-5, the value reported in this field would be 5, which represents an actual rate of 1,250 bit errors per second. A lower link error rate estimate indicates a higher bit error rate.

C o n f i g u r a t i o n V i e w s S M T D e v i c e C o n f i g u r a t i o n V i e w
D e v i c e M a n a g e m e n t Page 25 N B R S e r i e s
Link Error Monitor CountThe aggregate link error monitor count. This count is set to zero on station power up and increments each time the port’s link error monitor detects an error. An increasing link error monitor count usually indicates a problem with the connectors or the cable between this port and the node.
Link Error Rate CutoffThe link error rate threshold at which a link connection is flagged as faulty and the port disabled by SMT. The default link error rate cutoff threshold is 7, which represents 12.5 bit errors per second. This value can be changed.
Link Error Rate AlarmThe link error rate threshold which, if exceeded generates an alarm for the port. The default link error rate alarm threshold is 8, which represents 1.25 bit errors per second. This value can be changed.
Link Error Monitor Reject CountThe link error monitor count of the times the link has been rejected.
SMT Device Configuration ViewAccess: From the Icon Subviews menu of the FddiSMT Application Icon in the Application View, select Configuration
The SMT Device Configuration View provides information on the configuration and operating status of the concentrator.
Station Configuration ViewThis section of the SMT Device Configuration View provides configuration information on the FDDI station. This configuration information is as follows:
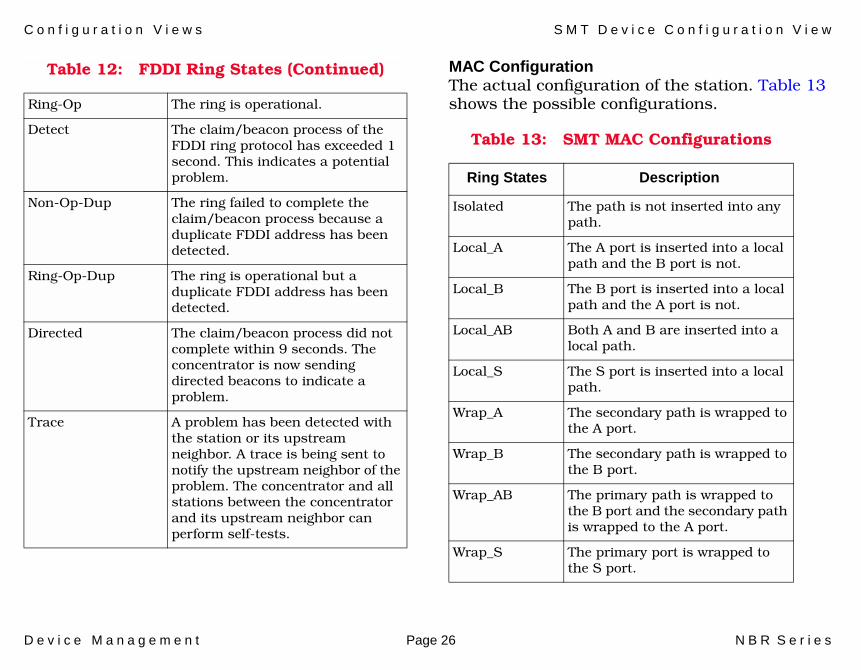
Ring StateThe current state of the FDDI Ring. Table 12 provides the possible states.
Table 12: FDDI Ring States
Ring States Description
Isolated The concentrator is not attached to the ring.
Non-Op The concentrator is attempting to enter the ring.
C o n f i g u r a t i o n V i e w s S M T D e v i c e C o n f i g u r a t i o n V i e w
D e v i c e M a n a g e m e n t Page 26 N B R S e r i e s
MAC ConfigurationThe actual configuration of the station. Table 13 shows the possible configurations. Ring-Op The ring is operational.
Detect The claim/beacon process of the FDDI ring protocol has exceeded 1 second. This indicates a potential problem.
Non-Op-Dup The ring failed to complete the claim/beacon process because a duplicate FDDI address has been detected.
Ring-Op-Dup The ring is operational but a duplicate FDDI address has been detected.
Directed The claim/beacon process did not complete within 9 seconds. The concentrator is now sending directed beacons to indicate a problem.
Trace A problem has been detected with the station or its upstream neighbor. A trace is being sent to notify the upstream neighbor of the problem. The concentrator and all stations between the concentrator and its upstream neighbor can perform self-tests.
Table 12: FDDI Ring States (Continued)
Table 13: SMT MAC Configurations
Ring States Description
Isolated The path is not inserted into any path.
Local_A The A port is inserted into a local path and the B port is not.
Local_B The B port is inserted into a local path and the A port is not.
Local_AB Both A and B are inserted into a local path.
Local_S The S port is inserted into a local path.
Wrap_A The secondary path is wrapped to the A port.
Wrap_B The secondary path is wrapped to the B port.
Wrap_AB The primary path is wrapped to the B port and the secondary path is wrapped to the A port.
Wrap_S The primary port is wrapped to the S port.
C o n f i g u r a t i o n V i e w s S M T D e v i c e C o n f i g u r a t i o n V i e w
D e v i c e M a n a g e m e n t Page 27 N B R S e r i e s
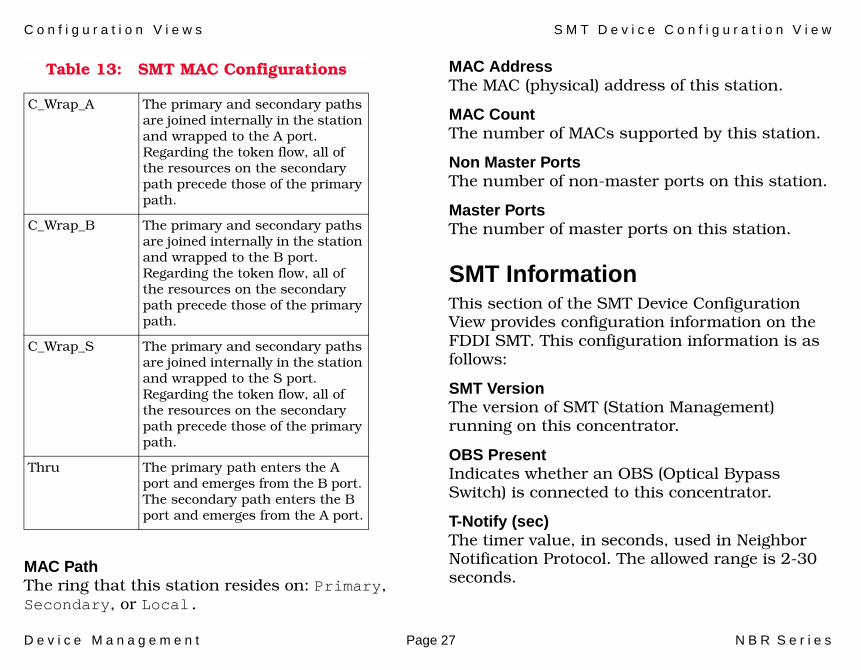
MAC Path The ring that this station resides on: Primary, Secondary, or Local.
MAC AddressThe MAC (physical) address of this station.
MAC CountThe number of MACs supported by this station.
Non Master PortsThe number of non-master ports on this station.
Master PortsThe number of master ports on this station.
SMT InformationThis section of the SMT Device Configuration View provides configuration information on the FDDI SMT. This configuration information is as follows:
SMT VersionThe version of SMT (Station Management) running on this concentrator.
OBS PresentIndicates whether an OBS (Optical Bypass Switch) is connected to this concentrator.
T-Notify (sec)The timer value, in seconds, used in Neighbor Notification Protocol. The allowed range is 2-30 seconds.
C_Wrap_A The primary and secondary paths are joined internally in the station and wrapped to the A port. Regarding the token flow, all of the resources on the secondary path precede those of the primary path.
C_Wrap_B The primary and secondary paths are joined internally in the station and wrapped to the B port. Regarding the token flow, all of the resources on the secondary path precede those of the primary path.
C_Wrap_S The primary and secondary paths are joined internally in the station and wrapped to the S port. Regarding the token flow, all of the resources on the secondary path precede those of the primary path.
Thru The primary path enters the A port and emerges from the B port. The secondary path enters the B port and emerges from the A port.
Table 13: SMT MAC Configurations

C o n f i g u r a t i o n V i e w s S M T D e v i c e C o n f i g u r a t i o n V i e w
D e v i c e M a n a g e m e n t Page 28 N B R S e r i e s
T-Req (milli sec)The TTRT (Target Token Rotation Time) bid, in milliseconds, made by this concentrator.
T-Neg (milli sec)The winning TTRT bid, in milliseconds, on the ring.
TVX (milli sec)The valid transmission time, in milliseconds.
Router RedundancyRouter Redundancy enables SPECTRUM to contact the device through an alternate port in the event of a primary port failure. See the SPECTRUM Views documentation for further information.

D e v i c e M a n a g e m e n t Page 29 N B R S e r i e s
Performance Views
This section provides brief descriptions of the Performance views available for the NBR devices in SPECTRUM.
Performance views display performance statistics in terms of a set of transmission attributes, e.g., cell rates, frame rates, % error, etc. A typical view is shown in Figure 9. The instantaneous condition of each transmission attribute is recorded in a graph. The statistical information for each attribute is presented in the adjacent table.
Generally, you determine performance at the device level through Performance views accessed from the Device and Application icons. You determine performance at the port/interface level through Performance views accessed from Interface icons.
For more information on Performance views, refer to the SPECTRUM Views documentation.
The following paragraphs list the performance attributes displayed for each Performance view supported by this management module.
Figure 9: Performance View
Log
100.0
10.00
1.00
0.10
0.01
000:40:0 0:30:0 0:20:0
Value Average Peak Value
Frame Rate
Errors
Graph Properties Scroll to Date-Time
SpectroGRAPH:
Primary Application
System Up TimeManufacturer
Device Type
Serial Number
Network Address
Load
NameContactDescriptionLocation
File View Help
Primary Address
Tools Bookmarks
Bridging of type of Landscape IP_Address:Primary
Errors
Frames

P e r f o r m a n c e V i e w s D e v i c e P e r f o r m a n c e V i e w
D e v i c e M a n a g e m e n t Page 30 N B R S e r i e s
Device Performance ViewAccess: From the Icon Subviews menu for the Device icon, select Performance.
Current and historical frame transmission information is provided via the following attributes.
• Frame Rate• % Delivered• % Forwarded• % Transmit• % Error• % Discarded
Port Performance ViewAccess: From the Icon Subviews menu for the Device Interface icon, select Performance.
Current and historical packet transmission information is provided via the following attributes.
• Load• Packet Rate• % Error• % Discarded

D e v i c e M a n a g e m e n t Page 31 N B R S e r i e s
Application Views
This section describes the main Application view and the associated application-specific subviews available for models of NBR devices in SPECTRUM.
When a device model is created, SPECTRUM automatically creates models for each of the major and minor applications supported by the device. The Application view identifies all of these application models, shows their current condition status, and provides access to application-specific subviews.
Figure 10 shows an Application view in its default mode (Icon) where each of the application models. is represented by an Application icon (see Figure for a close-up). The Application icons are arranged hierarchically under a Device icon, with major applications in the top row and their respective minor applications stacked directly below. If you prefer to see applications displayed by name only, in a single vertical list, select View > Mode > List.
Figure 10: Main Application View
JK2 of type of Landscape node: Primary
Model Name
Contact
Description
Location Primary Application
System Up Time
Manufacturer
Device Type
Serial Number
Network Address
02_Routing
GenRtrApp
File View HelpTools
JK2
BRtrCSINBr620
IP Routing
IP2RtrApp
JK2_MIB-II
MP2-Agent
JK2_ICMP
ICMP_App
JK2_TFTP
MotTFTPApp
MotTFTPApp
ConfigApps
ConfigApps
MotConfigApps
Bridge App
JK2_CSIS
MotCSISApp
MotCSISApp
BWMgmtA
BWMgmtApp
BWMgmtApps
JK2_DC_Ap
MotDCApp
MotDCApp
ce Routing
JK2 Static
Transparen
GenRtrApp
ce_Rtr_App
Static_App
arent_App
SNMP2_Agent
ICMPApp
System2_App
UDP2_App
JK2_System
JK2_UDP2
System2_App
UDP2_App
Bookmarks
i
SpectroGRAPH: :

A p p l i c a t i o n V i e w s
D e v i c e M a n a g e m e n t Page 32 N B R S e r i e s
Application IconsWhen the Application view is in Icon mode, each of the application models is represented by an Application icon. Double -clicking the Model Name label (a) at the top of the icon opens the associated Model Information view--see. For some applications, the Model Type label (c) at the bottom of the icon is also a double-click zone, which opens an application-specific view. Any views accessible through these double-click zones are also accessible from the Application icon’s Icon Subviews menu.
Figure 11: Application Icon
Supported ApplicationsNBR devices support both common and device-specific applications.
Applications that are common to many of the different kinds and makes of devices managed by SPECTRUM are listed in Table 14 along with the corresponding documentation topics.
The views and subviews available for NBR device-specific applications are described in the rest of
Note:Note:
The FDDI application appears only if a BRIM-F6 is inserted in the NBR-620.
a Model Name Label / Model Information View
b Condition Status Label
c Model Type Label / Application-Specific View
(a)
(b)
(c)
MotLANApps
JK_LANApps
MotLANApps

A p p l i c a t i o n V i e w s
D e v i c e M a n a g e m e n t Page 33 N B R S e r i e s
this sections, grouped by major application as listed below:
Table 14: Common Applications
Application For more info, see...
Routing (GenRtrApp) Miscellaneous Applications.
Standard RMON (RMON App)
Miscellaneous Applications.
Bridging (GenBridging App)
Bridging Applications.
Ethernet (EthernetApp)
Miscellaneous Applications.
FDDI (FddiSMT) Miscellaneous Applications
MIB-II (SNMP2_Agent)
MIB-II Applications
Note:Note:
If there is an Uninterrupted Power Supply (UPS) connected to your device, CtUPS_App will show as a major software application.

D e v i c e M a n a g e m e n t Page 34 N B R S e r i e s
Model Information View
This section provides a brief overview of the Model Information view.
This view displays administrative information about the device and its applications and lets you set thresholds and alarm severity for the device.
Figure 12 shows a sample Model Information view. The layout of this view is the same for all model types in SPECTRUM but some information will vary depending on the model it defines. Refer to SPECTRUM Views for a complete description of this view.
Figure 12: Model Information View
Primary Application
System Up Time
Manufacturer
Device Type
Serial Number
Network AddressModel Name
ContactDescription
Location
MM Version Number
MM Name
MM Part Number
General Information
Model Created By
Model Type
Model Creation Time
Model State
Security String
Communication Information
Community Name
DCM TimeOut
DCM Retry
Poll/Log Information
Poll Interval
Polling StatusCondition
Condition Value
Contact Status
Lost Child Count
Value When Yellow
Value When Orange
Value When Red
Last Successful Poll
Log Ratio
LOGGED POLLED
Model Information View
SpectroGRAPH: Model Name
File View Tools Bookmarks Help
type Model Type NBR620 of Landscape: Primary

D e v i c e M a n a g e m e n t Page 35 N B R S e r i e s
Index
Symbols% Discarded 17% Error 17% Host Bound 17% Transmitted 17
AA_Port 24ACT 12Active 12ADDRESS 18Admin. Status 15Administrative Status
Label 15
BB_Port 24Basic
Integrated Services Digital Network 16
BasicISDN 16BLK 13
Bridging/Routing Interface Module 5
BRIMs 5A6 5E6 5T6 5W6 5
BRKN 13BRtrCSINBR620 5
CC_Wrap
A 27B 27S 27
CEPT 16Change
Time Scale Button 18Channel
PerformanceView 28
Chassis Device View 9CLNPoverIP 16CON 12Connecting 12
Connectionless Network Protocol Over IP 16
ContactStatus 22
DDDNX25 15Defense Data Network X.25 15Detect 26Device 9
Configuration View 22Topology View
Label 15Directed 26DIS 12Disabled 12
EEnet3MB 16EPIMs 5Ethernet 15
3 Mbps 16CSMA/CD 15
I n d e x I n d e x
D e v i c e M a n a g e m e n t Page 36 N B R S e r i e s
FFDDI 16
ModulePort
Status 12Performance
View 28Fiber Distributed Data Interface 16Find 18Firmware
Revision 22FrameRelay 16FWD 13
GGauge
Control Panel 18Type 19
GenericSerial Line IP 16
Green 18
HHardware Revision 22HDH1822 15HDLC Distant Host protocol 15HyChan 16
Hyperchannel 16
IIBM Synchronous Data Link
Control Protocol 16IF Description 15In
Load 18Packet
Rate 17Index 22Intelligent
Bridging Module 5Interface
Configuration Table 22Description 18Device View 14Index 15Number Label 15Options Panel 18Performance View Label 17Type 15
ISOCSMA/CD 15Man 15Token
Bus 15Ring 15
ISO88023 15ISO88024 15
ISO88025 15ISO88026 15Isolated 25, 26
KKeep Settings Button 19
LLAPB 16Linear
Scale 18Link
ErrorMonitor
Count 25Reject Count 25
RateAlarm 25Cutoff 25Estimate 24
LocalA 26AB 26B 26S 26
LogarithmicScale 18
Logical
I n d e x I n d e x
D e v i c e M a n a g e m e n t Page 37 N B R S e r i e s
FDDI Port Icon 14Gauge 19
Label 17Interface Icon 18Repeater
Port Icon 14low-cost fiber 24LRN 13LSTN 13Lt.
Blue 17Green 18
MMAC 26
Address 27Label 16
Count 27Path 27
MASK 18Master 24
Ports 27Max
Frame Size 22Model
Name 24Module
Type 11Multi-Attribute Line Graph 17
Buttons 18
multi-mode 24Mustard Green 18
NNAME 18NBR-620
Device Configuration View 22Neighbor Notification Protocol 27Network
Address 24Information 18
Network Address Label 16Network Information Panel 16Non Master Ports 27Non-Op 25
Dup 26Number of
Interfaces 22
OOBS Present 27OFF 13Oper Status 22Operation Status 15Optical Bypass Switch 27Orange 17Other 15Out
Load 18Packet
Rate 17
PPhy Address 22Point to Point Protocol 16Port
Action 24Configuration
ViewBanner 24Label 15
Management 24State 24Type 24
Label 15Port Class 24PPP 16PPSerial 16PrimISDN 16ProNET
10 Mbps 1680 Mbps 16
ProprietaryIntegrated Services Digital
Network 16Point to Point Serial 16
Prot10MB 16Prot80MB 16
I n d e x I n d e x
D e v i c e M a n a g e m e n t Page 38 N B R S e r i e s
RRed 17Redundancy, Router 28Reg1822 15Regular 1822 15RFC877 X.25 15Ring
State 25Ring-Op 26
Dup 26Router
Redundancy 28Royal Blue 17
SSBY 12Scroll to Date-Time Button 18SDLC 16SFTWARLPBK 16single-mode1 24single-mode2 24Slave 24SLIP 16SMDS 16SMT
Device Configuration View 25Information 27Version 27
SMT.Port 24
SoftwareLoopback 16
sonet 24Standby 12StarLan 16StarLAN IEEE 802.3 16Station
Configuration View 25Management 27
StatisticsRouting Frame Transmission 29
Switched Multimegabit Data Service 16
TT1 16
Frame relay 16Link 16
T-3 16T3 link 16Target Token Rotation Time 28Telnet 20
Connections 20Session Activation 20
Thru 27T-Neg 28T-Notify 27Total
Load 18Packet Rate 17
Trace 26T-Req 28TTRT 28Turquoise 17TVX 28twisted pair 24Type 22
UULTRA 16
Technologies 16
VValid Transmission Time 28
WWhite 17Wrap
A 26AB 26B 26S 26
I n d e x I n d e x
D e v i c e M a n a g e m e n t Page 39 N B R S e r i e s
XX.25 Line Access Procedure 16Xerox Network Service Protocol over
IP 16XNSoverIP 16
YYellow 17