Generic Host (9031570-02) -...
42
Generic Host SPECTRUM Enterprise Manager Device Management Supports Management Module SM-GHO1000 Titlepae Titlepae Titlepae Titlepae
-
Upload
truongthuy -
Category
Documents
-
view
220 -
download
0
Transcript of Generic Host (9031570-02) -...

Generic Host
SPECTRUM Enterprise ManagerDevice Management
Supports Management Module SM-GHO1000
TitlepaeTitlepaeTitlepaeTitlepae

S P E C T R U M E n t e r p r i s e M a n a g e r Page 2 G e n e r i c H o s t
NoticeAprisma Management Technologies, Inc. (Aprisma), reserves the right to makechanges in specifications and other information contained in this document withoutprior notice. The reader should in all cases consult Aprisma to determine whetherany such changes have been made.
The hardware, firmware, or software described in this manual is subject to changewithout notice.
IN NO EVENT SHALL APRISMA, ITS EMPLOYEES, OFFICERS, DIRECTORS,AGENTS, OR AFFILIATES BE LIABLE FOR ANY INCIDENTAL, INDIRECT,SPECIAL, OR CONSEQUENTIAL DAMAGES WHATSOEVER (INCLUDING BUTNOT LIMITED TO LOST PROFITS) ARISING OUT OF OR RELATED TO THISMANUAL OR THE INFORMATION CONTAINED IN IT, EVEN IF APRISMA HASBEEN ADVISED OF, KNOWN, OR SHOULD HAVE KNOWN, THE POSSIBILITYOF SUCH DAMAGES.
Copyright © January 2001 by Aprisma Management Technologies. All rightsreserved.
Printed in the United States of America.
Order Number: 9031570-02
Aprisma Management Technologies, Inc.121 Technology DriveDurham NH 03824
SPECTRUM, the SPECTRUM IMT/VNM logo, DCM, IMT, and VNM are registeredtrademarks, and SpectroGRAPH , SpectroSERVER , Inductive ModelingTechnology , Device Communications Manager , and Virtual Network Machineare trademarks of Aprisma or its affiliates.
Ethernet is a trademark of Xerox Corporation.
Virus DisclaimerAprisma makes no representations or warranties to the effect that the LicensedSoftware is virus-free.
Aprisma has tested its software with current virus checking technologies. However,because no anti-virus system is 100% reliable, we strongly caution you to writeprotect and then verify that the Licensed Software, prior to installing it, is virus-freewith an anti-virus system in which you have confidence.
Restricted Rights Notice(Applicable to licenses to the United States Government only.)
1. Use, duplication, or disclosure by the Government is subject to restrictions asset forth in subparagraph (c) (1) (ii) of the Rights in Technical Data andComputer Software clause at DFARS 252.227-7013.
Aprisma Management Technologies, Inc., 121 Technology Drive NH 03824
2. (a) This computer software is submitted with restricted rights. It may not beused, reproduced, or disclosed by the Government except as provided inparagraph (b) of this Notice or as otherwise expressly stated in the contract.
(b) This computer software may be:
(1) Used or copied for use in or with the computer or computers for whichit was acquired, including use at any Government installation to whichsuch computer or computers may be transferred;
(2) Used or copied for use in a backup computer if any computer for whichit was acquired is inoperative;
(3) Reproduced for archival or backup purposes;
(4) Modified, adapted, or combined with other computer software, providedthat the modified, combined, or adapted portions of the derivativesoftware incorporating restricted computer software are made subjectto the same restricted rights;
(5) Disclosed to and reproduced for use by support service contractors inaccordance with subparagraphs (b) (1) through (4) of this clause,provided the Government makes such disclosure or reproductionsubject to these restricted rights; and
(6) Used or copied for use in or transferred to a replacement computer.
(c) Notwithstanding the foregoing, if this computer software is publishedcopyrighted computer software, it is licensed to the Government, withoutdisclosure prohibitions, with the minimum rights set forth in paragraph (b) ofthis clause.
(d) Any other rights or limitations regarding the use, duplication, or disclosureof this computer software are to be expressly stated in, or incorporated in,the contract.
(e) This Notice shall be marked on any reproduction of this computer software, inwhole or in part.

S P E C T R U M E n t e r p r i s e M a n a g e r Page 3 G e n e r i c H o s t
ContentsINTRODUCTION 5
Purpose and Scope ........................................................5Required Reading ...........................................................5Supported Devices..........................................................6The SPECTRUM Model ..................................................6
TASKS 8
DEVICE VIEW 9
Interface Icons ..............................................................10Interface Icon Subviews Menu ..................................11Interface Status View.................................................12Secondary Address Panel .........................................12
DEVICE TOPOLOGY VIEW 13
APPLICATION VIEWS 14
Main Application View...................................................14Common applications ................................................15Device-Specific Applications .....................................15
LAN Manager Application .............................................16System Configuration View .......................................16Server View ...............................................................16Workstation View.......................................................17
Host Resources Application..........................................18System Information View...........................................18
Storage Table............................................................ 18Device Table ............................................................. 19Processor Table ........................................................20Network Table ........................................................... 20Printer Table.............................................................. 21Partition Table ........................................................... 21File System Table......................................................22Running Software Table............................................ 23Running Software Performance Table ...................... 24Installed Software Table............................................ 24
ATM User Application ................................................... 25Connection Table ......................................................25
IBM Unix Application..................................................... 26System Information View...........................................26MBuf Information Table .............................................26User Table.................................................................26IBM Unix Information Table....................................... 27
HPUX Application ......................................................... 28System Information View...........................................28Cluster Table ............................................................. 29File Systems Table.................................................... 29ieee 802.3 MAC Table............................................... 29Trap Destinations Table ............................................ 30Process Table ........................................................... 30Configuration Table ................................................... 30
Ethernet Application......................................................31

C o n t e n t s C o n t e n t s
S P E C T R U M E n t e r p r i s e M a n a g e r Page 4 G e n e r i c H o s t
PERFORMANCE VIEWS 33
Device Performance View.............................................34Port Performance View .................................................34
CONFIGURATION VIEWS 35
Device Configuration View............................................36Interface Configuration Table ....................................36
Interface Configuration View.........................................37Fore User Application Configuration View ....................37
MODEL INFORMATION VIEW 39
INDEX 40

S P E C T R U M E n t e r p r i s e M a n a g e r Page 5 G e n e r i c H o s t
Introduction
This section introduces the SPECTRUM Device Management documentation for the third party PCs andworkstations defined herein.
This introduction contains the following topics:
• Purpose and Scope
• Required Reading
• Supported Devices
• The SPECTRUM Model
Purpose and ScopeUse this document as a guide for managing the third party PCs and workstations listed in Table 1 using the SPECTRUM Management Modules also listed in the table.
This document describes the icons, menus, and views that enable you to remotely monitor,
configure, and troubleshoot the devices through software models in your SPECTRUM database.
Information specific to the Management Modules listed in Table 1 is what is primarily included in this document. For general information about device management using SPECTRUM and explanations of SPECTRUM functionality and navigation techniques, refer to the topics listed under Required Reading.
Required ReadingTo use this documentation effectively, you must be familiar with the information covered by the other SPECTRUM online documents listed below.
• Getting Started with SPECTRUM for Operators
• Getting Started with SPECTRUM for Administrators
Note:Note:
For simplicity in this guide, the PCs and workstations are referred to collectively as the devices.

I n t r o d u c t i o n S u p p o r t e d D e v i c e s
S P E C T R U M E n t e r p r i s e M a n a g e r Page 6 G e n e r i c H o s t
• How to Manage Your Network with SPECTRUM
• SPECTRUM Views
• SPECTRUM Menus
• SPECTRUM Icons
• SPECTRUM Software Release Notice
Supported DevicesTable 1 provides a cross reference for the third party PCs and workstations and their associated SPECTRUM model types and management modules.
The SPECTRUM ModelThe model types are listed in Table1.
Modeling results in the creation of Device icons that represent the devices and Application icons that represent their supported applications.
The Device icons contain double-click zones and provide access to Icon Subviews menus that let you perform device management activities such as those listed in Tasks on Page 8.
As Figure 1 shows, the appearance of the Device icons varies slightly depending on the kind of view it appears in.
Figure 1: Device IconsTable 1: Devices, Model Types, and Modules
Model Type PC/Workstation ManagementModule
GenericHost Any device not listed below SM-GHO1000
Host_Sun SUN SM-GHO1001
Host_SGI Silicon Graphics SM-GHO1002
Host_HP Hewlett Packard SM-GHO1003
Host_NT Microsoft NT SM-GHO1004
Host_IBM IBM SM-GHO1005
Host_DEC DEC SM-GHO1006
Small Device Icon appearsin Topology and Applications views
Large Device Icon appears inDevice Topology, Location, andDevice Interface views

I n t r o d u c t i o n T h e S P E C T R U M M o d e l
S P E C T R U M E n t e r p r i s e M a n a g e r Page 7 G e n e r i c H o s t
The device-specific Icon Subviews menu options that are typically available from the Device icon are listed below.
The rest of this document is organized as follows:
• Tasks (Page 8)
• Device View (Page 9)
• Device Topology View (Page 13)
• Application Views (Page 14)
• Performance Views (Page 33)
• Configuration Views (Page 35)
• Model Information View (Page 39)
Option Accesses the...
Device Device View (Page 9)
Device Topology Device Topology View (Page 13)
Application Application Views (Page 14)
Configuration Configuration Views (Page 35)
Model Information
Model Information View (Page 39)
Primary Application
Menu options that let you select either Gen Bridge App or MIB-II as the primary application.

S P E C T R U M E n t e r p r i s e M a n a g e r Page 8 G e n e r i c H o s t
Tasks
This section contains an alphabetical list of device management tasks, with each task providing one or morelinks to views that let you perform the task.
ATM Connections Information (view)• Fore User Application Configuration View
(Page 37)• ATM User Application (Page 25)
Configuration Information (view)• Configuration Views (Page 35)
Device and Model Information (view)• Model Information View (Page 39)• Network Type Label (Page 11)
Device and Port Performance (check)• Performance Views (Page 33)• Device Configuration View (Page 36)• Interface Configuration View (Page 37)
HP Specific Information (view)• HPUX Application (Page 28)• Ethernet Application (Page 31)
IBM Specific Information (view)• IBM Unix Application (Page 26)
Interface Information (view)• Interface Icons (Page 10)
Interface Operation/Admin Status (check)• Interface Configuration Table (Page 36)• Interface Configuration View (Page 37)
NT Specific Information (view)• LAN Manager Application (Page 16)
SUN/Unix Specific Information (view)• Host Resources Application (Page 18)
Note:Note:
DEC and SGI information is not available since the Host_SGI and Host_DEC model types do not support device-specific applications.

S P E C T R U M E n t e r p r i s e M a n a g e r Page 9 G e n e r i c H o s t
Device View
This section describes the Device view and subviews available for models of the devices.
Access: From the Icon Subviews menu for the Deviceicon, select Device .
This view (Figure 2) uses icons and labels to represent the device and its components, such as modules, ports, and applications. The view provides dynamic configuration and performance information for each of the device’s serial and network I/O ports, which are represented by Interface icons in the bottom panel of the view. The middle panel of the view displays a Device icon, which lets you monitor the device operation and access other device-specific views.
Figure 2: Device View
Device of Type Host of Landscape Host: Primary
* File View Help?Options
NameContactDescriptionLocation
System Up TimeManufacturerDevice TypeSerial Number
Network Address
Primary Application
Interface Description
Filter PhysicalModel Name
Model Type
ETHERNET0:0:1:D:F:FD:B6
0
1 ON
172.19.59.76
Interface Icon
Device Icon

D e v i c e V i e w I n t e r f a c e I c o n s
S P E C T R U M E n t e r p r i s e M a n a g e r Page 10 G e n e r i c H o s t
Interface IconsFigure 3 shows a close-up of an Interface icon from the Device view. Most of the informational labels on the icon also provide double-click access to other views, as explained in the following label descriptions.
Figure 3: Interface Icon
Interface Number LabelThis label displays the interface (port) number.
IF Status LabelThis label displays the current status of the interface for the primary application selected, e.g., Gen Rtr App or MIB-II App. Table 2 lists the possible label color representations. Note that the color of the label also depends on the interface’s current Administrative Status, which you set in the Interface Status View (Page 12). This view can be accessed by double-clicking the label.
Interface Type LabelThis label identifies the interface type (Ethernet, ATM, etc.). Double-click this label to access the Interface Configuration View (Page 37).
c
fg
b
1ethernet
0:0:1D:F:FD:B6
1
a
a Interface Number Label
b IF Status Label
c Interface Type Label
d Network Type Label
e Physical Address Label
f IP Address Label
g Gauge Label
fxp0
0.0.0.0
d
e
ON Table 2: Interface Status Label Colors
Color OperationalStatus
AdministrativeStatus
LabelText
Green up up ON
Blue down down OFF
Yellow down up OFF
Red testing testing TEST

D e v i c e V i e w I n t e r f a c e I c o n s
S P E C T R U M E n t e r p r i s e M a n a g e r Page 11 G e n e r i c H o s t
Network Type LabelThis label identifies the type of network to which the interface is connected. Double-click the label to open the Model Information view for the interface.
Physical Address LabelThis label displays the physical (MAC) address of the interface. Double-click this label to open the IF Address Translation Table.
IP Address LabelThis label displays the IP address for the interface. Double-click this label to open the Secondary Address Panel (Page 12), which lets you change the address and mask for the interface.
Gauge LabelThis label displays whichever performance statistic has been selected in the Gauge Control Panel for this device’s interfaces. (Refer to the SPECTRUM Views documentation for information about the Gauge Control Panel.) Double-click this label to open the Port Performance View (Page 34).
Interface Icon Subviews MenuTable 3 lists the device-specific interface Icon Subviews menu options and the views to which they provide access.
Table 3: Interface Icon Subviews Menu
Option Accesses the...
Detail Interface Detail view, which displays packet, error, and discard breakdown statistics for the interface.
IF Status Interface Status View (Page 12).
IF Configuration Interface Configuration View (Page 37).
IF Address Translation Table
Interface Address Translation Table, which identifies the physical and network address for the interface.
Secondary Address Panel
Secondary Address Panel (Page 12).
Thresholds Interface Threshold view, which lets you set the on/off alarm thresholds for load, packet rate, error rate, and % discarded for the interface.
Model Information
Model Information View (Page 39).

D e v i c e V i e w I n t e r f a c e I c o n s
S P E C T R U M E n t e r p r i s e M a n a g e r Page 12 G e n e r i c H o s t
Interface Status ViewAccess: From the Icon Subviews menu for the Interfaceicon in the Device view, select IF Status .
This view provides information on the operational status of the interface and allows you to enable or disable the port.
Operational StatusThe current state of the interface (Up, Down, Unknown, Dormant , Not Present , Lower LayerDown, or Testing ).
This button allows you to select the desired administrative state of the interface (On, Off , or Testing ).
Secondary Address PanelAccess: From the Icon Subviews menu for the Interfaceicon in the Device view, select Secondary Address Panel .
This panel provides a table of IP addresses and masks obtained from the Address Translation table within the device’s firmware. You can change the current address displayed in the IP Address field by selecting an entry from the table in this panel and clicking the Update button.
Administrative Status

S P E C T R U M E n t e r p r i s e M a n a g e r Page 13 G e n e r i c H o s t
Device Topology View
This section describes the Device Topology view available for models of the devices.
Access: From the Icon Subviews menu for the Deviceicon, select Device Topology .
The Device Topology view (Figure 4) shows the connections between a modeled device and other network entities. The lower panel of the view uses Interface icons to represent the device’s serial, network, and I/O ports. These icons provide the same information and menu options as those in the Device View (Page 9). If a device is connected to a particular interface, a Device icon appears on the vertical bar above the Interface icon along with an icon representing the network group that contains the device.
Refer to the SPECTRUM Views documentation for details on Device Topology view.
Figure 4: Device Topology View
File View HelpTools
1Ethernet
0:0:1D:F:FD:B6ei0
0.0.0.0
ON 2ATM
0:0:1D:F:FD:B6A2
0.0.0.0
ON 3ATM
0:0:1D:F:FD:B6CPU
0.0.0.0
ON
Bookmarks
SpectroGRAPH: Device Topology: Model Name
Graphic of<manufacturer>
Device
Model Name of type Model Type of Landscape node: Primary

S P E C T R U M E n t e r p r i s e M a n a g e r Page 14 G e n e r i c H o s t
Application Views
This section describes the main Application view and the associated application-specific subviews available formodels of devices in SPECTRUM.
Access: From the Icon Subviews menu for the Deviceicon, select Application .
Main Application ViewWhen a device model is created, SPECTRUM automatically creates models for each of the major and minor applications supported by the device. The main Application view identifies all of these application models, shows their current condition status, and provides access to application-specific subviews. Figure 5 shows this view in the Icon mode. If you prefer the List mode, which displays applications as text labels, select View > Mode > List.
For more information on this view, refer to the MIBs and the Application View documentation.
Figure 5: Main Application View
SpectroGRAPH: Application: Model Name
Model Name
Contact
Description
Location
Network Address System Up Time
Manufacturer
Device Type
Serial Number
Model Name
6E132_25
Model Name
Model Type
File View Tools Bookmarks
Model Name of type <model type> of Landscape node: Primary
Help

A p p l i c a t i o n V i e w s M a i n A p p l i c a t i o n V i e w
S P E C T R U M E n t e r p r i s e M a n a g e r Page 15 G e n e r i c H o s t
Common applicationsThe following common application are described in MIB II Applications.
• MIB-II (SNMP2_Agent)
- ICMP (ICMP_App)- IP (IP2_App)- System (System2_App)- TCP (TCP2_App)- UDP (UDP2_App)
• Routing (GenRtrApp)
- IP Routing (IP2RtrApp
Device-Specific ApplicationsThe device-specific applications associated with the model types are listed below. They are described in the following sections of this guide.
• Host_NT Model Type
- Lan Manager (LanManager_App)
• Host_Sun Model Type
- Host Resources (rfc1514App)- ATM User (ForeUserApp)
• Host_HP Model Type
- Ethernet App (EthernetApp)- HPUX (HPUX_App)
• Host_IBM Model Type
- IBM Unix App (IBM_UnixApp)
Note:Note:
The Host_SGI and Host_DEC model types do not support device-specific applications.

A p p l i c a t i o n V i e w s L A N M a n a g e r A p p l i c a t i o n
S P E C T R U M E n t e r p r i s e M a n a g e r Page 16 G e n e r i c H o s t
LAN Manager ApplicationThis section describes the LAN Manager (LanManager_App) application, which lets you access detailed views of network information related to the Host_NT model type.
This application is based on Microsoft’s NT LAN Manager application and includes the following views and tables:
• System Configuration View• Server View• Workstation View• Model Information View
System Configuration ViewDisplay this view by highlighting the Application icon and selecting Configuration from the Icon Subviews menu. The following information is available.
Domain ViewDisplays statistics on your domain, other devices in your domain, and other workgroup domains.
Primary DomainDisplays information on your workstation domain.
Other DomainsDisplays information on other workgroup domains.
Server NumberLists server numbers of your domain and servers in other workgroup domains.
Server ViewThis view provides the following statistics on users, print jobs, and network activity on this workstation.
Queued JobsThe number of processes waiting to run.
Sys ErrorsDisplays the number of errors that have occurred.
Avg ResponseThe average response time the server takes to respond to a request.
# UsersThe number of users who are currently using the server.
Bytes SentThe number of bytes sent back to those who are using the server.

A p p l i c a t i o n V i e w s L A N M a n a g e r A p p l i c a t i o n
S P E C T R U M E n t e r p r i s e M a n a g e r Page 17 G e n e r i c H o s t
Rcvd BytesThe number of bytes received in requests.
SecurityA notification of whether a user is the only user or a group who share the resources.
ServicesThe number of services running on the device at any time. The table gives you the names of the users and the state of the server. Double-click the Name or State column to find out more about the state of any service.
Workstation ViewThis view provides the following information specific to the workstation.
Session StartsThe number of valid user sessions since the operating system was installed.
Session FailsThe number of times a user tried, but failed, to start a valid session since the operating system was installed.
UsesThe number of times a user has succeeded in using some other machine’s resources.
Use FailsThe number of times the user tried, but failed, to use some other machine’s resources.
Auto RecsInformation is unavailable.
Error Log SizeThe size of the error log, which is set at 16 kilobytes.
Use NumberThe number of users sharing the machine’s resources.
Print QueueThe number of processes waiting in the print queue.
Session Table ViewThe client name, time, idle, type, and state.
Shared Table ViewThe number of users sharing the machine, along with their names, paths, and comments.
UsersThe number of users on the machine.

A p p l i c a t i o n V i e w s H o s t R e s o u r c e s A p p l i c a t i o n
S P E C T R U M E n t e r p r i s e M a n a g e r Page 18 G e n e r i c H o s t
Host Resources ApplicationThis section describes the Host_Resources (rfc 1514) application, which lets you access detailed views of system and network information related to the Host_Sun model type.
The following views and tables are available:
• System Information View• Storage Table• Device Table • Processor Table• Network Table• Printer Table• Partition Table • File System Table• Running Software Table• Running Software Performance Table • Installed Software Table• Model Information View
System Information ViewThis view provides system and network configuration information. Display the view by highlighting the Application icon and selecting Configuration from the Icon Subviews menu.
Storage TableThis table shows the physical attributes (storage areas) of the workstation. The table can be useful in diagnosing such failures as out of memory and out of buffers. Additionally, it can be a useful performance monitoring tool for tracking memory, disk, or buffer usage. The following information is available in this table.
IndexA unique value for each logical storage area contained by the host. An entry is placed in the storage table for each logical area of storage that is allocated and that has fixed resource limits.
TypeThe type of storage represented by this entry.
DescriptionA description of the type and instance of the storage described by this entry.
Allocation UnitsThe size of the data objects allocated from this pool (measured in bytes). If sectors, buffers, or packets are being monitored (for example), this value will usually be greater than one.
SizeThe size of the storage area represented by this entry (measured in Allocation Units).

A p p l i c a t i o n V i e w s H o s t R e s o u r c e s A p p l i c a t i o n
S P E C T R U M E n t e r p r i s e M a n a g e r Page 19 G e n e r i c H o s t
Storage UsedThe amount of storage area represented by this entry that is allocated (measured in Allocation Units).
Allocation FailuresThe number of requests for storage represented by this entry that could not be granted because of insufficient storage area. This value uses a syntax of “Counter” in that it does not have a defined value. It is recommended that this value be initialized to zero.
Device TableThis table lists the following information for each device contained by the host.
IndexA unique device identifier, which must remain constant at least from one initialization of the agent to the next initialization.
TypeA value indicating the type of device. Values are described in Table 4.
DescriptionA description of the device, which includes the manufacturer’s name, product revision number, and (optionally) its serial number.
Device IDThe product ID for the device.
StatusThe current operational state of the device, described by the conditions listed in Table 5
Table 4: Type of Device
3 Corresponding entry exists for it in the Processor Table.
4 Corresponding entry exists for it in the Network Table.
5 Corresponding entry exists for it in the Printer Table.
6 Corresponding entry exists for it in the Disk Storage Table.

A p p l i c a t i o n V i e w s H o s t R e s o u r c e s A p p l i c a t i o n
S P E C T R U M E n t e r p r i s e M a n a g e r Page 20 G e n e r i c H o s t
ErrorsThe number of errors detected on the device. This value has a syntax of “Counter” and does not have a defined initial value. It is recommended that this value be initialized to zero.
Processor TableThis table lists the processes that are running in the host. The following information is available for each processor.
Firmware IDThe product ID of the firmware associated with the processor.
LoadThe average of the periods of time (over the last minute) that the processor was not idle, displayed as a percentage value.
Network TableThis table lists the network devices contained by the host. The following information is available for each device.
Interface IndexThe value of the interface index that corresponds to the network device.
Table 5: Operational Status Conditions
1 Unknown - The current state of the device is unknown.
2 Running - The device is up and running and no unusual error conditions are known.
3 Warning - The agent has been informed by the operational software (e.g., a disk device driver) that an unusual error condition exists (e.g., a high number of soft errors) but the device is still operational.
4 Testing - The device is not available for use because it is in the testing state.
5 Down - The agent has been informed that the device is not available for use.

A p p l i c a t i o n V i e w s H o s t R e s o u r c e s A p p l i c a t i o n
S P E C T R U M E n t e r p r i s e M a n a g e r Page 21 G e n e r i c H o s t
Printer TableThis table lists the following information about printers local to the host.
StatusThe current status of the printer. When the printer is in the Idle (1), Printing (2), or Warmup (3) state, the corresponding device state should be Running (2) or Warning (3). When in the Unknown state, the corresponding device state should be Unknown (1).
Detected Error StateThis value represents an error condition detected by the printer. (See Table 6.)
Partition TableThis table lists partitions for long-term storage devices contained by the host. Partitions accessed remotely over a network are not included. The following information is available.
IndexA unique value for each partition on the device, which must remain constant at least from one initialization of the agent to the next initialization.
LabelA description of the partition.
IDA descriptor that uniquely represents the partition to the responsible operating system. On some systems, this might take the form of a binary representation.
SizeThe size of the partition.
Table 6: Printer Error Conditions
Condition Bit # Device Status
Low Paper 0 Warning (3)
No Paper 1 Down (5)
Low Toner 2 Warning (3)
No Toner 3 Down (5)
Door Open 4 Down (5)
Jammed 5 Down (5)
Offline 6 Down (5)
Service 7 Warning (3)
Requested N/A N/A
Table 6: Printer Error Conditions
Condition Bit # Device Status

A p p l i c a t i o n V i e w s H o s t R e s o u r c e s A p p l i c a t i o n
S P E C T R U M E n t e r p r i s e M a n a g e r Page 22 G e n e r i c H o s t
File System IndexThe index of the file system mounted on the partition. If no file system is mounted, this value is zero. Multiple partitions may point to one file system, denoting that the file system resides on those partitions. However, multiple file systems may not reside on one partition.
File System TableThis table lists the file systems local to the host or remotely mounted from a file server. File systems that are in only one user’s environment on a multi-user system are not included in the table. The following information is available.
IndexA unique value for each file system, which must remain constant at least from one initialization of the agent to the next initialization.
Mount PointThe path name of the root of the file system.
Remote Mount PointA description, name, and/or address of the server from which the file system is mounted. This may also include such parameters as the mount point on the remote file system. If this is not a remote file system, the string should have a length of zero.
TypeThe value of this object that identifies the type of this file system.
AccessAn indication that shows if the file system is logically configured by the operating system to be read/write or read only. This does not represent any local access-control policy, except one that is applied to the file system as a whole.
BootableA flag that indicates if the file system is bootable.
Storage In(dex)The Storage/Entry index representing file system information. If there is no information available, the value is set to zero. This field is useful in tracking the percent usage of the file system and diagnosing errors that may occur when it runs out of space.
Last Full BackupThe last date when the complete file system was copied to another storage device for backup. This information is useful for ensuring that backups are being performed regularly. When this information is not known, the field displays the value corresponding to January 1, year 0000, 00:00:00.0.

A p p l i c a t i o n V i e w s H o s t R e s o u r c e s A p p l i c a t i o n
S P E C T R U M E n t e r p r i s e M a n a g e r Page 23 G e n e r i c H o s t
Last Partial BackupThe last date when a portion of the file system was copied to another storage device for backup. This information is useful for ensuring that backups are being performed regularly. When this information is not known, the field displays the value corresponding to January 1, year 0000, 00:00:00.0.
Running Software TableThis table contains an entry for each distinct piece of software that is running or loaded into physical or virtual memory in preparation for running. This includes the host’s operating system, device drivers, and applications. The following information is available in the table.
IndexA unique value for each piece of software running on the host. Wherever possible, this should be the system’s native, unique identification number.
NameA textual description of this running piece of software, which includes the manufacturer’s name, software revision, and name by which it is commonly known.
IDThe product ID of this running piece of software.
PathA description of the location on the long-term storage device (for example, a disk drive) from which this software was loaded.
ParametersA description of any parameters supplied to this software when it was initially loaded.
TypeThe type of this software (1=unknown, 2=operating system, 3=device driver, and 4=application).
StatusThe running status of this piece of software. Setting this value to 4 (which is not a valid setting) causes this software to stop running and to be unloaded. The possible values are 1=running, 2=runnable and awaiting a resource (CPU, memory, or I/O), 3=not runnable, and 4=not loaded.

A p p l i c a t i o n V i e w s H o s t R e s o u r c e s A p p l i c a t i o n
S P E C T R U M E n t e r p r i s e M a n a g e r Page 24 G e n e r i c H o s t
Running Software PerformanceTableThis table contains performance statistics for the running software. The following information is available.
IndexA unique number identifying the software.
NameA description of the installed software, including the manufacturer’s name, software revision, name by which it is commonly known, and (optionally) serial number.
CPU Consumed (centisec.)The number of centiseconds of the total system’s CPU resources consumed by this process. On a multi-processor system, this value may increment by more than one centisecond in one centisecond of real (wall clock) time.
Memory Allocation (KB)The total amount of real system memory allocated to this process.
Installed Software TableThis table contains an entry for each piece of software installed in long-term storage (e.g., disk drive) locally on the host. This does not include software loaded remotely from a network server.
Use this table to identify and inventory software on a host and diagnose incompatibility and version mismatch problems between various pieces of hardware and software. The following information is available in the table.
IndexA unique number identifying the software.
NameThe textual description of the installed software, including the manufacturer’s name, software revision, name by which it is commonly known, and (optionally) serial number.
IDThe product ID of the installed software.
TypeThe type of software (1=unknown, 2=operating system, 3=device driver, and 4=application).
DateThe last-modification date of this application as it would appear in a directory listing.

A p p l i c a t i o n V i e w s A T M U s e r A p p l i c a t i o n
S P E C T R U M E n t e r p r i s e M a n a g e r Page 25 G e n e r i c H o s t
ATM User ApplicationThis section describes the ATM User (ForeUserApp) application, which provides connection information for devices containing a FORE Systems, Inc., ATM adaptor card. The application represents the device’s interface with the ATM network. Table 7 lists the Icon Subviews menu options for this application.
Connection TableThis table includes the following fields that describe the ATM connections.
InterfaceThe ATM interface.
DirectionThe direction of the ATM interface.
VPIThe virtual path identifier for this connection.
VCIThe virtual channel identifier for this connection.
Local SAPThe local service advertising protocol for this connection.
Remote SAPThe remote service advertising protocol for this connection.
Remote AddressThe ATM address of the ATM end of this connection.
Peak BandwidthThe peak bandwidth for this connection, in Kbps.
Mean BandwidthThe mean bandwidth for this connection, in Kbps.
Mean BurstThe mean burst length for this connection, in Kilobits.
UptimeThe length of time since this connection was created, in hundredths of a second.
Table 7: ATM User Icon Subviews Menu
Selection Description
Configuration Opens the Fore User Application Configuration View (Page 37)
Model Information Opens the Model Information view described in SPECTRUM Views
Connection Table Opens the Connection table described below

A p p l i c a t i o n V i e w s I B M U n i x A p p l i c a t i o n
S P E C T R U M E n t e r p r i s e M a n a g e r Page 26 G e n e r i c H o s t
IBM Unix ApplicationThis section describes the IBM Unix (IBM_UnixApp) application, which lets you access detailed views of network information related to the Host_IBM model type. This application provides the following views and tables:
• System Information View• Mbuf (Memory Buffer) Information Table• User Table• IBM Unix Information Table
System Information ViewDisplay this view by highlighting the Application icon and selecting Configuration from the Icon Subviews menu. This view provides system and network configuration information.
MBuf Information TableThe following fields are provided.
Mbufs AllocatedThe number of memory buffers allocated from the page pool.
Clusters AllocatedThe number of clusters allocated from the page pool.
Free ClustersThe number of clusters allocated but not in use.
DropsThe number of requests for memory buffers that failed due to lack of space.
WaitsThe number of requests for memory buffers that resulted in a wait.
DrainsThe number of times protocols were drained for space.
TypeThe type of memory buffer in use.
AllocatesThe number of memory buffers of this type in use.
User TableThis table lists the following information for users who are permitted to log on to the workstation.
IndexA number derived from its entry in the file.
Login IDThe user’s login ID, which is normally given to the system’s login prompt (for example, root).

A p p l i c a t i o n V i e w s I B M U n i x A p p l i c a t i o n
S P E C T R U M E n t e r p r i s e M a n a g e r Page 27 G e n e r i c H o s t
PasswordThe user’s encrypted password. Users without passwords have an “*” shown in this field.
UIDThe user ID (for example, 0).
GIDThe user’s group ID (for example, 1).
IBM Unix Information TableThis table provides the following fields.
Support for Unix MIBThis field will be Enabled or Disabled.
Bogus Routing RedirectsThe number of bogus routing redirects.
Routes Created By RedirectsThe number of routing entries created by redirects.
Routes Modified by RedirectsThe number of routing entries modified by redirects.
Routing Lockup FailureThe number of times a routing entry could not be found for a destination.
Wildcard Routing Entry UsedThe number of times the “wildcard” routing entry was used.
This table provides the following five buttons, the first four of which access additional table entries.
Opens the IBM TCP Socket table.
Opens the IBM UDP Socket table, which contains the following entries:
Remote IPThe remote IP address bound to this UDP socket. If no binding has occurred, the value 0.0.0.0. is used.
Remote PortThe remote UDP port bound to this UDP socket. If no binding has occurred, the value 0 is used.
Send QThe number of octets queued for writing to this UDP socket.
Unix TCP
UnixUDP

A p p l i c a t i o n V i e w s H P U X A p p l i c a t i o n
S P E C T R U M E n t e r p r i s e M a n a g e r Page 28 G e n e r i c H o s t
Recv QThe number of octets queued for reading from this UDP socket.
Opens the IP Routing table, which provides the following fields.
FlagsA value associated with the IP routing entry. The possible values are 1=route usable, 2=destination is a gateway, 3=host entry, and 4=reinstate route after timeout.
Sockets using this IPThe number of sockets using this IP routing entry.
Times IP UsedThe number of times this IP routing entry has been used.
Accesses the IBM CLNP Routing Table, which has the same fields as the IBM IP Routing table but which provide CLNP routing information.
HPUX ApplicationThis section describes the HPUX (HPUX_App) application, which lets you access detailed views of network information related to the Host_HP model type. This application includes the following views and tables:
• System Information View• Cluster Table• File Systems Table• ieee 802.3 MAC Table• Trap Destinations Table• Process Table• Configuration Table• Model Information View
System Information ViewDisplay this view by highlighting the Application icon and selecting Configuration from the Icon Subviews menu. The view provides system and network configuration information.
Unix IP Routing
Unix CLNP Routing

A p p l i c a t i o n V i e w s H P U X A p p l i c a t i o n
S P E C T R U M E n t e r p r i s e M a n a g e r Page 29 G e n e r i c H o s t
Cluster TableThis table lists nodes on the cluster, and each entry contains information about the clustered node.
ClusteredDescribes whether the device is clustered (1=standalone, 2=rootserver, and 3=Cnode).
Cluster IDThe cnode id.
Machine IDThe cnode device id.
Node TypeThe cnode type (r or c).
NameThe cnode name.
IPThe cnode IP Address.
File Systems TableThis table provides the following information.
NameName of the mounted file system.
DirNamed directory of the mounted file system.
Total BlocksTotal blocks in the file system.
Blocks FreeFree blocks in the file system.
ieee 802.3 MAC TableThis table provides the following interface entries.
PortThe number of the port interface for which information is being collected.
TransmittedThe number of MAC frames transmitted.
ReceivedThe number of MAC frames successfully received.
CollisionsThe total number of transmit attempts that were retransmitted due to collisions.

A p p l i c a t i o n V i e w s H P U X A p p l i c a t i o n
S P E C T R U M E n t e r p r i s e M a n a g e r Page 30 G e n e r i c H o s t
Trap Destinations TableThis table provides the following field.
DestinationEach entry contains the network address of a management station to which the agent sends traps.
Process TableThis table provides the following information about a process running on the system.
PIDThe unique process ID, which also serves as the instance of this process.
UNameThe name of the running process (e.g., swapper).
StatusThe process state that is dependent on the operating system, which includes Sleeping (1), Waiting (2), Running (3), Idle (4), Zombie (5), and Stopped (6).
NiceA value that can be modified to assign a process a greater or lesser priority over other processes. The value reflects the level of priority that the running
process has; the higher the value, the lower the priority.
UIDThe process owner’s user ID (e.g., 0 for root).
PgrpThe process owner’s group ID.
SsizeThe process stack size.
Configuration TableThis table provides the following information.
# UsersThe number of users logged on to the system.
CapabilityThe capability of the agent.
ReconfigureReconfigures the agent if set to Reset.
Log MaskThe agent’s log mask.
SNMP VersionThe agent’s version number.

A p p l i c a t i o n V i e w s E t h e r n e t A p p l i c a t i o n
S P E C T R U M E n t e r p r i s e M a n a g e r Page 31 G e n e r i c H o s t
Ethernet ApplicationThis section describes the Ethernet (EthernetApp) application, which lets you access detailed views of network information related to the Host_HP model type.
This application lets you access the Ethernet App and EthernetIfApp Detail views by double-clicking the EthernetApp or EthernetIfApp icons or by highlighting the icons and selecting Detail from the Icon Subviews menu.
These views provide color-coded pie charts that display Ethernet statistical information. Each statistic is presented as both the total amount accrued since the device was initialized and the percentage of overall traffic. Three buttons at the bottom of each pie chart select the way in which the data is represented (Total, Delta, and Accum). Another button, Clear, works in conjunction with the Accum button. For more information on these buttons, refer to the SPECTRUM GIB Editor Guide.
Table 8, Table 9, and Table 10 list the information provided by these pie charts.
Table 8: Transmit Success Counts
Statistic Definition
Single Coll The number of successfully transmitted frames for which transmission was inhibited by exactly one collision
Multi Coll The number of successfully transmitted frames for which transmission was inhibited by more than one collision
Defer Trans The number of frames for which the first transmission attempt was delayed because the medium was busy

A p p l i c a t i o n V i e w s E t h e r n e t A p p l i c a t i o n
S P E C T R U M E n t e r p r i s e M a n a g e r Page 32 G e n e r i c H o s t
Table 9: Frame Errors
Statistic Definition
FCS The number of frames received that are an integral number of octets in length but do not pass the FCS check
Frame Length The number of frames received that exceed the maximum permitted frame size
In-Range The number of frames received with a length field value that falls between the minimum unpadded Logical Link Control (LLC) data size and the maximum allowed LLC data size and does not match the number of LLC octets received
Out-Range The number of frames received for which the length field value exceeds the maximum allowed LLC data size
MAC Receive The number of frames that failed reception due to an internal MAC sublayer receive error
Alignment The number of frames received that are not an integral number of octets in length and do not pass the FCS check
Table 10: Transmit Fail Errors
Statistic Definition
Excess Defer The number of frames for which transmission was deferred for an excessive period of time (only for Ethernet IF App)
Late Coll The number of times that a collision was detected later than 51.2 microseconds into the transmission of a packet
Excess Coll The number of frames for which transmission failed due to excessive collisions
MAC Transmit The number of frames that failed transmission due to an internal MAC sublayer transmit error
Carrier Sense The number of times that the carrier sense condition was lost or never asserted when attempting to transmit a frame

S P E C T R U M E n t e r p r i s e M a n a g e r Page 33 G e n e r i c H o s t
Performance Views
This section provides brief descriptions of the Performance views available for the devices in SPECTRUM.
Performance views display performance statistics in terms of a set of transmission attributes, e.g., cell rates, frame rates, % error, etc. A typical view is shown in Figure 6. The instantaneous condition of each transmission attribute is recorded in a graph. The statistical information for each attribute is presented in the adjacent table.
Generally, you determine performance at the device level through Performance views accessed from the Device and Application icons. You determine performance at the port/interface level through Performance views accessed from Interface icons.
For more information on Performance views, refer to the SPECTRUM Views documentation.
The following paragraphs list the performance attributes displayed for each Performance view supported by this management module.
Figure 6: Performance View
SpectroGRAPH: Type Routing
Model Name
Contact
Description
Location
Network Address System Up Time
Manufacturer
Device Type
Serial Number
Log
100.0
10.00
1.00
0.10
0.01
000:40:0 0:30:0 0:20:0
Value Average Peak Value
* Frame Rate
% Delivered
% Forwarded
% Transmit
% Error
DetailGraph Properties Scroll to Date-Time
File View Tools Bookmarks
% Discarded*Frames per second
type routing of type IP Routing of Landscape node: Primary
Primary Application

P e r f o r m a n c e V i e w s D e v i c e P e r f o r m a n c e V i e w
S P E C T R U M E n t e r p r i s e M a n a g e r Page 34 G e n e r i c H o s t
Device Performance ViewAccess: From the Icon Subviews menu for the Deviceicon, select Performance .
Current and historical frame transmission information is provided via the following attributes.
• Frame Rate• % Delivered• % Forwarded• % Transmit• % Error• % Discarded
Port Performance ViewAccess: From the Icon Subviews menu for the DeviceInterface icon, select Performance .
Current and historical packet transmission information is provided via the following attributes.
• Load• Packet Rate• % Error• % Discarded

S P E C T R U M E n t e r p r i s e M a n a g e r Page 35 G e n e r i c H o s t
Configuration Views
This section describes the various Configuration views available for models of the devices in SPECTRUM.
Configuration views (Figure 7)let you view and modify current settings for the modeled device and its interfaces, ports, and applications.
The device model types support the following Configuration views:
• The Device Configuration View, accessible from the Device icon, provides configuration and operational status information about the device.
• The Interface Configuration View, accessible from the Interface icon, provides configuration and operational status information about the interface or port.
• The Fore User Application Configuration View, accessible from the ATM User Application icon, provides transmission information about the device’s ATM connection.
You should be familiar with the network operation of your PC and workstation devices before using the configuration views to configure them.
Figure 7: Device Configuration View
SpectroGRAPH: Model Name
Primary Application
System Up Time
Manufacturer
Device Type
Serial Number
Network AddressModel Name
ContactDescription
Location
Device Configuration View
Interface Configuration TableSort Find Update
File View Tools Bookmarks
Index Type Physical Address Max Frame Size Operational Status
Model Name of type Model of Landscape node: Primary
Help
C o n f i g u r a t i o n V i e w s D e v i c e C o n f i g u r a t i o n V i e w
S P E C T R U M E n t e r p r i s e M a n a g e r Page 36 G e n e r i c H o s t
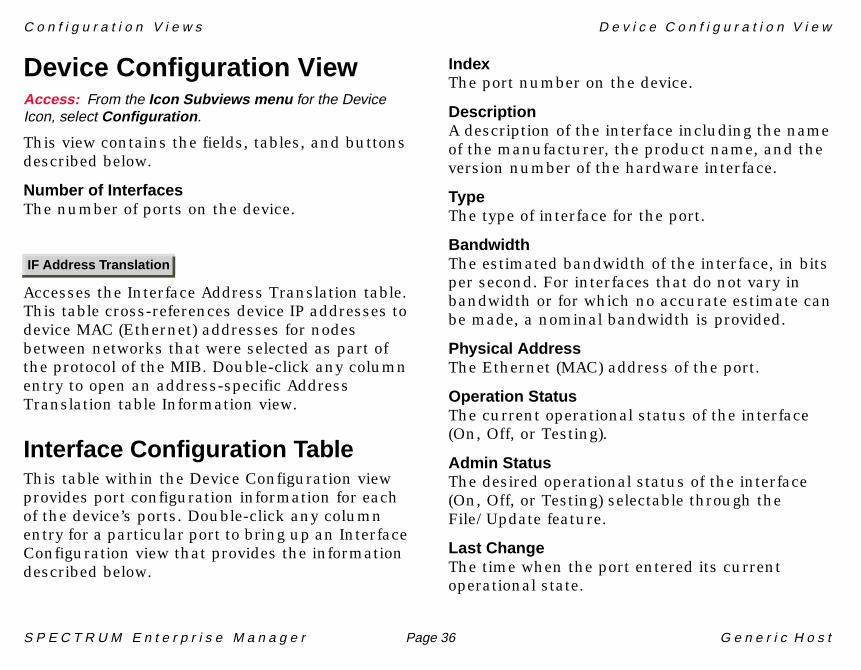
Device Configuration ViewAccess: From the Icon Subviews menu for the DeviceIcon, select Configuration .
This view contains the fields, tables, and buttons described below.
Number of InterfacesThe number of ports on the device.
Accesses the Interface Address Translation table. This table cross-references device IP addresses to device MAC (Ethernet) addresses for nodes between networks that were selected as part of the protocol of the MIB. Double-click any column entry to open an address-specific Address Translation table Information view.
Interface Configuration TableThis table within the Device Configuration view provides port configuration information for each of the device’s ports. Double-click any column entry for a particular port to bring up an Interface Configuration view that provides the information described below.
IndexThe port number on the device.
DescriptionA description of the interface including the name of the manufacturer, the product name, and the version number of the hardware interface.
TypeThe type of interface for the port.
BandwidthThe estimated bandwidth of the interface, in bits per second. For interfaces that do not vary in bandwidth or for which no accurate estimate can be made, a nominal bandwidth is provided.
Physical AddressThe Ethernet (MAC) address of the port.
Operation StatusThe current operational status of the interface (On, Off, or Testing).
Admin StatusThe desired operational status of the interface (On, Off, or Testing) selectable through the File/Update feature.
Last ChangeThe time when the port entered its current operational state.
IF Address Translation
C o n f i g u r a t i o n V i e w s I n t e r f a c e C o n f i g u r a t i o n V i e w
S P E C T R U M E n t e r p r i s e M a n a g e r Page 37 G e n e r i c H o s t
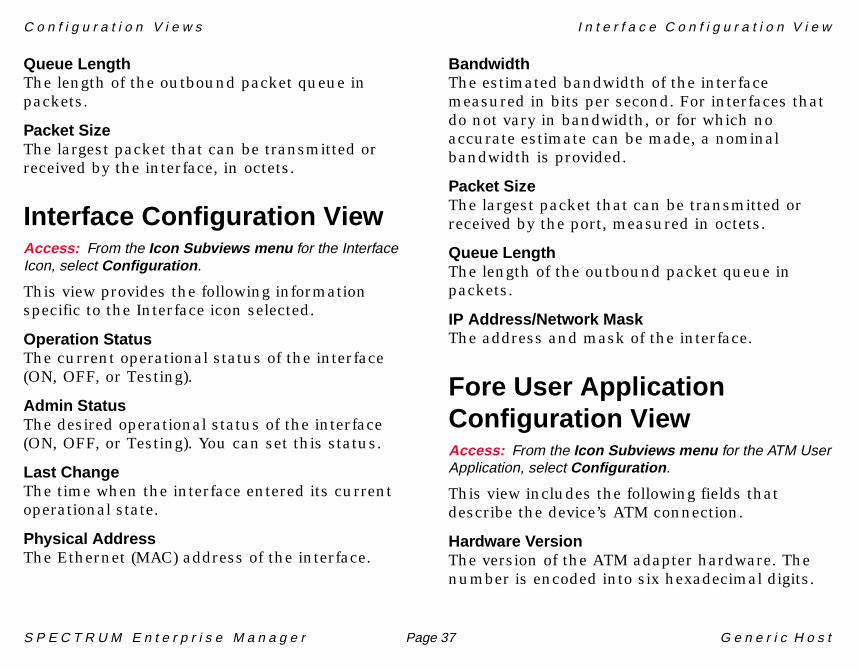
Queue LengthThe length of the outbound packet queue in packets.
Packet SizeThe largest packet that can be transmitted or received by the interface, in octets.
Interface Configuration ViewAccess: From the Icon Subviews menu for the InterfaceIcon, select Configuration .
This view provides the following information specific to the Interface icon selected.
Operation StatusThe current operational status of the interface (ON, OFF, or Testing).
Admin StatusThe desired operational status of the interface (ON, OFF, or Testing). You can set this status.
Last ChangeThe time when the interface entered its current operational state.
Physical AddressThe Ethernet (MAC) address of the interface.
BandwidthThe estimated bandwidth of the interface measured in bits per second. For interfaces that do not vary in bandwidth, or for which no accurate estimate can be made, a nominal bandwidth is provided.
Packet SizeThe largest packet that can be transmitted or received by the port, measured in octets.
Queue LengthThe length of the outbound packet queue in packets.
IP Address/Network MaskThe address and mask of the interface.
Fore User ApplicationConfiguration ViewAccess: From the Icon Subviews menu for the ATM UserApplication, select Configuration .
This view includes the following fields that describe the device’s ATM connection.
Hardware VersionThe version of the ATM adapter hardware. The number is encoded into six hexadecimal digits.

C o n f i g u r a t i o n V i e w s F o r e U s e r A p p l i c a t i o n C o n f i g u r a t i o n V i e w
S P E C T R U M E n t e r p r i s e M a n a g e r Page 38 G e n e r i c H o s t
Hardware SpeedThe speed of the ATM adaptor hardware.
Firmware VersionThe version of the ATM adapter firmware. The number is encoded into six hexadecimal digits.
Software VersionThe version of the ATM adapter software. The number is encoded into six hexadecimal digits.
UptimeThe length of time since the connection was created, in hundredths of a second.
Serial NumberThe serial number of the ATM adaptor hardware.
Adaptor TypeThe device’s adaptor type number.
Rec CarrierThe presence or absence of a carrier on the link.
Port NumberThe number of the port selected.
Oper StatusThe current operational state of the adaptor.
ATM AddressThe address of this ATM adaptor.
Physical LayerThe physical layer of the adaptor.

S P E C T R U M E n t e r p r i s e M a n a g e r Page 39 G e n e r i c H o s t
Model Information View
This section provides a brief overview of the Model Information view.
This view displays administrative information about the device and its applications and lets you set thresholds and alarm severity for the device.
Figure 8 shows a sample Model Information view. The layout of this view is the same for all model types in SPECTRUM but some information will vary depending on the model it defines. Refer to the SPECTRUM Views documentation for a complete description of this view.
Figure 8: Model Information View
Primary Application
System Up Time
Manufacturer
Device Type
Serial Number
Network AddressModel Name
ContactDescription
Location
MM Version Number
MM Name
MM Part Number
General Information
Model Created By
Model Type
Model Creation Time
Model State
Security String
Communication Information
Community Name
DCM TimeOut
DCM Retry
Poll/Log InformationPoll Interval
Polling StatusCondition
Condition Value
Contact Status
Lost Child Count
Value When Yellow
Value When Orange
Value When Red
Last Successful Poll
Log Ratio
LOGGED POLLED
Model Information View
SpectroGRAPH: Model Name
File View Tools Bookmarks Help
type Model Type of Landscape: Primary

S P E C T R U M E n t e r p r i s e M a n a g e r Page 40 G e n e r i c H o s t
Index
AAddress
Interface IP 11Physical (MAC) 11Translation 12
Address Translation 36Admin Status 10Administrative Status 8, 36, 37Application
ATM User 25Ethernet 31Host Resources 18HPUX 28IBM Unix 26LAN Manager 16
Applications 14ATM
Adapter Card Information 37Adaptor Card Information 25Connection Information 8, 37Connection Table 25
ATM User Application 25
BBandwidth 36, 37
ButtonsIF Address Translation 36
CConfiguration
Port 36Port/Interface 37
DDEC Information 8Device
Configuration 36Information 8
DevTop Views 13Documentation 5Domain Information (NT) 16
EEthernet Application 31
GGauge Label 11
HHost Resources Application 18HP Device
Clustered Node Table 29Configuration Table 30Ethernet Transmission
Information 31File Systems Table 29ieee 802.3 MAC Table 29Process Table 30System Information 28Trap Destinations 30
HP Information 8HPUX Application 28
IIBM Device
Buffer Information 26Route and Socket Info 28Routing Information 27

I n d e x I n d e x
S P E C T R U M E n t e r p r i s e M a n a g e r Page 41 G e n e r i c H o s t
Socket Table 27System Information 26User Information 26
IBM Information 8IBM Unix Application 26IF Address Translation Button 36Interface
General Information 10Number of 36Status 12Troubleshooting 8Type, Device 10
Interface Device View 9
LLAN Manager Application 16
MManagement Tasks 8Mask 12Model
Information 39Model Types 6
NNetwork I/O ports 13
Network Type 11NT Device
Domain Information 16Session Information 17System Configuration 16Transmission Information 16Usage 17User (Server) Information 16Workstation Information 17
NT Information 8
OOperational Status 36, 37
PPacket Size 37Performance
Device and Port 8Performance Statistics 11, 33Physical Address 36Port
Configuration 37Port Number, Device 10
RRestricted Rights Notice 2
SSerial ports 13SGI Information 8SPECTRUM Software Modules 6Statistics
Routing Frame Transmission 34Sun Device
Device Identification 19File Systems 22Host Processes 20Network Devices 20Partitions 21Printer Information 21Running Software Information 23Running Software
Performance 24Software in Storage 24Storage Area Information 18
SUN/Unix Information 8
TThreshold Information 11Trademarks 2Troubleshooting Tasks 8
WWorkstation Troubleshooting 8

Ind
ex
Ind
ex
SP
EC
TR
UM
En
terp
rise
Ma
na
ge
rP
age42
Ge
ne
ricH
os
t