Reproducible research in molecular biophysics and structural biology
Articleshttps://doi.org/10.1038/s41594-020-0461-1
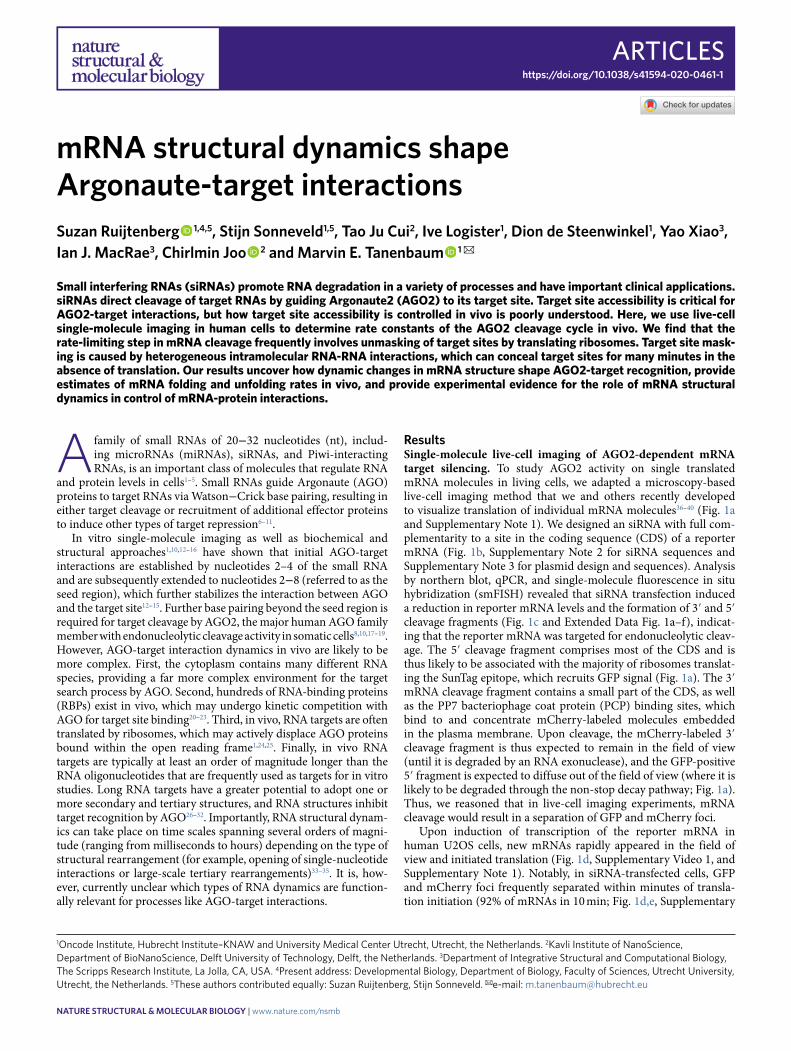
1Oncode Institute, Hubrecht Institute–KNAW and University Medical Center Utrecht, Utrecht, the Netherlands. 2Kavli Institute of NanoScience, Department of BioNanoScience, Delft University of Technology, Delft, the Netherlands. 3Department of Integrative Structural and Computational Biology, The Scripps Research Institute, La Jolla, CA, USA. 4Present address: Developmental Biology, Department of Biology, Faculty of Sciences, Utrecht University, Utrecht, the Netherlands. 5These authors contributed equally: Suzan Ruijtenberg, Stijn Sonneveld. ✉e-mail: [email protected]
A family of small RNAs of 20−32 nucleotides (nt), includ-ing microRNAs (miRNAs), siRNAs, and Piwi-interacting RNAs, is an important class of molecules that regulate RNA
and protein levels in cells1–5. Small RNAs guide Argonaute (AGO) proteins to target RNAs via Watson−Crick base pairing, resulting in either target cleavage or recruitment of additional effector proteins to induce other types of target repression6–11.
In vitro single-molecule imaging as well as biochemical and structural approaches1,10,12–16 have shown that initial AGO-target interactions are established by nucleotides 2–4 of the small RNA and are subsequently extended to nucleotides 2−8 (referred to as the seed region), which further stabilizes the interaction between AGO and the target site12–15. Further base pairing beyond the seed region is required for target cleavage by AGO2, the major human AGO family member with endonucleolytic cleavage activity in somatic cells8,10,17–19. However, AGO-target interaction dynamics in vivo are likely to be more complex. First, the cytoplasm contains many different RNA species, providing a far more complex environment for the target search process by AGO. Second, hundreds of RNA-binding proteins (RBPs) exist in vivo, which may undergo kinetic competition with AGO for target site binding20–23. Third, in vivo, RNA targets are often translated by ribosomes, which may actively displace AGO proteins bound within the open reading frame1,24,25. Finally, in vivo RNA targets are typically at least an order of magnitude longer than the RNA oligonucleotides that are frequently used as targets for in vitro studies. Long RNA targets have a greater potential to adopt one or more secondary and tertiary structures, and RNA structures inhibit target recognition by AGO26–32. Importantly, RNA structural dynam-ics can take place on time scales spanning several orders of magni-tude (ranging from milliseconds to hours) depending on the type of structural rearrangement (for example, opening of single-nucleotide interactions or large-scale tertiary rearrangements)33–35. It is, how-ever, currently unclear which types of RNA dynamics are function-ally relevant for processes like AGO-target interactions.
ResultsSingle-molecule live-cell imaging of AGO2-dependent mRNA target silencing. To study AGO2 activity on single translated mRNA molecules in living cells, we adapted a microscopy-based live-cell imaging method that we and others recently developed to visualize translation of individual mRNA molecules36–40 (Fig. 1a and Supplementary Note 1). We designed an siRNA with full com-plementarity to a site in the coding sequence (CDS) of a reporter mRNA (Fig. 1b, Supplementary Note 2 for siRNA sequences and Supplementary Note 3 for plasmid design and sequences). Analysis by northern blot, qPCR, and single-molecule fluorescence in situ hybridization (smFISH) revealed that siRNA transfection induced a reduction in reporter mRNA levels and the formation of 3′ and 5′ cleavage fragments (Fig. 1c and Extended Data Fig. 1a–f), indicat-ing that the reporter mRNA was targeted for endonucleolytic cleav-age. The 5′ cleavage fragment comprises most of the CDS and is thus likely to be associated with the majority of ribosomes translat-ing the SunTag epitope, which recruits GFP signal (Fig. 1a). The 3′ mRNA cleavage fragment contains a small part of the CDS, as well as the PP7 bacteriophage coat protein (PCP) binding sites, which bind to and concentrate mCherry-labeled molecules embedded in the plasma membrane. Upon cleavage, the mCherry-labeled 3′ cleavage fragment is thus expected to remain in the field of view (until it is degraded by an RNA exonuclease), and the GFP-positive 5′ fragment is expected to diffuse out of the field of view (where it is likely to be degraded through the non-stop decay pathway; Fig. 1a). Thus, we reasoned that in live-cell imaging experiments, mRNA cleavage would result in a separation of GFP and mCherry foci.
Upon induction of transcription of the reporter mRNA in human U2OS cells, new mRNAs rapidly appeared in the field of view and initiated translation (Fig. 1d, Supplementary Video 1, and Supplementary Note 1). Notably, in siRNA-transfected cells, GFP and mCherry foci frequently separated within minutes of transla-tion initiation (92% of mRNAs in 10 min; Fig. 1d,e, Supplementary
mRNA structural dynamics shape Argonaute-target interactionsSuzan Ruijtenberg 1,4,5, Stijn Sonneveld1,5, Tao Ju Cui2, Ive Logister1, Dion de Steenwinkel1, Yao Xiao3, Ian J. MacRae3, Chirlmin Joo 2 and Marvin E. Tanenbaum 1 ✉
Small interfering RNAs (siRNAs) promote RNA degradation in a variety of processes and have important clinical applications. siRNAs direct cleavage of target RNAs by guiding Argonaute2 (AGO2) to its target site. Target site accessibility is critical for AGO2-target interactions, but how target site accessibility is controlled in vivo is poorly understood. Here, we use live-cell single-molecule imaging in human cells to determine rate constants of the AGO2 cleavage cycle in vivo. We find that the rate-limiting step in mRNA cleavage frequently involves unmasking of target sites by translating ribosomes. Target site mask-ing is caused by heterogeneous intramolecular RNA-RNA interactions, which can conceal target sites for many minutes in the absence of translation. Our results uncover how dynamic changes in mRNA structure shape AGO2-target recognition, provide estimates of mRNA folding and unfolding rates in vivo, and provide experimental evidence for the role of mRNA structural dynamics in control of mRNA-protein interactions.
NATuRE STRuCTuRAL & MOLECuLAR BIOLOgY | www.nature.com/nsmb

Articles NATuRE STRucTuRAl & MOlEculAR BiOlOGy
10500.0
0.2
0.4
0.6
0.8
1.0
1.2
15 20
Time (min)
KIF18B; AGO2 KD + siRNA #1
Fra
ctio
n un
clea
ved
mR
NA
s
KIF18B; siRNA #1
KIF18B; AGO2 KD + AGO2 o.e. + siRNA #1
fKIF18B; siRNA #1KIF18B; no siRNA
KIF18B-siRNA resistant; siRNA #1
10500.0
0.2
0.4
0.6
0.8
1.0
1.2
15 20
Time (min)
Fra
ctio
n un
clea
ved
mR
NA
s
e
00:00 01:00 03:00 08:00 18:00
Translation mRNA
13:00
00:00 01:00 02:00 06:30 07:00 12:00
d
No
siR
NA
+si
RN
A
No siR
NA
+siR
NA #1
28S rRNA
Uncleaved
Cleaved
6 kb
4 kb
2 kb
c
*
b
5′ UTR 3′ UTR
PBSStart
KIF18BSunTag
GCCACAGTCATCAAAAGCC
siRNA binding site
Stop
KIF18B reporter
a
Plasma membrane
STOP3′ UTR
5′ UTR
Start
Colocalization
PP7 binding sites (PBS)
PCP-mCherry-CAAX
ScFv-GFP
Ribosomes
mRNA
SunTag
siRNA binding site
In the absence of siRNA
AGO2Separation
AGO2-mediated mRNA cleavage
In the presence of siRNA
Fig. 1 | Observing AgO2-dependent mRNA target silencing by single-molecule live-cell imaging. a, Schematic of the single-molecule imaging assay used to visualize AGO2-mediated mRNA silencing in the absence (left) or presence (right) of siRNA. Green and magenta spots (insets) show nascent polypeptides (translation) and mRNA, respectively, as observed by microscopy. b, Schematic of the mRNA reporter. c, Northern blot of cells expressing the reporter mRNA shown in b, either without siRNA or transfected with KIF18B siRNA #1. Top, upper band (uncleaved) represents full-length reporter mRNA, and the lower band (cleaved) represents the 3′ cleavage fragment. The asterisk (*) indicates an additional 4 kB band that may represent a shorter isoform of the reporter mRNA. Bottom, 28S rRNA acts as a loading control. d, Representative images of mRNA molecules of the reporter shown in b expressed in SunTag-PP7 cells without (top) or with (bottom) siRNA. Scale bar, 1 µm. Time is shown in min:s. e,f, SunTag-PP7 cells expressing indicated reporters were transfected with 10 nM KIF18B siRNA #1, where indicated. The time from first detection of translation until separation of GFP and mCherry foci (that is, mRNA cleavage) is shown. Solid lines and corresponding shaded regions represent mean ± s.e.m. f, Cells expressing dCas9-KRAB were infected with sgRNA targeting endogenous AGO2 (AGO2 KD) or with full-length AGO2 (AGO2 o.e. (overexpression)), where indicated. Dotted lines indicate that the data are replotted from e for comparison. Number of measurements for each experiment is listed in Supplementary Table 1. Uncropped images for c and data for graphs in e,f are available as source data online.
NATuRE STRuCTuRAL & MOLECuLAR BIOLOgY | www.nature.com/nsmb
ArticlesNATuRE STRucTuRAl & MOlEculAR BiOlOGy
Note 4, and Supplementary Video 2). Separation of GFP and mCherry foci was due to AGO2-dependent endonucleolytic cleav-age, as foci separation was largely eliminated by mutation of the siRNA binding site or depletion of AGO2 (Fig. 1e,f and Extended Data Fig. 1g). Furthermore, the fluorescence intensity of most (97%) GFP foci at the time of separation was greater than the inten-sity of a single SunTag polypeptide, indicative of endonucleolytic cleavage rather than translation termination (Extended Data Fig. 1h and Supplementary Note 4). In contrast, transcription of the reporter mRNA (Extended Data Fig. 1i) and nuclear mRNA lev-els (Extended Data Fig. 1d,f) were unaffected by the AGO2−siRNA complex, consistent with previous studies41. Similarly, no significant effect on translation rates was observed (Extended Data Fig. 1j,k, and Supplementary Note 5). Together, these results show that endo-nucleolytic cleavage in the cytoplasm is the predominant mecha-nism of action of AGO2−siRNA complexes.
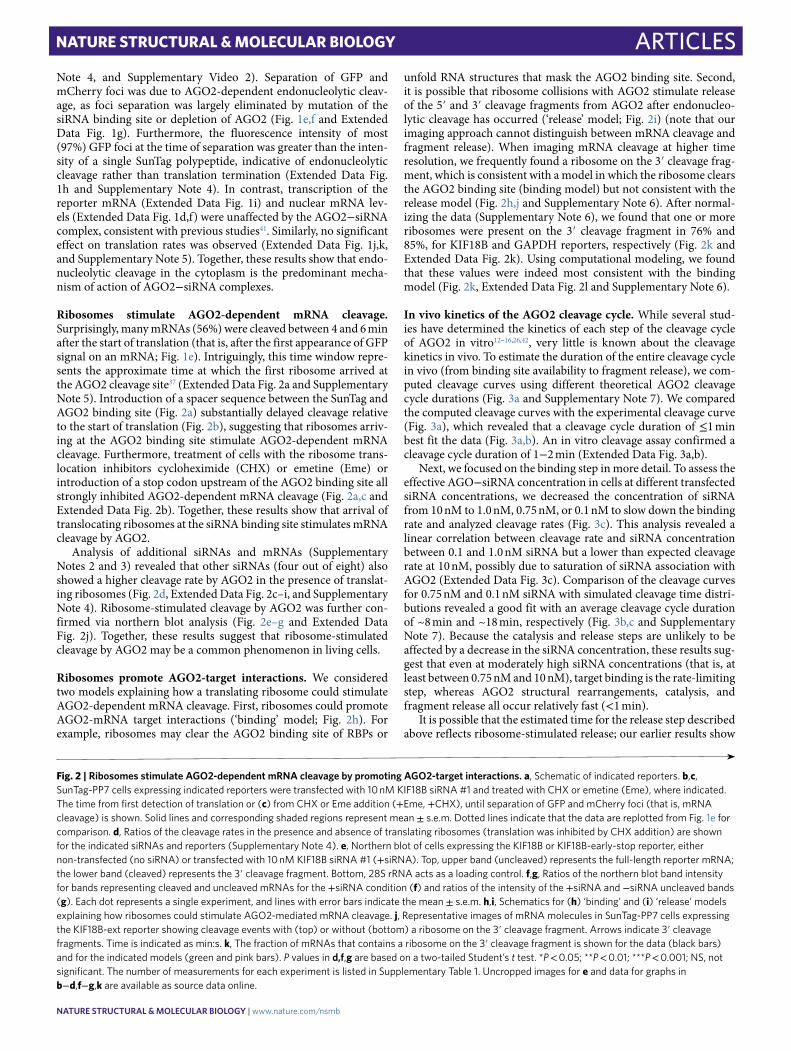
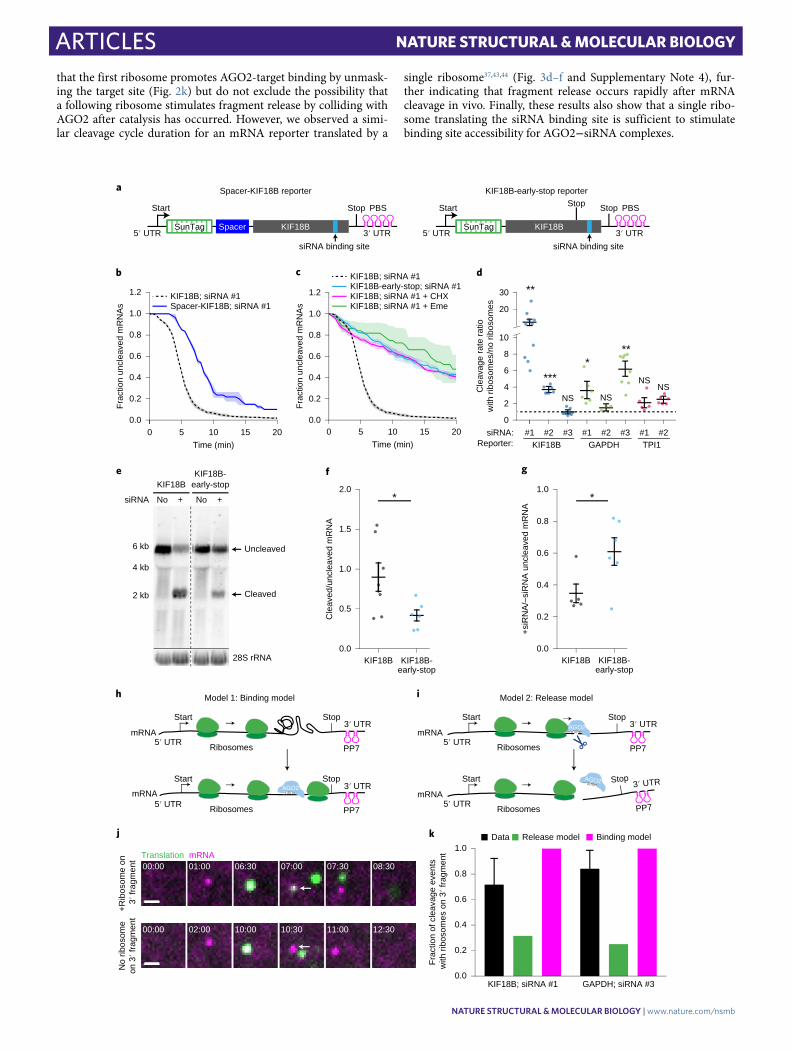
Ribosomes stimulate AGO2-dependent mRNA cleavage. Surprisingly, many mRNAs (56%) were cleaved between 4 and 6 min after the start of translation (that is, after the first appearance of GFP signal on an mRNA; Fig. 1e). Intriguingly, this time window repre-sents the approximate time at which the first ribosome arrived at the AGO2 cleavage site37 (Extended Data Fig. 2a and Supplementary Note 5). Introduction of a spacer sequence between the SunTag and AGO2 binding site (Fig. 2a) substantially delayed cleavage relative to the start of translation (Fig. 2b), suggesting that ribosomes arriv-ing at the AGO2 binding site stimulate AGO2-dependent mRNA cleavage. Furthermore, treatment of cells with the ribosome trans-location inhibitors cycloheximide (CHX) or emetine (Eme) or introduction of a stop codon upstream of the AGO2 binding site all strongly inhibited AGO2-dependent mRNA cleavage (Fig. 2a,c and Extended Data Fig. 2b). Together, these results show that arrival of translocating ribosomes at the siRNA binding site stimulates mRNA cleavage by AGO2.
Analysis of additional siRNAs and mRNAs (Supplementary Notes 2 and 3) revealed that other siRNAs (four out of eight) also showed a higher cleavage rate by AGO2 in the presence of translat-ing ribosomes (Fig. 2d, Extended Data Fig. 2c–i, and Supplementary Note 4). Ribosome-stimulated cleavage by AGO2 was further con-firmed via northern blot analysis (Fig. 2e–g and Extended Data Fig. 2j). Together, these results suggest that ribosome-stimulated cleavage by AGO2 may be a common phenomenon in living cells.
Ribosomes promote AGO2-target interactions. We considered two models explaining how a translating ribosome could stimulate AGO2-dependent mRNA cleavage. First, ribosomes could promote AGO2-mRNA target interactions (‘binding’ model; Fig. 2h). For example, ribosomes may clear the AGO2 binding site of RBPs or
unfold RNA structures that mask the AGO2 binding site. Second, it is possible that ribosome collisions with AGO2 stimulate release of the 5′ and 3′ cleavage fragments from AGO2 after endonucleo-lytic cleavage has occurred (‘release’ model; Fig. 2i) (note that our imaging approach cannot distinguish between mRNA cleavage and fragment release). When imaging mRNA cleavage at higher time resolution, we frequently found a ribosome on the 3′ cleavage frag-ment, which is consistent with a model in which the ribosome clears the AGO2 binding site (binding model) but not consistent with the release model (Fig. 2h,j and Supplementary Note 6). After normal-izing the data (Supplementary Note 6), we found that one or more ribosomes were present on the 3′ cleavage fragment in 76% and 85%, for KIF18B and GAPDH reporters, respectively (Fig. 2k and Extended Data Fig. 2k). Using computational modeling, we found that these values were indeed most consistent with the binding model (Fig. 2k, Extended Data Fig. 2l and Supplementary Note 6).
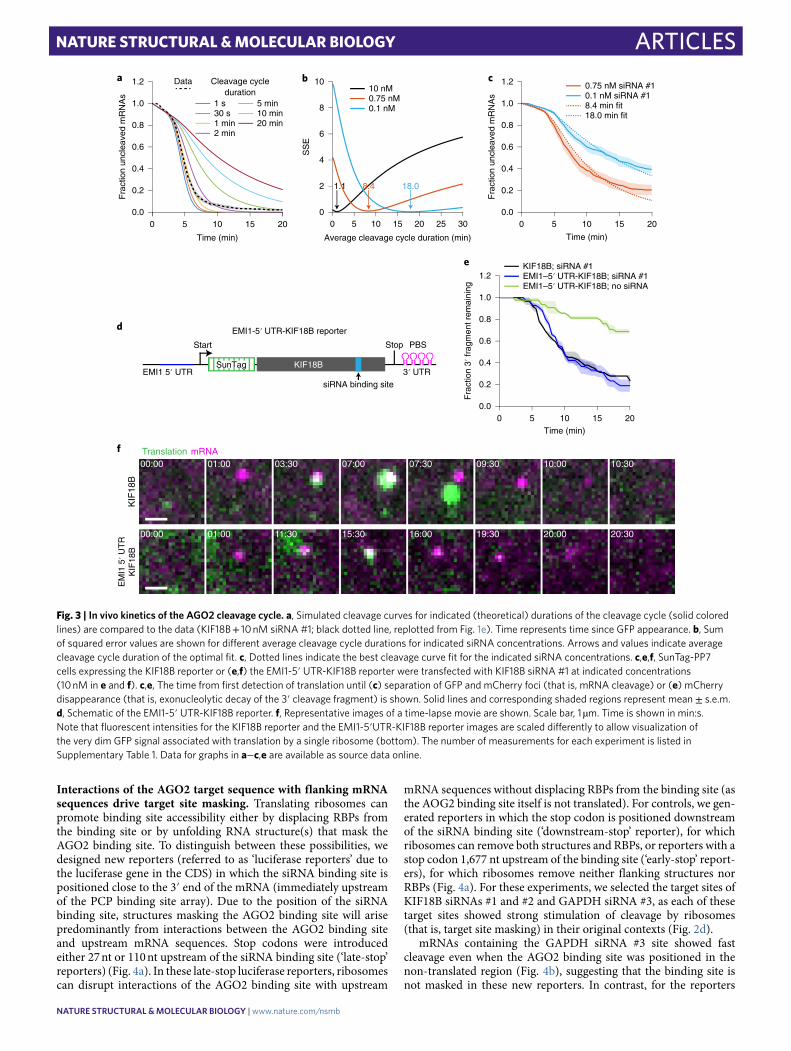
In vivo kinetics of the AGO2 cleavage cycle. While several stud-ies have determined the kinetics of each step of the cleavage cycle of AGO2 in vitro12–16,26,42, very little is known about the cleavage kinetics in vivo. To estimate the duration of the entire cleavage cycle in vivo (from binding site availability to fragment release), we com-puted cleavage curves using different theoretical AGO2 cleavage cycle durations (Fig. 3a and Supplementary Note 7). We compared the computed cleavage curves with the experimental cleavage curve (Fig. 3a), which revealed that a cleavage cycle duration of ≤1 min best fit the data (Fig. 3a,b). An in vitro cleavage assay confirmed a cleavage cycle duration of 1−2 min (Extended Data Fig. 3a,b).
Next, we focused on the binding step in more detail. To assess the effective AGO−siRNA concentration in cells at different transfected siRNA concentrations, we decreased the concentration of siRNA from 10 nM to 1.0 nM, 0.75 nM, or 0.1 nM to slow down the binding rate and analyzed cleavage rates (Fig. 3c). This analysis revealed a linear correlation between cleavage rate and siRNA concentration between 0.1 and 1.0 nM siRNA but a lower than expected cleavage rate at 10 nM, possibly due to saturation of siRNA association with AGO2 (Extended Data Fig. 3c). Comparison of the cleavage curves for 0.75 nM and 0.1 nM siRNA with simulated cleavage time distri-butions revealed a good fit with an average cleavage cycle duration of ~8 min and ~18 min, respectively (Fig. 3b,c and Supplementary Note 7). Because the catalysis and release steps are unlikely to be affected by a decrease in the siRNA concentration, these results sug-gest that even at moderately high siRNA concentrations (that is, at least between 0.75 nM and 10 nM), target binding is the rate-limiting step, whereas AGO2 structural rearrangements, catalysis, and fragment release all occur relatively fast (<1 min).
It is possible that the estimated time for the release step described above reflects ribosome-stimulated release; our earlier results show
Fig. 2 | Ribosomes stimulate AgO2-dependent mRNA cleavage by promoting AgO2-target interactions. a, Schematic of indicated reporters. b,c, SunTag-PP7 cells expressing indicated reporters were transfected with 10 nM KIF18B siRNA #1 and treated with CHX or emetine (Eme), where indicated. The time from first detection of translation or (c) from CHX or Eme addition (+Eme, +CHX), until separation of GFP and mCherry foci (that is, mRNA cleavage) is shown. Solid lines and corresponding shaded regions represent mean ± s.e.m. Dotted lines indicate that the data are replotted from Fig. 1e for comparison. d, Ratios of the cleavage rates in the presence and absence of translating ribosomes (translation was inhibited by CHX addition) are shown for the indicated siRNAs and reporters (Supplementary Note 4). e, Northern blot of cells expressing the KIF18B or KIF18B-early-stop reporter, either non-transfected (no siRNA) or transfected with 10 nM KIF18B siRNA #1 (+siRNA). Top, upper band (uncleaved) represents the full-length reporter mRNA; the lower band (cleaved) represents the 3′ cleavage fragment. Bottom, 28S rRNA acts as a loading control. f,g, Ratios of the northern blot band intensity for bands representing cleaved and uncleaved mRNAs for the +siRNA condition (f) and ratios of the intensity of the +siRNA and −siRNA uncleaved bands (g). Each dot represents a single experiment, and lines with error bars indicate the mean ± s.e.m. h,i, Schematics for (h) ‘binding’ and (i) ‘release’ models explaining how ribosomes could stimulate AGO2-mediated mRNA cleavage. j, Representative images of mRNA molecules in SunTag-PP7 cells expressing the KIF18B-ext reporter showing cleavage events with (top) or without (bottom) a ribosome on the 3′ cleavage fragment. Arrows indicate 3′ cleavage fragments. Time is indicated as min:s. k, The fraction of mRNAs that contains a ribosome on the 3′ cleavage fragment is shown for the data (black bars) and for the indicated models (green and pink bars). P values in d,f,g are based on a two-tailed Student’s t test. *P < 0.05; **P < 0.01; ***P < 0.001; NS, not significant. The number of measurements for each experiment is listed in Supplementary Table 1. Uncropped images for e and data for graphs in b−d,f−g,k are available as source data online.
NATuRE STRuCTuRAL & MOLECuLAR BIOLOgY | www.nature.com/nsmb
Articles NATuRE STRucTuRAl & MOlEculAR BiOlOGy
that the first ribosome promotes AGO2-target binding by unmask-ing the target site (Fig. 2k) but do not exclude the possibility that a following ribosome stimulates fragment release by colliding with AGO2 after catalysis has occurred. However, we observed a simi-lar cleavage cycle duration for an mRNA reporter translated by a
single ribosome37,43,44 (Fig. 3d–f and Supplementary Note 4), fur-ther indicating that fragment release occurs rapidly after mRNA cleavage in vivo. Finally, these results also show that a single ribo-some translating the siRNA binding site is sufficient to stimulate binding site accessibility for AGO2−siRNA complexes.
k
KIF18B; siRNA #1 GAPDH; siRNA #3
Data Release model Binding model
Fra
ctio
n of
cle
avag
e ev
ents
with
rib
osom
es o
n 3′
frag
men
t
0.2
0.4
0.6
0.0
0.8
1.0
j
Translation mRNA00:00 01:00 06:30 07:00 08:3007:30
+R
ibos
ome
on 3
′ fra
gmen
tN
o rib
osom
eon
3′ f
ragm
ent
00:00 02:00 10:00 10:30 11:00 12:30
i Model 2: Release model
5′ UTR
Start
Ribosomes
mRNA
Stop3′ UTR
PP7
AGO2
5′ UTR
Start
Ribosomes
mRNA
Stop3′ UTR
PP7
AGO2
Model 1: Binding model
Ribosomes
Stop3′ UTR
5′ UTR
Start
PP7
mRNAAGO2
Stop3′ UTR
5′ UTR
Start
PP7Ribosomes
mRNA
h
g
1.0
0.0
+si
RN
A/–
siR
NA
unc
leav
ed m
RN
A0.8
0.6
0.4
0.2
KIF18B KIF18B-early-stop
*
f
0.0
2.0
0.5
1.0
1.5
Cle
aved
/unc
leav
ed m
RN
A
KIF18B KIF18B-early-stop
*
eKIF18B
KIF18B-early-stop
+NosiRNA +No
28S rRNA
Uncleaved
Cleaved
6 kb
4 kb
2 kb
d
siRNA: #1 #2 #3 #1 #2 #3 #1 #2Reporter: KIF18B GAPDH TPI1
30
20
10
8
6
4
2
Cle
avag
e ra
te r
atio
with
rib
osom
es/n
o rib
osom
es
0
**
***
NS
*
NS
**
NSNS
10500.0
0.2
0.4
0.6
0.8
1.0
1.2
15 20
Time (min)
Fra
ctio
n un
clea
ved
mR
NA
s
KIF18B; siRNA #1
KIF18B; siRNA #1 + CHXKIF18B-early-stop; siRNA #1
c
KIF18B; siRNA #1 + Eme
b
10500.0
0.2
0.4
0.6
0.8
1.0
1.2
15 20
Time (min)
Fra
ctio
n un
clea
ved
mR
NA
s
KIF18B; siRNA #1Spacer-KIF18B; siRNA #1
aStop PBSStart Stop
5′ UTR
Start
siRNA binding site
3′ UTR
PBSStop
KIF18BSunTag Spacer5′ UTR 3′ UTR
siRNA binding site
SunTag KIF18B
Spacer-KIF18B reporter KIF18B-early-stop reporter
NATuRE STRuCTuRAL & MOLECuLAR BIOLOgY | www.nature.com/nsmb
ArticlesNATuRE STRucTuRAl & MOlEculAR BiOlOGy
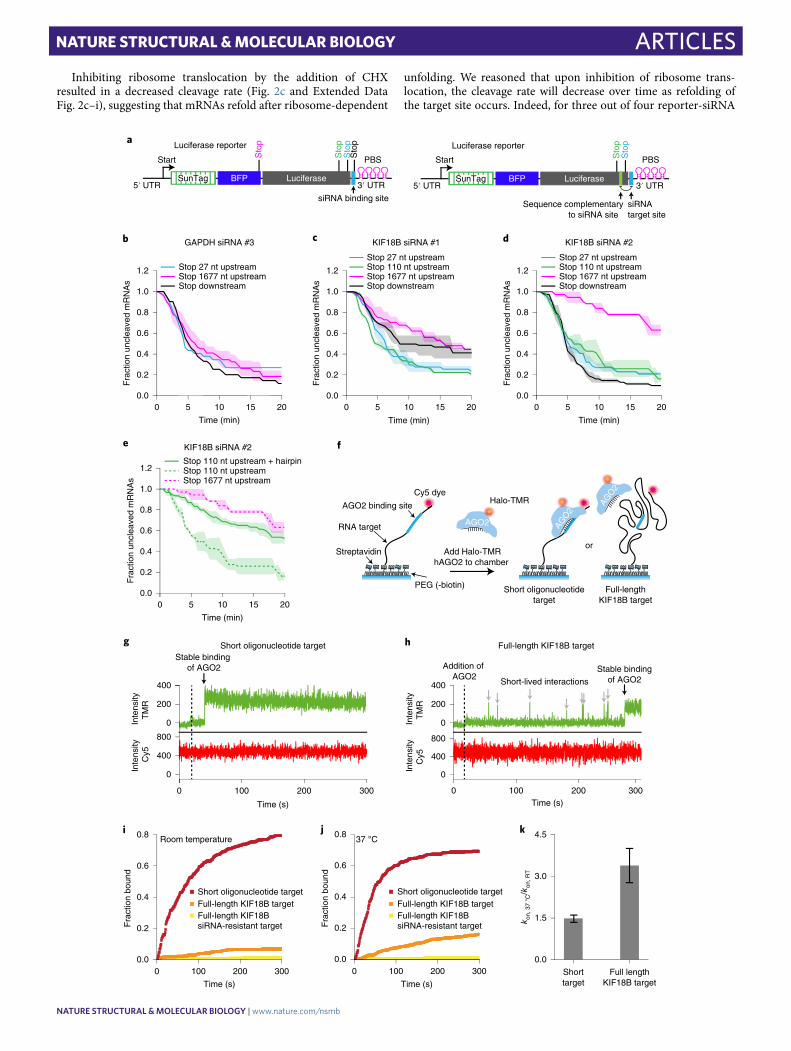
Interactions of the AGO2 target sequence with flanking mRNA sequences drive target site masking. Translating ribosomes can promote binding site accessibility either by displacing RBPs from the binding site or by unfolding RNA structure(s) that mask the AGO2 binding site. To distinguish between these possibilities, we designed new reporters (referred to as ‘luciferase reporters’ due to the luciferase gene in the CDS) in which the siRNA binding site is positioned close to the 3′ end of the mRNA (immediately upstream of the PCP binding site array). Due to the position of the siRNA binding site, structures masking the AGO2 binding site will arise predominantly from interactions between the AGO2 binding site and upstream mRNA sequences. Stop codons were introduced either 27 nt or 110 nt upstream of the siRNA binding site (‘late-stop’ reporters) (Fig. 4a). In these late-stop luciferase reporters, ribosomes can disrupt interactions of the AGO2 binding site with upstream
mRNA sequences without displacing RBPs from the binding site (as the AOG2 binding site itself is not translated). For controls, we gen-erated reporters in which the stop codon is positioned downstream of the siRNA binding site (‘downstream-stop’ reporter), for which ribosomes can remove both structures and RBPs, or reporters with a stop codon 1,677 nt upstream of the binding site (‘early-stop’ report-ers), for which ribosomes remove neither flanking structures nor RBPs (Fig. 4a). For these experiments, we selected the target sites of KIF18B siRNAs #1 and #2 and GAPDH siRNA #3, as each of these target sites showed strong stimulation of cleavage by ribosomes (that is, target site masking) in their original contexts (Fig. 2d).
mRNAs containing the GAPDH siRNA #3 site showed fast cleavage even when the AGO2 binding site was positioned in the non-translated region (Fig. 4b), suggesting that the binding site is not masked in these new reporters. In contrast, for the reporters
f
00:00 01:00 11:30 15:30 16:00 19:30 20:00 20:30
Translation mRNA
KIF
18B
EM
I1 5
′ UT
RK
IF18
B
00:00 01:00 03:30 07:00 07:30 09:30 10:00 10:30
e
1050 15 20
Fra
ctio
n 3′
frag
men
t rem
aini
ng
0.0
0.2
0.4
0.6
0.8
1.0
1.2
Time (min)
KIF18B; siRNA #1EMI1–5′ UTR-KIF18B; siRNA #1EMI1–5′ UTR-KIF18B; no siRNA
d
EMI1 5′ UTR 3′ UTR
Start
KIF18BSunTag
PBSStop
siRNA binding site
EMI1-5′ UTR-KIF18B reporter
c
1050 15 20
Fra
ctio
n un
clea
ved
mR
NA
s
0.0
0.2
0.4
0.6
0.8
1.0
1.2
Time (min)
0.75 nM siRNA #10.1 nM siRNA #18.4 min fit18.0 min fit
1050 15 20
Average cleavage cycle duration (min)
25 300
2
4
6
8
10
SS
E
10 nM 0.75 nM0.1 nM
1.1 8.4 18.0
ba
Fra
ctio
n un
clea
ved
mR
NA
s
0.0
0.2
0.4
0.6
0.8
1.0
1.2
1050 15 20
Time (min)
Data Cleavage cycleduration
1 s30 s
2 min
5 min10 min20 min1 min
Fig. 3 | In vivo kinetics of the AgO2 cleavage cycle. a, Simulated cleavage curves for indicated (theoretical) durations of the cleavage cycle (solid colored lines) are compared to the data (KIF18B + 10 nM siRNA #1; black dotted line, replotted from Fig. 1e). Time represents time since GFP appearance. b, Sum of squared error values are shown for different average cleavage cycle durations for indicated siRNA concentrations. Arrows and values indicate average cleavage cycle duration of the optimal fit. c, Dotted lines indicate the best cleavage curve fit for the indicated siRNA concentrations. c,e,f, SunTag-PP7 cells expressing the KIF18B reporter or (e,f) the EMI1-5′ UTR-KIF18B reporter were transfected with KIF18B siRNA #1 at indicated concentrations (10 nM in e and f). c,e, The time from first detection of translation until (c) separation of GFP and mCherry foci (that is, mRNA cleavage) or (e) mCherry disappearance (that is, exonucleolytic decay of the 3′ cleavage fragment) is shown. Solid lines and corresponding shaded regions represent mean ± s.e.m. d, Schematic of the EMI1-5′ UTR-KIF18B reporter. f, Representative images of a time-lapse movie are shown. Scale bar, 1 µm. Time is shown in min:s. Note that fluorescent intensities for the KIF18B reporter and the EMI1-5′UTR-KIF18B reporter images are scaled differently to allow visualization of the very dim GFP signal associated with translation by a single ribosome (bottom). The number of measurements for each experiment is listed in Supplementary Table 1. Data for graphs in a−c,e are available as source data online.
NATuRE STRuCTuRAL & MOLECuLAR BIOLOgY | www.nature.com/nsmb

Articles NATuRE STRucTuRAl & MOlEculAR BiOlOGy
containing either the KIF18B siRNA #1 or #2 site, cleavage was substantially faster for the downstream-stop reporters compared to the early-stop reporters (Fig. 4c,d), indicative of target site mask-ing. Importantly, cleavage rates of the late-stop reporters were at least as fast as cleavage rates of the downstream-stop reporter (Fig. 4c,d), indicating that ribosomes stimulate AGO2 mRNA bind-ing and cleavage by unfolding mRNA secondary structure, rather than displacing RBPs from the binding site for both reporters. To further confirm the role of RNA structure in AGO2 target site masking, we placed two copies of a 7-nt sequence with complemen-tarity to the siRNA binding site just downstream of the stop codon in the 110-nt early-stop reporter, embedding the AGO2 binding site in a hairpin structure (‘hairpin reporter’) (Fig. 4a). The hair-pin reporter showed a severely reduced cleavage rate compared to that of its parent reporter (Fig. 4e), confirming that intramolecu-lar RNA interactions inhibit AGO2-target binding, consistent with previous findings27. Surprisingly, for KIF18B siRNA #1, the rate of cleavage of the early-stop reporters was even faster than that of the downstream-stop reporter (Fig. 4c). A possible explanation for this result is that ribosomes passing over the AGO2 binding site impair mRNA cleavage by displacing AGO2 from the mRNA upon colli-sion before cleavage has occurred.
Interestingly, while cleavage by GAPDH siRNA #3 showed strong stimulation by ribosomes when the siRNA binding site was in its native context, the same binding site was no longer ribo-some stimulated in the sequence context of the luciferase reporter (Fig. 4b), suggesting that the interactions between the AGO2 binding site and flanking mRNA sequences determine the degree of binding site masking. Indeed, when AGO2 binding sites were inserted in different mRNAs and at different positions in an mRNA, the magni-tude of target site masking (that is, the ribosome-dependent cleav-age stimulation) varied (Extended Data Fig. 4a–g).
To directly test the role of flanking sequences in AGO2 target site masking, we established an in vitro assay to visualize AGO2 bind-ing to either a short RNA oligonucleotide or the full-length KIF18B mRNA (Fig. 4f–h). As a control, we mutated the siRNA binding site. AGO2 binding to the oligonucleotide target occurred rapidly (t1/2 = 73 ± 8 s, mean ± s.d.), whereas binding to the full-length mRNA target was much slower (t1/2 = 4.1 ± 0.7 ×10³ s, mean ± s.d.) (Fig. 4i), indicating that RNA structures formed in the full-length transcript inhibit binding of AGO2 to the target site. We did not observe many binding events to the mRNA with a mutated AGO2 target site, suggesting that AGO2 does not stably interact with other sequences in the mRNA (Fig. 4i). Because RNA folding is strongly dependent on temperature (with a higher temperature resulting in reduced RNA folding), we repeated the binding assay at 37 °C instead of room temperature (~20 °C) and found that AGO2 bound to the full-length KIF18B target 3.4-fold faster at 37 °C, whereas binding to the oligonucleotide target was only 1.5-fold faster at 37 °C (Fig. 4j,k), suggesting that structural remodeling of the mRNA driven by thermal fluctuations affects AGO2 binding site availability.
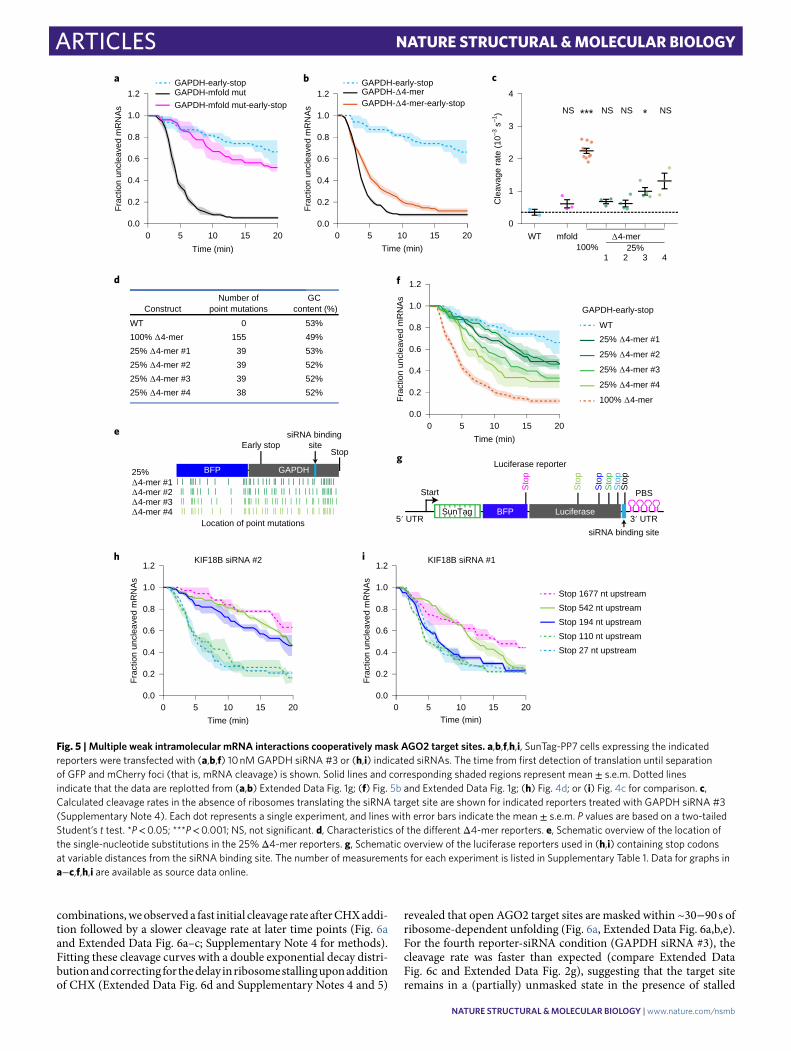
Combinations of multiple weak intramolecular mRNA interac-tions result in potent AGO2 target site masking. To determine
the nature of the structures that mask the AGO2 target sites, we performed structure prediction using mfold45. We generated a new reporter (‘mfold reporter’, based on the GAPDH reporter) that contained 19 substitutions in the mRNA sequence flanking the tar-get site, which disrupted all of the strongest predicted RNA struc-tures involving the AGO2 binding site (Supplementary Note 3). Surprisingly, however, mRNA cleavage was still strongly stimu-lated by ribosomes (Fig. 5a), indicating that the AGO2 binding site remained masked by RNA structures in the mfold reporter mRNA.
It is possible that AGO2 binding site masking arises from numerous weak interactions between the AGO2 binding site and short complementary nucleotide sequences in the target mRNA. To test this hypothesis, we mutated 4-mer sequences in the GAPDH mRNA reporter that showed complementarity to the AGO2 target sequence (that is, disrupting intramolecular RNA-RNA interac-tions), referred to as the ‘Δ4-mer’ reporter (Supplementary Note 3). Removal of 4-mers substantially increased the cleavage rate in the absence of ribosomes translating the AGO2 binding site (~6-fold) (Fig. 5b,c), indicating that AGO2 binding site masking was largely disrupted in the Δ4-mer mRNA. Removal of complementary 4-mers for KIF18B siRNA #1 in the KIF18B reporter also substan-tially reduced ribosome-dependent stimulation of mRNA cleav-age, although residual cleavage stimulation could still be observed (Extended Data Fig. 5a), possibly due to other short sequences with complementarity (for example, 3-mers or 6- or 7-mers with single mismatches). Together, these results suggest that multiple nucleo-tide sequences, each with weak affinity for the AGO2 binding site, together can drive strong target site masking.
If many different sequences within the mRNA contribute to AGO2 target site masking, it is likely that a high degree of structural heterogeneity can exist. To test this, we generated four new Δ4-mer reporters; in each of these reporters, a non-overlapping set of 25% of the single-nucleotide substitutions were introduced that disrupt the complementary 4-mers (Fig. 5d,e and Supplementary Note 3). All four ‘25% Δ4-mer’ reporters showed a partial effect on the cleavage rate (Fig. 5f,c and Extended Data Fig. 5b–e), further suggesting that multiple low-affinity interactions cooperatively cause AGO2 target site masking and that structural heterogeneity underlies robust tar-get site masking.
Finally, we varied the distance between the stop codon and the AGO2 target site to map the distances over which flanking sequences can act to mask the AGO2 target site. This revealed that structures spanning several hundred nucleotides can contribute to AGO2 target site masking (Fig. 5g–i and Extended Data Fig. 5f), consistent with other studies showing that base-pairing interactions can occur over large distances46,47.
mRNA folding kinetics and the translation rate control AGO-target interactions. Although several methods are avail-able to capture ‘snapshots’ of RNA structure46,48–56, very little is known about the structural dynamics of mRNAs in vivo. Such dynamics of mRNA folding and unfolding are likely to be impor-tant, as structural unmasking of binding sites is a key driver of AGO2-target interactions.
Fig. 4 | Masking of mRNA target sites by RNA structures inhibits AgO2-target interactions. a, Schematic of the ‘luciferase’ reporter. Positions of different stop codons and nucleotides complementary to siRNA target site (right) are indicated. b−e, SunTag-PP7 cells expressing the indicated reporters were transfected with 10 nM of the indicated siRNA. The time from first detection of translation until separation of GFP and mCherry foci (that is, mRNA cleavage) is shown. Solid lines and corresponding shaded regions represent mean ± s.e.m. Dotted lines in e indicate that the data are replotted from Fig. 4d for comparison. f, Schematic of the in vitro single-molecule binding assay. g,h, Representative traces of AGO2−siRNA complex binding to (g) the short oligonucleotide target or (h) the full-length KIF18B target. Green line represents Halo-TMR AGO2 (top); red line represents Cy5 RNA signal (bottom). Gray arrows indicate short binding events by AGO2, and black arrows indicate stable binding by the AGO2−siRNA complex. i,j, The cumulative fraction of target RNAs bound by Halo-TMR AGO2 is plotted as a function of time for the indicated reporters at (i) room temperature and (j) 37 °C. k, Ratio of kon at 37 °C and room temperature for the short oligonucleotide target and the full-length KIF18B target. Data are plotted as mean ± s.e.m. (n = 3 independent experiments). The number of measurements for each experiment is listed in Supplementary Table 1. Data for graphs in b−e,i−k are available as source data online.
NATuRE STRuCTuRAL & MOLECuLAR BIOLOgY | www.nature.com/nsmb
ArticlesNATuRE STRucTuRAl & MOlEculAR BiOlOGy
Inhibiting ribosome translocation by the addition of CHX resulted in a decreased cleavage rate (Fig. 2c and Extended Data Fig. 2c–i), suggesting that mRNAs refold after ribosome-dependent
unfolding. We reasoned that upon inhibition of ribosome trans-location, the cleavage rate will decrease over time as refolding of the target site occurs. Indeed, for three out of four reporter-siRNA
k on,
37
°C/k
on, R
T
Shorttarget
Full lengthKIF18B target
0.0
1.5
3.0
4.5k
Add Halo-TMRhAGO2 to chamber
Full-lengthKIF18B target
Short oligonucleotidetarget
j
300
Short oligonucleotide target Full-length KIF18B targetFull-length KIF18B siRNA-resistant target
37 °C
0 100 200
Time (s)
Fra
ctio
n bo
und
0.8
0.6
0.4
0.2
0.0
i
300
Short oligonucleotide target Full-length KIF18B targetFull-length KIF18B siRNA-resistant target
Room temperature
0 100 200
Time (s)
Fra
ctio
n bo
und
0.8
0.6
0.4
0.2
0.0
h Full-length KIF18B target
Stable bindingof AGO2
Addition of AGO2
Short-lived interactions
Inte
nsity
Cy5
In
tens
ityT
MR
0 100 300200Time (s)
0
0
200
400
400
800
Short oligonucleotide targetgStable binding
of AGO2
0 100 300200
Time (s)
Inte
nsity
Cy5
Inte
nsity
TM
R
0
0
200
400
400
800
PEG (-biotin)
Streptavidin
RNA target
Cy5 dye
AGO2 binding site
AGO
2
AGO2
or
AGO
2
Halo-TMR
e f
d
10500.0
0.2
0.4
0.6
0.8
1.0
1.2
15 20
Time (min)
Fra
ctio
n un
clea
ved
mR
NA
s
KIF18B siRNA #2
Stop 1677 nt upstream
Stop 27 nt upstream
Stop downstream
Stop 110 nt upstream
c
2010500.0
0.2
0.4
0.6
0.8
1.0
1.2
15
Time (min)
Fra
ctio
n un
clea
ved
mR
NA
s
KIF18B siRNA #1
Stop 1677 nt upstream
Stop 27 nt upstream
Stop downstream
Stop 110 nt upstream
b
2010500.0
0.2
0.4
0.6
0.8
1.0
1.2
15
Time (min)
Fra
ctio
n un
clea
ved
mR
NA
s
GAPDH siRNA #3
Stop 1677 nt upstreamStop 27 nt upstream
Stop downstream
10500.0
0.2
0.4
0.6
0.8
1.0
1.2
15 20
Time (min)
Fra
ctio
n un
clea
ved
mR
NA
s
KIF18B siRNA #2
Stop 1677 nt upstreamStop 110 nt upstreamStop 110 nt upstream + hairpin
a
5′ UTR 3′ UTR
PBSStart
SunTag BFP Luciferase
Sto
p
siRNA binding site
Sto
pS
top
Sto
pLuciferase reporter
5′ UTR 3′ UTR
PBSStart
SunTag BFP Luciferase
siRNA target site
Sto
pS
topLuciferase reporter
Sequence complementaryto siRNA site
NATuRE STRuCTuRAL & MOLECuLAR BIOLOgY | www.nature.com/nsmb
Articles NATuRE STRucTuRAl & MOlEculAR BiOlOGy
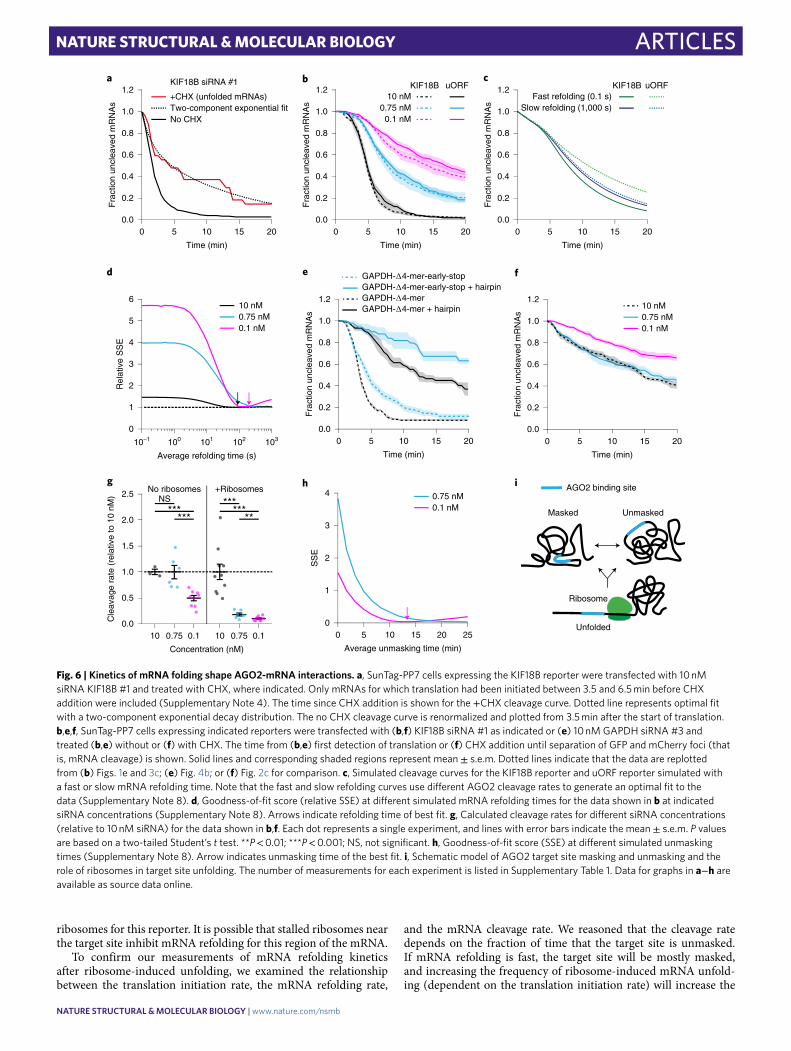
combinations, we observed a fast initial cleavage rate after CHX addi-tion followed by a slower cleavage rate at later time points (Fig. 6a and Extended Data Fig. 6a–c; Supplementary Note 4 for methods). Fitting these cleavage curves with a double exponential decay distri-bution and correcting for the delay in ribosome stalling upon addition of CHX (Extended Data Fig. 6d and Supplementary Notes 4 and 5)
revealed that open AGO2 target sites are masked within ~30−90 s of ribosome-dependent unfolding (Fig. 6a, Extended Data Fig. 6a,b,e). For the fourth reporter-siRNA condition (GAPDH siRNA #3), the cleavage rate was faster than expected (compare Extended Data Fig. 6c and Extended Data Fig. 2g), suggesting that the target site remains in a (partially) unmasked state in the presence of stalled
Stop 1677 nt upstream
Stop 27 nt upstream
Stop 542 nt upstream
Stop 194 nt upstream
Stop 110 nt upstream
i
2010500.0
0.2
0.4
0.6
0.8
1.0
1.2
15Time (min)
Fra
ctio
n un
clea
ved
mR
NA
s
KIF18B siRNA #1h
2010500.0
0.2
0.4
0.6
0.8
1.0
1.2
15
Time (min)
Fra
ctio
n un
clea
ved
mR
NA
s
KIF18B siRNA #2
3′ UTR
PBSStart
SunTag5′ UTR
g
BFP LuciferaseS
top
siRNA binding site
Sto
p
Sto
pS
top
Sto
pS
top
Luciferase reporter
10500.0
0.2
0.4
0.6
0.8
1.0
1.2
15 20
Time (min)
Fra
ctio
n un
clea
ved
mR
NA
s
f
25% ∆4-mer #1
25% ∆4-mer #2
25% ∆4-mer #3
25% ∆4-mer #4
100% ∆4-mer
WT
GAPDH-early-stop
e
BFP GAPDH
Early stopStop
siRNA binding site
∆4-mer #1∆4-mer #2∆4-mer #3∆4-mer #4
25%
Location of point mutations
ConstructGC
content (%)
53%
49%
53%
52%
52%
52%
Number ofpoint mutations
0
155
39
39
39
38
WT
100% ∆4-mer
25% ∆4-mer #1
25% ∆4-mer #2
25% ∆4-mer #3
25% ∆4-mer #4
d
Cle
avag
e ra
te (
10–3
s–1
)
WT mfold100% 25%
∆4-mer
1 2 3 4
0
1
2
3
4
**** NS NSNS NS
cb
10500.0
0.2
0.4
0.6
0.8
1.0
1.2
15 20
Fra
ctio
n un
clea
ved
mR
NA
s
Time (min)
GAPDH-early-stopGAPDH-∆4-merGAPDH-∆4-mer-early-stop
a GAPDH-early-stop
GAPDH-mfold mut-early-stop
GAPDH-mfold mut
10500.0
0.2
0.4
0.6
0.8
1.0
1.2
15 20
Fra
ctio
n un
clea
ved
mR
NA
s
Time (min)
Fig. 5 | Multiple weak intramolecular mRNA interactions cooperatively mask AgO2 target sites. a,b,f,h,i, SunTag-PP7 cells expressing the indicated reporters were transfected with (a,b,f) 10 nM GAPDH siRNA #3 or (h,i) indicated siRNAs. The time from first detection of translation until separation of GFP and mCherry foci (that is, mRNA cleavage) is shown. Solid lines and corresponding shaded regions represent mean ± s.e.m. Dotted lines indicate that the data are replotted from (a,b) Extended Data Fig. 1g; (f) Fig. 5b and Extended Data Fig. 1g; (h) Fig. 4d; or (i) Fig. 4c for comparison. c, Calculated cleavage rates in the absence of ribosomes translating the siRNA target site are shown for indicated reporters treated with GAPDH siRNA #3 (Supplementary Note 4). Each dot represents a single experiment, and lines with error bars indicate the mean ± s.e.m. P values are based on a two-tailed Student’s t test. *P < 0.05; ***P < 0.001; NS, not significant. d, Characteristics of the different Δ4-mer reporters. e, Schematic overview of the location of the single-nucleotide substitutions in the 25% Δ4-mer reporters. g, Schematic overview of the luciferase reporters used in (h,i) containing stop codons at variable distances from the siRNA binding site. The number of measurements for each experiment is listed in Supplementary Table 1. Data for graphs in a−c,f,h,i are available as source data online.
NATuRE STRuCTuRAL & MOLECuLAR BIOLOgY | www.nature.com/nsmb
ArticlesNATuRE STRucTuRAl & MOlEculAR BiOlOGy
ribosomes for this reporter. It is possible that stalled ribosomes near the target site inhibit mRNA refolding for this region of the mRNA.
To confirm our measurements of mRNA refolding kinetics after ribosome-induced unfolding, we examined the relationship between the translation initiation rate, the mRNA refolding rate,
and the mRNA cleavage rate. We reasoned that the cleavage rate depends on the fraction of time that the target site is unmasked. If mRNA refolding is fast, the target site will be mostly masked, and increasing the frequency of ribosome-induced mRNA unfold-ing (dependent on the translation initiation rate) will increase the
i AGO2 binding site
Unfolded
UnmaskedMasked
Ribosome
h
1050 15 20
Average unmasking time (min)
0
1
2
3
4
SS
E
25
0.75 nM0.1 nM***
*****
0.10.7510
g
0.10.7510
Concentration (nM)
0.0
0.5
1.0
1.5
2.0
2.5
Cle
avag
e ra
te (
rela
tive
to 1
0 nM
) NS***
***
+RibosomesNo ribosomes
f
10 nM0.75 nM0.1 nM
1050 15 20
Fra
ctio
n un
clea
ved
mR
NA
s
0.0
0.2
0.4
0.6
0.8
1.0
1.2
Time (min)
GAPDH-∆4-mer
10500.0
0.2
0.4
0.6
0.8
1.0
1.2
15 20
Time (min)
Fra
ctio
n un
clea
ved
mR
NA
s GAPDH-∆4-mer + hairpin
GAPDH-∆4-mer-early-stopeGAPDH-∆4-mer-early-stop + hairpin
10–1 100 101 102 103
Average refolding time (s)
0
1
2
3
4
5
6
Rel
ativ
e S
SE
10 nM0.75 nM0.1 nM
d
1050 15 20
Fra
ctio
n un
clea
ved
mR
NA
s
0.0
0.2
0.4
0.6
0.8
1.0
1.2
Time (min)
10 nM0.75 nM
0.1 nM
KIF18B uORFcb
KIF18B uORFFast refolding (0.1 s)
Slow refolding (1,000 s)
105 15 20
Fra
ctio
n un
clea
ved
mR
NA
s
0.0
0.2
0.4
0.6
0.8
1.0
1.2
Time (min)
0
+CHX (unfolded mRNAs)Two-component exponential fitNo CHX
a
1050 15 20
Fra
ctio
n un
clea
ved
mR
NA
s
0.0
0.2
0.4
0.6
0.8
1.0
1.2
Time (min)
KIF18B siRNA #1
Fig. 6 | Kinetics of mRNA folding shape AgO2-mRNA interactions. a, SunTag-PP7 cells expressing the KIF18B reporter were transfected with 10 nM siRNA KIF18B #1 and treated with CHX, where indicated. Only mRNAs for which translation had been initiated between 3.5 and 6.5 min before CHX addition were included (Supplementary Note 4). The time since CHX addition is shown for the +CHX cleavage curve. Dotted line represents optimal fit with a two-component exponential decay distribution. The no CHX cleavage curve is renormalized and plotted from 3.5 min after the start of translation. b,e,f, SunTag-PP7 cells expressing indicated reporters were transfected with (b,f) KIF18B siRNA #1 as indicated or (e) 10 nM GAPDH siRNA #3 and treated (b,e) without or (f) with CHX. The time from (b,e) first detection of translation or (f) CHX addition until separation of GFP and mCherry foci (that is, mRNA cleavage) is shown. Solid lines and corresponding shaded regions represent mean ± s.e.m. Dotted lines indicate that the data are replotted from (b) Figs. 1e and 3c; (e) Fig. 4b; or (f) Fig. 2c for comparison. c, Simulated cleavage curves for the KIF18B reporter and uORF reporter simulated with a fast or slow mRNA refolding time. Note that the fast and slow refolding curves use different AGO2 cleavage rates to generate an optimal fit to the data (Supplementary Note 8). d, Goodness-of-fit score (relative SSE) at different simulated mRNA refolding times for the data shown in b at indicated siRNA concentrations (Supplementary Note 8). Arrows indicate refolding time of best fit. g, Calculated cleavage rates for different siRNA concentrations (relative to 10 nM siRNA) for the data shown in b,f. Each dot represents a single experiment, and lines with error bars indicate the mean ± s.e.m. P values are based on a two-tailed Student’s t test. **P < 0.01; ***P < 0.001; NS, not significant. h, Goodness-of-fit score (SSE) at different simulated unmasking times (Supplementary Note 8). Arrow indicates unmasking time of the best fit. i, Schematic model of AGO2 target site masking and unmasking and the role of ribosomes in target site unfolding. The number of measurements for each experiment is listed in Supplementary Table 1. Data for graphs in a−h are available as source data online.
NATuRE STRuCTuRAL & MOLECuLAR BIOLOgY | www.nature.com/nsmb
Articles NATuRE STRucTuRAl & MOlEculAR BiOlOGy
cleavage rate. In contrast, if the mRNA refolds slowly, the target site will still be unmasked when the next ribosome arrives, and increas-ing the translation initiation rate will not increase the cleavage rate. Thus, by measuring the cleavage rate at different translation initia-tion rates, we can assess the mRNA folding rate.
We introduced an upstream open reading frame (uORF) into the KIF18B reporter (‘uORF-KIF18B’ reporter), which reduced the translation initiation rate by 3.3-fold (Extended Data Fig. 6f and Supplementary Note 5). Measuring mRNA cleavage rates for both the KIF18B and the uORF-KIF18B reporters at three differ-ent siRNA concentrations (10 nM, 0.75 nM, and 0.1 nM) revealed similar cleavage rates for both reporters at each concentration of siRNA (Fig. 6b), suggesting a relatively slow mRNA refolding rate. To quantitatively assess the mRNA refolding rate, we developed a computational framework to simulate mRNA cleavage curves at different (theoretical) AGO2 cleavage rates, mRNA folding rates, and translation initiation rates (Supplementary Note 8). As expected, we found that at fast refolding rates, the simulations pre-dict a relatively large difference between the cleavage rate of the KIF18B and uORF-KIF18B reporter, whereas a small difference in cleavage rate is predicted at slow mRNA refolding rates (Fig. 6c). To compare the simulated and experimental cleavage curves at differ-ent theoretical mRNA folding rates, we computed a goodness-of-fit score (sum of squared errors (SSE); Fig. 6d and Supplementary Note 8). For both 10 nM and 0.1 nM, the optimal fit was achieved when simulating an mRNA refolding time of ~30−180 s, whereas a somewhat slower refolding time (>180 s; a precise value could not be given due to the absence of a local minimum) was found for the 0.75 nM condition (Fig. 6d). Overall, these results are in reasonably good agreement with the measurements of mRNA refolding upon CHX treatment (30−90 s).
Our results suggest that the (complex) mRNA struc-tures that stably mask the AGO2 target site refold slowly after ribosome-dependent unfolding, allowing the target site to be unmasked continuously, even when a ribosome passes the target site only one or two times per minute. In contrast, for a simple RNA structure, such as a hairpin, refolding is expected to occur rapidly after ribosome-mediated unfolding, limiting the stimu-latory effect of ribosomes on AGO2-target interactions. To test this, we introduced the siRNA target site into a hairpin structure (Supplementary Note 3). For this experiment, we selected differ-ent reporters in which the target site is unmasked in the absence of ribosomes (for example, GAPDH Δ4-mer reporter; Fig 5b, or the luciferase reporter; Fig 4b). As expected, introduction of the hairpin structure strongly reduced the cleavage rate in the absence of ribosomes (Fig. 6e and Extended Data Fig. 6g). Interestingly, cleavage rates in the presence of translating ribosomes were also reduced in these hairpin reporters (Fig. 6e and Extended Data Fig. 6g), indicating that ribosomes indeed unmask target sites less efficiently when the target site is present in a fast-folding RNA struc-ture (Extended Data Fig. 6h). These results suggest that ribosomes predominantly stimulate AGO2 target binding by unfolding slowly refolding structures, which are likely to represent more-complex secondary or tertiary structures.
Slow structural dynamics limit AGO2 binding in the 3′ UTR. When positioned in non-translated regions of the mRNA (that is, 3′ UTR), AGO2 binding sites are not unfolded by ribosomes, yet cleavage still occurs (albeit at a slower rate). Therefore, struc-tural unmasking of the target site must occur through alternative mechanisms. One possibility is that mRNAs switch between dif-ferent structural conformations over time and that AGO2 target sites are only masked in a subset of all possible structural configu-rations. If structural rearrangements occur on a timescale that is much faster than AGO2-target binding (~1–18 min for 0.1–10 nM siRNA; Fig. 3b), AGO2-target binding will be rate-limiting for
mRNA cleavage in the 3′ UTR, and the mRNA cleavage rate will depend primarily on the AGO2−siRNA concentration. In contrast, if structural rearrangements occur at rates similar to or slower than AGO2-target binding, structural unmasking becomes an (addi-tional) rate-limiting step, and the mRNA cleavage rate will become less sensitive to the siRNA concentration. Interestingly, the cleav-age rate in the absence of ribosomes showed a weak dependency on siRNA concentration (Fig. 6f,g and Extended Data Fig. 6i), dem-onstrating that, in the absence of translating ribosomes, structural unmasking of target sites, rather than AGO2−siRNA concentration in the cell is the main rate-limiting step for mRNA cleavage.
To quantitatively investigate the dynamics of ribosome-independent structural rearrangements, we simulated the effect of decreasing the siRNA concentration on the mRNA cleavage rate in the absence of ribosomes (Supplementary Note 8). For slow (simulated) struc-tural dynamics, we found that the simulated mRNA cleavage rate is less sensitive to siRNA concentration (0.1−10 nM) than for fast dynamics (Extended Data Fig. 6j), consistent with the experimen-tal data (Fig. 6f). To extract quantitative information about the ribosome-independent unmasking time of our reporter mRNA through simulations, we compared the experimental cleavage curves at different siRNA concentrations (0.75 nM and 0.1 nM) to multiple simulated cleavage curves (each with different unmasking times) using a goodness-of-fit score (SSE). Further analysis revealed that the best fits were obtained with unmasking times of >10 min (Fig. 6h), indicating that target site unmasking becomes a rate-limiting step in mRNA cleavage, especially at higher concentrations of siRNA (between 0.75 nM and 10 nM). Furthermore, these simulations indi-cate that target site unmasking in the 3′ UTR (that is, in the absence of translating ribosomes) is much slower (>10 min) than the unmask-ing rate in the CDS (where target sites are unfolded every ~25 s by a translating ribosome for our reporters), highlighting the impor-tance of ribosome-mediated unmasking of target sites for efficient AGO-target interactions.
DiscussionIn this study, we use a live-cell imaging approach to visualize transla-tion and AGO2-mediated cleavage of individual mRNA molecules. This work provides in vivo measurements of AGO2 cleavage kinet-ics and reveals how mRNA structural dynamics and heterogeneity shape AGO-target interactions.
Paradoxical roles of ribosomes in controlling AGO2-mRNA tar-get interactions. Recent reports showed that ribosomes reduce the overall degree of structure in the CDS of the transcriptome27,54,57,58 and that AGO target sites are less efficiently recognized if they are embedded within a strong structure26,27,29–31. Here, we show that ribosome-dependent unfolding of mRNA structures stimulates AGO-target interactions, thereby providing a direct, causal link between mRNA translation and AGO2-target binding. Interestingly, not all siRNA-target combinations were stimulated to the same extent by ribosomes (Fig. 2d), indicating that some siRNA target sites are always accessible, or, alternatively, are masked by mRNA structures that refold rapidly after ribosome-dependent unfolding.
The observation that siRNA-mediated mRNA cleavage is more efficient in an actively translated region seems to contrast with pre-vious reports that miRNAs repress their target more efficiently when bound to the 3′ UTR24,25. It is possible that ribosomes also inhibit AGO-target interactions, for example, by displacing AGO from the mRNA through physical collisions24,59. Thus, ribosomes may have two opposing activities that affect AGO-target interactions. The net effect of ribosomes on AGO-dependent target silencing may depend on a number of different factors, including the degree of tar-get masking, the translation initiation rate and the time required for AGO−siRNA complexes to repress their target mRNA upon bind-ing. Interestingly, previous analysis revealed that miRNA target sites
NATuRE STRuCTuRAL & MOLECuLAR BIOLOgY | www.nature.com/nsmb
ArticlesNATuRE STRucTuRAl & MOlEculAR BiOlOGy
positioned immediately downstream of the stop codon are highly active24. Consistent with this, we find that AGO binds very effi-ciently to target sites positioned immediately downstream of the stop codon, because ribosomes translating upstream mRNA sequences can stimulate unmasking of target sites immediately downstream of the stop codon (Fig. 4c,d). Therefore, binding sites immediately downstream of the stop codon may be most potent, as they benefit from the stimulatory activity of ribosomes, while being protected from the inhibitory effect of ribosome-AGO collisions. A paradoxi-cal role of ribosomes in both stimulating and inhibiting RBP-mRNA interactions may not be limited to AGO family proteins, but may broadly shape the interactions of RBPs with their target RNAs.
mRNA structural dynamics and heterogeneity. For AGO target sites masked by RNA structure, mutation of all or subsets of short complementary 4-mer sequences in the target mRNA reduced target site masking (Fig. 5f), indicating that multiple (or many) sequences in the target mRNA can contribute to target site mask-ing and that different structural configurations exist that can mask the AGO2 target site. Additionally, mRNA molecules may also form intermolecular RNA-RNA interactions, potentially further inhibit-ing AGO2-target interactions. Finally, RBPs may also inhibit AGO2 binding at specific target sites, although our results suggest that inhibition through structural masking is a more common mecha-nism (Fig. 4c,d).
Individual 4-mer base pair interactions generally have rapid binding and unbinding kinetics. Surprisingly though, our data sug-gest that target sites can remain masked for >10 min in the absence of ribosomes (Fig. 6h). How can we reconcile these two apparently contradictory findings? One speculative model is that mRNAs form stable three-dimensional structures in which multiple sequences with weak affinity for the AGO2 target site are positioned in prox-imity to the target site, resulting in frequent interactions and robust target site masking (Fig. 6i). In this model, the key activity of ribo-somes would be to unfold the stable three-dimensional structure that facilitates target site masking, rather than directly disrupt-ing target site interactions with complementary sequences. In the absence of translating ribosomes, such structures could persist for long periods of time (>10 min), explaining the slow cleavage kinet-ics for some reporters in which the AGO2 binding is located in the 3′ UTR (examples in Fig. 2c and Extended Data Fig. 2g). Possibly, such three-dimensional structures stochastically rearrange over time through thermal fluctuations of the mRNA, resulting in AGO2 target site unmasking (without complete unfolding of the mRNA), or structures are unfolded or refolded sporadically by cellular helicases such as EIF4A60 to allow target cleavage. Together, these results provide a high temporal resolution analysis of the struc-tural dynamics of an mRNA molecule in vivo and a framework for understanding the role of mRNA structural dynamics in shaping RBP-mRNA interactions.
Online contentAny methods, additional references, Nature Research report-ing summaries, source data, extended data, supplementary infor-mation, acknowledgements, peer review information; details of author contributions and competing interests; and statements of data and code availability are available at https://doi.org/10.1038/s41594-020-0461-1.
Received: 6 January 2020; Accepted: 11 June 2020; Published: xx xx xxxx
References 1. Bartel, D. P. Metazoan microRNAs. Cell 173, 20–51 (2018). 2. Gebert, L. F. R. & MacRae, I. J. Regulation of microRNA function in animals.
Nat. Rev. Mol. Cell Biol. 20, 21–37 (2019).
3. Ghildiyal, M. & Zamore, P. D. Small silencing RNAs: an expanding universe. Nat. Rev. Genet. 10, 94–108 (2009).
4. Malone, C. D. & Hannon, G. J. Small RNAs as guardians of the genome. Cell 136, 656–668 (2009).
5. Ozata, D. M., Gainetdinov, I., Zoch, A., O’Carroll, D. & Zamore, P. D. PIWI-interacting RNAs: small RNAs with big functions. Nat. Rev. Genet. 20, 89–108 (2019).
6. Jonas, S. & Izaurralde, E. Towards a molecular understanding of microRNA-mediated gene silencing. Nat. Rev. Genet. 16, 421–433 (2015).
7. Iwasaki, Y. W., Siomi, M. C. & Siomi, H. PIWI-interacting RNA: its biogenesis and functions. Annu. Rev. Biochem. 84, 405–433 (2015).
8. Liu, J. et al. Argonaute2 is the catalytic engine of mammalian RNAi. Science 305, 1437–1441 (2004).
9. Meister, G. Argonaute proteins: functional insights and emerging roles. Nat. Rev. Genet. 14, 447–459 (2013).
10. Schirle, N. T., Sheu-Gruttadauria, J. & MacRae, I. J. Structural basis for microRNA targeting. Science 346, 608–613 (2014).
11. Song, J. J., Smith, S. K., Hannon, G. J. & Joshua-Tor, L. Crystal structure of Argonaute and its implications for RISC slicer activity. Science 305, 1434–1437 (2004).
12. Chandradoss, S. D., Schirle, N. T., Szczepaniak, M., MacRae, I. J. & Joo, C. A dynamic search process underlies microRNA targeting. Cell 162, 96–107 (2015).
13. Jo, M. H. et al. Human Argonaute 2 has diverse reaction pathways on target RNAs. Mol. Cell 59, 117–124 (2015).
14. Salomon, W. E., Jolly, S. M., Moore, M. J., Zamore, P. D. & Serebrov, V. Single-molecule imaging reveals that argonaute reshapes the binding properties of its nucleic acid guides. Cell 162, 84–95 (2015).
15. Wee, L. M., Flores-Jasso, C. F., Salomon, W. E. & Zamore, P. D. Argonaute divides its RNA guide into domains with distinct functions and RNA-binding properties. Cell 151, 1055–1067 (2012).
16. Yao, C., Sasaki, H. M., Ueda, T., Tomari, Y. & Tadakuma, H. Single-molecule analysis of the target cleavage reaction by the drosophila RNAi enzyme complex. Mol. Cell 59, 125–132 (2015).
17. Jung, S. R. et al. Dynamic anchoring of the 3′-end of the guide strand controls the target dissociation of Argonaute-guide complex. J. Am. Chem. Soc. 135, 16865–16871 (2013).
18. Meister, G. et al. Human Argonaute2 mediates RNA cleavage targeted by miRNAs and siRNAs. Mol. Cell 15, 185–197 (2004).
19. Sheu-Gruttadauria, J. & MacRae, I. J. Structural foundations of RNA silencing by Argonaute. J. Mol. Biol. 429, 2619–2639 (2017).
20. Hentze, M. W., Castello, A., Schwarzl, T. & Preiss, T. A brave new world of RNA-binding proteins. Nat. Rev. Mol. Cell Biol. 19, 327–341 (2018).
21. Jankowsky, E. & Harris, M. E. Specificity and nonspecificity in RNA-protein interactions. Nat. Rev. Mol. Cell Biol. 16, 533–544 (2015).
22. Bhattacharyya, S. N., Habermacher, R., Martine, U., Closs, E. I. & Filipowicz, W. Relief of microRNA-mediated translational repression in human cells subjected to stress. Cell 125, 1111–1124 (2006).
23. Kedde, M. et al. RNA-binding protein Dnd1 inhibits microRNA access to target mRNA. Cell 131, 1273–1286 (2007).
24. Grimson, A. et al. MicroRNA targeting specificity in mammals: determinants beyond seed pairing. Mol. Cell 27, 91–105 (2007).
25. Gu, S., Jin, L., Zhang, F., Sarnow, P. & Kay, M. A. Biological basis for restriction of microRNA targets to the 3′ untranslated region in mammalian mRNAs. Nat. Struct. Mol. Biol. 16, 144–150 (2009).
26. Ameres, S. L., Martinez, J. & Schroeder, R. Molecular basis for target RNA recognition and cleavage by human RISC. Cell 130, 101–112 (2007).
27. Beaudoin, J. D. et al. Analyses of mRNA structure dynamics identify embryonic gene regulatory programs. Nat. Struct. Mol. Biol. 25, 677–686 (2018).
28. Becker, W. R. et al. High-Throughput Analysis Reveals Rules for Target RNA Binding and Cleavage by AGO2. Mol. Cell 75, 741–755.e11 (2019).
29. Brown, K. M., Chu, C. Y. & Rana, T. M. Target accessibility dictates the potency of human RISC. Nat. Struct. Mol. Biol. 12, 469–470 (2005).
30. Kertesz, M., Iovino, N., Unnerstall, U., Gaul, U. & Segal, E. The role of site accessibility in microRNA target recognition. Nat. Genet. 39, 1278–1284 (2007).
31. Tafer, H. et al. The impact of target site accessibility on the design of effective siRNAs. Nat. Biotechnol. 26, 578–583 (2008).
32. Chen, S. J. RNA folding: conformational statistics, folding kinetics, and ion electrostatics. Annu. Rev. Biophys. 37, 197–214 (2008).
33. Ganser, L. R., Kelly, M. L., Herschlag, D. & Al-Hashimi, H. M. The roles of structural dynamics in the cellular functions of RNAs. Nat. Rev. Mol. Cell Biol. 20, 474–489 (2019).
34. Solomatin, S. V., Greenfeld, M., Chu, S. & Herschlag, D. Multiple native states reveal persistent ruggedness of an RNA folding landscape. Nature 463, 681–684 (2010).
35. Ditzler, M. A., Rueda, D., Mo, J., Hakansson, K. & Walter, N. G. A rugged free energy landscape separates multiple functional RNA folds throughout denaturation. Nucleic Acids Res. 36, 7088–7099 (2008).
NATuRE STRuCTuRAL & MOLECuLAR BIOLOgY | www.nature.com/nsmb

Articles NATuRE STRucTuRAl & MOlEculAR BiOlOGy
36. Pichon, X. et al. Visualization of single endogenous polysomes reveals the dynamics of translation in live human cells. J. Cell Biol. 214, 769–781 (2016).
37. Yan, X., Hoek, T. A., Vale, R. D. & Tanenbaum, M. E. Dynamics of translation of single mRNA molecules in vivo. Cell 165, 976–989 (2016).
38. Morisaki, T. et al. Real-time quantification of single RNA translation dynamics in living cells. Science 352, 1425–1429 (2016).
39. Wu, B., Eliscovich, C., Yoon, Y. J. & Singer, R. H. Translation dynamics of single mRNAs in live cells and neurons. Science 352, 1430–1435 (2016).
40. Wang, C., Han, B., Zhou, R. & Zhuang, X. Real-time imaging of translation on single mRNA transcripts in live cells. Cell 165, 990–1001 (2016).
41. Horvathova, I. et al. The dynamics of mRNA turnover revealed by single-molecule imaging in single cells. Mol. Cell 68, 615–625.e9 (2017).
42. Lam, J. K., Chow, M. Y., Zhang, Y. & Leung, S. W. siRNA versus miRNA as therapeutics for gene silencing. Mol. Ther. Nucleic Acids 4, e252 (2015).
43. Hoek, T. A. et al. Single-Molecule Imaging Uncovers Rules Governing Nonsense-Mediated mRNA Decay. Mol. Cell 75, 324–339.e11 (2019).
44. Tanenbaum, M. E., Vale, R. D., Stern-Ginossar, N. & Weissman, J. S. Regulation of mRNA translation during mitosis. Elife 4, e07957 (2015).
45. Zuker, M. Mfold web server for nucleic acid folding and hybridization prediction. Nucleic Acids Res. 31, 3406–3415 (2003).
46. Lu, Z. et al. RNA duplex map in living cells reveals higher-order transcriptome structure. Cell 165, 1267–1279 (2016).
47. Metkar, M. et al. Higher-Order Organization Principles of Pre-translational mRNPs. Mol. Cell 72, 715–726.e3 (2018).
48. Strobel, E. J., Yu, A. M. & Lucks, J. B. High-throughput determination of RNA structures. Nat. Rev. Genet. 19, 615–634 (2018).
49. Gong, J. et al. RISE: a database of RNA interactome from sequencing experiments. Nucleic Acids Res. 46, D194–D201 (2018).
50. Aw, J. G. et al. In vivo mapping of eukaryotic RNA interactomes reveals principles of higher-order organization and regulation. Mol. Cell 62, 603–617 (2016).
51. Rouskin, S., Zubradt, M., Washietl, S., Kellis, M. & Weissman, J. S. Genome-wide probing of RNA structure reveals active unfolding of mRNA structures in vivo. Nature 505, 701–705 (2014).
52. Wan, Y. et al. Landscape and variation of RNA secondary structure across the human transcriptome. Nature 505, 706–709 (2014).
53. Zubradt, M. et al. DMS-MaPseq for genome-wide or targeted RNA structure probing in vivo. Nat. Methods 14, 75–82 (2017).
54. Mustoe, A. M. et al. Pervasive regulatory functions of mRNA structure revealed by high-resolution SHAPE probing. Cell 173, 181–195.e18 (2018).
55. Bevilacqua, P. C., Ritchey, L. E., Su, Z. & Assmann, S. M. Genome-wide analysis of RNA secondary structure. Annu. Rev. Genet. 50, 235–266 (2016).
56. Ding, Y. et al. In vivo genome-wide profiling of RNA secondary structure reveals novel regulatory features. Nature 505, 696–700 (2014).
57. Adivarahan, S. et al. Spatial organization of single mRNPs at different stages of the gene expression pathway. Mol. Cell 72, 727–738.e5 (2018).
58. Mizrahi, O. et al. Virus-Induced Changes in mRNA Secondary Structure Uncover cis-Regulatory Elements that Directly Control Gene Expression. Mol. Cell 72, 862–874.e5 (2018).
59. Bartel, D. P. MicroRNAs: target recognition and regulatory functions. Cell 136, 215–233 (2009).
60. Tauber, D. et al. Modulation of RNA condensation by the DEAD-box protein eIF4A. Cell 180, 411–426.e16 (2020).
Publisher’s note Springer Nature remains neutral with regard to jurisdictional claims in published maps and institutional affiliations.
© The Author(s), under exclusive licence to Springer Nature America, Inc. 2020
NATuRE STRuCTuRAL & MOLECuLAR BIOLOgY | www.nature.com/nsmb

ArticlesNATuRE STRucTuRAl & MOlEculAR BiOlOGy
MethodsCell culture. Insect Sf9 cells (Expression Systems (Davis, CA), 94-001 S) were grown in Insect XPRESS medium (Lonza). Human U2OS cells (ATCC, HTB-96) and HEK293T cells (ATCC, CRL-3216) were grown in DMEM (4.5 g L−1 glucose, Gibco) containing 5% fetal bovine serum (Sigma-Aldrich) and 1% penicillin and streptomycin (Gibco). Cells were grown at 37 °C and with 5% CO2. Where indicated, cycloheximide (CHX) (ThermoFisher) was used at a final concentration of 200 µg ml−1, and emetine (Eme) (Sigma-Aldrich) was used at a final concentration of 100 µg ml−1. All human cell lines were tested for mycoplasma and found to be mycoplasma free.
Live-cell imaging experiments were performed using U2OS cells, stably expressing TetR, scFv-sfGFP, and PCP-mCherry-CAAX (referred to as SunTag-PP7 cells)37 as well as the reporter of interest. The smFISH imaging experiments were performed in a monoclonal cell line, stably expressing TetR, scFv-sfGFP, PCP-Halo-CAAX, and the 24xGCN4-KIF18B-24xPP7 reporter. Northern blot experiments were performed using two monoclonal cell lines, both expressing TetR, scFv-sfGFP, PCP-Halo-CAAX, and either the 24xGCN4-KIF18B-24xPP7 reporter or the 24xGCN4-KIF18B-early-stop-PP7 reporter.
Plasmid transfections for stable integration. Plasmid design and sequences can be found in Supplementary Note 3. Cells were plated 1 day before transfection in a 6-cm dish (Greiner Bio-One). A transfection mix, containing 100 µl OptiMEM (Sigma-Aldrich), 2 µl FUGENE 6 (Promega), and ~1 µg of DNA, was added to the cells in a total volume of 1 ml cell culture medium per dish. Selection for stable integration was initiated 24 h after transfection, using 0.4 mg ml−1 Zeocin (Invitrogen) and continued for at least 10 d. To generate monoclonal cell lines, single cells from the polyclonal cell line were sorted into 96-well plates (Greiner Bio-One) by FACS, and grown for 14 d. Individual clones were inspected by microscopy, and clones in which a high percentage of cells expressing the transgene were selected for further use. For generating stable monoclonal cell lines expressing reporter mRNA, clones were additionally screened for the number of mRNAs expressed per cell. Clones expressing ~10−50 mRNAs per cell were selected.
siRNA transfections. The complete list and sequence of all siRNAs used in this study is provided in Supplementary Note 2. siRNAs were designed using the siDESIGN Center (Horizon) and ordered from Dharmacon, except KIF18B siRNA #1 (AM16708, 251223; ThermoFisher) and GAPDH siRNA #1 (4390849, ThermoFisher). siRNAs were reverse transfected at a final concentration of 10 nM (unless stated otherwise) using RNAiMAX (Invitrogen), according to the manufacturer’s guidelines. KIF18B siRNA #3 was transfected at a final concentration of 50 nM, as it showed weak target repression at 10 nM. For all microscopy experiments, cells were seeded at a confluency of ~40−50% in 96-well glass-bottom imaging plates (Matriplate, Brooks) in a final volume of 200 µl and imaged 16−24 h after transfection. For northern blot experiments, cells were seeded at a confluency of ~40−50% in a 6-cm plate (Greiner Bio-one) in a final volume of 3 ml and harvested 16−24 h after transfection. For qPCR experiments, cells were seeded in a 24-well plate (Greiner Bio-one) and harvested 16−24 h after transfection.
Lentivirus production and infection. For lentivirus production, HEK293T cells were plated in a 6-well plate (Greiner Bio-one) at 30% confluency and transfected 24 h after plating with a mixture of 50 µl OptiMEM (Sigma-Aldrich), 10 µl polyethylenimine (PEI) (Polysciences Inc) (1 mg ml−1), 0.4 µg pMD2.g, 0.6 µg psPAX2, and 1 µg of lentiviral vector. The medium was replaced with 2 ml fresh culture medium 24 h after transfection, and 72 h after transfection, viral supernatant was collected. For lentiviral infections, cells were seeded in a 6-well plate (Greiner Bio-One) at 70% confluency. Viral supernatant was added to the cells along with Polybrene (10 µg ml−1) (Santa Cruz Biotechnology Inc), and the cells were spun at 2,000 r.p.m. for 90 min at 37 °C (spin infection). After the spin infection, the culture medium was replaced with fresh medium, and cells were incubated for at least 48 h before further analysis.
CRISPRi-mediated knockdown of endogenous AGO2. To knock down endogenous AGO2, we made use of CRISPRi; we reasoned that siRNA-mediated approaches would not be very efficient because they rely on the presence of AGO2. For CRISPRi-mediated knockdown of AGO2, we expressed dCAS9-BFP-KRAB in cells stably expressing TetR, scFv-sfGFP, PCP-Halo-CAAX, and 24xGCN4-KIF18B-24xPP7. The 30% highest BFP-expressing cells were isolated by FACS sorting for further use. A sgRNA targeting AGO2 (sequence: GCGCGTCGGGTAAACCTGTT) was expressed in cells together with BFP through lentiviral transduction. The BFP signal associated with the sgRNA was much higher than the BFP associated with dCAS9-BFP-KRAB, and thus, sgRNA-positive cells could be identified in dCAS9-BFP-KRAB-expressing cells. qPCR and imaging were performed 4−5 d after infection with the sgRNA. In experiments in which cleavage was measured after AGO2 knockdown in combination with expression of an exogenous AGO2 rescue construct (insensitive to the sgRNAs targeting endogenous AGO2), cells were infected with an AGO2 expression construct 10−11 d before imaging. As an AGO2 rescue construct, we used pLJM1-FH-AGO2-WT, which was a gift from J. Mendell (Addgene plasmid
#91978; http://n2t.net/addgene:91978)61. Cells expressing exogenous AGO2 were selected with puromycin (2 µg ml−1) (ThermoFisher). Infection with exogenous AGO2 was followed by a second infection 4−5 d before imaging with the sgRNA targeting AGO2 to knockdown endogenous AGO2.
smFISH. Single-molecule fluorescence in situ hybridization (smFISH) was performed as described previously5,62,63. Five oligonucleotide probes against the PP7 array and 48 probes against the SunTag array were designed using the website www.biosearchtech.com (the complete list and sequences of smFISH probes used in this study are provided in Supplementary Note 2). Probes were synthesized with a 3′ amine modification. Probes were then coupled to either a Cy5 or an Alexa 594 fluorescent dye (Cy5 succinimidyl ester (GE Healthcare) or Alexa Fluor 594 fluorcarboxylic acid succinimidyl ester (Molecular Probes/Invitrogen), respectively) as described previously63, and HPLC purified (ELLA Biotech GmbH). Purified probes were dissolved in 50 µl TE and used at a final dilution of 1:2,000. For hybridization, cells were plated in a 96-well glass-bottomed dish (Matriplate, Brooks) 16−24 h before fixation. Doxycycline (1 µg ml−1) (Sigma-Aldrich) was added 40−90 min before fixation (as indicated). Cells were fixed in PBS with 4% paraformaldehyde (Electron Microscopy Science) for 15 min at room temperature, washed twice with PBS, and incubated for 30 min in 100% ethanol at 4 °C. After fixation, cells were washed twice in hybridization buffer with 10% formamide (ThermoFisher) at room temperature, followed by overnight incubation with the probes in hybridization buffer at 37 °C. After overnight incubation, samples were washed three times for 1 h in wash buffer at 37 °C. DAPI (Sigma-Aldrich) was added to the final wash step to stain the nuclei. Shortly before imaging, samples were placed in anti-bleach buffer62,63 to reduce fluorescence bleaching.
Expression and purification of TMR-HaloTag-AGO2-siRNA. His6-Flag-TEV-Halo-tagged human AGO2 protein was expressed in Sf9 cells using a baculovirus system (Invitrogen); 750 ml of Sf9 cells at 1.7 ×10⁶ cells ml−1 were infected for 60 h at 27 °C. Infected cells were harvested by centrifugation and resuspended in 30 ml of lysis buffer (50 mM NaH2PO4, pH 8, 300 mM NaCl, 5% glycerol, 0.5 mM TCEP). Resuspended cells were lysed by passing through an M-110P lab homogenizer twice (Microfluidics). The resulting total cell lysate was clarified by centrifugation (30,000g for 25 min), and the soluble fraction was applied to 1.5 ml (packed) Ni-NTA resin (Qiagen) and incubated at 4 °C for 1.5 h in 50-ml conical tubes. Resin was pelleted by brief centrifugation, and the supernatant solution was discarded. The resin was washed with 50 ml ice cold nickel wash buffer (300 mM NaCl, 15 mM imidazole, 0.5 mM TCEP, 50 mM Tris, pH 8). Centrifugation and wash steps were repeated a total of three times. Copurifying cellular RNAs were degraded by incubating with 100 units of micrococcal nuclease (Clontech) on resin in ~15 ml of nickel wash buffer supplemented with 5 mM CaCl2 at room temperature for 45 min. The nuclease-treated resin was washed three times again with nickel wash buffer and then eluted in four column volumes of nickel elution buffer (300 mM NaCl, 300 mM imidazole, 0.5 mM TCEP, 50 mM Tris, pH 8). Eluted AGO2 was incubated with a synthetic siRNA and 150 µg of TEV protease during an overnight dialysis against 1–2 L of dialysis buffer (300 mM NaCl, 0.5 mM TCEP, 50 mM Tris, pH 8) at 4 °C. The sequence of the siRNA is provided in Supplementary Note 2. Please note that the first nucleotide is a U instead of a G (as in the original KIF18B siRNA #1 sequence) to improve siRNA loading in AGO2, which does not affect AGO2-target binding64. AGO2 molecules loaded with the siRNA were isolated using an immobilized capture oligonucleotide with complementarity to the siRNA, and then eluted by adding competitor DNA with more extensive complementarity to the capture oligonucleotide via the Arpon method65. Sequences of the capture oligonucleotide and competitor DNA are provided in Supplementary Note 2. Loaded AGO2 proteins were further purified via size-exclusion chromatography using a Superdex Increase 10/300 column (GE Healthcare Life Sciences) equilibrated in 1 M NaCl, 50 mM Tris, pH 8, 0.5 mM TCEP. Purified Halo-AGO2−siRNA complex was incubated with Halo-TMR ligand (Promega) and dialyzed against 2 L of 1× PBS (137 mM NaCl, KCl 2.7 mM, 10 mM Na2HPO4, 1.8 mM KH2PO4), concentrated to ~2 mg ml−1, aliquoted, flash frozen with liquid mitrogen, and stored at −80 °C.
In vitro target RNA synthesis and purification. A short RNA oligonucleotide (sequence provided in Supplementary Note 2) was ordered from IBA Lifesciences, labeled with a Cy5 dye (Sigma-Aldrich), as described previously66, and purified using ethanol precipitation. The labeled oligonucleotide was subsequently ligated to a U30-mer with biotin using T4 RNA ligase II (NEB) and a DNA splint (sequence provided in Supplementary Note 2).
Full-length mRNA targets (KIF18B sequence or KIF18B sequence with a mutated siRNA target site) were in vitro transcribed using the HiScribe T7 High Yield RNA Synthesis Kit (NEB), and purified using phenol-chloroform extraction and ethanol precipitation. The complete sequences of the full-length mRNA targets are provided in Supplementary Note 2. The full-length mRNA targets were ligated to a 22-nt Cy5-labeled and biotinylated RNA oligonucleotide using a 40-nt DNA strand as a splint. The sequences of the oligonucleotide and DNA splint are provided in Supplementary Note 2. After ligation with T4 RNA ligase II (NEB), the ligated constructs were purified from an agarose gel using a Zymo Gel RNA recovery kit (Baseclear).
NATuRE STRuCTuRAL & MOLECuLAR BIOLOgY | www.nature.com/nsmb
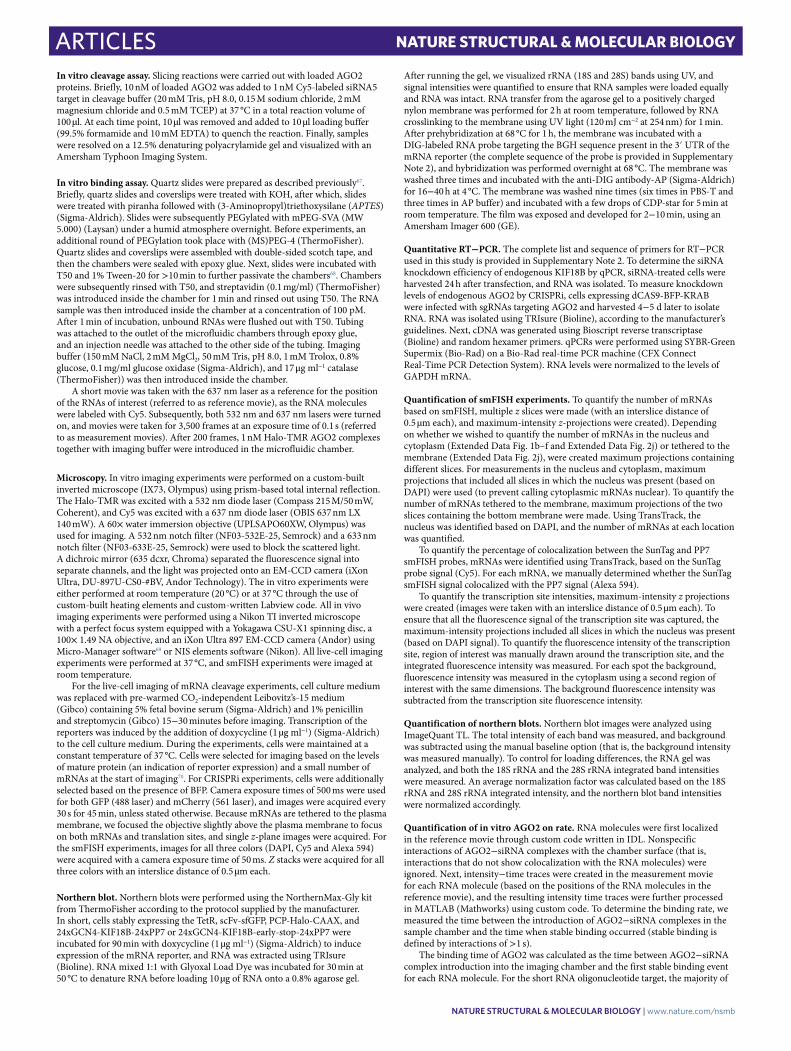
Articles NATuRE STRucTuRAl & MOlEculAR BiOlOGy
In vitro cleavage assay. Slicing reactions were carried out with loaded AGO2 proteins. Briefly, 10 nM of loaded AGO2 was added to 1 nM Cy5-labeled siRNA5 target in cleavage buffer (20 mM Tris, pH 8.0, 0.15 M sodium chloride, 2 mM magnesium chloride and 0.5 mM TCEP) at 37 °C in a total reaction volume of 100 µl. At each time point, 10 µl was removed and added to 10 µl loading buffer (99.5% formamide and 10 mM EDTA) to quench the reaction. Finally, samples were resolved on a 12.5% denaturing polyacrylamide gel and visualized with an Amersham Typhoon Imaging System.
In vitro binding assay. Quartz slides were prepared as described previously67. Briefly, quartz slides and coverslips were treated with KOH, after which, slides were treated with piranha followed with (3-Aminopropyl)triethoxysilane (APTES) (Sigma-Aldrich). Slides were subsequently PEGylated with mPEG-SVA (MW 5.000) (Laysan) under a humid atmosphere overnight. Before experiments, an additional round of PEGylation took place with (MS)PEG-4 (ThermoFisher). Quartz slides and coverslips were assembled with double-sided scotch tape, and then the chambers were sealed with epoxy glue. Next, slides were incubated with T50 and 1% Tween-20 for >10 min to further passivate the chambers68. Chambers were subsequently rinsed with T50, and streptavidin (0.1 mg/ml) (ThermoFisher) was introduced inside the chamber for 1 min and rinsed out using T50. The RNA sample was then introduced inside the chamber at a concentration of 100 pM. After 1 min of incubation, unbound RNAs were flushed out with T50. Tubing was attached to the outlet of the microfluidic chambers through epoxy glue, and an injection needle was attached to the other side of the tubing. Imaging buffer (150 mM NaCl, 2 mM MgCl2, 50 mM Tris, pH 8.0, 1 mM Trolox, 0.8% glucose, 0.1 mg/ml glucose oxidase (Sigma-Aldrich), and 17 μg ml−1 catalase (ThermoFisher)) was then introduced inside the chamber.
A short movie was taken with the 637 nm laser as a reference for the position of the RNAs of interest (referred to as reference movie), as the RNA molecules were labeled with Cy5. Subsequently, both 532 nm and 637 nm lasers were turned on, and movies were taken for 3,500 frames at an exposure time of 0.1 s (referred to as measurement movies). After 200 frames, 1 nM Halo-TMR AGO2 complexes together with imaging buffer were introduced in the microfluidic chamber.
Microscopy. In vitro imaging experiments were performed on a custom-built inverted microscope (IX73, Olympus) using prism-based total internal reflection. The Halo-TMR was excited with a 532 nm diode laser (Compass 215 M/50 mW, Coherent), and Cy5 was excited with a 637 nm diode laser (OBIS 637 nm LX 140 mW). A 60× water immersion objective (UPLSAPO60XW, Olympus) was used for imaging. A 532 nm notch filter (NF03-532E-25, Semrock) and a 633 nm notch filter (NF03-633E-25, Semrock) were used to block the scattered light. A dichroic mirror (635 dcxr, Chroma) separated the fluorescence signal into separate channels, and the light was projected onto an EM-CCD camera (iXon Ultra, DU-897U-CS0-#BV, Andor Technology). The in vitro experiments were either performed at room temperature (20 °C) or at 37 °C through the use of custom-built heating elements and custom-written Labview code. All in vivo imaging experiments were performed using a Nikon TI inverted microscope with a perfect focus system equipped with a Yokagawa CSU-X1 spinning disc, a 100× 1.49 NA objective, and an iXon Ultra 897 EM-CCD camera (Andor) using Micro-Manager software69 or NIS elements software (Nikon). All live-cell imaging experiments were performed at 37 °C, and smFISH experiments were imaged at room temperature.
For the live-cell imaging of mRNA cleavage experiments, cell culture medium was replaced with pre-warmed CO2-independent Leibovitz’s-15 medium (Gibco) containing 5% fetal bovine serum (Sigma-Aldrich) and 1% penicillin and streptomycin (Gibco) 15−30 minutes before imaging. Transcription of the reporters was induced by the addition of doxycycline (1 µg ml−1) (Sigma-Aldrich) to the cell culture medium. During the experiments, cells were maintained at a constant temperature of 37 °C. Cells were selected for imaging based on the levels of mature protein (an indication of reporter expression) and a small number of mRNAs at the start of imaging70. For CRISPRi experiments, cells were additionally selected based on the presence of BFP. Camera exposure times of 500 ms were used for both GFP (488 laser) and mCherry (561 laser), and images were acquired every 30 s for 45 min, unless stated otherwise. Because mRNAs are tethered to the plasma membrane, we focused the objective slightly above the plasma membrane to focus on both mRNAs and translation sites, and single z-plane images were acquired. For the smFISH experiments, images for all three colors (DAPI, Cy5 and Alexa 594) were acquired with a camera exposure time of 50 ms. Z stacks were acquired for all three colors with an interslice distance of 0.5 µm each.
Northern blot. Northern blots were performed using the NorthernMax-Gly kit from ThermoFisher according to the protocol supplied by the manufacturer. In short, cells stably expressing the TetR, scFv-sfGFP, PCP-Halo-CAAX, and 24xGCN4-KIF18B-24xPP7 or 24xGCN4-KIF18B-early-stop-24xPP7 were incubated for 90 min with doxycycline (1 µg ml−1) (Sigma-Aldrich) to induce expression of the mRNA reporter, and RNA was extracted using TRIsure (Bioline). RNA mixed 1:1 with Glyoxal Load Dye was incubated for 30 min at 50 °C to denature RNA before loading 10 µg of RNA onto a 0.8% agarose gel.
After running the gel, we visualized rRNA (18S and 28S) bands using UV, and signal intensities were quantified to ensure that RNA samples were loaded equally and RNA was intact. RNA transfer from the agarose gel to a positively charged nylon membrane was performed for 2 h at room temperature, followed by RNA crosslinking to the membrane using UV light (120 mJ cm−2 at 254 nm) for 1 min. After prehybridization at 68 °C for 1 h, the membrane was incubated with a DIG-labeled RNA probe targeting the BGH sequence present in the 3′ UTR of the mRNA reporter (the complete sequence of the probe is provided in Supplementary Note 2), and hybridization was performed overnight at 68 °C. The membrane was washed three times and incubated with the anti-DIG antibody-AP (Sigma-Aldrich) for 16−40 h at 4 °C. The membrane was washed nine times (six times in PBS-T and three times in AP buffer) and incubated with a few drops of CDP-star for 5 min at room temperature. The film was exposed and developed for 2−10 min, using an Amersham Imager 600 (GE).
Quantitative RT−PCR. The complete list and sequence of primers for RT−PCR used in this study is provided in Supplementary Note 2. To determine the siRNA knockdown efficiency of endogenous KIF18B by qPCR, siRNA-treated cells were harvested 24 h after transfection, and RNA was isolated. To measure knockdown levels of endogenous AGO2 by CRISPRi, cells expressing dCAS9-BFP-KRAB were infected with sgRNAs targeting AGO2 and harvested 4−5 d later to isolate RNA. RNA was isolated using TRIsure (Bioline), according to the manufacturer’s guidelines. Next, cDNA was generated using Bioscript reverse transcriptase (Bioline) and random hexamer primers. qPCRs were performed using SYBR-Green Supermix (Bio-Rad) on a Bio-Rad real-time PCR machine (CFX Connect Real-Time PCR Detection System). RNA levels were normalized to the levels of GAPDH mRNA.
Quantification of smFISH experiments. To quantify the number of mRNAs based on smFISH, multiple z slices were made (with an interslice distance of 0.5 µm each), and maximum-intensity z-projections were created). Depending on whether we wished to quantify the number of mRNAs in the nucleus and cytoplasm (Extended Data Fig. 1b–f and Extended Data Fig. 2j) or tethered to the membrane (Extended Data Fig. 2j), were created maximum projections containing different slices. For measurements in the nucleus and cytoplasm, maximum projections that included all slices in which the nucleus was present (based on DAPI) were used (to prevent calling cytoplasmic mRNAs nuclear). To quantify the number of mRNAs tethered to the membrane, maximum projections of the two slices containing the bottom membrane were made. Using TransTrack, the nucleus was identified based on DAPI, and the number of mRNAs at each location was quantified.
To quantify the percentage of colocalization between the SunTag and PP7 smFISH probes, mRNAs were identified using TransTrack, based on the SunTag probe signal (Cy5). For each mRNA, we manually determined whether the SunTag smFISH signal colocalized with the PP7 signal (Alexa 594).
To quantify the transcription site intensities, maximum-intensity z projections were created (images were taken with an interslice distance of 0.5 µm each). To ensure that all the fluorescence signal of the transcription site was captured, the maximum-intensity projections included all slices in which the nucleus was present (based on DAPI signal). To quantify the fluorescence intensity of the transcription site, region of interest was manually drawn around the transcription site, and the integrated fluorescence intensity was measured. For each spot the background, fluorescence intensity was measured in the cytoplasm using a second region of interest with the same dimensions. The background fluorescence intensity was subtracted from the transcription site fluorescence intensity.
Quantification of northern blots. Northern blot images were analyzed using ImageQuant TL. The total intensity of each band was measured, and background was subtracted using the manual baseline option (that is, the background intensity was measured manually). To control for loading differences, the RNA gel was analyzed, and both the 18S rRNA and the 28S rRNA integrated band intensities were measured. An average normalization factor was calculated based on the 18S rRNA and 28S rRNA integrated intensity, and the northern blot band intensities were normalized accordingly.
Quantification of in vitro AGO2 on rate. RNA molecules were first localized in the reference movie through custom code written in IDL. Nonspecific interactions of AGO2−siRNA complexes with the chamber surface (that is, interactions that do not show colocalization with the RNA molecules) were ignored. Next, intensity−time traces were created in the measurement movie for each RNA molecule (based on the positions of the RNA molecules in the reference movie), and the resulting intensity time traces were further processed in MATLAB (Mathworks) using custom code. To determine the binding rate, we measured the time between the introduction of AGO2−siRNA complexes in the sample chamber and the time when stable binding occurred (stable binding is defined by interactions of >1 s).
The binding time of AGO2 was calculated as the time between AGO2−siRNA complex introduction into the imaging chamber and the first stable binding event for each RNA molecule. For the short RNA oligonucleotide target, the majority of
NATuRE STRuCTuRAL & MOLECuLAR BIOLOgY | www.nature.com/nsmb
ArticlesNATuRE STRucTuRAl & MOlEculAR BiOlOGy
molecules were bound by an AGO2 molecule within our time window of 350 s. To calculate the on rate, we fit the data with the following equation:
FðtÞ ¼ A ´ ð1� e�kon ´ tÞ
where F is the fraction of bound molecules, A is the maximum bound fraction, t is the time, and kon is the on rate.
For the full-length mRNA targets, most molecules were not bound by an AGO2 molecule within our time window of 350 s. Therefore, it was not possible to fit the data with above equation, and we instead linearized the equation, resulting in:
F tð Þ ¼ A 1� e�kon t� �
¼ A 1� 1� kont þkont2
2!� ¼
� �� � A ´ kon ´ t
The approximation is valid as long as the product kon ´ tI
is very small. Using the linearized equation, we fit the data points from the first 100 s to determine the value of A ´ kon
I. Next, we calculated kon by dividing with A. We took the value of A
that we had fit with the short oligonucleotide target.
Statistics. Statistical comparisons were made using a two-tailed Student’s t test, except for data shown in Extended Data Fig. 1k, which was based on a paired two-tailed Student’s t test. N values for each experiment can be found in Supplementary Table 1, and exact P values for all statistical comparisons can be found in the source data. All modeling and related statistics are described in Supplementary Notes 4–8.
Reporting Summary. Further information on research design is available in the Nature Research Reporting Summary linked to this article.
Data availabilityA selection of the raw imaging data (related to Figs. 1–6) used in this study is available on Mendeley (https://doi.org/10.17632/h2r32zhgwn.1). Source data are available with the paper online.
Code availabilityCustom code used in this study is available on Mendeley (https://doi.org/10.17632/h2r32zhgwn.1). Source data are provided with this paper.
References 61. Golden, R. J. et al. An Argonaute phosphorylation cycle promotes
microRNA-mediated silencing. Nature 542, 197–202 (2017). 62. Raj, A., van den Bogaard, P., Rifkin, S. A., van Oudenaarden, A. & Tyagi, S.
Imaging individual mRNA molecules using multiple singly labeled probes. Nat. Methods 5, 877–879 (2008).
63. Lyubimova, A. et al. Single-molecule mRNA detection and counting in mammalian tissue. Nat. Protoc. 8, 1743–1758 (2013).
64. Frank, F., Sonenberg, N. & Nagar, B. Structural basis for 5′-nucleotide base-specific recognition of guide RNA by human AGO2. Nature 465, 818–822 (2010).
65. Flores-Jasso, C. F., Salomon, W. E. & Zamore, P. D. Rapid and specific purification of Argonaute-small RNA complexes from crude cell lysates. RNA 19, 271–279 (2013).
66. Joo, C. & Ha, T. Single-molecule FRET with total internal reflection microscopy. Cold Spring Harb. Protoc. https://doi.org/10.1101/pdb.top072058 (2012).
67. Chandradoss, S. D. et al. Surface passivation for single-molecule protein studies. J. Vis. Exp. 86, e50549 (2014).
68. Pan, H., Xia, Y., Qin, M., Cao, Y. & Wang, W. A simple procedure to improve the surface passivation for single molecule fluorescence studies. Phys. Biol. 12, 045006 (2015).
69. Edelstein, A., Amodaj, N., Hoover, K., Vale, R. & Stuurman, N. Computer control of microscopes using microManager. Curr. Protoc. Mol. Biol. 92, 14.20.1–14.20.17 (2010).
70. Ruijtenberg, S., Hoek, T. A., Yan, X. & Tanenbaum, M. E. Imaging translation dynamics of single mRNA molecules in live cells. Methods Mol. Biol. 1649, 385–404 (2018).
AcknowledgementsWe thank M. Depken for helpful discussions with the computational modeling. We thank L. Steller, I. Bally, and R. Banerjee for help with experiments. We would also like to thank the Tanenbaum lab members for helpful discussions and T. Hoek and D. Khuperkar for critical reading of the manuscript. This work was financially supported by the European Research Council (ERC) through an ERC starting grant (ERCSTG 677936-RNAREG) to M.E.T., a VENI grant from the Netherlands Organization for Scientific Research (NWO) (NWO 016.VENI.171.050) to S.R., an ERC consolidator grant (819299) and a VIDI grant from NWO (864.14.002) to C.J., and the National Institute of General Medical Sciences (R35 GM127090) to I.J.M.; M.E.T., S.R., S.S., D.d.S. and I.L. are supported by the Oncode Institute that is partly funded by the Dutch Cancer Society (KWF).
Author ContributionsS.R., S.S. and M.E.T. conceived the project; S.R., S.S., I.L., and D.d.S. performed the in vivo experiments and analyzed the data; S.S. performed the computational modeling; T.J.C. performed the in vitro experiments and analyzed the data under supervision of C.J.; Y.X. purified the hAGO2 complex under supervision of I.J.M.; S.R., S.S. and T.J.C. prepared the figures; S.R., S.S. and M.E.T. wrote the manuscript; and T.J.C., Y.X., I.J.M. and C.J. provided input.
Competing interestsThe authors declare no competing interests.
Additional informationExtended data is available for this paper at https://doi.org/10.1038/s41594-020-0461-1.
Supplementary information is available for this paper at https://doi.org/10.1038/s41594-020-0461-1.
Correspondence and requests for materials should be addressed to M.E.T.
Peer review information Peer reviewer reports are available. Anke Sparmann was the primary editor on this article and managed its editorial process and peer review in collaboration with the rest of the editorial team.
Reprints and permissions information is available at www.nature.com/reprints.
NATuRE STRuCTuRAL & MOLECuLAR BIOLOgY | www.nature.com/nsmb
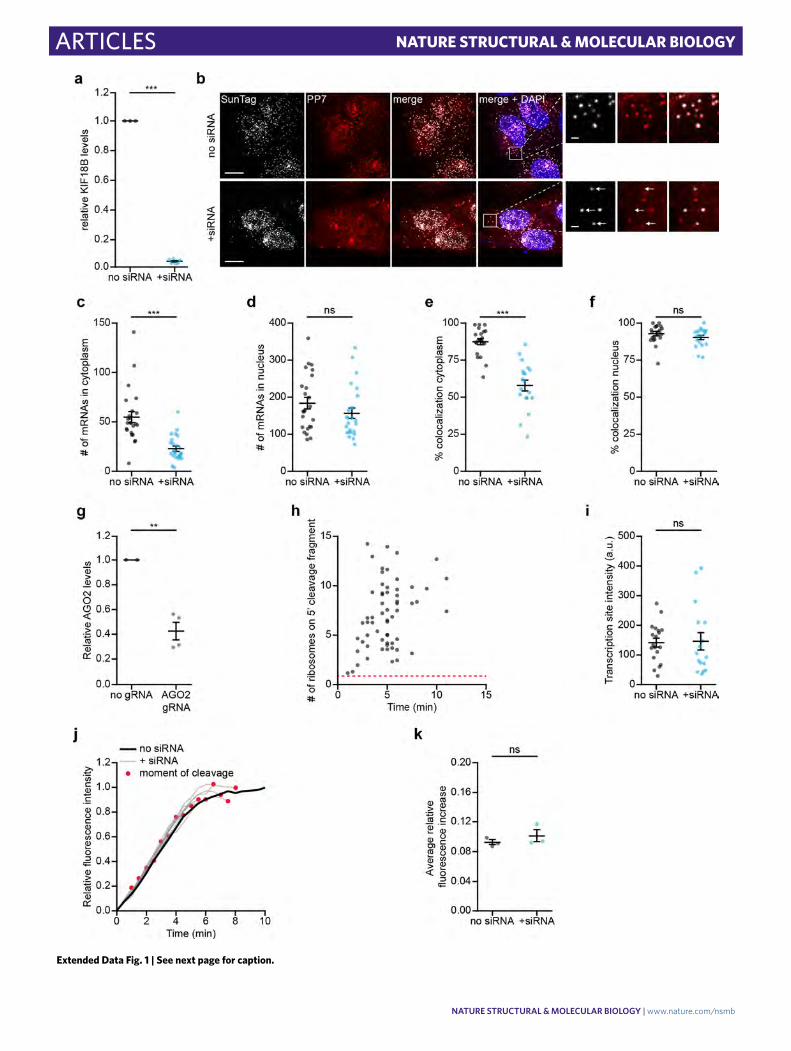
Articles NATuRE STRucTuRAl & MOlEculAR BiOlOGy
Extended Data Fig. 1 | See next page for caption.
NATuRE STRuCTuRAL & MOLECuLAR BIOLOgY | www.nature.com/nsmb
ArticlesNATuRE STRucTuRAl & MOlEculAR BiOlOGy
Extended Data Fig. 1 | Effects of AgO2-siRNA complexes on mRNA transcription and translation. a, Relative mRNA levels of endogenous KIF18B based on qPCR in non-transfected cells (no siRNA) and cells transfected with KIF18B siRNA #1 (+ siRNA). Each dot represents an independent experiment and lines with error bars indicate the mean ± SEM. b-f, i, Cells expressing the KIF18B reporter without siRNA (no siRNA) or transfected with 10 nM KIF18B siRNA #1 (+ siRNA) were fixed and incubated with smFish probes to visualize reporter mRNAs. b, Representative images of cells incubated with smFISH probes targeting the KIF18B reporter (SunTag-Cy5 and PP7-Alexa594) in no siRNA cells (upper panel) and + siRNA cells (lower panel). Arrows in insets indicate mRNA molecules for which the 5′ end (SunTag-Cy5 probe) and 3′ end (PP7-Alexa594 probe) do not co-localize. Scale bar, 10 µm in large images and 1 µm in insets. c-d, Number of mRNAs in no siRNA and + siRNA cells in (c) the cytoplasm and (d) the nucleus determined based on smFISH using probes targeting the SunTag sequence. Each dot represents a single cell and lines with error bars indicate the mean ± SEM. e-f, Percentage of mRNAs for which the 5′ end (labeled with SunTag probes) and 3′ end (labeled with PP7 probes) co-localized in no siRNA and + siRNA cells, either in (e) the cytoplasm or (f) the nucleus. Each dot represents a single cell and lines with error bars indicate the mean ± SEM. g, Relative AGO2 mRNA levels based on qPCR in control cells (no gRNA) and cells treated with a CRISPRi guide targeting endogenous AGO2 (AGO2 gRNA). Each dot represents an independent experiment and lines with error bars indicate the mean ± SEM. h, SunTag-PP7 cells expressing the KIF18B reporter were transfected with KIF18B siRNA #1. The number of ribosomes present on the 5′ cleavage fragment was determined one frame after the moment of cleavage (see Supplementary Note 4). Dotted red line indicates the intensity of a single SunTag array (that is the intensity associated with a single ribosome). i, Cells were treated for 40 min with dox and the integrated intensity of transcription sites was determined with smFISH probes targeting the SunTag sequence. Each dot represents a single transcription site and lines with error bars indicate the mean ± SEM. j-k, SunTag-PP7 cells expressing the KIF18B reporter were untransfected (no siRNA) or transfected with KIF18B siRNA #1 (+ siRNA). j, GFP intensity over time associated with individual mRNAs is shown for no siRNA cells (black line) and + siRNA cells (grey lines). Black line indicates average of all mRNAs in no siRNA cells, while each grey line represents the average GFP intensity of all mRNAs cleaved at the same moment relative to the start of translation (see Supplementary Note 5). The red dot indicates the moment of cleavage. k, Average increase in GFP fluorescence intensity either between 1.5-4 min after the start of translation (no siRNA) or at the moment preceding mRNA cleavage (+ siRNA) is shown (see Supplementary Note 5). Each dot represents the average of an independent experiment and lines with error bars indicate the mean ± SEM. a, c-f, g, i, P-values are based on a two-tailed Student’s t-test. k, P-value is based on a paired two-tailed t-test. P-values are indicated as * (p < 0.05), ** (p < 0.01), *** (p < 0.001), ns = not significant. Number of measurements for each experiment is listed in Supplementary Table 1. Data for graphs in a,c-k are available as source data.
NATuRE STRuCTuRAL & MOLECuLAR BIOLOgY | www.nature.com/nsmb
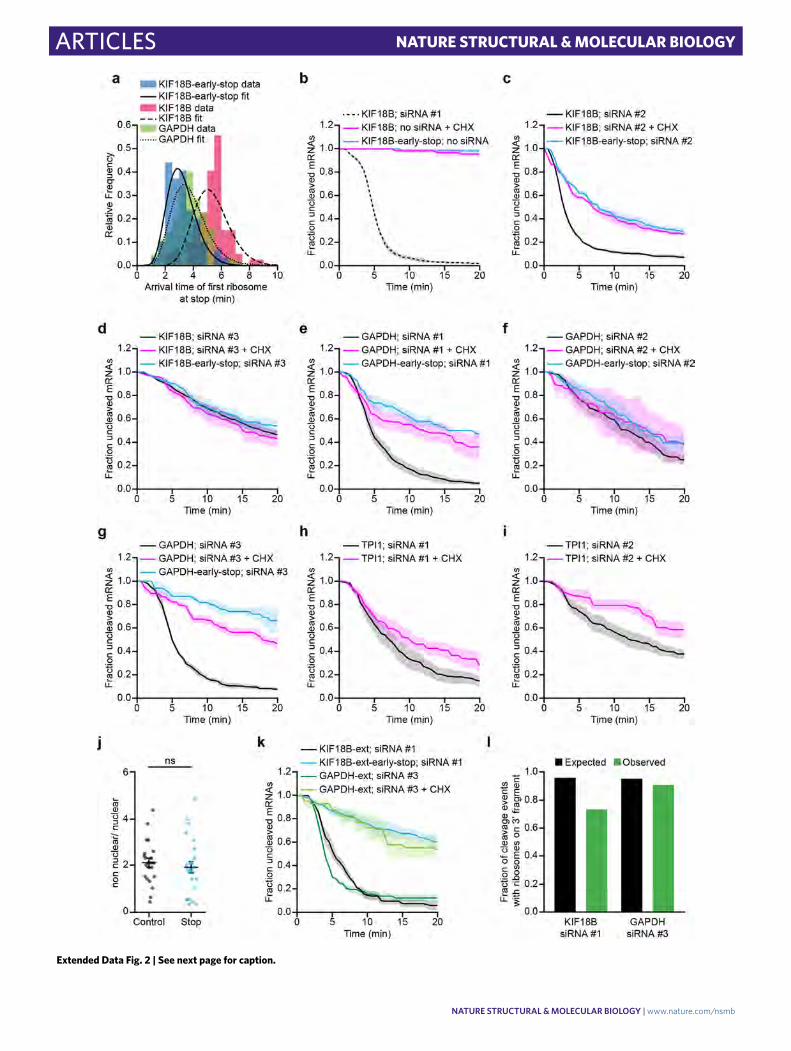
Articles NATuRE STRucTuRAl & MOlEculAR BiOlOGy
Extended Data Fig. 2 | See next page for caption.
NATuRE STRuCTuRAL & MOLECuLAR BIOLOgY | www.nature.com/nsmb
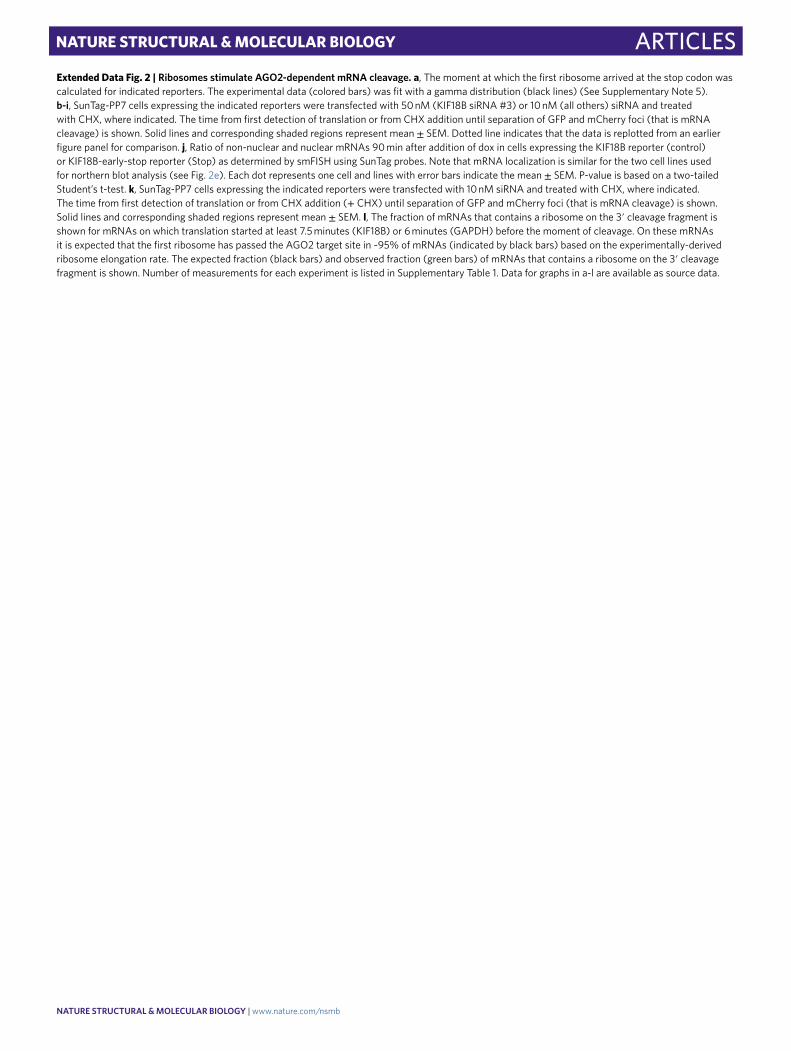
ArticlesNATuRE STRucTuRAl & MOlEculAR BiOlOGy
Extended Data Fig. 2 | Ribosomes stimulate AgO2-dependent mRNA cleavage. a, The moment at which the first ribosome arrived at the stop codon was calculated for indicated reporters. The experimental data (colored bars) was fit with a gamma distribution (black lines) (See Supplementary Note 5). b-i, SunTag-PP7 cells expressing the indicated reporters were transfected with 50 nM (KIF18B siRNA #3) or 10 nM (all others) siRNA and treated with CHX, where indicated. The time from first detection of translation or from CHX addition until separation of GFP and mCherry foci (that is mRNA cleavage) is shown. Solid lines and corresponding shaded regions represent mean ± SEM. Dotted line indicates that the data is replotted from an earlier figure panel for comparison. j, Ratio of non-nuclear and nuclear mRNAs 90 min after addition of dox in cells expressing the KIF18B reporter (control) or KIF18B-early-stop reporter (Stop) as determined by smFISH using SunTag probes. Note that mRNA localization is similar for the two cell lines used for northern blot analysis (see Fig. 2e). Each dot represents one cell and lines with error bars indicate the mean ± SEM. P-value is based on a two-tailed Student’s t-test. k, SunTag-PP7 cells expressing the indicated reporters were transfected with 10 nM siRNA and treated with CHX, where indicated. The time from first detection of translation or from CHX addition (+ CHX) until separation of GFP and mCherry foci (that is mRNA cleavage) is shown. Solid lines and corresponding shaded regions represent mean ± SEM. l, The fraction of mRNAs that contains a ribosome on the 3′ cleavage fragment is shown for mRNAs on which translation started at least 7.5 minutes (KIF18B) or 6 minutes (GAPDH) before the moment of cleavage. On these mRNAs it is expected that the first ribosome has passed the AGO2 target site in ~95% of mRNAs (indicated by black bars) based on the experimentally-derived ribosome elongation rate. The expected fraction (black bars) and observed fraction (green bars) of mRNAs that contains a ribosome on the 3′ cleavage fragment is shown. Number of measurements for each experiment is listed in Supplementary Table 1. Data for graphs in a-l are available as source data.
NATuRE STRuCTuRAL & MOLECuLAR BIOLOgY | www.nature.com/nsmb
Articles NATuRE STRucTuRAl & MOlEculAR BiOlOGy
Extended Data Fig. 3 | In vivo and in vitro kinetics of the AgO2 cleavage cycle. a, In vitro AGO2 cleavage reaction with purified AGO2 loaded with KIF18B siRNA #1 and a short oligonucleotide target containing the KIF18B siRNA #1 target sequence. b, Quantification of the cleaved fraction of blot in (a). c, Calculated cleavage rates in the presence of translating ribosomes are shown for different siRNA concentrations (see Supplementary Note 4). Dots and error bars indicate the mean ± SEM. Number of measurements for each experiment is listed in Supplementary Table 1. Data for graphs in b,c are available as source data.
NATuRE STRuCTuRAL & MOLECuLAR BIOLOgY | www.nature.com/nsmb

ArticlesNATuRE STRucTuRAl & MOlEculAR BiOlOGy
Extended Data Fig. 4 | See next page for caption.
NATuRE STRuCTuRAL & MOLECuLAR BIOLOgY | www.nature.com/nsmb
Articles NATuRE STRucTuRAl & MOlEculAR BiOlOGy
Extended Data Fig. 4 | Degree of structural masking depends on the AgO2 binding sequence and the surrounding sequence. a, Schematic of the KIF18B reporter in which the position of the siRNA #1 and siRNA #2 binding sites are swapped. b-c, SunTag-PP7 cells expressing indicated reporters were transfected with (b) 10 nM KIF18B siRNA #1 or (c) 10 nM KIF18B siRNA #2. The time from first detection of translation until separation of GFP and mCherry foci (that is mRNA cleavage) is shown. Solid lines and corresponding shaded regions represent mean ± SEM. Dotted lines indicate that the data is replotted from an earlier figure panel for comparison. d, Schematic of the GAPDH reporter in which the KIF18B siRNA #1 or KIF18B siRNA #2 binding site is placed at the position of GAPDH siRNA #3. e-f, SunTag-PP7 cells expressing the indicated reporters were transfected with (e) 10 nM KIF18B siRNA #1 or (f) 10 nM KIF18B siRNA #2. The time from first detection of translation or CHX addition until mRNA cleavage is shown. Note that data of the KIF18B-early-stop reporter and KIF18B reporter treated with CHX are combined to generate the cleavage curve for cleavage in the absence of ribosomes. Solid lines and corresponding shaded regions represent mean ± SEM. g, Ratio of cleavage rate in the presence and absence of ribosomes is shown for the indicated siRNAs and reporters (see Supplementary Note 4). Each dot represents a single experiment and lines with error bars indicate the mean ± SEM. P-values are based on a two-tailed Student’s t-test. P-values are indicated as * (p < 0.05), ** (p < 0.01), *** (p < 0.001). K1, K2 and G3 indicate the position of the indicated siRNA. K1 refers to the position of KIF18B siRNA #1, K2 to KIF18B siRNA #2 and G3 to GAPDH siRNA #3. Light blue and light green data points are replotted from an earlier experiment. Number of measurements for each experiment is listed in Supplementary Table 1. Data for graphs in b,c,e-g are available as source data.
NATuRE STRuCTuRAL & MOLECuLAR BIOLOgY | www.nature.com/nsmb

ArticlesNATuRE STRucTuRAl & MOlEculAR BiOlOGy
Extended Data Fig. 5 | Multiple weak intramolecular mRNA interactions together result in potent AgO2 target site masking. a-e, SunTag-PP7 cells expressing the indicated reporters were transfected with (a) 10 nM KIF18B siRNA #1 or (b-e) 10 nM GAPDH siRNA #3. The time from first detection of translation until separation of GFP and mCherry foci (that is mRNA cleavage) is shown. Solid lines and corresponding shaded regions represent mean ± SEM. Dotted lines indicate that the data is replotted from an earlier figure panel for comparison. f, Cleavage rates for the ‘luciferase’ reporters with indicated siRNA target sites and with different distances between the stop codon and the siRNA target site are shown. Each dot and error bar indicate the mean ± SEM. Dotted lines are only for visualization. Number of measurements for each experiment is listed in Supplementary Table 1. Data for graphs in a-f are available as source data.
NATuRE STRuCTuRAL & MOLECuLAR BIOLOgY | www.nature.com/nsmb
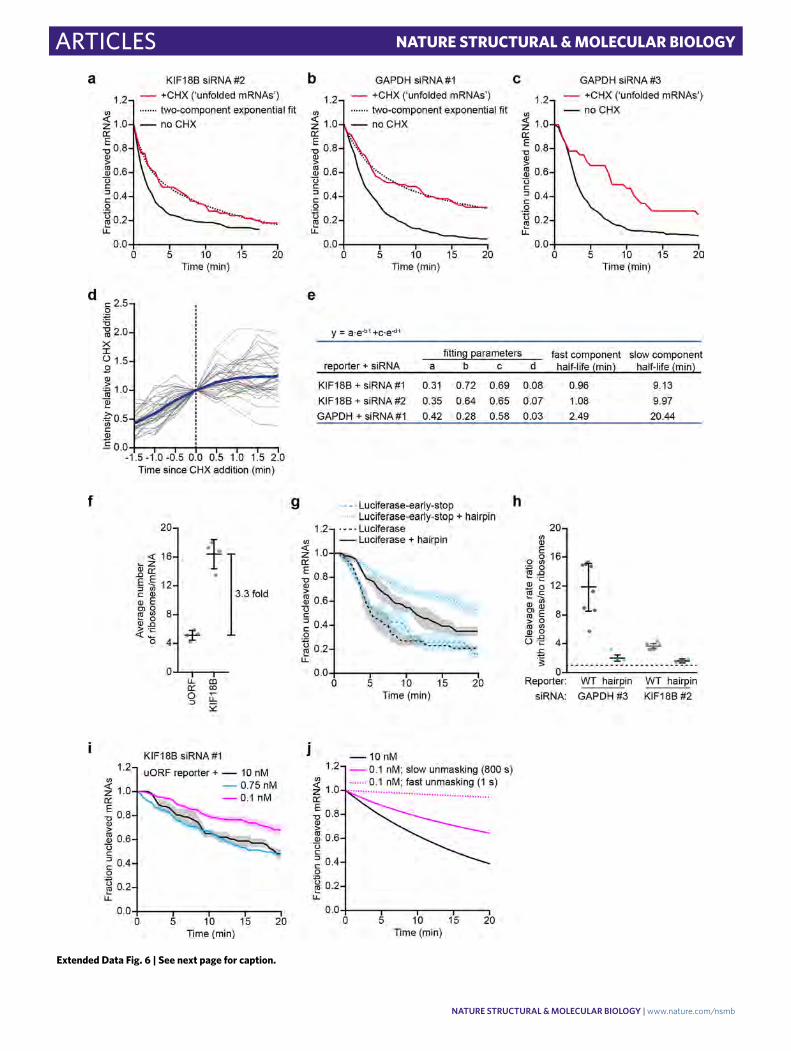
Articles NATuRE STRucTuRAl & MOlEculAR BiOlOGy
Extended Data Fig. 6 | See next page for caption.
NATuRE STRuCTuRAL & MOLECuLAR BIOLOgY | www.nature.com/nsmb
ArticlesNATuRE STRucTuRAl & MOlEculAR BiOlOGy
Extended Data Fig. 6 | Structural dynamics of RNA folding. a-c, SunTag-PP7 cells expressing the indicated reporters were transfected with 10 nM of the indicated siRNA and treated with CHX, where indicated. The CHX cleavage curves (red lines) only include mRNAs for which translation started between (a) 2.5-5.0 min, (b) 2.0-4.5 min, or (c) 2.0-5.0 min before CHX addition (see Supplementary Note 4). Dotted lines represent optimal fit with a two-component exponential decay distribution. The no CHX cleavage curve is re-normalized and plotted from (a) 2.5 min or (b-c) 2.0 min after the start of translation. d, Relative GFP fluorescence intensities were measured before and after the addition of CHX in SunTag-PP7 cells expressing the KIF18B reporter. Intensity-time traces were aligned at the moment of CHX addition. GFP fluorescence intensities were normalized to the GFP fluorescence intensities at the moment of CHX addition. The thick blue line represents the average intensity of all traces, thin grey lines represent intensity traces of multiple single mRNAs. e, Fitting parameters and corresponding half-lives of the two-component exponential fits from Fig. 6a and Extended Data Fig. 6a, b. f, Average number of ribosomes per mRNA molecule for the KIF18B-uORF and KIF18B reporters. Each dot represents an independent experiment and lines with error bars indicate the mean ± SEM. g, i, SunTag-PP7 cells expressing the indicated reporter were transfected with the indicated siRNA and (i) treated with CHX. g, The time from first detection of translation until separation of GFP and mCherry foci (that is mRNA cleavage) is shown or i, the time from CHX addition until mRNA cleavage is shown. Solid lines and corresponding shaded regions represent mean ± SEM. Dotted lines indicate that the data is replotted from an earlier figure panel for comparison. h, Ratio of the cleavage rates in the presence and absence of translating ribosomes is shown for the indicated siRNAs and reporters (see Supplementary Note 4). Each dot represents a single experiment and lines with error bars indicate the mean ± SEM. Light black data points are replotted from an earlier experiment. j, Simulated cleavage curves for 10 and 0.1 nM siRNA concentration using fast or slow unmasking rates (average unmasking time of 1 s and 800 s, respectively). Number of measurements for each experiment is listed in Supplementary Table 1. Data for graphs in a-d,f-j are available as source data.
NATuRE STRuCTuRAL & MOLECuLAR BIOLOgY | www.nature.com/nsmb