Nature Structural & Molecular Biology: doi:10.1038/nsmb Structural & Molecular Biology:...
19
Supplementary Figure 1 Additional structural data. A: The spin label on D67R1 is clearly visible. B: Mean spin-to-spin x-ray (measured at O of the NO group) and PELDOR distances, these are taken from the original paper 1 . The vectors are from subunit A to B (D 1-2 ), A to C, (D 1-3 ) and A to D (D 1-4 ). The D 1-3 spin-to-spin distance (46.7 ± 0.2) Å differs only by 1Å from the PELDOR value (Fig S1B), whilst the D 1-4 distance (58.3 ± 0.1) Å differs by 1.5 Å 1 . The increased deviation in the higher order vectors may be measurement error or be a manifestation of multispin effects 2 . C: Electron density 2Fo-Fc at 1σ for the acyl chains. D: The internal pore diameter was measured using Porewalker software 3 in 3 Å steps starting from the resolved Y27 of the 2OAU structure (closed) and L23 of the open structure in this study with D67R1 mutated in silico to native. With this approach the structures have essentially the same length of 105 Å (Z-axis) using residues 23-278 (open) and 27-278 (closed). This is because the change in the tilt of the helices, means one residue in one structure is not in the same lateral plane as the same residue in the other structure. The Z-axis can be split into 35 steps along and diameter of the pore measured at each point, the pore volume can be integrated along the Z- axis. The cumulative pore volume difference of the structures for 45 Å starting at the periplasmic top of the structure along pore Z-axis (includes the whole of the TM domain) is 10,389 Å 3 . To assess the change in pocket volumes the structures (with D67R1 again mutated in silico to native) were analyzed with the CASTp server 4 with probes of radii 1.5, 2.0, 2.5 and 3.0 Å. At all probe radii, the pockets in the closed structure are identified as a single volume, thus the volume of each pocket is estimated at 1/7 of this volume. The pocket volumes are 4500 Å 3 (3 Å probe), 5161 Å 3 (2.5 Å probe), 5629 Å 3 (2 Å probe) and 6262 Å 3 (1.5 Å probe); the corresponding central cavity volumes are 60,895, 62, 727, 64,965 and 68,344 Å 3 respectively (for the two larger probes the central cavity is split by the hydrophobic seal at L105). In the open structure analyzed with a probe of 3.0 Å the central cavity is separated from the pockets with a volume of 65,276 Å 3 but the pockets are split into sub pockets so were not analyzed at this radius. With a probe of 2.5 Å radius, three pockets and the central cavity are considered a single volume of 78,386 Å 3 , the remaining four pockets are identified individually, the largest and most complete was 3,892 Å 3 . Assuming this is correct pocket would give a central cavity volume of 78,386 – 3 x 3,892 = 66,710 Å 3 in close agreement with the 3.0 Å probe. Thus with a 2.5 Å probe we estimate the pocket volume is reduced by 1,269 Å 3 . With a radius of 2.5 Å probe, all seven pockets and the central cavity are considered as one volume of 98,140 Å 3 . To estimate the Nature Structural & Molecular Biology: doi:10.1038/nsmb.3120
Transcript of Nature Structural & Molecular Biology: doi:10.1038/nsmb Structural & Molecular Biology:...

Supplementary Figure 1
Additional structural data.
A: The spin label on D67R1 is clearly visible.
B: Mean spin-to-spin x-ray (measured at O of the NO group) and PELDOR distances, these are taken from the original paper1. The vectors are from subunit A to B (D1-2), A to C, (D1-3) and A to D (D1-4). The D1-3 spin-to-spin distance (46.7 ± 0.2) Å differs only by 1Å from the PELDOR value (Fig S1B), whilst the D1-4 distance (58.3 ± 0.1) Å differs by 1.5 Å1. The increased deviation in the higher order vectors may be measurement error or be a manifestation of multispin effects2.
C: Electron density 2Fo-Fc at 1σ for the acyl chains.
D: The internal pore diameter was measured using Porewalker software3 in 3 Å steps starting from the resolved Y27 of the 2OAU structure (closed) and L23 of the open structure in this study with D67R1 mutated in silico to native. With this approach the structures have essentially the same length of 105 Å (Z-axis) using residues 23-278 (open) and 27-278 (closed). This is because the change in the tilt of the helices, means one residue in one structure is not in the same lateral plane as the same residue in the other structure. The Z-axis can be split into 35 steps along and diameter of the pore measured at each point, the pore volume can be integrated along the Z-axis. The cumulative pore volume difference of the structures for 45 Å starting at the periplasmic top of the structure along pore Z-axis (includes the whole of the TM domain) is 10,389 Å3. To assess the change in pocket volumes the structures (with D67R1 again mutatedin silico to native) were analyzed with the CASTp server4 with probes of radii 1.5, 2.0, 2.5 and 3.0 Å. At all probe radii, the pockets inthe closed structure are identified as a single volume, thus the volume of each pocket is estimated at 1/7 of this volume. The pocketvolumes are 4500 Å3 (3 Å probe), 5161 Å3 (2.5 Å probe), 5629 Å3 (2 Å probe) and 6262 Å3 (1.5 Å probe); the corresponding central cavity volumes are 60,895, 62, 727, 64,965 and 68,344 Å3 respectively (for the two larger probes the central cavity is split by thehydrophobic seal at L105). In the open structure analyzed with a probe of 3.0 Å the central cavity is separated from the pockets with avolume of 65,276 Å3 but the pockets are split into sub pockets so were not analyzed at this radius. With a probe of 2.5 Å radius, threepockets and the central cavity are considered a single volume of 78,386 Å3, the remaining four pockets are identified individually, the largest and most complete was 3,892 Å3. Assuming this is correct pocket would give a central cavity volume of 78,386 – 3 x 3,892 = 66,710 Å3 in close agreement with the 3.0 Å probe. Thus with a 2.5 Å probe we estimate the pocket volume is reduced by 1,269 Å3. With a radius of 2.5 Å probe, all seven pockets and the central cavity are considered as one volume of 98,140 Å3. To estimate the
Nature Structural & Molecular Biology: doi:10.1038/nsmb.3120
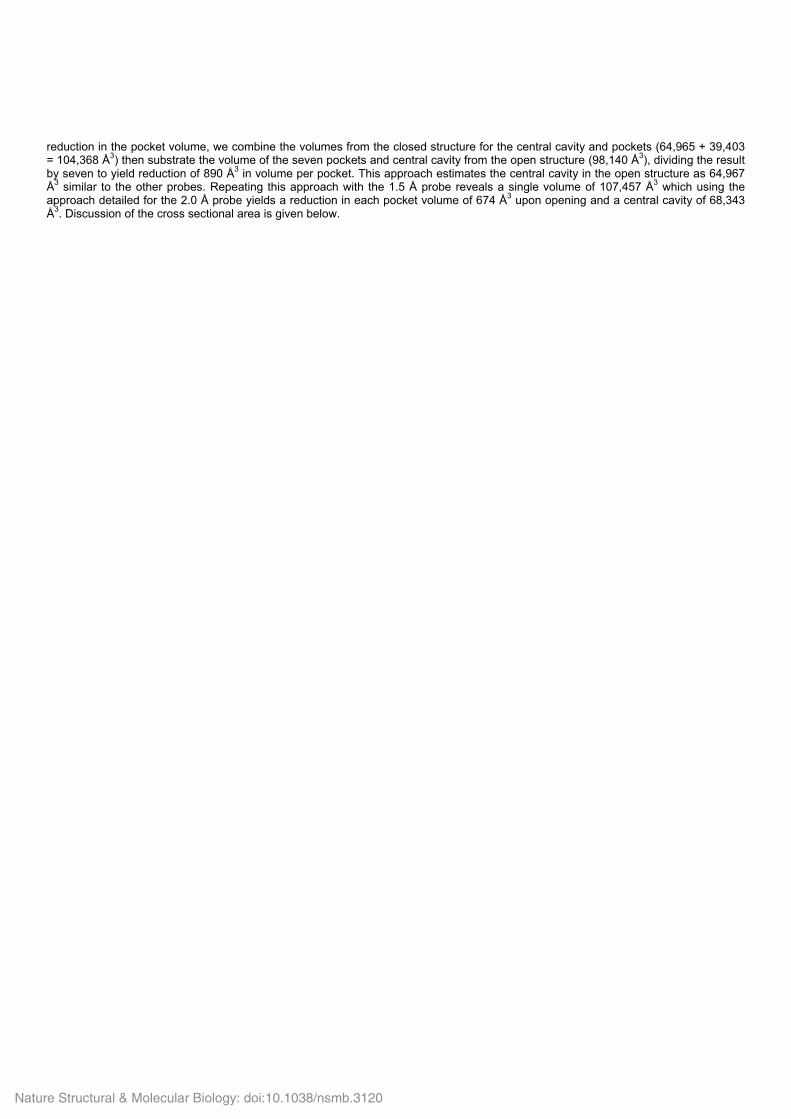
reduction in the pocket volume, we combine the volumes from the closed structure for the central cavity and pockets (64,965 + 39,403 = 104,368 Å3) then substrate the volume of the seven pockets and central cavity from the open structure (98,140 Å3), dividing the result by seven to yield reduction of 890 Å3 in volume per pocket. This approach estimates the central cavity in the open structure as 64,967 Å3 similar to the other probes. Repeating this approach with the 1.5 Å probe reveals a single volume of 107,457 Å3 which using the approach detailed for the 2.0 Å probe yields a reduction in each pocket volume of 674 Å3 upon opening and a central cavity of 68,343 Å3. Discussion of the cross sectional area is given below.
Nature Structural & Molecular Biology: doi:10.1038/nsmb.3120

Supplementary Figure 2
Additional lipid analysis.
A: Mass spectrum of the total lipid from MJF612 E. coli strain expressing MscS.
B: DM-solubilized MscS shows the same shift in lipid profile relative to the total lipid profile (Fig S2A) as DDM, suggesting it is not a simple property of the detergent.
C: Mass spectrum of the total lipid from MJF612 E. coli strain which are not expressing MscS. The lipid profile is not altered by presence or absence of MscS.
D: DDM-solubilized membrane protein (uniprot G1FG65) shows the same profile as the E. coli cell.
Nature Structural & Molecular Biology: doi:10.1038/nsmb.3120

Nature Structural & Molecular Biology: doi:10.1038/nsmb.3120

Supplementary Figure 3
Additional molecular dynamics analysis.
A: Representative view of lipid interaction with a single subunit of the closed MscS structure. Full heptameric structure of closed MscS is shown. A section of the TM domain and the lipids within the pocket is enlarged to show lipid interactions with the polypeptide chain of a single monomer (salmon). The TM3ab helices of the adjacent subunit are shown in yellow, with the hydrophobic gate residues in orange (in space-filling representation). Phospholipids are shown as space-filling representations, with the colours set to distinguish the acyl tails (turquoise) from the headgroups. Note the orientation of the lipids: headgroups pointing downwards with respect to the tails signify a lipid in the cytosolic bilayer leaflet. The opposite orientation signifies a lipid in the periplasmic leaflet (c.f. Fig 3 A, B)
B: Representative view of lipid interaction with a single subunit of the open MscS structure. The heptameric structure of open MscS is shown, with a section of the TM domain and the lipids within the pocket enlarged to show lipid interactions with the polypeptide chain ofa single monomer (salmon). The hydrophobic gate residues are shown in orange space-filling representations. Phospholipid representations and significance of orientation as in Fig S3A.
C: Protein proximity to lipid during AT-MD is correlated with proximity to proposed lipid in the crystal structure. Average separationbetween a single subunit from the new open structure and persistent lipid in the lower region of the pocket during 50-100 ns AT-MD (orange, error bars show one standard deviation) compared to the separation between the new crystal structure and electron density, modelled as carbon (blue).
D: Lipid contacts to the closed and open structures differ significantly. Data were collected from 50 to 100 ns during each AT-MD simulation, and averaged across 5 simulations per state. Statistically different numbers of lipids within 6 Å between closed and open states are shown per residue as heat-mapped residues on the polypeptide chain of the TM domain from a single subunit in the closed structure (p < 0.01). A dark blue residue indicates more contacts to the closed state (maximum 1.7 lipids more) whereas red indicates that the open state has more lipid contacts to the residue (maximum 1.4 lipids more). A white residue indicates no significant difference in contact number between the two states.
E: ‘Persistent’ (those that remain with 6 Å contact of residues in the pockets during the length simulation) and total (including those thatare exchanged with the bilayer during the simulation). Dark bars are those in the closed, white in the open structure.
F: (i) The headgroups of the persisting POPE lipids shown in (iii) were analysed for contact preferences to MscS residues. Headgroupsmake most contacts to charges along the TM1/TM2 helices. ‘Persistent’ lipid configurations in the lower pocket region in the closed (ii) and open (iii) state of MscS. Lipids that make contact (6 Å cutoff) to the lower pocket region throughout 50 to 100 ns AT-MD are displayed in snapshots from the end of the respective simulations. Lipid molecules in the open structure reach the hydrophobic seal (iii), whereas the lipids in the closed structure are prevented from reaching the seal (ii).
Nature Structural & Molecular Biology: doi:10.1038/nsmb.3120

Nature Structural & Molecular Biology: doi:10.1038/nsmb.3120

Supplementary Figure 4
Additional data on MscS mutants and the effect of LPC on MscS.
A: MscS tryptophan mutants transformed into MJF612 were exposed to an osmotic downshock of 0.5 M NaCl. Samples wereuninduced (blue) or induced by 0.3 mM IPTG (orange). Survival of samples are shown relative to samples diluted into control medium. All survival experiments were performed using transformants of either MJF641 (∆yggB, ∆mscL, ∆mscK ∆ybdG, ∆ybiO, ∆ynaI, ∆yjeP) orMJF612 (∆yggB, ∆mscL, ∆mscK, ∆ybdG). First, cells were grown at 37 °C in Luria−Bertani (LB) medium, and both induced (0.3 mM IPTG added when OD650nm ≈ 0.2) and uninduced cultures were studied. The culture was adapted to high osmolarity by growth to anOD650nm of 0.3 in the presence of 0.5 M NaCl, and an osmotic downshock was then applied by a 1:20 dilution into LB medium (shock) or the medium containing 0.5 M NaCl (control). After 10 min incubation at 37 °C, 5 μL serial dilutions of these cultures were spread ontoLB-agar plates in the presence (control) or absence (shock) of 0.5 M NaCl. The survival rates were then assessed by counting thenumber of colonies after incubation overnight at 37 °C. Data are reported as means ± standard deviation.
B: A western blot (anti His tag), 3 second exposure of blue native gels. The lanes correspond to:
1: A119W: reconstituted in DOPC, +BrLPC, then concentrated
2: A119W: after purification in DDM, +BrLPC
3: A119W: after purification in DDM
4: M47W: reconstituted in DOPC, +BrLPC, then concentrated
5: M47W: after purification in DDM, +BrLPC
6: M47W: after purification in DDM
The data show that brominated LPC 18:1 does not dissociate the heptamer in lipid bilayers but LPC (either 18:1 or 14:0) does dissociate MscS partially in detergent (consistent with gel filtration S4B).
C: When LPC is added to detergent (not reconstituted in bilayer) solubilized MscS (mole ratio 0.3 LPC), some dissociation of the MscS heptamer is observed, we only analysed the heptameric fraction.
D: Fragmentation of the lipid extract from the heptamer confirms the identity of the lipid in Fig 1E to be LPC 14:0 to be present by comparison to LPC 14:0 standard (shown below).
E: The same control protein as used in Supplementary Fig 2D incubated with LPC 14:0 using the same protocol as MscS does notshow (unlike MscS) retention of LPC 14:0 in ESI-MS/MS.
F: MscS mutants transformed into MJF641 were induced by 0.3 mM IPTG and exposed to an osmotic downshock of 0.3 M NaCl. Samples with (orange) or without (blue) addition of 0.5 mM MTSSL during the shock phase are shown.
Nature Structural & Molecular Biology: doi:10.1038/nsmb.3120

Nature Structural & Molecular Biology: doi:10.1038/nsmb.3120

Supplementary Figure 5
Additional single-molecule data on MscS.
A: Typical current recordings of MscS channels after spontaneous opening at +20 mV, +50 mV, -20 mV and -50 mV. All-points amplitude histograms (right panel). Electrolyte: 200 mM KCl, 90 mM MgCl2, 10 mM CaCl2, 10 mM HEPES, pH 7.5. 70 % spontaneously opened channel were stable with higher open probability without any closures recorded at +50 mV, -50 mV, +20 mV and -20 mV.
B: Typical current recordings at +100 mV of spontaneously opened MscS channels. Upper: gating in a single channel manifested as fast flickering. Lower: gating events in three channels. Electrolyte: 200 mM KCl, 90 mM MgCl2, 10 mM CaCl2, 10 mM HEPES, pH 7.5. 30 % of spontaneously opened channel showed fast flickering activity only at higher voltages +100 mV and we have not observed this fast flickering spontaneous channel opening at lower voltages (+50 mV and +20 mV). The observation of multiple channels is animportant control. If the conductance arises from a single molecule, then multiple insertions should give rise to conductance that is multiples thereof. It also eliminates concerns about protein heterogeneity, that is, it is MscS, not another protein, that gives rise to theconductance data in the presence of LPC. We did not explore further the voltage dependence of spontaneous opening as this wasoutside the scope of the study.
C: I-V curves obtained with single MscS channels in planar lipid bilayer measured at applied potential -100 mV to 100 mV. Electrolyte: 200 mM KCl, 90 mM MgCl2, 10 mM CaCl2, 10 mM HEPES, pH 7.5.
D: Selected ion current recordings at + 20 mV and + 50 mV of MscS channels reconstituted into a planar lipid membrane and activatedby 10 µM LPC 14:0 (cis). In both cases, the activation of a second channel with identical conductance to the first can be observed, shown as an important control. All-points amplitude histograms (right panel). Electrolyte: 200 mM KCl, 90 mM MgCl2, 10 mM CaCl2, 10 mM HEPES, pH 7.5. The single channel is mostly open 100% of the time with a second channel that appears to exhibit a much smaller open probability was a very rare event but importantly it demonstrated a similar conductance (thus providing a control). We do not haveenough observations to determine the open probability of the ‘second’ channel and this was outwith the scope of our study.
Nature Structural & Molecular Biology: doi:10.1038/nsmb.3120

Supplementary Figure 6
Bromolipids.
1H NMR spectrum of 1,2-di-(9,10-dibromo)stearoyl-sn-glycero-3-phosphocholine. The sample was solved in CDCl3 and the spectrum recorded at room temperature on a 400 MHz Bruker Avance III spectrometer: CDCl3): δH 0.91 (6H, m, ω-CH3), 1.30 (40H, m, CH2), 1.61 (7H, m, β-CH2 and H2O), 1.87 (5H, m, trans CH2CHBr), 2.06 (3H, m, gauche CH2CHBr), 2.32 (4H, m, α-CH2), 3.47 (9H, s, N(CH3)3), 3.54 (4H, m, CHBr), 4.06 (2H, m, PO3CH2 (glycerol)), 4.16 (1H, m, CH2O (glycerol)), 4.22 (2H, m, CH2N), 4.39 (1H, m, CH2O (glycerol)), 4.48 (2H, m, CH2O (glycerol)), 5.24 (1H, m, CHO)5,6. The sample was also examined with positive ion electrospray mass spectroscopy in the presence of formic acid with an Agilent Technologies 6120 ESI-MS. Expected highest peak for (M+H)+ = 1106.3 m/z (observed 1106.2 m/z). The peak pattern was as expected for an isotope cluster with four bromine atoms. The highest intensity peaks cluster in the experimental spectrum can be explained with the (M-Br) fragment. The peak pattern was as expected for an isotope cluster with three bromine atoms. Isotope clusters were simulated with the program IsoPro 3.1 (Mike Senko; https://sites.google.com/site/isoproms/).
�
Nature Structural & Molecular Biology: doi:10.1038/nsmb.3120
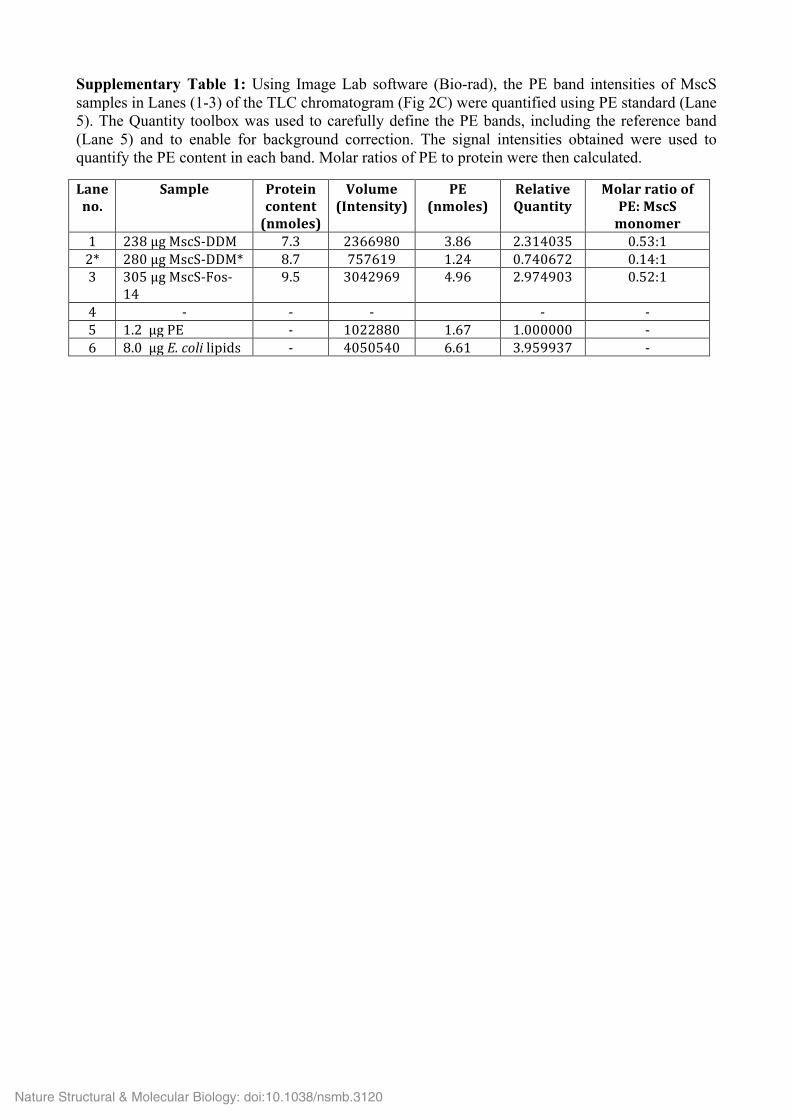
Supplementary Table 1: Using Image Lab software (Bio-rad), the PE band intensities of MscS samples in Lanes (1-3) of the TLC chromatogram (Fig 2C) were quantified using PE standard (Lane 5). The Quantity toolbox was used to carefully define the PE bands, including the reference band (Lane 5) and to enable for background correction. The signal intensities obtained were used to quantify the PE content in each band. Molar ratios of PE to protein were then calculated.
Laneno.
Sample Proteincontent(nmoles)
Volume(Intensity)
PE(nmoles)
RelativeQuantity
MolarratioofPE:MscSmonomer
1 238µgMscS-DDM 7.3 2366980 3.86 2.314035 0.53:12* 280µgMscS-DDM* 8.7 757619 1.24 0.740672 0.14:13 305µgMscS-Fos-
149.5 3042969 4.96 2.974903 0.52:1
4 - - - - -5 1.2µgPE - 1022880 1.67 1.000000 -6 8.0µgE.colilipids - 4050540 6.61 3.959937 -
Nature Structural & Molecular Biology: doi:10.1038/nsmb.3120

Supplementary Table 2: Fractional quenching of tryptophan fluorescence. MscS mutants with tryptophan residues at different positions in a tryptophan-free background were reconstituted into either 100% DOPC or 100% BrPC. Fluorescence spectra were recorded and the fractional quenching was calculated from the fluorescence intensities at 340 nm as FrQ=(F0-F)/F0 where F0 is the intensity for the DOPC sample and F for the BrPC sample. Data were obtained in the same way for reconstitution in 80% DOPE/20% DOPG or their brominated equivalents (right column). Mean values are given with standard deviations
MscS mutant Fractional quenching DOPC
Fractional quenching PE/PG
A103W 0.75 ± 0.08
V107W 0.57 ± 0.06 L111W 0.68 ± 0.21 0.80 ± 0.06
A119W 0.88 ± 0.04 0.90 ± 0.02
L123W 0.49 ± 0.07 0.56 ± 0.05
Controls M47W 0.64 ± 0.09
L105W 0.32 ± 0.04
Q203W -0.01 ± 0.12 W240 0.01 ± 0.01
Nature Structural & Molecular Biology: doi:10.1038/nsmb.3120

Supplementary Table 3: Calculated lipid volumes for existing PDB x-ray structures, containing resolved lipids ,using Molspace, a VMD software plug-in
Lipid headgroup
(PDB code) Total number of carbons Volume (A3)
LHG(1JB0)_5001 32 1599
PE (1P84)_710 32 1480
PE(1P84)_711 25 1241
PE(3M9I)_301 13 849
PE(3M9I)_302 22 1205
PE(3M9I)_303 27 1318
PE(3M9I)_304 25 1208
PE(3M9I)_305 23 1180
PE(3M9I)_306 33 1496
PE(3M9I)_307 25 1230
Nature Structural & Molecular Biology: doi:10.1038/nsmb.3120

Additional discussion of structure
As before7 the open structure shows no interaction between D62 and R128 or R131, although a salt bridge between these residues has been suggested in the open state8. In the open structure, these residues are even further apart than in the closed structure, and a salt bridge does not seem realistic in the open state. Although the original study had not favored an interaction in the closed state structure6, adjusting the side chain conformation of D62 and R128 would create a salt bridge between them in the published closed state structure9. It is important to point out that side chain conformations are often highly uncertain at the resolution reported for the closed structure9.
Nature Structural & Molecular Biology: doi:10.1038/nsmb.3120

Discussion of cross sectional area
This is a very complex issue and requires careful analysis. The literature has the figure 8.4 nm2 as the increase in cross sectional area and gating energy of 11.4 kT; this is derived from fitting a two state Boltzmann model to the observed plot of tension against open probability10. The equation used was
Po= (1 +exp[(1/kT)(ΔE- γ ΔA)]-1
• Po is the probability of the open state • ΔE is the intrinsic free energy difference between two structures at zero tension in a bilayer • γ is membrane tension (measured at 5.51 dyne/cm (5.51 x 10⁻³ N) at MscS gating threshold; Po=0.5 )13 • ΔA is the change in area between the two structures
The approach assumes the change in surface area results from an expansion of a smooth walled regular cylinder in a uniform material, which itself has no re-organisation term.
This approach predates structural data, we now know MscS is not a regular cylinder (it is conical in the closed state and becomes less conical in the open state.) Critically the protein does not have smooth walls. Our calculations of course do not include residues 1-27 which are not located in the crystal structures.
Even the expansion of the central pore, the closest to a smooth wall, of MscS is complex. TM3a (pore helix) does not expand as a smooth wall; gaps appear between TM3a upon expansion5; meaning we are overestimating the area change. No simple tools exist for measuring change in cross sectional area of a protein. Thus, we aligned the central pore of the open and closed structures along the X-axis. 6Å slices of each were taken along the pore axis. The file SOI_radii.pdf has the slices. For each slice, the radius of the cα atoms was calculated over 30 Å (vertical height of TM3a) the average increase in area is 2.0 nm2. Adding 6 Å to each radial section (to account for side chains and vdw radii), increases the area change to just less than 3.0 nm2. Using a value of 3.0 nm2 for the area change and relying on the fact the function must take a value of Po = 0.5 at 5.56 dye/cm (defined from experimental data10) results in a free energy change of 4.1 kT. If these values are then plotted using the same two state Boltzmann model based on simple cross sectional expansion in a fluid then the resulting plot profile clearly does not fit the experimental data, Figure A. We propose that the discrepancy arises because there is a missing energy term, that arises from the re-organization of the lipids.
Nature Structural & Molecular Biology: doi:10.1038/nsmb.3120

Figure A The values derived from experimental observation when fed into a two state Boltzmann model result in a curve (red) that does not fit the experimental data (black taken from10). The red curve is defined to pass through coordinates Po = 0.5 and tension = 5.51 Dye/cm.
Instead of looking at the pore helix, which is surrounded by TM1/TM2, one can consider the overall circumference of the protein. This is the method proposed by Schulten et al. 11 and we believe was intent of the original Sukharev paper10. MscS has large gaps between the outer helices (TM1 and TM2), thus the circumference does not expand smoothly, rather the outer helices project into the bilayer. The energetics of this are complex, but in the simplest terms expanding ‘fins’ (helices) into a bilayer requires less energy than expanding a smooth cylinder to the same radial extent. Thus assuming a smooth walled expansion will overestimate the energetic significance of expansion in the bilayer.
In order to set an upper limit on the expansion area we have calculated the change in area of MscS, treating it as if indeed it was a smooth cylinder with diameter on the edge of the fins. Using this approach for the 36Å pore (approximate bilayer), the average change in area is around 130 A2 (1.3 nm2); over a 42 Å axis length (beyond the extent of the lipid bilayer) further exaggerates the area change, gives an average of 296 Å2 (2.96 nm2). (Soi_radii.pdf). Irrespective of how the area change is calculated it does not fit the simple two state model.
Schulten and colleagues11 have pointed out simple average change in area is not a reliable measure of energy change for a protein that changes shape during gating. This is because the pressure profile changes across the bilayer and the change in conical nature of the protein is important. This group derived a new equation (which still assumes smooth walls and a simple fluid membrane)11.
Po= (1 +exp[(1/kT)(ΔE- γ ΔA + 2π2(So2-Sc2)M2)])-1
The paper defines the following • Po is the probability of the open state
0 2 4 6 8 10
0.0
0.2
0.4
0.6
0.8
1.0
Po
Tension (dyne/cm)
Experimental data (Sukharev, 2002,Biophys J) Pliotas et al, (this study)
P0 = 0.5 γ0.5 = 5.51 dyne/cm
Nature Structural & Molecular Biology: doi:10.1038/nsmb.3120

• ΔE is the intrinsic free energy difference between two structures at zero tension in a bilayer • γ is membrane tension (measured at 5.51 dyne/cm (5.51 x 10⁻³ N) at MscS gating
threshold)13 • M2 is the second moment of POPE membrane (tabulated in the paper, -11.2kT at 5.6
dyne/cm)11, • ΔA is the change in area between the two structures half way through the membrane (π(Ro2-
Rc2)), • So is the slope of the cone in open structure, Sc the slope in the closed • ΔE is the intrinsic free energy between the states at zero pressure. • T = 300, kT= 4.14 x 10⁻²¹ JK-1
For the 36 Å pore, the values are
So = 0.173, Sc = 0.373 gives So2-Sc2= -0.109;
Ro =32.6, Rc = 32.55 ΔA =10A2, 0.1nm2, 0.1 x 10⁻¹⁸ m2 ;
γΔA/kT = 0.136
For the 42 Å pore the values are
So = 0.122, Sc =0.3875, gives So2-Sc2 =-0.135;
Ro =32.05, Rc = 31.1, ΔA =-189Å2, 1.9 x 10⁻¹⁸ m2;
γΔA/kT = 2.57
At the gating threshold midpoint (5.51 dyne/cm) Po = 0.5
This means ΔE- γ ΔA + 2π2(So2-Sc2)M2 = 0; this is re-arranged to
ΔE = γ ΔA - 2π2(So2-Sc2)M2
ΔE for 36 Å pore = 0.136 – 19.74 (-0.109)-11.2 = -23.96 kT = -63 kJmol-1
ΔE for 42 Å pore = 2.57 – 19.74 (-0.135)-11.2 = -27.3 kT = -72 kJmol-1
These values would indicate MscS is more stable in the open form which we argue is nonsense and the result of a missing term, lipid re-organisation. We stress the thermodynamic models10,11 are based on sound principles they fail only because at the time they were advanced the structural data were unknown and the models assumed no lipid re-organisation term.
An energy difference of -60kJmol-1, results in the proportion of the closed state at zero tension would be vanishingly small and the open probability would be > 0.9999999. This is totally different from the experimentally measured open probability of MscS reconstituted into liposomes as a function of increasing tension, the open probability at zero tension is 010.
Nature Structural & Molecular Biology: doi:10.1038/nsmb.3120

Our own data in single channel experiments, detects as others have done, that the predominant form of the channel is closed at zero tension. The presence of the spontaneous openings indicates the equilibrium constant is not at extremes and thus the free energy gap may not large. A small energy gap is partially consistent with the fact that crystal structures have been reported for both closed and open forms for native protein. However, we stress that detergent solubilized protein is likely to have a different free energy from that embedded in the membrane and that crystallization, a kinetic process, does not select the lowest energy state.
Nature Structural & Molecular Biology: doi:10.1038/nsmb.3120

References
1. Pliotas, C. et al. Conformational state of the MscS mechanosensitive channel in solution revealed by pulsed electron-electron double resonance (PELDOR) spectroscopy. Proc. Natl. Acad. Sci. U S A 109, E2675-E2682 (2012).
2. Jeschke, G., Sajid, M., Schulte, M. & Godt, A. Three-spin correlations in double electron-electron resonance. Phys Chem Chem Phys 11, 6580-6591 (2009).
3. Pellegrini-Calace, M., Maiwald, T. & Thornton, J. M. PoreWalker: a novel tool for the identification and characterization of channels in transmembrane proteins from their three-dimensional structure. PLoS Comput. Biol. 5, e1000440 (2009).
4. Binkowski, T. A., Naghibzadeh, S. & Liang, J. CASTp: Computed atlas of surface topography of proteins. Nucleic Acids Res. 31, 3352-3355 (2003).
5. Stark, R. E. & Gaede, H. C. NMR of a Phospholipid: Modules for Advanced Laboratory Courses. Journal of Chemical Education 78, 1248 (2001).
6. Abraham, R. & Warne, M. Proton chemical shifts in NMR. Part 10.1 Bromine and iodine substituent chemical shifts (SCS) and an analysis of the contributions to the SCS in halocyclohexanes. Journal of the Chemical Society, Perkin Transactions 2 2151-2160 (1997).
7. Wang, W. et al. The structure of an open form of an E. coli mechanosensitive channel at 3.45 A resolution. Science 321, 1179-1183 (2008).
8. Nomura, T., Sokabe, M. & Yoshimura, K. Interaction between the cytoplasmic and transmembrane domains of the mechanosensitive channel MscS. Biophys. J. 94, 1638-1645 (2008).
9. Bass, R. B., Strop, P., Barclay, M. & Rees, D. C. Crystal structure of Escherichia coli MscS, a voltage-modulated and mechanosensitive channel. Science 298, 1582-1587 (2002).
10. Sukharev, S. Purification of the small mechanosensitive channel of Escherichia coli (MscS): the subunit structure, conduction, and gating characteristics in liposomes. Biophys. J. 83, 290-298 (2002).
11. Gullingsrud, J. & Schulten, K. Lipid bilayer pressure profiles and mechanosensitive channel gating. Biophys. J. 86, 3496-3509 (2004).
Nature Structural & Molecular Biology: doi:10.1038/nsmb.3120