Nature of the Sample: NPR/PBS NewsHour/Marist Poll of 935...
24
How the Survey was Conducted Nature of the Sample: NPR/PBS NewsHour/Marist Poll of 935 National Adults This survey of 935 adults was conducted October 21 st through October 23 rd , 2018 by The Marist Poll sponsored in partnership with NPR and PBS NewsHour. Adults 18 years of age and older residing in the contiguous United States were contacted on landline or mobile numbers and interviewed in English by telephone using live interviewers. Mobile telephone numbers were randomly selected based upon a list of telephone exchanges from throughout the nation from Survey Sampling International. The exchanges were selected to ensure that each region was represented in proportion to its population. Mobile phones are treated as individual devices. After validation of age, personal ownership, and non-business-use of the mobile phone, interviews are typically conducted with the person answering the phone. To increase coverage, this mobile sample was supplemented by respondents reached through random dialing of landline phone numbers from Survey Sampling International. Within each landline household, a single respondent is selected through a random selection process to increase the representativeness of traditionally under-covered survey populations. Assistance was provided by Luce Research and The Logit Group, Inc for data collection. The samples were then combined and balanced to reflect the 2016 American Community Survey 1-year estimates for age, gender, income, race, and region. Results are statistically significant within ±3.9 percentage points. There are 738 registered voters. The results for this subset are statistically significant within ±4.4 percentage points. The error margin was adjusted for sample weights and increases for cross-tabulations.
Transcript of Nature of the Sample: NPR/PBS NewsHour/Marist Poll of 935...

How the Survey was Conducted
Nature of the Sample: NPR/PBS NewsHour/Marist Poll of 935 National Adults This survey of 935 adults was conducted October 21st through October 23rd, 2018 by The Marist Poll sponsored in partnership with NPR and PBS NewsHour. Adults 18 years of age and older residing in the contiguous United States were contacted on landline or mobile numbers and interviewed in English by telephone using live interviewers. Mobile telephone numbers were randomly selected based upon a list of telephone exchanges from throughout the nation from Survey Sampling International. The exchanges were selected to ensure that each region was represented in proportion to its population. Mobile phones are treated as individual devices. After validation of age, personal ownership, and non-business-use of the mobile phone, interviews are typically conducted with the person answering the phone. To increase coverage, this mobile sample was supplemented by respondents reached through random dialing of landline phone numbers from Survey Sampling International. Within each landline household, a single respondent is selected through a random selection process to increase the representativeness of traditionally under-covered survey populations. Assistance was provided by Luce Research and The Logit Group, Inc for data collection. The samples were then combined and balanced to reflect the 2016 American Community Survey 1-year estimates for age, gender, income, race, and region. Results are statistically significant within ±3.9 percentage points. There are 738 registered voters. The results for this subset are statistically significant within ±4.4 percentage points. The error margin was adjusted for sample weights and increases for cross-tabulations.

National Adults National Registered VotersColumn % Column %
100%79% 100%
Party Identification Democrat n/a 33%Republican n/a 26%
Independent n/a 38%Other n/a 3%
Party Identification Strong Democrats n/a 22%Not strong Democrats n/a 11%
Democratic leaning independents n/a 14%Just Independents n/a 10%
Republican leaning independents n/a 14%Not strong Republicans n/a 7%
Strong Republicans n/a 19%Other n/a 3%
Unsure n/a 0%Party ID and Gender Democrat men n/a 14%
Democrat women n/a 19%Republican men n/a 13%
Republican women n/a 13%Independent men n/a 21%
Independent women n/a 18%Other party men and women n/a 3%
Gender Men 49% 50%Women 51% 50%
Age Under 45 46% 40%45 or older 54% 60%
Age 18 to 29 21% 17%30 to 44 25% 24%45 to 59 26% 27%
60 or older 28% 32%Race White 61% 65%
African American 11% 10%Latino 15% 15%Other 13% 10%
Region Northeast 18% 20%Midwest 21% 22%
South 38% 34%West 23% 24%
Household Income Less than $50,000 44% 40%$50,000 or more 56% 60%
Education Not college graduate 61% 56%College graduate 39% 44%
Education by Race White - Not College Graduate 34% 33%White - College Graduate 27% 32%
Non-White - Not College Graduate 26% 22%Non-White - College Graduate 12% 13%
Education - Race - Gender Men - White - Not College Graduate 15% 16%Men - White - College Graduate 14% 16%
Men - Non-White - Not College Graduate 13% 12%Men - Non-White - College Graduate 7% 7%
Women - White - Not College Graduate 19% 18%Women - White - College Graduate 14% 16%
Women - Non-White - Not College Graduate 13% 11%Women - Non-White - College Graduate 6% 6%
21% 22%Area Description Big city 26% 23%
Small city 22% 22%Suburban 19% 22%
Small town 19% 17%Rural 14% 15%
21% 22%28% 28%20% 22%31% 28%
Interview Type Landline 33% 38%Cell phone 67% 62%
National AdultsNational Registered Voters
Nature of the Sample
White Evangelical Christians
Small city/Suburban MenOther area MenSmall city/Suburban WomenOther area Women
NPR/PBS NewsHour/Marist Poll Adults. Interviews conducted October 21st through October 23rd, 2018, n=935 MOE +/- 3.9 percentage points. National Registered Voters: n=738 MOE +/- 4.4 percentage points. Totals may not add to 100% due to rounding.

Approve Disapprove UnsureRow % Row % Row %
39% 53% 8%
41% 53% 7%
41% 54% 4%Major factor 33% 65% 3%Minor factor 44% 50% 6%Not a factor at all 51% 36% 13%Democrat 9% 87% 4%Republican 85% 11% 4%Independent 35% 55% 10%Strong Democrats 6% 91% 3%Soft Democrats 9% 86% 5%Just Independents 25% 52% 23%Soft Republicans 71% 21% 8%Strong Republicans 91% 6% 3%Democrat men 16% 79% 6%Democrat women 4% 93% 3%Republican men 87% 9% 4%Republican women 83% 12% 4%Independent men 39% 47% 14%Independent women 30% 64% 6%
92% 5% 3%Northeast 35% 59% 7%Midwest 46% 50% 5%South 46% 44% 10%West 26% 65% 9%Less than $50,000 35% 55% 10%$50,000 or more 42% 52% 6%Not college graduate 45% 46% 9%College graduate 31% 63% 6%White 48% 46% 6%African American 11% 75% 14%Latino 27% 66% 8%White - Not College Graduate 58% 36% 6%White - College Graduate 35% 59% 6%Men - White - Not College Graduate 64% 30% 6%
Men - White - College Graduate 39% 55% 6%
Women - White - Not College Graduate
53% 41% 6%
Women - White - College Graduate 32% 63% 5%
18 to 29 28% 67% 5%30 to 44 37% 56% 7%45 to 59 47% 44% 9%60 or older 43% 48% 10%Under 45 33% 61% 6%45 or older 45% 46% 9%Men 46% 45% 9%Women 33% 61% 7%
73% 18% 8%Married men 48% 41% 11%Single men 46% 47% 8%Married women 47% 46% 7%Single women 22% 70% 7%Big city 33% 62% 5%Small city 32% 58% 10%Suburban 35% 61% 4%Small town 45% 43% 12%Rural 61% 30% 10%
39% 52% 9%
27% 67% 6%Small city/Suburban Women
NPR/PBS NewsHour/Marist Poll National Adults. Interviews conducted October 21st 2018, through October 23rd 2018, n=935 MOE +/- 3.9 percentage points.^National Registered Voters: n=738 MOE +/- 4.4 percentage points. Totals may not add to 100% due to rounding.*Soft Democrats include registered voters who identify as "not strong Democrats" or Democratic leaning independents. Soft Republicans include those registered voters who identify as "not strong Republicans" or Republican leaning independents.
Area Description
Small city/Suburban Men
Race
Race and Education
Gender - Race - Education
Age
Age
Education
National Registered Voters
2018 Congressional Elections Very Important
Impression of Trump as a Factor for 2018 Vote
Party Identification^
Party Identification*
Gender
White Evangelical Christians
Marital Status and Gender
TRUDP105. NPR/PBS NewsHour/Marist Poll National Tables October 21st 2018, through October 23rd 2018,
National AdultsDo you approve or disapprove of the job Donald Trump is doing as
president?
National Adults
Party ID and Gender
Trump Supporters
Region
Household Income
1

Approve Disapprove UnsureRow % Row % Row %
39% 53% 8%41% 53% 5%42% 49% 9%39% 52% 9%39% 51% 10%38% 54% 8%40% 51% 9%42% 50% 8%38% 54% 9%38% 54% 7%37% 53% 10%37% 56% 7%39% 55% 6%39% 53% 7%37% 55% 8%37% 54% 9%39% 50% 12%35% 51% 14%35% 55% 9%37% 51% 12%39% 48% 13%37% 51% 12%39% 50% 11%
December 2017January 2018February 9, 2018
TRUDP105TRND. Marist Poll National TrendNational Adults
Do you approve or disapprove of the job Donald Trump is doing as president?
February 23, 2018March 8, 2018March 23, 2018April 2018July 2018September 13th, 2018September 26th, 2018October 3rd, 2018October 26th, 2018
Marist Poll National Adults
November 21, 2017
September 15, 2017August 17, 2017August 16, 2017June 2017April 2017March 2017
November 14, 2017
September 29, 2017
February 2017
October 2017
2

Strongly approve Approve Disapprove Strongly disapprove UnsureRow % Row % Row % Row % Row %
24% 15% 14% 39% 8%
26% 14% 11% 42% 7%
28% 13% 8% 46% 4%Major factor 27% 6% 7% 58% 3%Minor factor 28% 16% 14% 36% 6%Not a factor at all 25% 26% 13% 22% 13%Democrat 1% 7% 13% 75% 4%Republican 64% 21% 5% 6% 4%Independent 20% 14% 15% 40% 10%Strong Democrats 1% 5% 8% 84% 3%Soft Democrats 2% 6% 21% 64% 5%Just Independents 12% 13% 14% 38% 23%Soft Republicans 41% 29% 10% 11% 8%Strong Republicans 74% 17% 2% 3% 3%Democrat men 2% 14% 6% 73% 6%Democrat women 1% 3% 17% 76% 3%Republican men 62% 25% 2% 7% 4%Republican women 66% 18% 8% 4% 4%Independent men 19% 19% 12% 35% 14%Independent women 22% 8% 17% 47% 6%
66% 26% 4% 1% 3%Northeast 17% 18% 15% 43% 7%Midwest 27% 18% 15% 34% 5%South 31% 15% 14% 31% 10%West 16% 11% 14% 51% 9%Less than $50,000 19% 16% 21% 34% 10%$50,000 or more 27% 14% 9% 43% 6%Not college graduate 27% 18% 19% 27% 9%College graduate 19% 12% 6% 57% 6%White 31% 17% 10% 36% 6%African American 6% 5% 25% 50% 14%Latino 11% 15% 23% 43% 8%White - Not College Graduate 38% 20% 12% 24% 6%White - College Graduate 22% 13% 7% 52% 6%Men - White - Not College Graduate 41% 23% 12% 18% 6%
Men - White - College Graduate 18% 21% 8% 47% 6%
Women - White - Not College Graduate
35% 18% 12% 29% 6%
Women - White - College Graduate 26% 6% 6% 56% 5%
18 to 29 10% 18% 32% 35% 5%30 to 44 21% 17% 9% 47% 7%45 to 59 34% 13% 11% 34% 9%60 or older 29% 14% 9% 38% 10%Under 45 16% 17% 19% 41% 6%45 or older 31% 13% 10% 36% 9%Men 25% 21% 10% 35% 9%Women 23% 10% 19% 42% 7%
55% 19% 8% 11% 8%Married men 31% 17% 6% 35% 11%Single men 21% 25% 13% 33% 8%Married women 36% 11% 6% 40% 7%Single women 14% 8% 25% 45% 7%Big city 17% 15% 15% 47% 5%Small city 22% 9% 16% 42% 10%Suburban 20% 15% 8% 53% 4%Small town 27% 18% 20% 23% 12%Rural 42% 18% 8% 21% 10%
23% 17% 12% 39% 9%
20% 8% 12% 55% 6%
Small city/Suburban Men
Small city/Suburban Women
NPR/PBS NewsHour/Marist Poll National Adults. Interviews conducted October 21st 2018, through October 23rd 2018, n=935 MOE +/- 3.9 percentage points.^National Registered Voters: n=738 MOE +/- 4.4 percentage points. Totals may not add to 100% due to rounding.*Soft Democrats include registered voters who identify as "not strong Democrats" or Democratic leaning independents. Soft Republicans include those registered voters who identify as "not strong Republicans" or Republican leaning independents.
Age
Gender
White Evangelical Christians
Marital Status and Gender
Area Description
Education
Race
Race and Education
Gender - Race - Education
Age
Party Identification*
Party ID and Gender
Trump Supporters
Region
Household Income
2018 Congressional Elections Very Important
Impression of Trump as a Factor for 2018 Vote
Party Identification^
TRUDP105R. NPR/PBS NewsHour/Marist Poll National Tables October 21st 2018, through October 23rd 2018,
National AdultsDo you approve or disapprove of the job Donald Trump is doing as president? [And, would you say you strongly
approve/disapprove of the job he is doing or just approve/disapprove?]
National Adults
National Registered Voters
3

Strongly Approve Approve Disapprove
Strongly Disapprove Unsure
Row % Row % Row % Row % Row %
24% 15% 14% 39% 8%27% 14% 12% 41% 5%26% 16% 12% 37% 9%24% 14% 11% 42% 9%25% 14% 10% 41% 10%22% 16% 15% 40% 8%22% 17% 13% 38% 9%24% 18% 13% 37% 8%21% 16% 14% 40% 9%24% 14% 11% 44% 7%23% 14% 14% 39% 10%20% 17% 11% 45% 7%20% 19% 17% 38% 6%21% 18% 13% 40% 7%19% 18% 12% 43% 8%18% 19% 13% 41% 9%22% 17% 12% 37% 12%20% 15% 12% 39% 14%20% 16% 13% 42% 9%20% 17% 11% 40% 12%
TRUDP105RTRND. Marist Poll National TrendNational Adults
Do you approve or disapprove of the job Donald Trump is doing as president? [And, would you say you strongly approve/disapprove of the job he is doing or
just approve/disapprove?]
February 23, 2018March 8, 2018March 23, 2018April 2018July 2018September 13th, 2018September 26th, 2018October 3rd, 2018October 26th, 2018
February 9, 2018January 2018December 2017November 21, 2017November 14, 2017
June 2017Marist Poll National Adults
October 2017September 29, 2017September 15, 2017August 17, 2017August 16, 2017
4

Very important Important Not very important Not important at all UnsureRow % Row % Row % Row % Row %
76% 18% 2% 3% <1%Democrat 83% 15% 0% 2% 0%Republican 80% 18% 2% 0% 0%Independent 67% 23% 4% 6% 1%Major factor 88% 9% 0% 3% 0%Minor factor 76% 21% 2% 1% 0%Not a factor at all 63% 27% 5% 4% 1%Strong Democrats 89% 11% 0% 0% 0%Soft Democrats 75% 20% 1% 4% 0%Just Independents 52% 25% 9% 10% 4%Soft Republicans 67% 27% 2% 3% 0%Strong Republicans 84% 14% 2% 0% 0%Democrat men 83% 13% 1% 3% 0%Democrat women 83% 16% 0% 1% 0%Republican men 79% 18% 3% 0% 0%Republican women 80% 18% 1% 0% 0%Independent men 66% 23% 6% 3% 2%Independent women 69% 22% 1% 8% 0%
78% 18% 1% 1% 1%Northeast 80% 14% 2% 3% 0%Midwest 74% 22% 1% 2% 0%South 78% 18% 1% 2% 1%West 73% 19% 4% 5% 0%Less than $50,000 73% 22% 0% 4% 1%$50,000 or more 80% 16% 3% 2% 0%Not college graduate 73% 21% 2% 4% 1%College graduate 82% 14% 2% 2% 0%White 78% 18% 3% 1% 0%African American 83% 7% 1% 5% 4%Latino 67% 27% 2% 3% 0%White - Not College Graduate 77% 18% 2% 2% 0%White - College Graduate 81% 16% 3% 0% 0%Men - White - Not College Graduate 78% 18% 3% 1% 0%
Men - White - College Graduate 77% 16% 6% 1% 0%
Women - White - Not College Graduate
77% 18% 1% 4% 0%
Women - White - College Graduate 85% 15% 0% 0% 0%
18 to 29 72% 23% 2% 3% 0%30 to 44 76% 10% 5% 7% 2%45 to 59 71% 27% 1% 1% 0%60 or older 84% 14% 1% 1% 0%Under 45 75% 16% 3% 5% 1%45 or older 78% 20% 1% 1% 0%Men 75% 18% 3% 2% 1%Women 78% 18% 1% 3% 0%
80% 17% 1% 2% 0%Married men 76% 18% 5% 1% 0%Single men 75% 18% 2% 3% 1%Married women 83% 17% 0% 1% 0%Single women 75% 19% 1% 6% 0%Big city 84% 13% 2% 1% 0%Small city 72% 21% 4% 3% 0%Suburban 79% 19% 0% 2% 0%Small town 72% 20% 2% 6% 0%Rural 76% 18% 0% 4% 2%
71% 22% 4% 3% 0%
79% 19% 0% 2% 0%NPR/PBS NewsHour/Marist Poll National Registered Voters. Interviews conducted October 21st 2018, through October 23rd 2018, n=738 MOE +/- 4.4 percentage points. Totals may not add to 100% due to rounding.*Soft Democrats include registered voters who identify as "not strong Democrats" or Democratic leaning independents. Soft Republicans include those registered voters who identify as "not strong Republicans" or Republican leaning independents.
White Evangelical Christians
Marital Status and Gender
Area Description
Small city/Suburban Men
Small city/Suburban Women
Race and Education
Gender - Race - Education
Age
Age
Gender
Trump Supporters
Region
Household Income
Education
Race
National Registered Voters
Party Identification
Impression of Trump as a Factor for 2018 Vote
Party Identification*
Party ID and Gender
CGIMPT18. NPR/PBS NewsHour/Marist Poll National Tables October 21st 2018, through October 23rd 2018,
National Registered VotersDo you think November's election for Congress is very important, important, not very important, or not important at
all?
5

Very important ImportantNot very important
Not important at all Unsure
Row % Row % Row % Row % Row %
76% 18% 2% 3% <1%75% 20% 4% 1% <1%69% 26% 2% 2% 1%
Marist Poll National Registered Voters
CGIMPT18. Marist Poll National TrendNational Registered Voters
Do you think November's election for Congress is very important, important, not very important, or not important at all?
October 3rd, 2018July 2018
October 26th, 2018
6

Democrat Republican Vol. Neither UndecidedRow % Row % Row % Row %
50% 40% 5% 6%
54% 39% 3% 4%Democrat 96% 2% 0% 3%Republican 4% 94% 1% 1%Independent 44% 34% 11% 10%Major factor 64% 31% 1% 4%Minor factor 43% 47% 4% 6%Not a factor at all 32% 48% 11% 8%Strong Democrats 97% 0% 0% 3%Soft Democrats 91% 4% 2% 2%Just Independents 23% 13% 29% 35%Soft Republicans 11% 81% 6% 2%Strong Republicans 2% 98% 0% 0%Democrat men 93% 4% 0% 3%Democrat women 97% 0% 0% 3%Republican men 3% 95% 2% 0%Republican women 4% 94% 0% 2%Independent men 37% 39% 17% 6%Independent women 52% 29% 5% 15%
6% 85% 3% 5%Northeast 55% 32% 7% 6%Midwest 46% 46% 2% 6%South 45% 46% 5% 5%West 56% 30% 7% 7%Less than $50,000 56% 34% 4% 6%$50,000 or more 48% 43% 5% 4%Not college graduate 45% 43% 6% 6%College graduate 56% 34% 5% 5%White 41% 49% 5% 5%African American 84% 8% 6% 1%Latino 66% 24% 3% 7%White - Not College Graduate 34% 55% 4% 6%White - College Graduate 50% 41% 5% 4%Men - White - Not College Graduate 29% 62% 6% 3%
Men - White - College Graduate 46% 45% 6% 3%
Women - White - Not College Graduate
39% 49% 3% 9%
Women - White - College Graduate 54% 36% 4% 6%
18 to 29 63% 28% 6% 3%30 to 44 49% 35% 7% 9%45 to 59 43% 47% 4% 6%60 or older 48% 44% 3% 5%Under 45 55% 32% 7% 7%45 or older 46% 45% 4% 5%Men 43% 44% 8% 5%Women 56% 35% 2% 7%
18% 74% 4% 5%Married men 37% 52% 8% 3%Single men 49% 37% 8% 6%Married women 45% 47% 3% 5%Single women 65% 24% 2% 9%Big city 60% 29% 6% 5%Small city 52% 39% 7% 2%Suburban 61% 29% 3% 7%Small town 36% 52% 6% 5%Rural 30% 58% 4% 9%
49% 41% 8% 2%
64% 27% 2% 7%Small city/Suburban Women
NPR/PBS NewsHour/Marist Poll National Registered Voters. Interviews conducted October 21st 2018, through October 23rd 2018, n=738 MOE +/- 4.4 percentage points. Totals may not add to 100% due to rounding.*Soft Democrats include registered voters who identify as "not strong Democrats" or Democratic leaning independents. Soft Republicans include those registered voters who identify as "not strong Republicans" or Republican leaning independents.
Gender
White Evangelical Christians
Marital Status and Gender
Area Description
Small city/Suburban Men
Race
Race and Education
Gender - Race - Education
Age
Age
Party ID and Gender
Trump Supporters
Region
Household Income
Education
National Registered Voters
2018 Congressional Elections Very Important
Party Identification
Impression of Trump as a Factor for 2018 Vote
Party Identification*
USCNGS01. NPR/PBS NewsHour/Marist Poll National Tables October 21st 2018, through October 23rd 2018,
National Registered VotersIf November's election for Congress were held today, which party's candidate are you more
likely to vote for in your district:
7
Democrat Republican Neither UndecidedRow % Row % Row % Row %
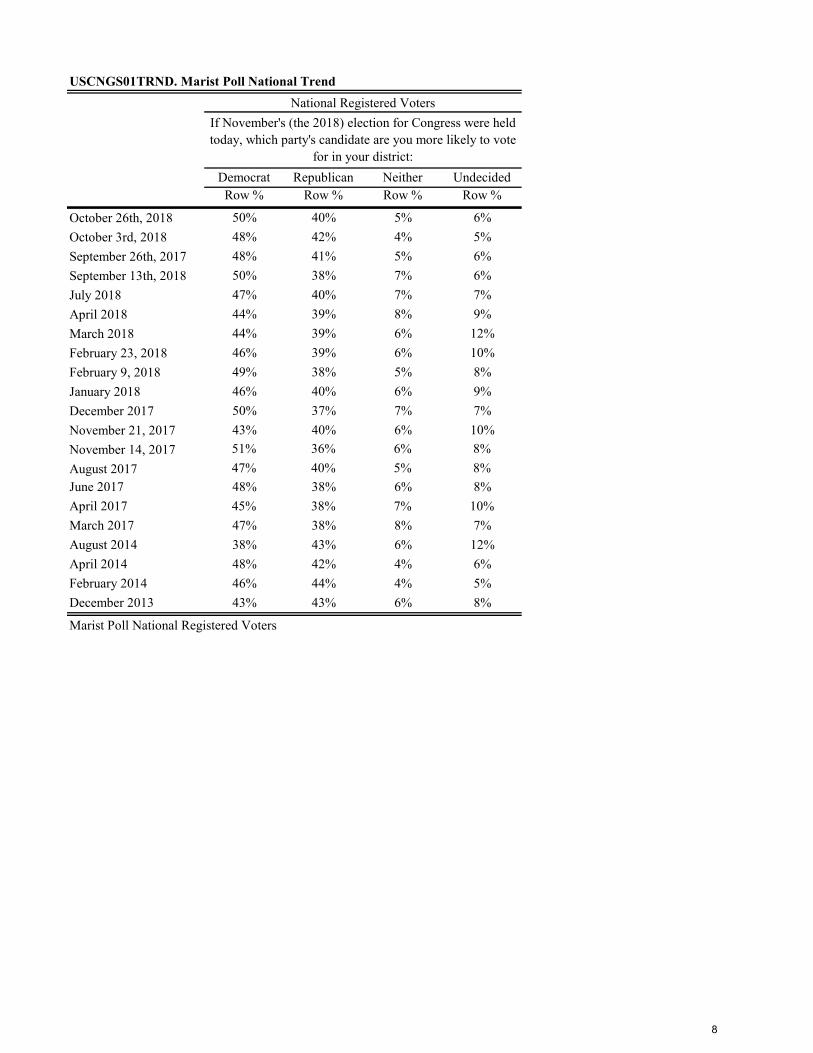
50% 40% 5% 6%48% 42% 4% 5%48% 41% 5% 6%50% 38% 7% 6%47% 40% 7% 7%44% 39% 8% 9%44% 39% 6% 12%46% 39% 6% 10%49% 38% 5% 8%46% 40% 6% 9%50% 37% 7% 7%43% 40% 6% 10%51% 36% 6% 8%47% 40% 5% 8%48% 38% 6% 8%45% 38% 7% 10%47% 38% 8% 7%38% 43% 6% 12%48% 42% 4% 6%46% 44% 4% 5%43% 43% 6% 8%
Marist Poll National Registered Voters
USCNGS01TRND. Marist Poll National Trend
March 2018
February 9, 2018February 23, 2018
National Registered VotersIf November's (the 2018) election for Congress were held today, which party's candidate are you more likely to vote
for in your district:
April 2018July 2018September 13th, 2018
December 2013
June 2017April 2017March 2017
October 26th, 2018
December 2017January 2018
September 26th, 2017
April 2014
October 3rd, 2018
February 2014
November 21, 2017
August 2017November 14, 2017
August 2014
8

Major factor Minor factor Not a factor at all UnsureRow % Row % Row % Row %
44% 23% 31% 2%
51% 23% 26% 1%Democrat 56% 21% 21% 2%Republican 41% 23% 35% 1%Independent 38% 26% 35% 2%Strong Democrats 62% 20% 16% 2%Soft Democrats 52% 23% 23% 2%Just Independents 27% 20% 49% 4%Soft Republicans 26% 35% 39% 0%Strong Republicans 46% 18% 36% 1%Democrat men 55% 23% 22% 1%Democrat women 57% 19% 20% 3%Republican men 39% 22% 39% 0%Republican women 43% 25% 30% 2%Independent men 28% 33% 40% 0%Independent women 50% 17% 29% 3%
38% 25% 37% 1%Northeast 44% 27% 28% 2%Midwest 43% 26% 30% 0%South 47% 19% 32% 2%West 40% 23% 34% 3%Less than $50,000 41% 20% 35% 4%$50,000 or more 46% 25% 28% 0%Not college graduate 42% 22% 34% 3%College graduate 47% 25% 27% 0%White 43% 24% 32% 1%African American 59% 18% 22% 1%Latino 37% 25% 32% 5%White - Not College Graduate 43% 21% 34% 1%White - College Graduate 43% 26% 31% 0%Men - White - Not College Graduate 37% 28% 35% 0%
Men - White - College Graduate 41% 30% 29% 0%
Women - White - Not College Graduate
48% 15% 34% 2%
Women - White - College Graduate 45% 22% 32% 0%
18 to 29 43% 31% 26% 0%30 to 44 35% 26% 40% 0%45 to 59 38% 28% 32% 3%60 or older 56% 13% 27% 3%Under 45 38% 28% 34% 0%45 or older 48% 20% 29% 3%Men 37% 26% 36% 0%Women 51% 20% 26% 3%
44% 17% 39% 0%Married men 40% 30% 30% 0%Single men 34% 24% 42% 0%Married women 49% 20% 29% 2%Single women 51% 20% 26% 3%Big city 46% 22% 31% 1%Small city 40% 25% 35% 1%Suburban 47% 25% 26% 2%Small town 47% 19% 31% 2%Rural 40% 24% 34% 2%
32% 30% 37% 0%
54% 20% 23% 2%NPR/PBS NewsHour/Marist Poll National Registered Voters. Interviews conducted October 21st 2018, through October 23rd 2018, n=738 MOE +/- 4.4 percentage points. Totals may not add to 100% due to rounding.*Soft Democrats include registered voters who identify as "not strong Democrats" or Democratic leaning independents. Soft Republicans include those registered voters who identify as "not strong Republicans" or Republican leaning independents.
White Evangelical Christians
Marital Status and Gender
Area Description
Small city/Suburban Men
Small city/Suburban Women
Race and Education
Gender - Race - Education
Age
Age
Gender
Trump Supporters
Region
Household Income
Education
Race
National Registered Voters
2018 Congressional Elections Very Important
Party Identification
Party Identification*
Party ID and Gender
USCNGFVT1. NPR/PBS NewsHour/Marist Poll National Tables October 21st 2018, through October 23rd 2018,
National Registered VotersIs your impression of President Trump a major factor, a minor factor, or not a factor at all in
deciding your vote for congress this November?
9

Major factor Minor factor Not a factor at all UnsureRow % Row % Row % Row %
October 2018 44% 23% 31% 2%September 2014 28% 19% 52% 1%
USCNGFVT1. Marist Poll National Trend TablesNational Registered Voters
Is your impression of President Trump (Obama) a major factor, a minor factor, or not a factor at all in deciding your vote for congress this November?
Marist Poll National Registered Voters
10

More likely to vote for a Republican for
Congress this November
More likely to vote for a Democrat for
Congress this November
Vol. Makes no difference Unsure
Row % Row % Row % Row %
34% 47% 15% 4%
36% 52% 10% 2%Democrat 3% 91% 6% 1%Republican 80% 4% 15% 1%Independent 29% 40% 21% 10%Major factor 32% 64% 2% 2%Minor factor 40% 41% 15% 4%Not a factor at all 32% 26% 35% 7%Strong Democrats 1% 94% 5% 0%Soft Democrats 5% 86% 7% 3%Just Independents 11% 24% 38% 27%Soft Republicans 64% 7% 26% 3%Strong Republicans 88% 1% 11% 0%Democrat men 5% 87% 7% 1%Democrat women 1% 93% 5% 1%Republican men 80% 4% 15% 1%Republican women 81% 4% 15% 1%Independent men 29% 33% 26% 11%Independent women 28% 50% 15% 7%
75% 6% 15% 4%Northeast 30% 52% 15% 2%Midwest 35% 45% 15% 4%South 40% 40% 15% 5%West 26% 54% 15% 5%Less than $50,000 29% 50% 16% 6%$50,000 or more 36% 46% 14% 4%Not college graduate 40% 42% 12% 6%College graduate 26% 54% 18% 2%White 41% 39% 16% 3%African American 7% 79% 6% 8%Latino 17% 62% 12% 10%White - Not College Graduate 51% 33% 12% 4%White - College Graduate 31% 47% 19% 2%Men - White - Not College Graduate 53% 24% 17% 5%
Men - White - College Graduate 32% 46% 21% 2%
Women - White - Not College Graduate
48% 41% 8% 3%
Women - White - College Graduate 31% 49% 17% 3%
18 to 29 19% 58% 19% 3%30 to 44 27% 48% 20% 6%45 to 59 42% 39% 14% 4%60 or older 39% 47% 11% 4%Under 45 23% 52% 20% 5%45 or older 41% 43% 12% 4%Men 36% 40% 19% 5%Women 31% 54% 11% 3%
66% 18% 13% 3%Married men 41% 35% 19% 5%Single men 32% 44% 18% 6%Married women 44% 41% 11% 3%Single women 20% 65% 11% 3%Big city 21% 61% 17% 1%Small city 28% 42% 23% 7%Suburban 26% 62% 9% 3%Small town 49% 34% 11% 6%Rural 54% 26% 14% 6%
29% 44% 19% 7%
25% 60% 13% 3%Small city/Suburban Women
NPR/PBS NewsHour/Marist Poll National Registered Voters. Interviews conducted October 21st 2018, through October 23rd 2018, n=738 MOE +/- 4.4 percentage points. Totals may not add to 100% due to rounding.*Soft Democrats include registered voters who identify as "not strong Democrats" or Democratic leaning independents. Soft Republicans include those registered voters who identify as "not strong Republicans" or Republican leaning independents.
Gender
White Evangelical Christians
Marital Status and Gender
Area Description
Small city/Suburban Men
Race
Race and Education
Gender - Race - Education
Age
Age
Party ID and Gender
Trump Supporters
Region
Household Income
Education
National Registered Voters
2018 Congressional Elections Very Important
Party Identification
Impression of Trump as a Factor for 2018 Vote
Party Identification*
USCNGDTF1. NPR/PBS NewsHour/Marist Poll National Tables October 21st 2018, through October 23rd 2018,
National Registered VotersDoes your impression of President Trump make you:
11

More likely to vote for a Republican for Congress
this November
More likely to vote for a Democrat for Congress
this November Vol. Makes no difference UnsureRow % Row % Row % Row %
October 2018 34% 47% 15% 4%September 2014 41% 38% 18% 3%Marist Poll National Registered Voters
USCNGDTF1. Marist Poll National Trend TablesNational Registered Voters
Does your impression of President Trump (Obama) make you:
12

The economy and jobs Health care Immigration
Federal taxes and spending Climate change Guns
Foreign policy and terrorism Abortion Opioid addiction Vol. All equally Other Unsure
Row % Row % Row % Row % Row % Row % Row % Row % Row % Row % Row % Row %
20% 17% 17% 9% 7% 5% 5% 4% 3% 11% 1% 1%20% 19% 17% 8% 6% 5% 4% 4% 3% 13% 1% 1%
Democrat 7% 26% 9% 7% 13% 6% 4% 3% 6% 17% 0% 1%Republican 30% 4% 25% 8% 2% 3% 5% 7% 2% 11% 1% 1%Independent 24% 19% 17% 12% 6% 7% 5% 3% 1% 6% 1% 0%Major factor 16% 21% 19% 5% 7% 4% 6% 2% 2% 16% 1% 0%Minor factor 24% 11% 17% 17% 7% 5% 3% 5% 5% 6% 0% 0%Not a factor at all 24% 17% 14% 10% 7% 7% 4% 5% 2% 8% 1% 1%Strong Democrats 8% 31% 5% 9% 11% 5% 3% 4% 7% 16% 1% 0%Soft Democrats 15% 22% 16% 9% 13% 7% 4% 0% 3% 10% 0% 1%Just Independents 21% 21% 8% 10% 3% 12% 7% 1% 3% 13% 2% 0%Soft Republicans 29% 8% 27% 11% 4% 2% 7% 6% 0% 5% 0% 0%Strong Republicans 31% 5% 23% 6% 1% 3% 4% 8% 3% 13% 1% 0%Democrat men 8% 29% 8% 7% 15% 1% 5% 2% 9% 13% 0% 3%Democrat women 7% 24% 11% 7% 11% 9% 3% 3% 4% 20% 1% 0%Republican men 33% 4% 21% 13% 4% 3% 7% 1% 4% 9% 0% 0%Republican women 28% 5% 29% 2% 0% 2% 3% 13% 1% 14% 1% 1%Independent men 25% 16% 13% 16% 6% 8% 3% 5% 1% 6% 1% 0%Independent women 24% 24% 21% 7% 6% 5% 7% 0% 1% 6% 0% 0%
31% 4% 26% 8% 1% 4% 5% 7% 1% 11% 1% 0%Northeast 15% 15% 14% 12% 13% 7% 5% 3% 5% 11% 0% 0%Midwest 22% 18% 17% 8% 3% 5% 3% 7% 4% 14% 0% 0%South 23% 19% 18% 7% 7% 5% 3% 5% 3% 8% 1% 0%West 19% 17% 16% 12% 5% 4% 7% 1% 1% 14% 1% 2%Less than $50,000 18% 16% 15% 8% 6% 7% 4% 7% 6% 11% 0% 0%$50,000 or more 23% 18% 17% 10% 8% 3% 5% 2% 1% 10% 1% 0%Not college graduate 20% 16% 18% 8% 7% 5% 3% 4% 5% 14% 1% 1%College graduate 21% 21% 15% 11% 8% 5% 7% 2% 1% 8% 1% 1%White 22% 18% 16% 10% 8% 4% 6% 3% 2% 10% 1% 1%African American 27% 25% 6% 6% 6% 12% 0% 6% 5% 8% 1% 0%Latino 11% 12% 23% 11% 6% 6% 2% 4% 9% 16% 0% 1%White - Not College Graduate 21% 16% 17% 11% 5% 4% 6% 2% 3% 13% 1% 0%White - College Graduate 23% 21% 14% 9% 11% 4% 6% 3% 1% 7% 1% 1%Men - White - Not College Graduate 21% 16% 16% 17% 5% 5% 6% 1% 2% 11% 1% 0%
Men - White - College Graduate 26% 15% 10% 14% 13% 4% 7% 2% 1% 7% 0% 1%
Women - White - Not College Graduate
20% 16% 18% 6% 6% 4% 6% 4% 3% 16% 1% 0%
Women - White - College Graduate 21% 27% 18% 4% 9% 3% 5% 4% 0% 6% 1% 1%
18 to 29 12% 13% 19% 6% 11% 13% 2% 5% 8% 11% 0% 0%30 to 44 27% 16% 10% 14% 8% 2% 7% 2% 4% 9% 0% 1%45 to 59 24% 16% 18% 8% 7% 3% 5% 4% 1% 14% 1% 0%60 or older 17% 22% 19% 9% 4% 5% 4% 5% 3% 11% 1% 1%Under 45 21% 15% 14% 11% 9% 7% 5% 3% 5% 10% 0% 0%45 or older 20% 19% 18% 8% 5% 4% 4% 4% 2% 12% 1% 1%Men 22% 16% 14% 13% 8% 4% 5% 3% 4% 9% 1% 1%Women 18% 19% 19% 6% 6% 6% 4% 5% 2% 13% 1% 0%
27% 11% 20% 7% 3% 5% 6% 6% 2% 12% 1% 0%Married men 27% 14% 16% 11% 7% 3% 6% 2% 1% 12% 1% 0%Single men 18% 18% 11% 15% 8% 6% 4% 2% 8% 7% 0% 2%Married women 27% 17% 19% 6% 2% 3% 3% 4% 1% 16% 1% 0%Single women 12% 22% 19% 6% 9% 8% 6% 5% 3% 10% 0% 0%Big city 18% 19% 12% 11% 5% 10% 5% 4% 4% 10% 1% 1%Small city 23% 19% 18% 9% 6% 6% 2% 3% 2% 11% 1% 0%Suburban 18% 21% 15% 10% 12% 3% 5% 2% 2% 12% 1% 0%Small town 21% 19% 21% 10% 7% 2% 6% 4% 3% 7% 0% 1%Rural 21% 10% 17% 8% 4% 4% 8% 4% 7% 17% 0% 0%
21% 20% 15% 12% 9% 5% 5% 1% 3% 10% 1% 0%20% 19% 18% 7% 10% 5% 2% 5% 1% 13% 1% 1%
NPR/PBS NewsHour/Marist Poll National Registered Voters. Interviews conducted October 21st 2018, through October 23rd 2018, n=738 MOE +/- 4.4 percentage points. Totals may not add to 100% due to rounding.*Soft Democrats include registered voters who identify as "not strong Democrats" or Democratic leaning independents. Soft Republicans include those registered voters who identify as "not strong Republicans" or Republican leaning independents.
White Evangelical ChristiansMarital Status and Gender
Area Description
Small city/Suburban MenSmall city/Suburban Women
Race and Education
Gender - Race - Education
Age
Age
Gender
Trump SupportersRegion
Household Income
Education
Race
2018 Congressional Elections Very ImportantParty Identification
Impression of Trump as a Factor for 2018 Vote
Party Identification*
Party ID and Gender
CNGVTISS1. NPR/PBS NewsHour/Marist Poll National Tables October 21st 2018, through October 23rd 2018,
National Registered Voters
Now, let me list some issues that may factor into deciding your vote for Congress in November. Please tell me which one of these items you think will be the most important factor in deciding your vote:
National Registered Voters
13

Supported President Trump's U.S.
Supreme Court nominee Brett
Kavanaugh
Opposed President Trump's U.S.
Supreme Court nominee Brett
Kavanaugh
Or does this not make any difference to your
vote UnsureRow % Row % Row % Row %
27% 37% 35% 2%
30% 43% 25% 2%Democrat 2% 66% 29% 3%Republican 64% 6% 30% 0%Independent 21% 35% 43% 1%Major factor 28% 53% 18% 2%Minor factor 24% 33% 41% 2%Not a factor at all 29% 18% 52% 2%Strong Democrats 1% 72% 24% 3%Soft Democrats 2% 60% 36% 2%Just Independents 11% 28% 60% 2%Soft Republicans 48% 9% 42% 1%Strong Republicans 71% 4% 25% 0%Democrat men 0% 66% 30% 4%Democrat women 3% 66% 28% 3%Republican men 64% 6% 29% 0%Republican women 64% 5% 31% 1%Independent men 26% 32% 42% 1%Independent women 16% 38% 44% 1%
65% 2% 32% 1%Northeast 19% 42% 37% 1%Midwest 33% 32% 33% 1%South 33% 29% 35% 2%West 19% 47% 32% 2%Less than $50,000 24% 37% 37% 3%$50,000 or more 29% 36% 34% 1%Not college graduate 31% 31% 35% 3%College graduate 21% 44% 34% 0%White 33% 32% 34% 1%African American 2% 57% 37% 4%Latino 16% 41% 39% 4%White - Not College Graduate 39% 26% 33% 2%White - College Graduate 25% 39% 35% 1%Men - White - Not College Graduate 43% 23% 32% 2%
Men - White - College Graduate 26% 37% 36% 1%
Women - White - Not College Graduate
35% 29% 34% 2%
Women - White - College Graduate 25% 41% 33% 0%
18 to 29 16% 48% 36% 0%30 to 44 24% 43% 32% 1%45 to 59 31% 25% 43% 1%60 or older 31% 36% 28% 4%Under 45 21% 45% 34% 0%45 or older 31% 31% 35% 3%Men 30% 33% 35% 2%Women 24% 40% 34% 2%
56% 14% 28% 2%Married men 36% 30% 34% 0%Single men 25% 37% 35% 2%Married women 31% 34% 34% 1%Single women 17% 45% 35% 3%Big city 22% 45% 31% 3%Small city 21% 41% 38% 0%Suburban 19% 43% 37% 1%Small town 33% 29% 34% 4%Rural 46% 22% 32% 0%
24% 38% 37% 1%
16% 46% 38% 0%Small city/Suburban Women
NPR/PBS NewsHour/Marist Poll National Registered Voters. Interviews conducted October 21st 2018, through October 23rd 2018, n=738 MOE +/- 4.4 percentage points. Totals may not add to 100% due to rounding.*Soft Democrats include registered voters who identify as "not strong Democrats" or Democratic leaning independents. Soft Republicans include those registered voters who identify as "not strong Republicans" or Republican leaning independents.
Gender
White Evangelical Christians
Marital Status and Gender
Area Description
Small city/Suburban Men
Race
Race and Education
Gender - Race - Education
Age
Age
Party ID and Gender
Trump Supporters
Region
Household Income
Education
National Registered Voters
2018 Congressional Elections Very Important
Party Identification
Impression of Trump as a Factor for 2018 Vote
Party Identification*
CGVT18SCBK. NPR/PBS NewsHour/Marist Poll National Tables October 21st 2018, through October 23rd 2018,
National Registered VotersThinking about your vote for congress this November, are you more likely to vote for a
candidate who:
14

Supported President Trump's Supreme Court nominee
Brett Kavanaugh
Opposed President Trump's Supreme Court nominee
Brett Kavanaugh
Or does this not make any difference to
your vote UnsureRow % Row % Row % Row %
27% 37% 35% 2%31% 40% 26% 3%32% 37% 27% 5%31% 33% 29% 7%
Marist Poll National Registered Voters
CGVT18SCBKTRND. Marist Poll National Trend TablesNational Registered Voters
Thinking about your vote for Congress this November, are you more likely to vote for a candidate who:
July 2018September 2018
October 3rd, 2018
October 26th, 2018
15

The most important factor
Just one of many factors
Not an important factor Unsure
Row % Row % Row % Row %
11% 63% 24% 1%
11% 68% 21% 1%Democrat 15% 57% 26% 2%Republican 10% 72% 17% 1%Independent 8% 64% 28% 0%Major factor 12% 64% 23% 1%Minor factor 8% 71% 21% 0%Not a factor at all 12% 58% 29% 0%Strong Democrats 17% 55% 26% 2%Soft Democrats 6% 63% 30% 1%Just Independents 7% 56% 36% 0%Soft Republicans 10% 70% 19% 0%Strong Republicans 12% 72% 15% 1%Democrat men 16% 57% 26% 1%Democrat women 13% 56% 26% 4%Republican men 10% 72% 18% 0%Republican women 10% 72% 15% 2%Independent men 11% 63% 26% 0%Independent women 4% 66% 30% 0%
12% 72% 15% 1%Northeast 9% 67% 25% 0%Midwest 12% 70% 18% 1%South 11% 60% 28% 2%West 13% 60% 25% 2%Less than $50,000 16% 53% 29% 2%$50,000 or more 8% 71% 21% 1%Not college graduate 14% 58% 26% 2%College graduate 7% 70% 23% 0%White 7% 70% 22% 1%African American 18% 51% 31% 0%Latino 19% 41% 37% 3%White - Not College Graduate 11% 68% 21% 1%White - College Graduate 3% 72% 24% 1%Men - White - Not College Graduate 10% 69% 22% 0%
Men - White - College Graduate 4% 74% 22% 0%
Women - White - Not College Graduate
11% 67% 20% 1%
Women - White - College Graduate 3% 70% 26% 1%
18 to 29 8% 67% 25% 0%30 to 44 10% 55% 34% 0%45 to 59 9% 70% 21% 1%60 or older 16% 62% 20% 3%Under 45 9% 60% 30% 0%45 or older 12% 65% 20% 2%Men 13% 63% 24% 0%Women 9% 64% 25% 2%
9% 71% 19% 1%Married men 9% 73% 17% 0%Single men 16% 55% 28% 1%Married women 7% 72% 19% 2%Single women 12% 56% 31% 2%Big city 8% 73% 18% 1%Small city 16% 55% 28% 2%Suburban 10% 64% 25% 1%Small town 11% 63% 23% 3%Rural 9% 63% 28% 0%
14% 61% 24% 0%
11% 57% 30% 2%Small city/Suburban Women
NPR/PBS NewsHour/Marist Poll National Registered Voters. Interviews conducted October 21st 2018, through October 23rd 2018, n=738 MOE +/- 4.4 percentage points. Totals may not add to 100% due to rounding.*Soft Democrats include registered voters who identify as "not strong Democrats" or Democratic leaning independents. Soft Republicans include those registered voters who identify as "not strong Republicans" or Republican leaning independents.
Gender
White Evangelical Christians
Marital Status and Gender
Area Description
Small city/Suburban Men
Race
Race and Education
Gender - Race - Education
Age
Age
Party ID and Gender
Trump Supporters
Region
Household Income
Education
National Registered Voters
2018 Congressional Elections Very Important
Party Identification
Impression of Trump as a Factor for 2018 Vote
Party Identification*
CNGTAXVT1. NPR/PBS NewsHour/Marist Poll National Tables October 21st 2018, through October 23rd 2018,
National Registered Voters
Will a candidate's position on tax cuts be the most important factor, just one of many factors, or not an important factor in deciding who you vote for Congress?
16

More likely to vote for a Republican for
Congress this November
More likely to vote for a Democrat for
Congress this November
Vol. Makes no difference to vote Unsure
Row % Row % Row % Row %
39% 45% 10% 6%
40% 48% 8% 4%Democrat 2% 87% 9% 2%Republican 88% 5% 4% 3%Independent 38% 38% 13% 11%Major factor 34% 59% 4% 2%Minor factor 44% 43% 9% 4%Not a factor at all 45% 27% 18% 11%Strong Democrats 0% 93% 6% 1%Soft Democrats 8% 78% 10% 4%Just Independents 25% 17% 29% 30%Soft Republicans 75% 12% 9% 5%Strong Republicans 93% 1% 4% 3%Democrat men 3% 89% 7% 1%Democrat women 1% 86% 10% 3%Republican men 92% 2% 5% 1%Republican women 84% 8% 4% 4%Independent men 42% 32% 14% 12%Independent women 33% 45% 12% 11%
83% 5% 8% 5%Northeast 33% 48% 13% 7%Midwest 41% 43% 9% 7%South 47% 38% 9% 5%West 32% 53% 9% 6%Less than $50,000 34% 48% 9% 9%$50,000 or more 44% 41% 10% 4%Not college graduate 42% 42% 8% 8%College graduate 35% 50% 12% 4%White 47% 35% 13% 5%African American 14% 77% 3% 6%Latino 25% 65% 3% 8%White - Not College Graduate 51% 31% 12% 7%White - College Graduate 42% 40% 14% 4%Men - White - Not College Graduate 58% 24% 12% 6%
Men - White - College Graduate 47% 39% 12% 2%
Women - White - Not College Graduate
44% 37% 12% 7%
Women - White - College Graduate 38% 42% 15% 5%
18 to 29 32% 59% 4% 5%30 to 44 38% 41% 16% 5%45 to 59 46% 39% 10% 5%60 or older 39% 44% 8% 9%Under 45 35% 49% 11% 5%45 or older 42% 42% 9% 7%Men 45% 39% 10% 6%Women 34% 50% 10% 6%
68% 18% 9% 5%Married men 53% 36% 9% 2%Single men 38% 43% 10% 9%Married women 46% 40% 11% 3%Single women 23% 59% 8% 10%Big city 35% 57% 7% 1%Small city 33% 46% 12% 9%Suburban 32% 53% 10% 5%Small town 50% 34% 8% 7%Rural 53% 28% 12% 7%
41% 42% 9% 7%
24% 56% 13% 7%Small city/Suburban Women
NPR/PBS NewsHour/Marist Poll National Registered Voters. Interviews conducted October 21st 2018, through October 23rd 2018, n=738 MOE +/- 4.4 percentage points. Totals may not add to 100% due to rounding.*Soft Democrats include registered voters who identify as "not strong Democrats" or Democratic leaning independents. Soft Republicans include those registered voters who identify as "not strong Republicans" or Republican leaning independents.
Gender
White Evangelical Christians
Marital Status and Gender
Area Description
Small city/Suburban Men
Race
Race and Education
Gender - Race - Education
Age
Age
Party ID and Gender
Trump Supporters
Region
Household Income
Education
National Registered Voters
2018 Congressional Elections Very Important
Party Identification
Impression of Trump as a Factor for 2018 Vote
Party Identification*
CNGTXVTDR1. NPR/PBS NewsHour/Marist Poll National Tables October 21st 2018, through October 23rd 2018,
National Registered VotersDoes the issue of tax cuts make you:
17

The most important factor
Just one of many factors
Not an important factor Unsure
Row % Row % Row % Row %
18% 69% 12% 1%
18% 73% 8% 1%Democrat 28% 66% 5% 1%Republican 10% 77% 12% 1%Independent 14% 67% 18% 1%Major factor 23% 66% 11% 1%Minor factor 13% 77% 9% 0%Not a factor at all 12% 71% 16% 0%Strong Democrats 28% 68% 3% 0%Soft Democrats 24% 65% 10% 1%Just Independents 15% 55% 29% 1%Soft Republicans 4% 79% 16% 0%Strong Republicans 13% 72% 13% 2%Democrat men 31% 64% 4% 1%Democrat women 25% 67% 6% 1%Republican men 9% 72% 18% 1%Republican women 11% 82% 6% 1%Independent men 12% 68% 20% 0%Independent women 17% 65% 16% 1%
10% 72% 17% 1%Northeast 16% 73% 10% 1%Midwest 18% 72% 10% 0%South 13% 68% 17% 1%West 25% 66% 8% 1%Less than $50,000 21% 66% 12% 1%$50,000 or more 14% 73% 12% 1%Not college graduate 20% 66% 12% 1%College graduate 14% 74% 11% 0%White 15% 72% 12% 1%African American 22% 64% 13% 0%Latino 34% 60% 4% 2%White - Not College Graduate 17% 70% 12% 1%White - College Graduate 12% 76% 13% 0%Men - White - Not College Graduate 10% 74% 16% 1%
Men - White - College Graduate 13% 72% 15% 0%
Women - White - Not College Graduate
24% 66% 9% 1%
Women - White - College Graduate 10% 79% 10% 1%
18 to 29 17% 74% 9% 0%30 to 44 11% 72% 16% 0%45 to 59 22% 63% 14% 2%60 or older 19% 70% 9% 2%Under 45 14% 73% 13% 0%45 or older 20% 67% 11% 2%Men 16% 69% 14% 0%Women 19% 70% 10% 1%
16% 70% 14% 0%Married men 11% 76% 13% 0%Single men 21% 65% 14% 0%Married women 18% 72% 9% 0%Single women 20% 68% 11% 2%Big city 23% 67% 10% 1%Small city 19% 70% 11% 0%Suburban 15% 75% 9% 1%Small town 19% 61% 18% 3%Rural 10% 77% 14% 0%
15% 75% 10% 0%
19% 70% 10% 1%Small city/Suburban Women
NPR/PBS NewsHour/Marist Poll National Registered Voters. Interviews conducted October 21st 2018, through October 23rd 2018, n=738 MOE +/- 4.4 percentage points. Totals may not add to 100% due to rounding.*Soft Democrats include registered voters who identify as "not strong Democrats" or Democratic leaning independents. Soft Republicans include those registered voters who identify as "not strong Republicans" or Republican leaning independents.
Gender
White Evangelical Christians
Marital Status and Gender
Area Description
Small city/Suburban Men
Race
Race and Education
Gender - Race - Education
Age
Age
Party ID and Gender
Trump Supporters
Region
Household Income
Education
National Registered Voters
2018 Congressional Elections Very Important
Party Identification
Impression of Trump as a Factor for 2018 Vote
Party Identification*
CNGHCVT1. NPR/PBS NewsHour/Marist Poll National Tables October 21st 2018, through October 23rd 2018,
National Registered Voters
Will a candidate's position on health care be the most important factor, just one of many factors, or not an important factor in deciding who you vote for Congress?
18
More likely to vote for a Republican for
Congress this November
More likely to vote for a Democrat for
Congress this November
Vol. Makes no difference to vote Unsure
Row % Row % Row % Row %
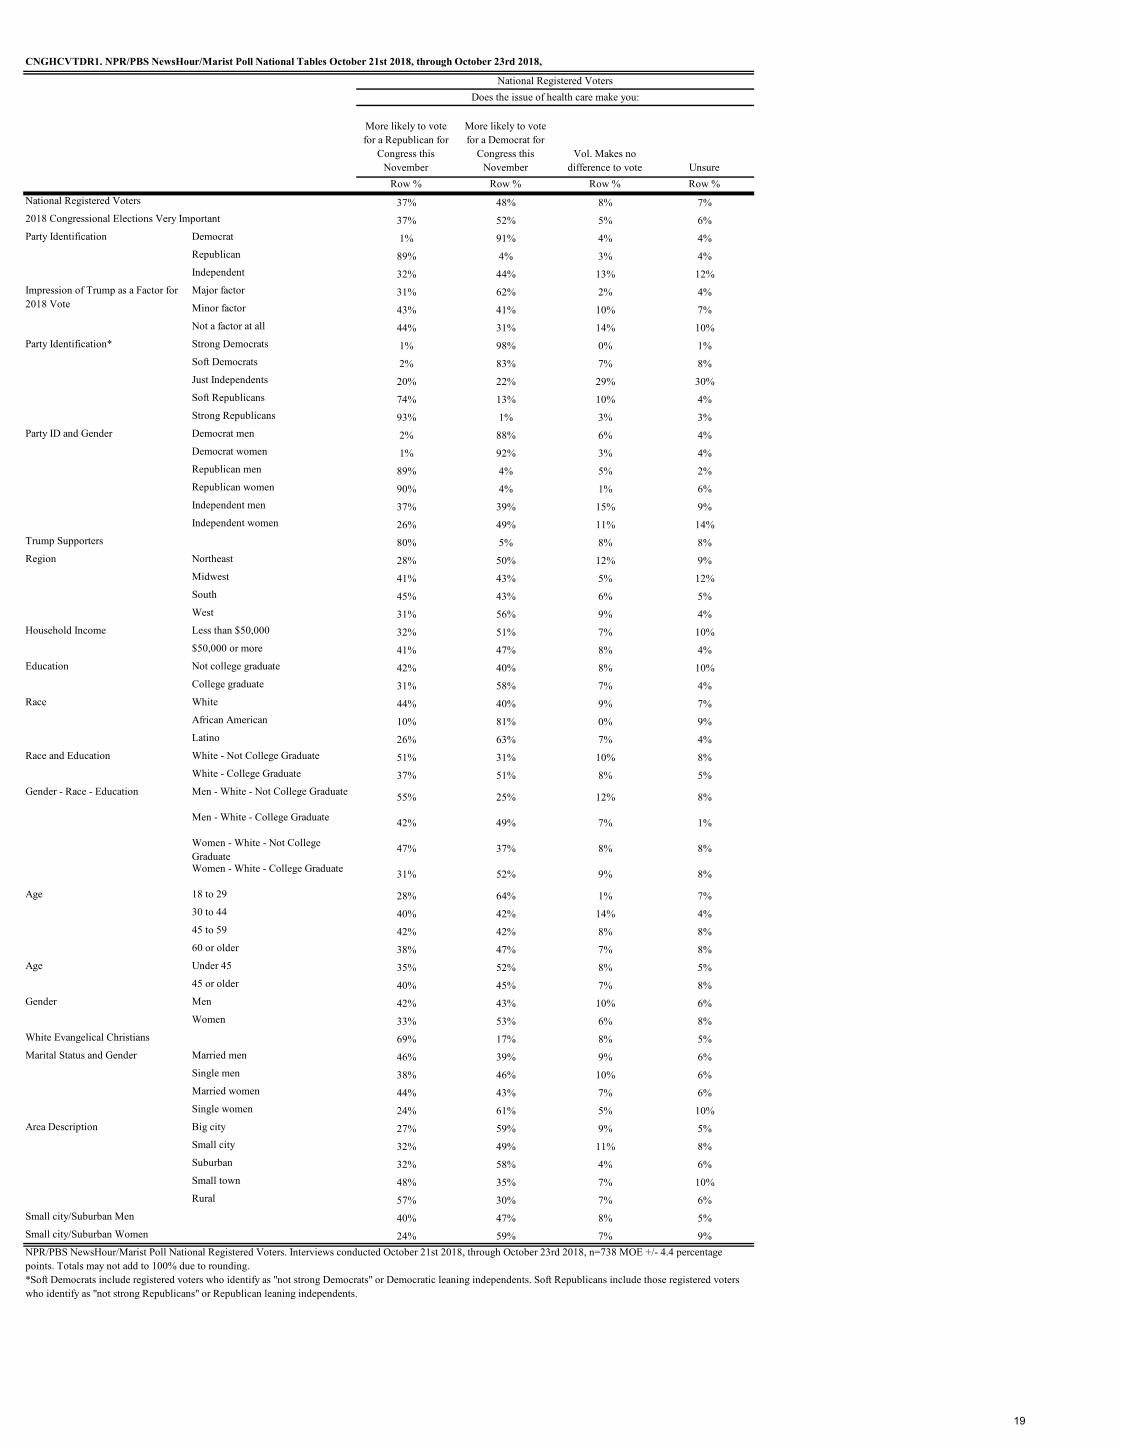
37% 48% 8% 7%
37% 52% 5% 6%Democrat 1% 91% 4% 4%Republican 89% 4% 3% 4%Independent 32% 44% 13% 12%Major factor 31% 62% 2% 4%Minor factor 43% 41% 10% 7%Not a factor at all 44% 31% 14% 10%Strong Democrats 1% 98% 0% 1%Soft Democrats 2% 83% 7% 8%Just Independents 20% 22% 29% 30%Soft Republicans 74% 13% 10% 4%Strong Republicans 93% 1% 3% 3%Democrat men 2% 88% 6% 4%Democrat women 1% 92% 3% 4%Republican men 89% 4% 5% 2%Republican women 90% 4% 1% 6%Independent men 37% 39% 15% 9%Independent women 26% 49% 11% 14%
80% 5% 8% 8%Northeast 28% 50% 12% 9%Midwest 41% 43% 5% 12%South 45% 43% 6% 5%West 31% 56% 9% 4%Less than $50,000 32% 51% 7% 10%$50,000 or more 41% 47% 8% 4%Not college graduate 42% 40% 8% 10%College graduate 31% 58% 7% 4%White 44% 40% 9% 7%African American 10% 81% 0% 9%Latino 26% 63% 7% 4%White - Not College Graduate 51% 31% 10% 8%White - College Graduate 37% 51% 8% 5%Men - White - Not College Graduate 55% 25% 12% 8%
Men - White - College Graduate 42% 49% 7% 1%
Women - White - Not College Graduate
47% 37% 8% 8%
Women - White - College Graduate 31% 52% 9% 8%
18 to 29 28% 64% 1% 7%30 to 44 40% 42% 14% 4%45 to 59 42% 42% 8% 8%60 or older 38% 47% 7% 8%Under 45 35% 52% 8% 5%45 or older 40% 45% 7% 8%Men 42% 43% 10% 6%Women 33% 53% 6% 8%
69% 17% 8% 5%Married men 46% 39% 9% 6%Single men 38% 46% 10% 6%Married women 44% 43% 7% 6%Single women 24% 61% 5% 10%Big city 27% 59% 9% 5%Small city 32% 49% 11% 8%Suburban 32% 58% 4% 6%Small town 48% 35% 7% 10%Rural 57% 30% 7% 6%
40% 47% 8% 5%
24% 59% 7% 9%Small city/Suburban Women
NPR/PBS NewsHour/Marist Poll National Registered Voters. Interviews conducted October 21st 2018, through October 23rd 2018, n=738 MOE +/- 4.4 percentage points. Totals may not add to 100% due to rounding.*Soft Democrats include registered voters who identify as "not strong Democrats" or Democratic leaning independents. Soft Republicans include those registered voters who identify as "not strong Republicans" or Republican leaning independents.
Gender
White Evangelical Christians
Marital Status and Gender
Area Description
Small city/Suburban Men
Race
Race and Education
Gender - Race - Education
Age
Age
Party ID and Gender
Trump Supporters
Region
Household Income
Education
National Registered Voters
2018 Congressional Elections Very Important
Party Identification
Impression of Trump as a Factor for 2018 Vote
Party Identification*
CNGHCVTDR1. NPR/PBS NewsHour/Marist Poll National Tables October 21st 2018, through October 23rd 2018,
National Registered VotersDoes the issue of health care make you:
19

Mostly cut government spending including entitlement
programs such as Social Security, Medicare, and
Medicaid
Mostly increase revenues by reversing the tax cuts passed by
Congress last year Vol. Both UnsureRow % Row % Row % Row %
21% 60% 2% 17%
21% 60% 2% 17%
19% 63% 2% 15%Major factor 18% 68% 2% 12%Minor factor 19% 60% 5% 16%Not a factor at all 25% 50% 2% 23%Democrat 7% 80% 1% 13%Republican 32% 43% 1% 24%Independent 24% 58% 5% 14%Strong Democrats 4% 83% 1% 12%Soft Democrats 10% 77% 3% 10%Just Independents 19% 58% 7% 16%Soft Republicans 37% 41% 3% 20%Strong Republicans 34% 37% 2% 27%Democrat men 11% 82% 1% 7%Democrat women 4% 78% 1% 17%Republican men 37% 39% 2% 22%Republican women 27% 47% 0% 27%Independent men 32% 47% 8% 13%Independent women 13% 70% 1% 16%
38% 36% 2% 24%Northeast 16% 64% 3% 16%Midwest 21% 63% 2% 14%South 26% 53% 1% 20%West 16% 65% 4% 15%Less than $50,000 19% 59% 1% 21%$50,000 or more 22% 62% 4% 13%Not college graduate 26% 54% 2% 18%College graduate 15% 68% 3% 14%White 22% 59% 2% 17%African American 19% 69% 3% 9%Latino 17% 66% 3% 15%White - Not College Graduate 27% 52% 2% 19%White - College Graduate 18% 66% 3% 14%Men - White - Not College Graduate 36% 45% 3% 16%
Men - White - College Graduate 23% 59% 5% 14%
Women - White - Not College Graduate
19% 59% 0% 22%
Women - White - College Graduate 13% 72% 1% 14%
18 to 29 16% 75% 3% 7%30 to 44 24% 62% 3% 11%45 to 59 21% 57% 2% 20%60 or older 21% 55% 2% 23%Under 45 20% 67% 3% 9%45 or older 21% 56% 2% 22%Men 27% 54% 4% 15%Women 14% 66% 1% 19%
25% 47% 2% 27%Married men 26% 47% 7% 20%Single men 28% 60% 2% 10%Married women 14% 66% 1% 19%Single women 14% 68% 1% 18%Big city 19% 64% 3% 14%Small city 18% 62% 4% 16%Suburban 18% 68% 2% 13%Small town 28% 55% 0% 16%Rural 25% 50% 3% 22%
21% 61% 5% 13%
14% 69% 1% 16%
Small city/Suburban Men
Small city/Suburban Women
NPR/PBS NewsHour/Marist Poll National Adults. Interviews conducted October 21st 2018, through October 23rd 2018, n=935 MOE +/- 3.9 percentage points.^National Registered Voters: n=738 MOE +/- 4.4 percentage points. Totals may not add to 100% due to rounding.*Soft Democrats include registered voters who identify as "not strong Democrats" or Democratic leaning independents. Soft Republicans include those registered voters who identify as "not strong Republicans" or Republican leaning independents.
Age
Gender
White Evangelical Christians
Marital Status and Gender
Area Description
Education
Race
Race and Education
Gender - Race - Education
Age
Party Identification*
Party ID and Gender
Trump Supporters
Region
Household Income
National Adults
National Registered Voters
2018 Congressional Elections Very Important
Impression of Trump as a Factor for 2018 Vote
Party Identification^
BUDDEF1. NPR/PBS NewsHour/Marist Poll National Tables October 21st 2018, through October 23rd 2018,
National AdultsWhich of the following comes closest to your view about how to reduce the federal budget
deficit:
20

Live comfortably
Meet your basic expenses with a little
left over for extrasJust meet your basic
expenses
Don’t have enough to meet your basic
expensesRow % Row % Row % Row %
44% 28% 20% 8%
44% 28% 20% 7%
46% 30% 19% 5%Major factor 47% 27% 20% 6%Minor factor 41% 30% 24% 5%Not a factor at all 44% 29% 17% 10%Democrat 41% 28% 26% 6%Republican 55% 22% 15% 7%Independent 42% 31% 19% 9%Strong Democrats 46% 29% 22% 4%Soft Democrats 35% 26% 29% 10%Just Independents 44% 28% 17% 11%Soft Republicans 46% 33% 12% 9%Strong Republicans 57% 22% 18% 4%Democrat men 40% 33% 21% 7%Democrat women 41% 24% 30% 5%Republican men 60% 27% 11% 2%Republican women 50% 17% 19% 14%Independent men 40% 35% 19% 5%Independent women 44% 25% 18% 13%
48% 31% 18% 3%Northeast 39% 30% 26% 5%Midwest 48% 28% 13% 11%South 45% 28% 18% 9%West 42% 28% 23% 7%Less than $50,000 22% 30% 30% 17%$50,000 or more 60% 26% 11% 2%Not college graduate 35% 30% 22% 13%College graduate 58% 25% 15% 1%White 48% 28% 19% 5%African American 27% 32% 20% 20%Latino 41% 25% 25% 9%White - Not College Graduate 39% 32% 21% 9%White - College Graduate 60% 23% 16% 1%Men - White - Not College Graduate 40% 33% 21% 6%
Men - White - College Graduate 60% 23% 16% 0%
Women - White - Not College Graduate
37% 31% 22% 11%
Women - White - College Graduate 60% 24% 15% 2%
18 to 29 38% 33% 21% 8%30 to 44 45% 28% 19% 8%45 to 59 41% 30% 18% 11%60 or older 50% 24% 20% 6%Under 45 42% 30% 20% 8%45 or older 46% 27% 19% 9%Men 45% 32% 17% 6%Women 43% 25% 22% 10%
47% 28% 18% 7%Married men 54% 27% 15% 4%Single men 37% 36% 19% 8%Married women 57% 27% 11% 5%Single women 34% 24% 28% 14%Big city 40% 29% 20% 10%Small city 42% 30% 20% 8%Suburban 56% 27% 14% 2%Small town 43% 26% 20% 11%Rural 39% 25% 25% 10%
48% 32% 16% 3%
49% 26% 18% 8%
Small city/Suburban Men
Small city/Suburban Women
NPR/PBS NewsHour/Marist Poll National Adults. Interviews conducted October 21st 2018, through October 23rd 2018, n=935 MOE +/- 3.9 percentage points.^National Registered Voters: n=738 MOE +/- 4.4 percentage points. Totals may not add to 100% due to rounding.*Soft Democrats include registered voters who identify as "not strong Democrats" or Democratic leaning independents. Soft Republicans include those registered voters who identify as "not strong Republicans" or Republican leaning independents.
Age
Gender
White Evangelical Christians
Marital Status and Gender
Area Description
Education
Race
Race and Education
Gender - Race - Education
Age
Party Identification*
Party ID and Gender
Trump Supporters
Region
Household Income
National Adults
National Registered Voters
2018 Congressional Elections Very Important
Impression of Trump as a Factor for 2018 Vote
Party Identification^
FINSTAT1. NPR/PBS NewsHour/Marist Poll National Tables October 21st 2018, through October 23rd 2018,
National Adults
How would you describe your household financial situation? Would you say you:
21

Live comfortably
Meet your basic expenses with a
little left over for extras
Just meet your basic expenses
Don’t have enough to meet your basic
expensesRow % Row % Row % Row %
October 2018 44% 28% 20% 8%December 2016 39% 26% 24% 10%
July 2012 36% 30% 24% 10%Marist Poll National Adults
National AdultsHow would you describe your household financial situation?
Would you say you:
FINSTAT1. Marist Poll National Tables
22