Nature of the Sample: NPR/PBS NewsHour/Marist Poll of...
36
How the Survey was Conducted Nature of the Sample: NPR/PBS NewsHour/Marist Poll of 1,023 National Adults This survey of 1,023 adults was conducted January 10 th through January 13 th , 2019 by The Marist Poll sponsored in partnership with NPR and PBS NewsHour. Adults 18 years of age and older residing in the contiguous United States were contacted on landline or mobile numbers and interviewed in English by telephone using live interviewers. Mobile telephone numbers were randomly selected based upon a list of telephone exchanges from throughout the nation from Survey Sampling International. The exchanges were selected to ensure that each region was represented in proportion to its population. Mobile phones are treated as individual devices. After validation of age, personal ownership, and non-business-use of the mobile phone, interviews are typically conducted with the person answering the phone. To increase coverage, this mobile sample was supplemented by respondents reached through random dialing of landline phone numbers from Survey Sampling International. Within each landline household, a single respondent is selected through a random selection process to increase the representativeness of traditionally under-covered survey populations. Assistance was provided by Luce Research for data collection. The samples were then combined and balanced to reflect the 2017 American Community Survey 1-year estimates for age, gender, income, race, and region. Results are statistically significant within ±3.8 percentage points. There are 873 registered voters. The results for this subset are statistically significant within ±4.2 percentage points. There are 324 Republicans and Republican leaning independents and 417 Democrats and Democratic leaning independents. The results for these subsets are statistically significant within ±6.8 percentage points and ±6.0 percentage points, respectively. The error margin was adjusted for sample weights and increases for cross-tabulations.
Transcript of Nature of the Sample: NPR/PBS NewsHour/Marist Poll of...

How the Survey was Conducted
Nature of the Sample: NPR/PBS NewsHour/Marist Poll of 1,023 National Adults This survey of 1,023 adults was conducted January 10th through January 13th, 2019 by The Marist Poll sponsored in partnership with NPR and PBS NewsHour. Adults 18 years of age and older residing in the contiguous United States were contacted on landline or mobile numbers and interviewed in English by telephone using live interviewers. Mobile telephone numbers were randomly selected based upon a list of telephone exchanges from throughout the nation from Survey Sampling International. The exchanges were selected to ensure that each region was represented in proportion to its population. Mobile phones are treated as individual devices. After validation of age, personal ownership, and non-business-use of the mobile phone, interviews are typically conducted with the person answering the phone. To increase coverage, this mobile sample was supplemented by respondents reached through random dialing of landline phone numbers from Survey Sampling International. Within each landline household, a single respondent is selected through a random selection process to increase the representativeness of traditionally under-covered survey populations. Assistance was provided by Luce Research for data collection. The samples were then combined and balanced to reflect the 2017 American Community Survey 1-year estimates for age, gender, income, race, and region. Results are statistically significant within ±3.8 percentage points. There are 873 registered voters. The results for this subset are statistically significant within ±4.2 percentage points. There are 324 Republicans and Republican leaning independents and 417 Democrats and Democratic leaning independents. The results for these subsets are statistically significant within ±6.8 percentage points and ±6.0 percentage points, respectively. The error margin was adjusted for sample weights and increases for cross-tabulations.

National AdultsNational Registered
Voters
Republicans and Republican leaning
independents
Democrats and Democratic leaning
independentsColumn % Column % Column % Column %
100% 100%85% 100%
Party Identification Democrat n/a 34% n/a 69%Republican n/a 25% 66% n/a
Independent n/a 39% 34% 31%Other n/a 2% n/a n/a
Party Identification Strong Democrats n/a 21% n/a 44%Not strong Democrats n/a 12% n/a 25%
Democratic leaning independents n/a 15% n/a 32%Just Independents n/a 11% n/a n/a
Republican leaning independents n/a 13% 34% n/aNot strong Republicans n/a 10% 25% n/a
Strong Republicans n/a 16% 41% n/aOther n/a 2% n/a n/a
Party ID and Gender Democrat men n/a 13% n/a 26%Democrat women n/a 21% n/a 42%
Republican men n/a 13% 33% n/aRepublican women n/a 13% 33% n/a
Independent men n/a 21% 21% 15%Independent women n/a 18% 12% 16%
Other party men and women n/a 2% n/a n/aGender Men 49% 48% 54% 41%
Women 51% 52% 46% 59%Age Under 45 46% 42% 36% 45%
45 or older 54% 58% 64% 55%Age 18 to 29 21% 18% 14% 21%
30 to 44 25% 24% 22% 24%45 to 59 25% 27% 35% 22%
60 or older 28% 31% 29% 32%Race White 61% 63% 76% 56%
African American 11% 12% 2% 21%Latino 15% 14% 12% 15%Other 12% 11% 10% 9%
Region Northeast 18% 19% 12% 24%Midwest 21% 20% 18% 21%
South 38% 39% 48% 35%West 23% 23% 22% 20%
Household Income Less than $50,000 43% 39% 35% 41%$50,000 or more 57% 61% 65% 59%
Education Not college graduate 55% 51% 51% 52%College graduate 45% 49% 49% 48%
Education by Race White - Not College Graduate 31% 30% 41% 24%White - College Graduate 30% 33% 35% 34%
Non-White - Not College Graduate 25% 21% 10% 28%Non-White - College Graduate 14% 15% 15% 14%
Education - Race - Gender Men - White - Not College Graduate 14% 13% 18% 10%Men - White - College Graduate 13% 14% 18% 11%
Men - Non-White - Not College Graduate 13% 11% 9% 12%Men - Non-White - College Graduate 8% 9% 9% 8%
Women - White - Not College Graduate 16% 17% 22% 14%Women - White - College Graduate 17% 19% 17% 22%
Women - Non-White - Not College Graduate 12% 10% 1% 17%Women - Non-White - College Graduate 6% 6% 6% 6%
18% 18% 35% 6%Area Description Big city 26% 24% 18% 28%
Small city 22% 22% 21% 24%Suburban 20% 21% 17% 24%
Small town 20% 19% 25% 14%Rural 13% 13% 19% 9%
BURBNOS Small city/Suburban Men 20% 20% 20% 21%Other area Men 28% 27% 33% 19%
Small city/Suburban Women 21% 23% 17% 28%Other area Women 30% 29% 29% 32%
Interview Type Landline 37% 40% 39% 40%Cell phone 63% 60% 61% 60%
Nature of the Sample
White Evangelical Christians
National Registered Voters
NPR/PBS NewsHour/Marist Poll Adults. Interviews conducted January 10th through January 13th, 2019, n=1023 MOE +/- 3.8 percentage points. National Registered Voters: n=873 MOE +/- 4.2 percentage points. National Republicans and Republican leaning independents: n=324 MOE +/- 6.8 percentage points. National Democrats and Democratic leaning independents: n=417 MOE +/- 6.0 percentage points. Totals may not add to 100% due to rounding.
National Adults
Approve Disapprove UnsureRow % Row % Row %
39% 53% 8%
40% 54% 6%Democrat 6% 89% 5%Republican 83% 10% 7%Independent 37% 57% 6%Strong Democrats 3% 96% 1%Soft Democrats 9% 85% 6%Just Independents 27% 59% 14%Soft Republicans 76% 16% 8%Strong Republicans 90% 5% 6%Democrat men 12% 84% 4%Democrat women 3% 91% 6%Republican men 82% 11% 7%Republican women 83% 9% 8%Independent men 46% 47% 6%Independent women 25% 69% 6%
89% 7% 5%Northeast 29% 66% 6%Midwest 35% 54% 11%South 48% 46% 7%West 35% 55% 10%Less than $50,000 34% 56% 10%$50,000 or more 42% 52% 6%Not college graduate 42% 48% 10%College graduate 36% 59% 5%White 40% 50% 10%African American 11% 87% 2%Latino 50% 46% 4%White - Not College Graduate 46% 41% 13%White - College Graduate 34% 60% 6%Men - White - Not College Graduate 50% 35% 15%
Men - White - College Graduate 44% 49% 7%
Women - White - Not College Graduate
43% 47% 10%
Women - White - College Graduate 26% 69% 5%
18 to 29 30% 56% 14%30 to 44 41% 54% 6%45 to 59 46% 46% 8%60 or older 36% 58% 6%Under 45 36% 55% 10%45 or older 41% 52% 7%Gen Z/Millennials (18-37) 34% 56% 9%Gen X (38-53) 43% 48% 9%Baby Boomers (54-72) 40% 53% 7%Silent-Greatest (Over 72) 37% 57% 6%Men 48% 43% 9%Women 29% 63% 7%
66% 23% 11%Big city 30% 63% 7%Small city 39% 53% 8%Suburban 31% 62% 7%Small town 50% 40% 11%Rural 53% 42% 5%
42% 48% 10%
28% 66% 6%
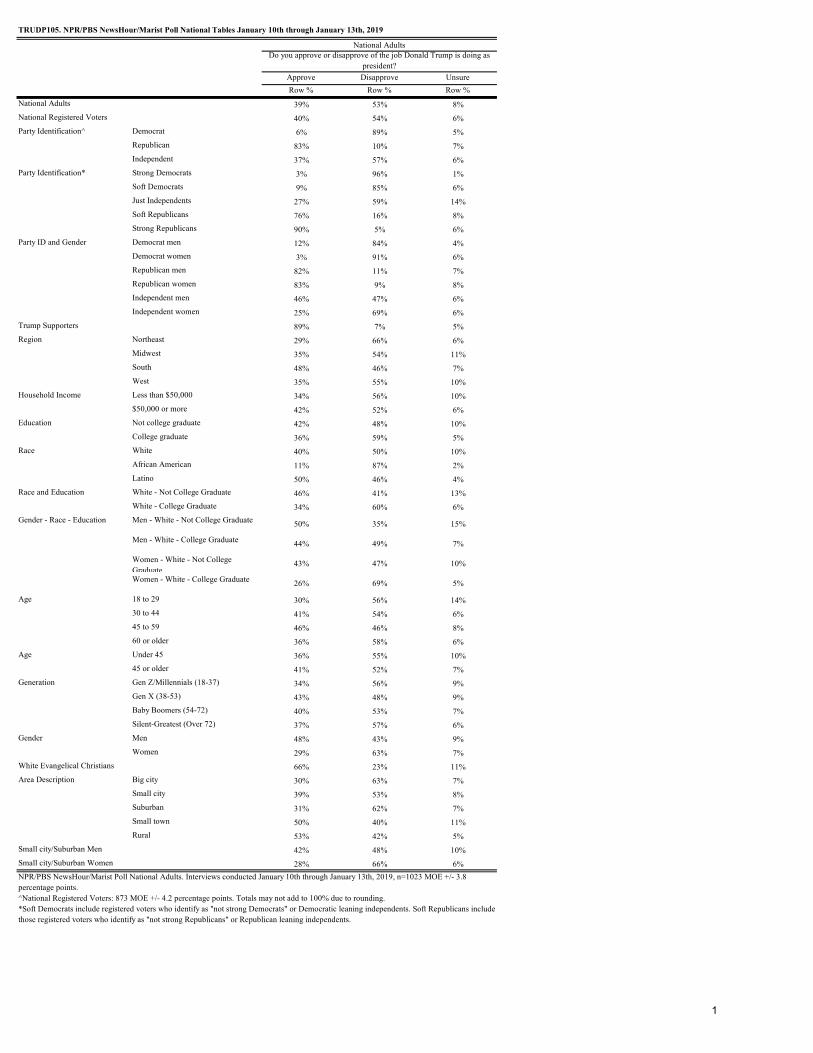
TRUDP105. NPR/PBS NewsHour/Marist Poll National Tables January 10th through January 13th, 2019
National AdultsDo you approve or disapprove of the job Donald Trump is doing as
president?
National Adults
Region
Household Income
Education
Race
Race and Education
National Registered Voters
Party Identification^
Party Identification*
Party ID and Gender
Trump Supporters
White Evangelical Christians
Area Description
Small city/Suburban Men
Small city/Suburban Women
NPR/PBS NewsHour/Marist Poll National Adults. Interviews conducted January 10th through January 13th, 2019, n=1023 MOE +/- 3.8 percentage points.^National Registered Voters: 873 MOE +/- 4.2 percentage points. Totals may not add to 100% due to rounding.*Soft Democrats include registered voters who identify as "not strong Democrats" or Democratic leaning independents. Soft Republicans include those registered voters who identify as "not strong Republicans" or Republican leaning independents.
Gender - Race - Education
Age
Age
Generation
Gender
1

Approve Disapprove UnsureRow % Row % Row %
39% 53% 8%42% 49% 9%41% 51% 8%39% 53% 8%41% 53% 5%42% 49% 9%39% 52% 9%39% 51% 10%38% 54% 8%40% 51% 9%42% 50% 8%38% 54% 9%38% 54% 7%37% 53% 10%37% 56% 7%39% 55% 6%39% 53% 7%37% 55% 8%37% 54% 9%39% 50% 12%35% 51% 14%35% 55% 9%37% 51% 12%39% 48% 13%37% 51% 12%39% 50% 11%
January 2019
February 9, 2018
TRUDP105TRND. Marist Poll National TrendNational Adults
Do you approve or disapprove of the job Donald Trump is doing as president?
February 23, 2018March 8, 2018March 23, 2018April 2018July 2018September 13th, 2018September 26th, 2018October 3rd, 2018October 26th, 2018November 2018December 2018
December 2017January 2018
Marist Poll National Adults
November 21, 2017
September 15, 2017August 17, 2017August 16, 2017June 2017April 2017March 2017
November 14, 2017
September 29, 2017
February 2017
October 2017
2

Strongly approve Approve Disapprove Strongly disapprove UnsureRow % Row % Row % Row % Row %
24% 14% 9% 45% 8%
26% 13% 8% 46% 6%Democrat 3% 4% 6% 82% 5%Republican 62% 21% 4% 6% 7%Independent 24% 13% 13% 44% 6%Strong Democrats 1% 2% 7% 89% 1%Soft Democrats 4% 5% 14% 71% 6%Just Independents 15% 12% 11% 48% 14%Soft Republicans 47% 29% 7% 9% 8%Strong Republicans 79% 11% 2% 3% 6%Democrat men 4% 8% 3% 81% 4%Democrat women 2% 1% 8% 83% 6%Republican men 61% 21% 4% 7% 7%Republican women 62% 21% 4% 5% 8%Independent men 31% 15% 11% 37% 6%Independent women 16% 10% 16% 53% 6%
69% 19% 4% 3% 5%Northeast 17% 12% 13% 53% 6%Midwest 25% 10% 9% 45% 11%South 30% 18% 6% 40% 7%West 21% 14% 9% 46% 10%Less than $50,000 21% 13% 9% 47% 10%$50,000 or more 26% 16% 9% 43% 6%Not college graduate 25% 17% 10% 38% 10%College graduate 24% 12% 7% 52% 5%White 26% 14% 8% 42% 10%African American 3% 7% 7% 80% 2%Latino 29% 22% 4% 41% 4%White - Not College Graduate 31% 15% 8% 34% 13%White - College Graduate 20% 13% 8% 52% 6%Men - White - Not College Graduate 34% 16% 6% 29% 15%
Men - White - College Graduate 24% 20% 7% 42% 7%
Women - White - Not College Graduate
29% 13% 10% 38% 10%
Women - White - College Graduate 17% 8% 8% 60% 5%
18 to 29 14% 16% 11% 45% 14%30 to 44 23% 18% 11% 43% 6%45 to 59 33% 14% 7% 39% 8%60 or older 26% 10% 7% 51% 6%Under 45 18% 17% 11% 44% 10%45 or older 29% 12% 7% 45% 7%Gen Z/Millennials (18-37) 19% 16% 11% 45% 9%Gen X (38-53) 23% 21% 7% 41% 9%Baby Boomers (54-72) 31% 9% 6% 46% 7%Silent-Greatest (Over 72) 27% 10% 8% 49% 6%Men 30% 18% 6% 36% 9%Women 19% 10% 11% 53% 7%
45% 21% 5% 18% 11%Big city 17% 13% 10% 53% 7%Small city 21% 17% 8% 45% 8%Suburban 20% 11% 10% 52% 7%Small town 35% 14% 8% 32% 11%Rural 36% 17% 6% 35% 5%
23% 19% 7% 41% 10%
19% 9% 11% 56% 6%
National Registered Voters
Party Identification^
Party Identification*
Party ID and Gender
Trump Supporters
TRUDP105R. NPR/PBS NewsHour/Marist Poll National Tables January 10th through January 13th, 2019
National AdultsDo you approve or disapprove of the job Donald Trump is doing as president? [And, would you say you strongly
approve/disapprove of the job he is doing or just approve/disapprove?]
National Adults
Gender - Race - Education
Age
Age
Generation
Gender
Region
Household Income
Education
Race
Race and Education
White Evangelical Christians
Area Description
Small city/Suburban Men
Small city/Suburban Women
NPR/PBS NewsHour/Marist Poll National Adults. Interviews conducted January 10th through January 13th, 2019, n=1023 MOE +/- 3.8 percentage points.^National Registered Voters: 873 MOE +/- 4.2 percentage points. Totals may not add to 100% due to rounding.*Soft Democrats include registered voters who identify as "not strong Democrats" or Democratic leaning independents. Soft Republicans include those registered voters who identify as "not strong Republicans" or Republican leaning independents.
3

Strongly Approve Approve Disapprove
Strongly Disapprove Unsure
Row % Row % Row % Row % Row %
24% 14% 9% 45% 8%24% 17% 13% 37% 9%28% 13% 13% 38% 8%24% 15% 14% 39% 8%27% 14% 12% 41% 5%26% 16% 12% 37% 9%24% 14% 11% 42% 9%25% 14% 10% 41% 10%22% 16% 15% 40% 8%22% 17% 13% 38% 9%24% 18% 13% 37% 8%21% 16% 14% 40% 9%24% 14% 11% 44% 7%23% 14% 14% 39% 10%20% 17% 11% 45% 7%20% 19% 17% 38% 6%21% 18% 13% 40% 7%19% 18% 12% 43% 8%18% 19% 13% 41% 9%22% 17% 12% 37% 12%20% 15% 12% 39% 14%20% 16% 13% 42% 9%20% 17% 11% 40% 12%
National Adults
Do you approve or disapprove of the job Donald Trump is doing as president? [And, would you say you strongly approve/disapprove of the job he is doing or
just approve/disapprove?]
February 23, 2018March 8, 2018March 23, 2018April 2018July 2018September 13th, 2018September 26th, 2018October 3rd, 2018October 26th, 2018November 2018December 2018January 2019
June 2017Marist Poll National Adults
October 2017September 29, 2017September 15, 2017August 17, 2017August 16, 2017
February 9, 2018January 2018December 2017November 21, 2017November 14, 2017
TRUDP105RTRND. Marist Poll National Trend
4

Approve Disapprove UnsureRow % Row % Row %
29% 58% 13%Democrat 8% 83% 9%Republican 60% 24% 16%Independent 26% 62% 12%Strong Democrats 9% 88% 3%Soft Democrats 6% 83% 10%Just Independents 21% 61% 18%Soft Republicans 55% 26% 18%Strong Republicans 62% 26% 12%Democrat men 11% 83% 7%Democrat women 7% 83% 10%Republican men 59% 26% 15%Republican women 61% 22% 17%Independent men 28% 61% 11%Independent women 23% 64% 13%
58% 27% 15%Northeast 22% 71% 8%Midwest 31% 57% 11%South 33% 53% 14%West 26% 58% 16%Less than $50,000 27% 56% 17%$50,000 or more 31% 60% 9%Not college graduate 29% 53% 18%College graduate 29% 63% 8%White 29% 59% 12%African American 12% 81% 7%Latino 36% 50% 14%White - Not College Graduate 32% 48% 20%White - College Graduate 27% 68% 5%Men - White - Not College Graduate 36% 47% 16%
Men - White - College Graduate 30% 67% 3%
Women - White - Not College Graduate
29% 49% 23%
Women - White - College Graduate 24% 69% 7%
18 to 29 31% 59% 10%30 to 44 26% 56% 18%45 to 59 33% 56% 12%60 or older 27% 63% 10%Under 45 28% 57% 15%45 or older 30% 59% 11%Gen Z/Millennials (18-37) 26% 59% 15%Gen X (38-53) 33% 56% 11%Baby Boomers (54-72) 28% 60% 11%Silent-Greatest (Over 72) 26% 60% 14%Men 32% 57% 11%Women 26% 60% 14%
47% 37% 16%Big city 23% 66% 11%Small city 32% 51% 17%Suburban 21% 68% 11%Small town 37% 49% 14%Rural 36% 54% 10%
28% 58% 14%
26% 61% 14%
REPS105. NPR/PBS NewsHour/Marist Poll National Tables January 10th through January 13th, 2019
National Registered VotersDo you approve or disapprove of the job the Republicans in Congress
are doing in office?
National Registered Voters
Household Income
Education
Race
Race and Education
Gender - Race - Education
Party Identification
Party Identification*
Party ID and Gender
Trump Supporters
Region
Area Description
Small city/Suburban Men
Small city/Suburban Women
NPR/PBS NewsHour/Marist Poll National Registered Voters. Interviews conducted January 10th through January 13th, 2019, 873 MOE +/- 4.2 percentage points. Totals may not add to 100% due to rounding.*Soft Democrats include registered voters who identify as "not strong Democrats" or Democratic leaning independents. Soft Republicans include those registered voters who identify as "not strong Republicans" or Republican leaning independents.
Age
Age
Generation
Gender
White Evangelical Christians
5

Approve Disapprove UnsureRow % Row % Row %
January 2019 29% 58% 13%July 2018 23% 65% 11%January 2018 28% 61% 11%December 2017 25% 68% 7%November 2017 23% 68% 9%June 2017 28% 61% 10%March 2017 27% 62% 11%February 2017 32% 57% 11%July 2016 20% 72% 8%April 2016 21% 73% 7%November 2015 23% 70% 7%August 2015 19% 68% 13%March 2015 33% 61% 6%December 2014 28% 66% 6%October 2014 24% 71% 5%August 2014 22% 68% 10%April 2014 26% 69% 5%February 2014 22% 72% 6%December 2013 22% 74% 4%July 2013 22% 66% 12%April 2013 24% 71% 6%March 2013 26% 68% 7%December 2012 26% 67% 7%March 2012 31% 62% 8%November 2011 23% 70% 7%September 2011 26% 67% 8%August 2011 27% 62% 11%June 2011 27% 63% 10%April 2011 30% 63% 7%Marist Poll National Registered Voters
National Registered VotersDo you approve or disapprove of the job the Republicans in Congress are doing in office?
REPS105TRND. Marist Poll National Trend
6

Approve Disapprove UnsureRow % Row % Row %
34% 53% 14%Democrat 63% 24% 13%Republican 8% 83% 9%Independent 27% 58% 15%Strong Democrats 73% 16% 10%Soft Democrats 52% 34% 14%Just Independents 13% 61% 25%Soft Republicans 9% 78% 13%Strong Republicans 2% 95% 4%Democrat men 63% 25% 12%Democrat women 63% 23% 13%Republican men 6% 79% 14%Republican women 10% 86% 3%Independent men 19% 69% 12%Independent women 36% 45% 19%
6% 86% 9%Northeast 45% 46% 9%Midwest 30% 51% 18%South 30% 58% 12%West 32% 51% 16%Less than $50,000 37% 46% 17%$50,000 or more 31% 58% 11%Not college graduate 33% 52% 16%College graduate 34% 54% 12%White 32% 58% 11%African American 58% 27% 15%Latino 25% 53% 21%White - Not College Graduate 25% 61% 14%White - College Graduate 38% 55% 7%Men - White - Not College Graduate 19% 66% 15%
Men - White - College Graduate 33% 64% 3%
Women - White - Not College Graduate
30% 57% 13%
Women - White - College Graduate 43% 47% 10%
18 to 29 39% 40% 21%30 to 44 33% 52% 15%45 to 59 26% 65% 10%60 or older 38% 51% 11%Under 45 35% 47% 18%45 or older 32% 57% 10%Gen Z/Millennials (18-37) 36% 49% 16%Gen X (38-53) 31% 58% 11%Baby Boomers (54-72) 32% 57% 11%Silent-Greatest (Over 72) 40% 49% 11%Men 27% 60% 13%Women 40% 46% 14%
16% 73% 11%Big city 44% 44% 12%Small city 30% 50% 19%Suburban 37% 49% 15%Small town 26% 62% 12%Rural 24% 67% 9%
30% 52% 17%
36% 47% 17%
DEMS105. NPR/PBS NewsHour/Marist Poll National Tables January 10th through January 13th, 2019
Party Identification*
Party ID and Gender
Trump Supporters
Region
Household Income
National Registered VotersDo you approve or disapprove of the job the Democrats in Congress
are doing in office?
National Registered Voters
Party Identification
Age
Generation
Gender
White Evangelical Christians
Area Description
Education
Race
Race and Education
Gender - Race - Education
Age
Small city/Suburban Men
Small city/Suburban Women
NPR/PBS NewsHour/Marist Poll National Registered Voters. Interviews conducted January 10th through January 13th, 2019, 873 MOE +/- 4.2 percentage points. Totals may not add to 100% due to rounding.*Soft Democrats include registered voters who identify as "not strong Democrats" or Democratic leaning independents. Soft Republicans include those registered voters who identify as "not strong Republicans" or Republican leaning independents.
7

Approve Disapprove UnsureRow % Row % Row %
January 2019 34% 53% 14%July 2018 23% 63% 14%January 2018 28% 57% 14%December 2017 32% 59% 9%November 2017 33% 59% 7%June 2017 30% 57% 13%March 2017 35% 54% 11%February 2017 34% 55% 11%July 2016 37% 55% 9%April 2016 36% 59% 6%November 2015 38% 55% 7%August 2015 28% 60% 12%March 2015 30% 64% 6%December 2014 27% 65% 9%October 2014 33% 61% 6%August 2014 32% 59% 9%April 2014 32% 63% 5%February 2014 33% 60% 7%December 2013 33% 64% 3%July 2013 33% 57% 10%April 2013 32% 62% 6%March 2013 31% 62% 7%December 2012 35% 58% 7%March 2012 34% 59% 7%November 2011 28% 65% 7%September 2011 30% 63% 7%August 2011 35% 55% 11%June 2011 30% 60% 10%April 2011 34% 60% 6%
Marist Poll National Registered Voters
National Registered VotersDo you approve or disapprove of the job the Democrats in Congress are doing in office?
DEMS105TRND. Marist Poll National Trend
8

Too much Too littleAbout the right
amount UnsureRow % Row % Row % Row %
8% 57% 26% 9%
8% 60% 26% 6%Democrat 6% 86% 5% 3%Republican 9% 25% 57% 9%Independent 8% 62% 24% 6%Strong Democrats 5% 89% 4% 2%Soft Democrats 7% 84% 6% 4%Just Independents 6% 60% 22% 12%Soft Republicans 9% 37% 44% 10%Strong Republicans 11% 16% 69% 4%Democrat men 8% 82% 7% 3%Democrat women 6% 87% 4% 3%Republican men 9% 34% 47% 10%Republican women 9% 17% 67% 8%Independent men 9% 58% 29% 4%Independent women 7% 67% 18% 9%
11% 19% 60% 9%Northeast 8% 65% 18% 9%Midwest 7% 55% 27% 12%South 9% 52% 33% 7%West 7% 61% 22% 10%Less than $50,000 9% 55% 22% 14%$50,000 or more 6% 60% 28% 5%Not college graduate 9% 53% 26% 12%College graduate 6% 62% 27% 5%White 7% 56% 29% 8%African American 7% 82% 4% 7%Latino 10% 50% 32% 8%White - Not College Graduate 8% 49% 32% 11%White - College Graduate 5% 64% 26% 4%Men - White - Not College Graduate 8% 51% 26% 14%
Men - White - College Graduate 5% 59% 32% 3%
Women - White - Not College Graduate
8% 47% 37% 8%
Women - White - College Graduate 5% 68% 21% 5%
18 to 29 8% 57% 19% 15%30 to 44 5% 60% 27% 8%45 to 59 10% 53% 33% 5%60 or older 8% 59% 25% 8%Under 45 6% 59% 23% 11%45 or older 9% 56% 28% 7%Gen Z/Millennials (18-37) 7% 59% 24% 11%Gen X (38-53) 9% 62% 24% 5%Baby Boomers (54-72) 7% 55% 32% 6%Silent-Greatest (Over 72) 10% 53% 26% 11%Men 8% 54% 29% 9%Women 7% 60% 23% 9%
12% 36% 46% 6%Big city 11% 62% 21% 7%Small city 6% 60% 24% 10%Suburban 6% 64% 22% 9%Small town 7% 46% 36% 12%Rural 11% 51% 34% 4%
6% 59% 26% 10%
6% 65% 20% 9%
National Adults
National Registered Voters
Party Identification^
Party Identification*
Party ID and Gender
DTWRKDEM1. NPR/PBS NewsHour/Marist Poll National Tables January 10th through January 13th, 2019
National Adults
Do you think the Trump administration is doing too much, too little, or about the right amount to work with Democrats in Congress?
Race and Education
Gender - Race - Education
Age
Age
Generation
Trump Supporters
Region
Household Income
Education
Race
NPR/PBS NewsHour/Marist Poll National Adults. Interviews conducted January 10th through January 13th, 2019, n=1023 MOE +/- 3.8 percentage points.^National Registered Voters: 873 MOE +/- 4.2 percentage points. Totals may not add to 100% due to rounding.*Soft Democrats include registered voters who identify as "not strong Democrats" or Democratic leaning independents. Soft Republicans include those registered voterswho identify as "not strong Republicans" or Republican leaning independents.
Gender
White Evangelical Christians
Area Description
Small city/Suburban Men
Small city/Suburban Women
9
Too much Too littleAbout the right
amount UnsureRow % Row % Row % Row %
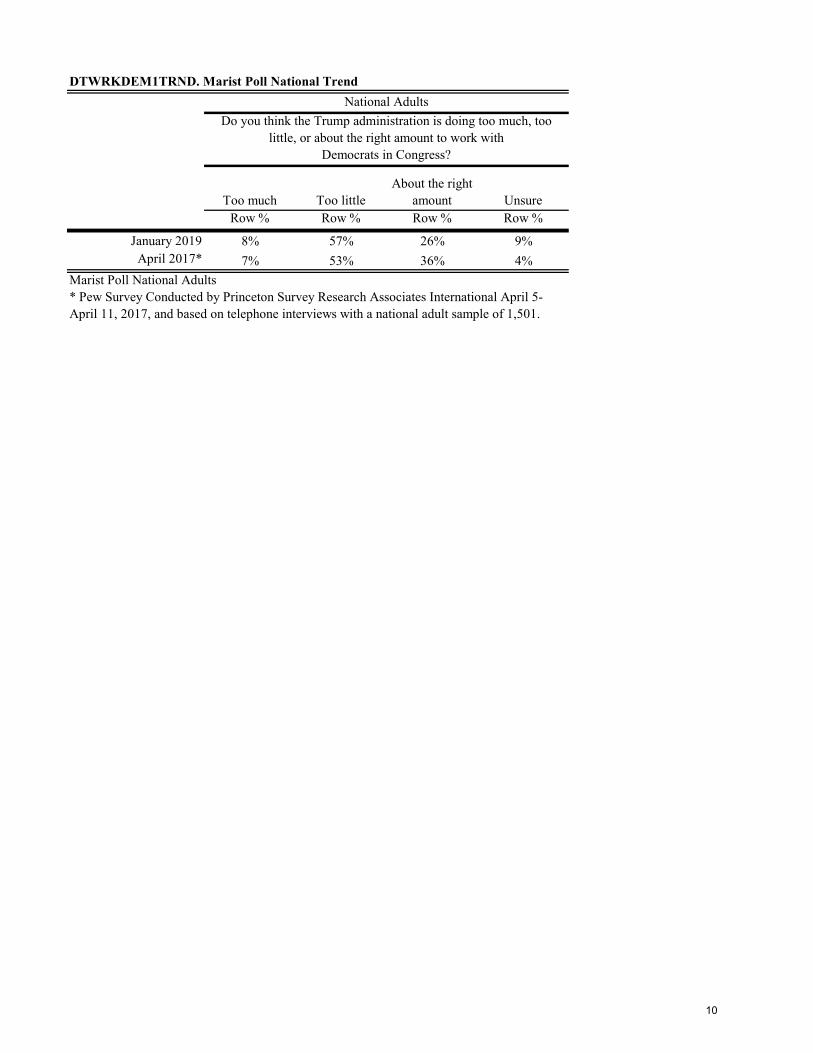
January 2019 8% 57% 26% 9%April 2017* 7% 53% 36% 4%
National AdultsDo you think the Trump administration is doing too much, too
little, or about the right amount to work with Democrats in Congress?
Marist Poll National Adults* Pew Survey Conducted by Princeton Survey Research Associates International April 5-April 11, 2017, and based on telephone interviews with a national adult sample of 1,501.
DTWRKDEM1TRND. Marist Poll National Trend
10

Too much Too littleAbout the right
amount UnsureRow % Row % Row % Row %
5% 55% 28% 11%
5% 58% 29% 8%Democrat 6% 35% 50% 8%Republican 3% 84% 6% 7%Independent 5% 61% 27% 8%Strong Democrats 9% 29% 56% 5%Soft Democrats 6% 38% 45% 11%Just Independents 5% 60% 20% 15%Soft Republicans 1% 84% 7% 8%Strong Republicans 4% 91% 4% 1%Democrat men 8% 38% 49% 5%Democrat women 6% 33% 51% 11%Republican men 4% 80% 9% 8%Republican women 2% 88% 3% 6%Independent men 4% 64% 26% 6%Independent women 6% 56% 28% 10%
3% 87% 7% 3%Northeast 5% 54% 30% 11%Midwest 5% 54% 25% 16%South 5% 60% 28% 8%West 6% 51% 29% 14%Less than $50,000 6% 49% 28% 18%$50,000 or more 6% 59% 28% 7%Not college graduate 6% 54% 25% 15%College graduate 4% 57% 33% 6%White 4% 57% 28% 11%African American 7% 40% 39% 14%Latino 8% 63% 17% 12%White - Not College Graduate 4% 57% 24% 14%White - College Graduate 4% 56% 33% 7%Men - White - Not College Graduate 5% 54% 24% 17%
Men - White - College Graduate 5% 61% 32% 2%
Women - White - Not College Graduate
4% 61% 24% 12%
Women - White - College Graduate 3% 52% 34% 11%
18 to 29 4% 49% 30% 18%30 to 44 6% 53% 29% 12%45 to 59 7% 67% 20% 7%60 or older 4% 52% 34% 10%Under 45 5% 51% 29% 15%45 or older 5% 59% 27% 8%Gen Z/Millennials (18-37) 4% 50% 30% 15%Gen X (38-53) 6% 62% 24% 8%Baby Boomers (54-72) 6% 59% 27% 7%Silent-Greatest (Over 72) 4% 50% 33% 12%Men 5% 60% 26% 9%Women 5% 51% 30% 14%
2% 76% 14% 7%Big city 10% 49% 31% 10%Small city 2% 63% 22% 13%Suburban 4% 52% 34% 10%Small town 3% 55% 28% 15%Rural 6% 63% 26% 5%
5% 60% 24% 11%
1% 55% 31% 13%
DEMWRKDT1. NPR/PBS NewsHour/Marist Poll National Tables January 10th through January 13th, 2019
National AdultsDo you think Democrats in Congress are doing too much, too little, or about the right amount
to work with the Trump administration?
Trump Supporters
Region
Household Income
Education
Race
National Adults
National Registered Voters
Party Identification^
Party Identification*
Party ID and Gender
Gender
White Evangelical Christians
Area Description
Small city/Suburban Men
Small city/Suburban Women
Race and Education
Gender - Race - Education
Age
Age
Generation
NPR/PBS NewsHour/Marist Poll National Adults. Interviews conducted January 10th through January 13th, 2019, n=1023 MOE +/- 3.8 percentage points.^National Registered Voters: 873 MOE +/- 4.2 percentage points. Totals may not add to 100% due to rounding.*Soft Democrats include registered voters who identify as "not strong Democrats" or Democratic leaning independents. Soft Republicans include those registered voters who identify as "not strong Republicans" or Republican leaning independents.
11

Too much Too littleAbout the right
amount UnsureRow % Row % Row % Row %
January 2019 5% 55% 28% 11%April 2017* 5% 57% 34% 5%
National AdultsDo you think Democrats in Congress are doing too much, too
little, or about the right amount to work with the Trump Administration?
Marist Poll National Adults* Pew Survey Conducted by Princeton Survey Research Associates International April 5-April 11, 2017, and based on telephone interviews with a national adult sample of 1,501.
DEMWRKDT1TRND. Marist Poll National Trend
12
I like elected officials who make
compromises with people they disagree
with
I like elected officials who stick to their
positions UnsureRow % Row % Row %
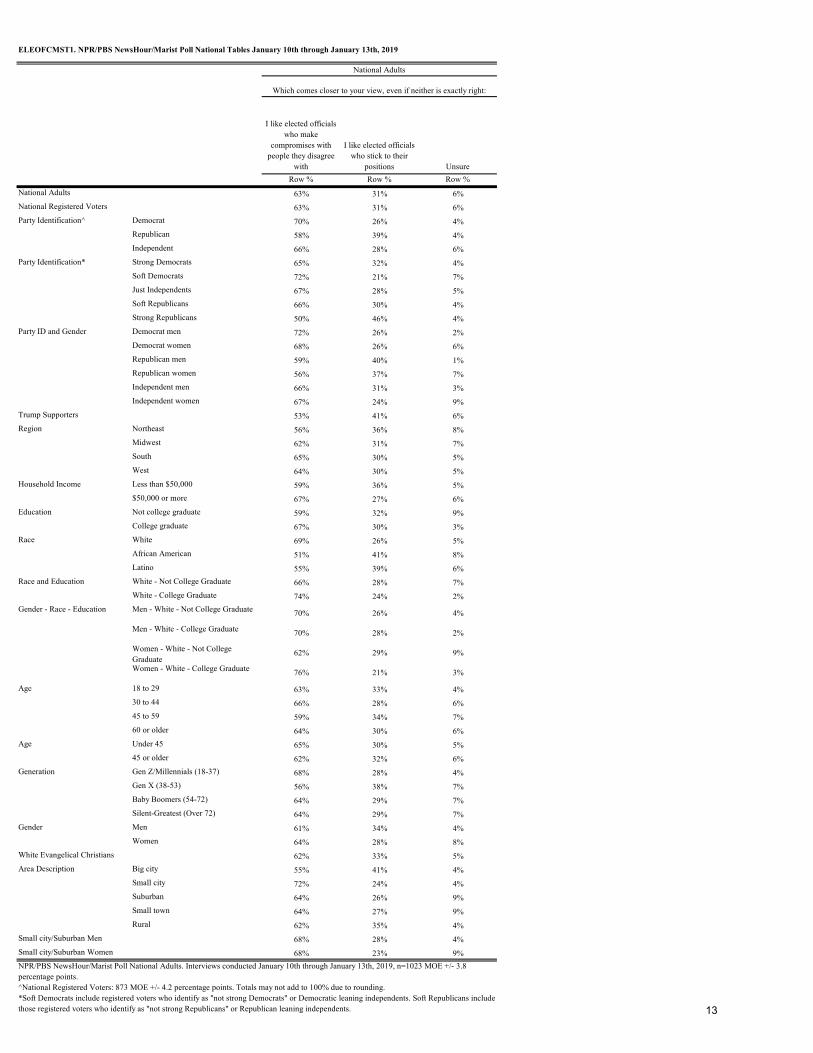
63% 31% 6%
63% 31% 6%Democrat 70% 26% 4%Republican 58% 39% 4%Independent 66% 28% 6%Strong Democrats 65% 32% 4%Soft Democrats 72% 21% 7%Just Independents 67% 28% 5%Soft Republicans 66% 30% 4%Strong Republicans 50% 46% 4%Democrat men 72% 26% 2%Democrat women 68% 26% 6%Republican men 59% 40% 1%Republican women 56% 37% 7%Independent men 66% 31% 3%Independent women 67% 24% 9%
53% 41% 6%Northeast 56% 36% 8%Midwest 62% 31% 7%South 65% 30% 5%West 64% 30% 5%Less than $50,000 59% 36% 5%$50,000 or more 67% 27% 6%Not college graduate 59% 32% 9%College graduate 67% 30% 3%White 69% 26% 5%African American 51% 41% 8%Latino 55% 39% 6%White - Not College Graduate 66% 28% 7%White - College Graduate 74% 24% 2%Men - White - Not College Graduate 70% 26% 4%
Men - White - College Graduate 70% 28% 2%
Women - White - Not College Graduate
62% 29% 9%
Women - White - College Graduate 76% 21% 3%
18 to 29 63% 33% 4%30 to 44 66% 28% 6%45 to 59 59% 34% 7%60 or older 64% 30% 6%Under 45 65% 30% 5%45 or older 62% 32% 6%Gen Z/Millennials (18-37) 68% 28% 4%Gen X (38-53) 56% 38% 7%Baby Boomers (54-72) 64% 29% 7%Silent-Greatest (Over 72) 64% 29% 7%Men 61% 34% 4%Women 64% 28% 8%
62% 33% 5%Big city 55% 41% 4%Small city 72% 24% 4%Suburban 64% 26% 9%Small town 64% 27% 9%Rural 62% 35% 4%
68% 28% 4%
68% 23% 9%
National Adults
National Registered Voters
Party Identification^
Party Identification*
Party ID and Gender
ELEOFCMST1. NPR/PBS NewsHour/Marist Poll National Tables January 10th through January 13th, 2019
National Adults
Which comes closer to your view, even if neither is exactly right:
Race and Education
Gender - Race - Education
Age
Age
Generation
Trump Supporters
Region
Household Income
Education
Race
NPR/PBS NewsHour/Marist Poll National Adults. Interviews conducted January 10th through January 13th, 2019, n=1023 MOE +/- 3.8 percentage points.^National Registered Voters: 873 MOE +/- 4.2 percentage points. Totals may not add to 100% due to rounding.*Soft Democrats include registered voters who identify as "not strong Democrats" or Democratic leaning independents. Soft Republicans include those registered voters who identify as "not strong Republicans" or Republican leaning independents.
Gender
White Evangelical Christians
Area Description
Small city/Suburban Men
Small city/Suburban Women
13

I like elected officials who make compromises with people they
disagree withI like elected officials who stick
to their positions UnsureRow % Row % Row %
January 2019 63% 31% 6%April 2017* 58% 39% 4%
National AdultsWhich comes closer to your view, even if neither
is exactly right:
Marist Poll National Adults* Pew Survey Conducted by Princeton Survey Research Associates International April 5-April 11, 2017, and based on telephone interviews with a national adult sample of 1,501.
ELEOFCMST1TRND. Marist Poll National Trend
14

Republicans in Congress have an
obligation to support Donald Trump's
policies and programs because he is a
Republican president
Republicans in Congress do not have
an obligation to support Donald
Trump's policies and programs if they
disagree with him UnsureRow % Row % Row %
45% 49% 5%Republican 46% 48% 6%Independent 44% 53% 3%Strong Republicans 56% 38% 5%Soft Republicans 38% 57% 5%
53% 42% 6%Less than $50,000 53% 43% 4%$50,000 or more 44% 52% 4%Not college graduate 46% 48% 6%College graduate 45% 51% 3%White 43% 51% 6%Non-white 56% 41% 3%White - Not College Graduate 46% 46% 8%White - College Graduate 40% 57% 3%Under 45 41% 58% 1%45 or older 48% 45% 7%Gen Z/Millennials (18-37) 39% 60% 2%Gen X (38-53) 44% 56% 0%Baby Boomers (54-72) 47% 43% 10%Silent-Greatest (Over 72) 56% 38% 6%Men 48% 49% 3%Women 42% 50% 8%
54% 42% 4%
REPSUDT1. NPR/PBS NewsHour/Marist Poll National Tables January 10th through January 13th, 2019
Republicans and Republican leaning independents
Which comes closer to your view, even if neither is exactly right:
Education
Race
Race and Education
Age
Generation
Republicans and Republican leaning independents
Party Identification
Party Identification
Trump Supporters
Household Income
Gender
White Evangelical Christians
NPR/PBS NewsHour/Marist Poll National Republicans and Republican leaning Independents. Interviews conducted January 10th through January 13th, 2019, n=324 MOE +/- 6.8 percentage points. Totals may not add to 100% due to rounding.*Soft Republicans include those registered voters who identify as "not strong Republicans" or Republican leaning independents.
15

Republicans in Congress have an obligation to support Donald Trump's policies and programs because he is a
Republican president
Republicans in Congress do not have an obligation to support Donald
Trump's policies and programs if they disagree with him Unsure
Row % Row % Row %
January 2019 45% 49% 5%April 2017* 43% 55% 2%
Republicans and Republican Leaning IndependentsWhich comes closer to your view, even if neither is exactly right:
Marist Poll National Republicans and Republican Leaning Independents*Pew Survey Conducted by Princeton Survey Research Associates International April 5-April 11, 2017, and based on telephone interviews with Republicans and Republican Leaning Independents sample of 630, MoE=4.5%.
REPSUDT1TRND. Marist Poll National Trend
16
Definitely vote for President Trump
Definitely vote against him Unsure
Row % Row % Row %
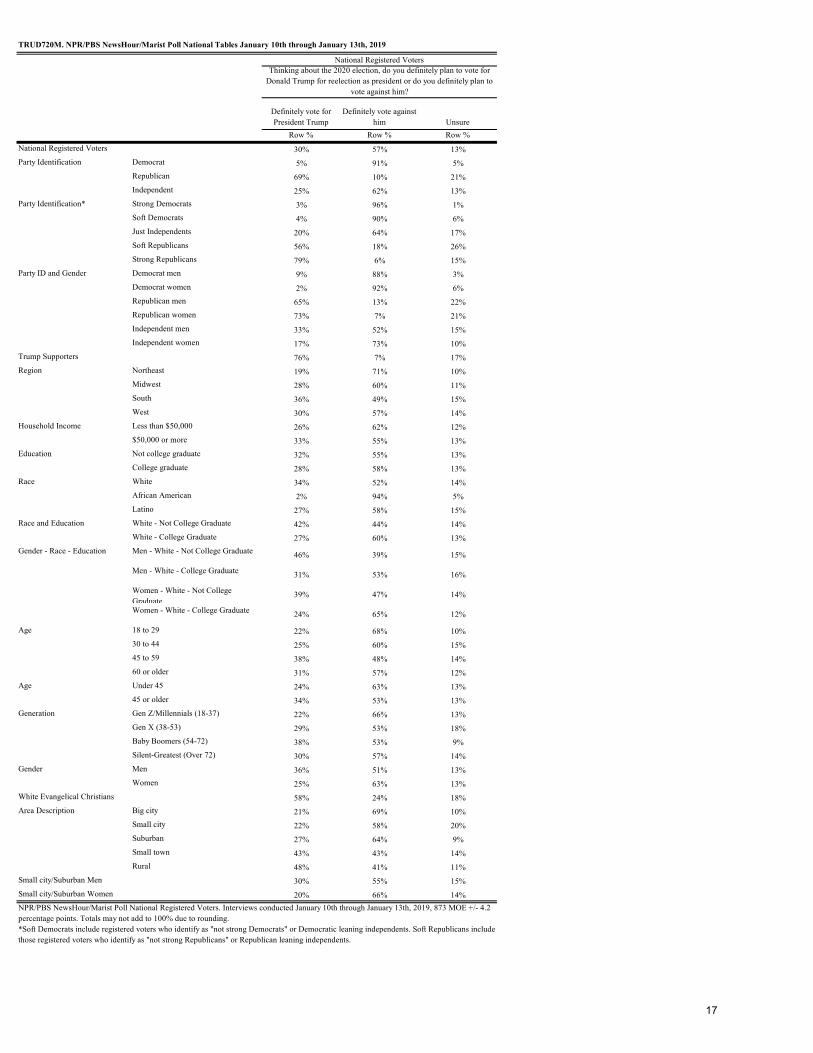
30% 57% 13%Democrat 5% 91% 5%Republican 69% 10% 21%Independent 25% 62% 13%Strong Democrats 3% 96% 1%Soft Democrats 4% 90% 6%Just Independents 20% 64% 17%Soft Republicans 56% 18% 26%Strong Republicans 79% 6% 15%Democrat men 9% 88% 3%Democrat women 2% 92% 6%Republican men 65% 13% 22%Republican women 73% 7% 21%Independent men 33% 52% 15%Independent women 17% 73% 10%
76% 7% 17%Northeast 19% 71% 10%Midwest 28% 60% 11%South 36% 49% 15%West 30% 57% 14%Less than $50,000 26% 62% 12%$50,000 or more 33% 55% 13%Not college graduate 32% 55% 13%College graduate 28% 58% 13%White 34% 52% 14%African American 2% 94% 5%Latino 27% 58% 15%White - Not College Graduate 42% 44% 14%White - College Graduate 27% 60% 13%Men - White - Not College Graduate 46% 39% 15%
Men - White - College Graduate 31% 53% 16%
Women - White - Not College Graduate
39% 47% 14%
Women - White - College Graduate 24% 65% 12%
18 to 29 22% 68% 10%30 to 44 25% 60% 15%45 to 59 38% 48% 14%60 or older 31% 57% 12%Under 45 24% 63% 13%45 or older 34% 53% 13%Gen Z/Millennials (18-37) 22% 66% 13%Gen X (38-53) 29% 53% 18%Baby Boomers (54-72) 38% 53% 9%Silent-Greatest (Over 72) 30% 57% 14%Men 36% 51% 13%Women 25% 63% 13%
58% 24% 18%Big city 21% 69% 10%Small city 22% 58% 20%Suburban 27% 64% 9%Small town 43% 43% 14%Rural 48% 41% 11%
30% 55% 15%
20% 66% 14%
National Registered Voters
Party Identification
Party Identification*
Party ID and Gender
Trump Supporters
TRUD720M. NPR/PBS NewsHour/Marist Poll National Tables January 10th through January 13th, 2019
National Registered VotersThinking about the 2020 election, do you definitely plan to vote for
Donald Trump for reelection as president or do you definitely plan to vote against him?
Gender - Race - Education
Age
Age
Generation
Gender
Region
Household Income
Education
Race
Race and Education
White Evangelical Christians
Area Description
Small city/Suburban Men
Small city/Suburban Women
NPR/PBS NewsHour/Marist Poll National Registered Voters. Interviews conducted January 10th through January 13th, 2019, 873 MOE +/- 4.2 percentage points. Totals may not add to 100% due to rounding.*Soft Democrats include registered voters who identify as "not strong Democrats" or Democratic leaning independents. Soft Republicans include those registered voters who identify as "not strong Republicans" or Republican leaning independents.
17
Definitely vote for President Trump (Obama) Definitely vote against him Unsure
Row % Row % Row %
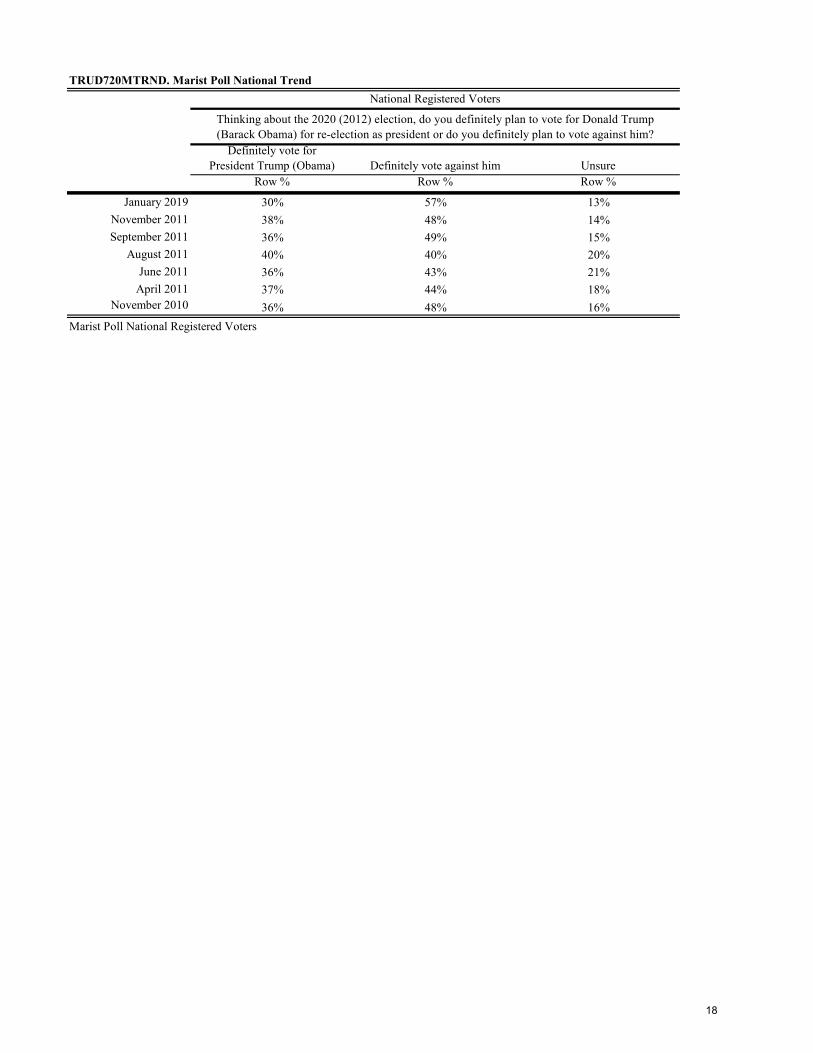
January 2019 30% 57% 13%November 2011 38% 48% 14%September 2011 36% 49% 15%
August 2011 40% 40% 20%June 2011 36% 43% 21%
April 2011 37% 44% 18%November 2010 36% 48% 16%
National Registered Voters
Thinking about the 2020 (2012) election, do you definitely plan to vote for Donald Trump (Barack Obama) for re-election as president or do you definitely plan to vote against him?
Marist Poll National Registered Voters
TRUD720MTRND. Marist Poll National Trend
18

Favorable Unfavorable Unsure/Never heard ofRow % Row % Row %
76% 12% 12%57% 28% 15%53% 17% 30%40% 10% 49%39% 10% 52%36% 10% 54%27% 27% 46%22% 14% 65%21% 8% 71%20% 7% 72%
Marist Poll Democrats and Democratic leaning IndependentsJulián Castro
Joe BidenBernie Sanders
Corey BookerElizabeth Warren
Kamala Harris
Kirsten GillibrandMichael Bloomberg
Amy Klobuchar
DEMFAV1. Marist Poll National TablesDemocrats and Democratic leaning Independents
There are many Democratic candidates who are thinking about running for the Democratic nomination for President. Please tell me if you have a
favorable or an unfavorable impression of each one.
Beto O'Rourke
19

Favorable Unfavorable Unsure-Never HeardRow % Row % Row %
76% 12% 12%Democrat 75% 10% 15%Independent 77% 16% 7%Strong Democrats 82% 9% 9%Soft Democrats 71% 14% 15%Democrat men 81% 10% 10%Democrat women 72% 11% 18%Northeast 78% 9% 13%Midwest 67% 22% 11%South 73% 13% 14%West 87% 3% 10%Less than $50,000 69% 16% 15%$50,000 or more 81% 8% 11%Not college graduate 71% 12% 17%College graduate 84% 10% 6%White 78% 15% 7%African American 70% 11% 19%Other 77% 6% 18%White - Not College Graduate 71% 17% 12%White - College Graduate 83% 13% 4%18 to 29 78% 8% 14%30 to 44 74% 13% 13%45 to 59 69% 14% 16%60 or older 80% 12% 8%Under 45 76% 11% 14%45 or older 75% 13% 11%Gen Z/Millennials (18-37) 76% 11% 13%Gen X (38-53) 75% 13% 12%Baby Boomers (54-72) 73% 14% 13%Silent-Greatest (Over 72) 79% 11% 10%Men 77% 12% 11%Women 75% 12% 13%Big city 83% 9% 7%Small city 75% 10% 15%Suburban 84% 13% 2%Small town/Rural 65% 11% 23%
78% 12% 9%
81% 12% 8%
BIDJ020R. NPR/PBS NewsHour/Marist Poll National Tables January 10th through January 13th, 2019
Democrats and Democratic leaning independentsOverall, do you have a favorable or an unfavorable impression of Joe
Biden?
Household Income
Education
Race
Race and Education
Age
Democrats and Democratic leaning independents
Party Identification
Party Identification*
Party ID and Gender
Region
Small city/Suburban Women
NPR/PBS NewsHour/Marist Poll National Democrats and Democratic leaning Independents. Interviews conducted January 10th through January 13th, 2019, n=417 MOE +/- 6.0 percentage points. Totals may not add to 100% due to rounding.*Soft Democrats include registered voters who identify as "not strong Democrats" or Democratic leaning independents.
Age
Generation
Gender
Area Description
Small city/Suburban Men
20

Favorable Unfavorable Unsure-Never HeardRow % Row % Row %
27% 27% 46%Democrat 24% 28% 48%Independent 33% 26% 40%Strong Democrats 25% 29% 47%Soft Democrats 28% 26% 45%Democrat men 27% 33% 40%Democrat women 22% 25% 53%Northeast 39% 31% 30%Midwest 14% 30% 56%South 29% 21% 50%West 23% 32% 46%Less than $50,000 18% 29% 53%$50,000 or more 33% 27% 40%Not college graduate 24% 26% 50%College graduate 30% 30% 40%White 34% 26% 40%African American 15% 26% 59%Other 21% 32% 47%White - Not College Graduate 30% 21% 49%White - College Graduate 37% 29% 34%18 to 29 18% 34% 48%30 to 44 24% 26% 50%45 to 59 27% 28% 45%60 or older 35% 24% 41%Under 45 22% 29% 49%45 or older 32% 26% 43%Gen Z/Millennials (18-37) 19% 34% 47%Gen X (38-53) 30% 26% 44%Baby Boomers (54-72) 30% 29% 41%Silent-Greatest (Over 72) 37% 17% 46%Men 27% 37% 36%Women 27% 21% 52%Big city 34% 29% 37%Small city 17% 33% 51%Suburban 32% 31% 37%Small town/Rural 24% 19% 57%
24% 44% 32%
25% 23% 53%
BLOM020R. NPR/PBS NewsHour/Marist Poll National Tables January 10th through January 13th, 2019
Democrats and Democratic leaning independentsOverall, do you have a favorable or an unfavorable impression of
Michael Bloomberg?
Household Income
Education
Race
Race and Education
Age
Democrats and Democratic leaning independents
Party Identification
Party Identification*
Party ID and Gender
Region
Small city/Suburban Women
NPR/PBS NewsHour/Marist Poll National Democrats and Democratic leaning Independents. Interviews conducted January 10th through January 13th, 2019, n=417 MOE +/- 6.0 percentage points. Totals may not add to 100% due to rounding.*Soft Democrats include registered voters who identify as "not strong Democrats" or Democratic leaning independents.
Age
Generation
Gender
Area Description
Small city/Suburban Men
21

Favorable Unfavorable Unsure-Never HeardRow % Row % Row %
40% 10% 49%Democrat 38% 10% 52%Independent 46% 10% 44%Strong Democrats 46% 8% 46%Soft Democrats 35% 12% 52%Democrat men 47% 13% 40%Democrat women 32% 9% 59%Northeast 60% 4% 36%Midwest 33% 8% 59%South 32% 10% 57%West 37% 20% 43%Less than $50,000 35% 12% 53%$50,000 or more 42% 10% 47%Not college graduate 34% 11% 55%College graduate 48% 10% 42%White 47% 10% 43%African American 28% 6% 66%Other 37% 14% 49%White - Not College Graduate 35% 10% 56%White - College Graduate 55% 10% 34%18 to 29 41% 5% 54%30 to 44 32% 16% 52%45 to 59 45% 8% 47%60 or older 44% 11% 45%Under 45 36% 11% 53%45 or older 44% 10% 46%Gen Z/Millennials (18-37) 33% 11% 56%Gen X (38-53) 48% 8% 44%Baby Boomers (54-72) 40% 12% 49%Silent-Greatest (Over 72) 44% 12% 44%Men 45% 14% 40%Women 37% 8% 56%Big city 40% 12% 48%Small city 44% 10% 46%Suburban 44% 8% 47%Small town/Rural 34% 11% 55%
49% 12% 38%
40% 7% 53%
BOOC020R. NPR/PBS NewsHour/Marist Poll National Tables January 10th through January 13th, 2019
Democrats and Democratic leaning independentsOverall, do you have a favorable or an unfavorable impression of
Corey Booker?
Household Income
Education
Race
Race and Education
Age
Democrats and Democratic leaning independents
Party Identification
Party Identification*
Party ID and Gender
Region
Small city/Suburban Women
NPR/PBS NewsHour/Marist Poll National Democrats and Democratic leaning Independents. Interviews conducted January 10th through January 13th, 2019, n=417 MOE +/- 6.0 percentage points. Totals may not add to 100% due to rounding.*Soft Democrats include registered voters who identify as "not strong Democrats" or Democratic leaning independents.
Age
Generation
Gender
Area Description
Small city/Suburban Men
22

Favorable Unfavorable Unsure-Never HeardRow % Row % Row %
20% 7% 72%Democrat 20% 9% 71%Independent 22% 5% 73%Strong Democrats 24% 5% 71%Soft Democrats 18% 9% 73%Democrat men 28% 9% 63%Democrat women 15% 8% 77%Northeast 19% 3% 77%Midwest 17% 8% 76%South 23% 8% 69%West 22% 11% 67%Less than $50,000 18% 9% 73%$50,000 or more 23% 6% 71%Not college graduate 16% 9% 75%College graduate 26% 6% 68%White 25% 8% 67%African American 12% 7% 81%Other 18% 6% 76%White - Not College Graduate 22% 8% 70%White - College Graduate 28% 7% 64%18 to 29 14% 2% 84%30 to 44 19% 5% 76%45 to 59 22% 5% 72%60 or older 25% 15% 60%Under 45 17% 4% 80%45 or older 24% 11% 65%Gen Z/Millennials (18-37) 12% 5% 83%Gen X (38-53) 29% 1% 69%Baby Boomers (54-72) 21% 12% 67%Silent-Greatest (Over 72) 29% 15% 55%Men 24% 8% 68%Women 18% 7% 75%Big city 22% 7% 71%Small city 14% 1% 84%Suburban 26% 11% 63%Small town/Rural 22% 10% 68%
24% 8% 68%
17% 5% 78%
CASJ020R. NPR/PBS NewsHour/Marist Poll National Tables January 10th through January 13th, 2019
Democrats and Democratic leaning independentsOverall, do you have a favorable or an unfavorable impression of
Julián Castro?
Household Income
Education
Race
Race and Education
Age
Democrats and Democratic leaning independents
Party Identification
Party Identification*
Party ID and Gender
Region
Small city/Suburban Women
NPR/PBS NewsHour/Marist Poll National Democrats and Democratic leaning Independents. Interviews conducted January 10th through January 13th, 2019, n=417 MOE +/- 6.0 percentage points. Totals may not add to 100% due to rounding.*Soft Democrats include registered voters who identify as "not strong Democrats" or Democratic leaning independents.
Age
Generation
Gender
Area Description
Small city/Suburban Men
23

Favorable Unfavorable Unsure-Never HeardRow % Row % Row %
22% 14% 65%Democrat 20% 13% 66%Independent 24% 16% 60%Strong Democrats 24% 14% 63%Soft Democrats 20% 14% 66%Democrat men 22% 13% 65%Democrat women 19% 13% 67%Northeast 32% 19% 49%Midwest 22% 18% 60%South 16% 9% 75%West 18% 12% 70%Less than $50,000 16% 18% 65%$50,000 or more 25% 11% 64%Not college graduate 15% 15% 71%College graduate 30% 13% 57%White 32% 15% 53%African American 7% 9% 84%Other 9% 16% 75%White - Not College Graduate 21% 16% 64%White - College Graduate 40% 14% 45%18 to 29 22% 11% 67%30 to 44 19% 15% 67%45 to 59 21% 17% 62%60 or older 24% 13% 62%Under 45 20% 13% 67%45 or older 23% 15% 62%Gen Z/Millennials (18-37) 21% 11% 67%Gen X (38-53) 23% 15% 62%Baby Boomers (54-72) 22% 17% 61%Silent-Greatest (Over 72) 21% 14% 65%Men 20% 16% 64%Women 23% 12% 65%Big city 23% 18% 59%Small city 17% 14% 69%Suburban 26% 15% 60%Small town/Rural 22% 9% 69%
20% 17% 63%
23% 12% 65%
GILK020R. NPR/PBS NewsHour/Marist Poll National Tables January 10th through January 13th, 2019
Democrats and Democratic leaning independentsOverall, do you have a favorable or an unfavorable impression of
Kirsten Gillibrand?
Household Income
Education
Race
Race and Education
Age
Democrats and Democratic leaning independents
Party Identification
Party Identification*
Party ID and Gender
Region
Small city/Suburban Women
NPR/PBS NewsHour/Marist Poll National Democrats and Democratic leaning Independents. Interviews conducted January 10th through January 13th, 2019, n=417 MOE +/- 6.0 percentage points. Totals may not add to 100% due to rounding.*Soft Democrats include registered voters who identify as "not strong Democrats" or Democratic leaning independents.
Age
Generation
Gender
Area Description
Small city/Suburban Men
24

Favorable Unfavorable Unsure-Never HeardRow % Row % Row %
36% 10% 54%Democrat 38% 9% 54%Independent 31% 14% 56%Strong Democrats 47% 4% 49%Soft Democrats 26% 15% 59%Democrat men 43% 11% 46%Democrat women 34% 7% 58%Northeast 37% 15% 49%Midwest 37% 5% 58%South 30% 12% 58%West 42% 8% 49%Less than $50,000 30% 15% 55%$50,000 or more 36% 8% 56%Not college graduate 30% 11% 58%College graduate 42% 9% 49%White 39% 7% 53%African American 26% 13% 61%Other 35% 15% 50%White - Not College Graduate 27% 7% 66%White - College Graduate 48% 8% 45%18 to 29 42% 12% 46%30 to 44 32% 9% 59%45 to 59 31% 12% 58%60 or older 39% 9% 52%Under 45 36% 10% 53%45 or older 35% 10% 54%Gen Z/Millennials (18-37) 37% 7% 55%Gen X (38-53) 35% 9% 56%Baby Boomers (54-72) 37% 10% 53%Silent-Greatest (Over 72) 35% 13% 52%Men 38% 11% 51%Women 33% 10% 57%Big city 38% 15% 47%Small city 26% 10% 64%Suburban 48% 6% 46%Small town/Rural 31% 9% 60%
43% 7% 50%
33% 8% 59%
HARK020R. NPR/PBS NewsHour/Marist Poll National Tables January 10th through January 13th, 2019
Democrats and Democratic leaning independentsOverall, do you have a favorable or an unfavorable impression of
Kamala Harris?
Household Income
Education
Race
Race and Education
Age
Democrats and Democratic leaning independents
Party Identification
Party Identification*
Party ID and Gender
Region
Small city/Suburban Women
NPR/PBS NewsHour/Marist Poll National Democrats and Democratic leaning Independents. Interviews conducted January 10th through January 13th, 2019, n=417 MOE +/- 6.0 percentage points. Totals may not add to 100% due to rounding.*Soft Democrats include registered voters who identify as "not strong Democrats" or Democratic leaning independents.
Age
Generation
Gender
Area Description
Small city/Suburban Men
25

Favorable Unfavorable Unsure-Never HeardRow % Row % Row %
21% 8% 71%Democrat 24% 6% 70%Independent 15% 12% 73%Strong Democrats 29% 4% 67%Soft Democrats 15% 11% 74%Democrat men 34% 10% 55%Democrat women 18% 3% 78%Northeast 25% 11% 64%Midwest 31% 7% 62%South 17% 5% 78%West 14% 10% 76%Less than $50,000 18% 14% 68%$50,000 or more 25% 5% 70%Not college graduate 16% 12% 72%College graduate 27% 4% 68%White 31% 4% 66%African American 10% 14% 77%Other 10% 13% 77%White - Not College Graduate 27% 2% 71%White - College Graduate 33% 5% 63%18 to 29 22% 10% 67%30 to 44 14% 8% 79%45 to 59 24% 5% 71%60 or older 25% 8% 66%Under 45 18% 9% 73%45 or older 25% 7% 68%Gen Z/Millennials (18-37) 22% 6% 73%Gen X (38-53) 19% 6% 75%Baby Boomers (54-72) 23% 8% 69%Silent-Greatest (Over 72) 24% 10% 66%Men 28% 8% 64%Women 17% 8% 75%Big city 21% 9% 70%Small city 19% 9% 72%Suburban 30% 7% 63%Small town/Rural 17% 6% 77%
31% 9% 59%
19% 7% 74%
KLOA020R. NPR/PBS NewsHour/Marist Poll National Tables January 10th through January 13th, 2019
Democrats and Democratic leaning independentsOverall, do you have a favorable or an unfavorable impression of Amy
Klobuchar?
Household Income
Education
Race
Race and Education
Age
Democrats and Democratic leaning independents
Party Identification
Party Identification*
Party ID and Gender
Region
Small city/Suburban Women
NPR/PBS NewsHour/Marist Poll National Democrats and Democratic leaning Independents. Interviews conducted January 10th through January 13th, 2019, n=417 MOE +/- 6.0 percentage points. Totals may not add to 100% due to rounding.*Soft Democrats include registered voters who identify as "not strong Democrats" or Democratic leaning independents.
Age
Generation
Gender
Area Description
Small city/Suburban Men
26

Favorable Unfavorable Unsure-Never HeardRow % Row % Row %
39% 10% 52%Democrat 37% 6% 57%Independent 41% 19% 40%Strong Democrats 45% 6% 49%Soft Democrats 33% 13% 54%Democrat men 46% 8% 46%Democrat women 32% 4% 64%Northeast 39% 15% 46%Midwest 39% 4% 57%South 37% 10% 53%West 40% 10% 50%Less than $50,000 24% 15% 61%$50,000 or more 47% 7% 46%Not college graduate 25% 14% 61%College graduate 55% 5% 40%White 51% 6% 43%African American 17% 7% 76%Other 29% 22% 49%White - Not College Graduate 39% 5% 56%White - College Graduate 60% 7% 33%18 to 29 32% 12% 56%30 to 44 36% 16% 48%45 to 59 44% 3% 52%60 or older 41% 9% 50%Under 45 35% 14% 52%45 or older 42% 6% 51%Gen Z/Millennials (18-37) 40% 9% 51%Gen X (38-53) 34% 12% 55%Baby Boomers (54-72) 42% 7% 52%Silent-Greatest (Over 72) 43% 9% 48%Men 48% 13% 40%Women 32% 8% 60%Big city 46% 10% 44%Small city 31% 11% 58%Suburban 39% 13% 48%Small town/Rural 40% 4% 55%
41% 18% 40%
31% 7% 62%
OROB020R. NPR/PBS NewsHour/Marist Poll National Tables January 10th through January 13th, 2019
Democrats and Democratic leaning independentsOverall, do you have a favorable or an unfavorable impression of Beto
O'Rourke?
Democrats and Democratic leaning independents
Education
Race
Race and Education
Age
Age
Party Identification
Party Identification*
Party ID and Gender
Region
Household Income
NPR/PBS NewsHour/Marist Poll National Democrats and Democratic leaning Independents. Interviews conducted January 10th through January 13th, 2019, n=417 MOE +/- 6.0 percentage points. Totals may not add to 100% due to rounding.*Soft Democrats include registered voters who identify as "not strong Democrats" or Democratic leaning independents.
Generation
Gender
Area Description
Small city/Suburban Men
Small city/Suburban Women
27

Favorable Unfavorable Unsure-Never HeardRow % Row % Row %
57% 28% 15%Democrat 56% 27% 16%Independent 60% 29% 11%Strong Democrats 59% 29% 11%Soft Democrats 56% 27% 17%Democrat men 68% 25% 8%Democrat women 49% 29% 22%Northeast 60% 27% 13%Midwest 64% 20% 16%South 51% 33% 16%West 57% 30% 13%Less than $50,000 56% 26% 18%$50,000 or more 59% 29% 13%Not college graduate 57% 24% 19%College graduate 59% 32% 9%White 56% 33% 12%African American 59% 17% 24%Other 61% 26% 13%White - Not College Graduate 59% 26% 14%White - College Graduate 54% 37% 10%18 to 29 63% 24% 13%30 to 44 58% 28% 14%45 to 59 65% 24% 12%60 or older 49% 33% 19%Under 45 60% 26% 14%45 or older 55% 29% 16%Gen Z/Millennials (18-37) 62% 25% 13%Gen X (38-53) 66% 22% 12%Baby Boomers (54-72) 55% 32% 13%Silent-Greatest (Over 72) 46% 30% 24%Men 62% 28% 9%Women 54% 27% 19%Big city 67% 25% 8%Small city 53% 30% 17%Suburban 59% 32% 9%Small town/Rural 52% 24% 24%
58% 33% 9%
55% 30% 16%
SANB020R. NPR/PBS NewsHour/Marist Poll National Tables January 10th through January 13th, 2019
Democrats and Democratic leaning independentsOverall, do you have a favorable or an unfavorable impression of
Bernie Sanders?
Household Income
Education
Race
Race and Education
Age
Democrats and Democratic leaning independents
Party Identification
Party Identification*
Party ID and Gender
Region
Small city/Suburban Women
NPR/PBS NewsHour/Marist Poll National Democrats and Democratic leaning Independents. Interviews conducted January 10th through January 13th, 2019, n=417 MOE +/- 6.0 percentage points. Totals may not add to 100% due to rounding.*Soft Democrats include registered voters who identify as "not strong Democrats" or Democratic leaning independents.
Age
Generation
Gender
Area Description
Small city/Suburban Men
28

Favorable Unfavorable Unsure-Never HeardRow % Row % Row %
53% 17% 30%Democrat 53% 15% 32%Independent 51% 23% 26%Strong Democrats 65% 12% 22%Soft Democrats 43% 21% 37%Democrat men 59% 18% 22%Democrat women 50% 12% 38%Northeast 55% 23% 22%Midwest 53% 16% 31%South 47% 17% 36%West 59% 12% 29%Less than $50,000 50% 13% 37%$50,000 or more 57% 18% 25%Not college graduate 47% 15% 37%College graduate 59% 19% 22%White 58% 16% 26%African American 48% 5% 47%Other 43% 31% 26%White - Not College Graduate 51% 14% 35%White - College Graduate 64% 17% 19%18 to 29 52% 19% 28%30 to 44 45% 21% 35%45 to 59 57% 13% 30%60 or older 56% 16% 28%Under 45 48% 20% 32%45 or older 57% 15% 29%Gen Z/Millennials (18-37) 47% 22% 31%Gen X (38-53) 56% 16% 28%Baby Boomers (54-72) 56% 15% 30%Silent-Greatest (Over 72) 56% 14% 30%Men 53% 24% 23%Women 53% 12% 35%Big city 50% 31% 19%Small city 49% 13% 38%Suburban 58% 14% 28%Small town/Rural 54% 8% 38%
53% 20% 26%
53% 8% 38%
WARE020R. NPR/PBS NewsHour/Marist Poll National Tables January 10th through January 13th, 2019
Democrats and Democratic leaning independentsOverall, do you have a favorable or an unfavorable impression of
Elizabeth Warren?
Household Income
Education
Race
Race and Education
Age
Democrats and Democratic leaning independents
Party Identification
Party Identification*
Party ID and Gender
Region
Small city/Suburban Women
NPR/PBS NewsHour/Marist Poll National Democrats and Democratic leaning Independents. Interviews conducted January 10th through January 13th, 2019, n=417 MOE +/- 6.0 percentage points. Totals may not add to 100% due to rounding.*Soft Democrats include registered voters who identify as "not strong Democrats" or Democratic leaning independents.
Age
Generation
Gender
Area Description
Small city/Suburban Men
29

Favorable Unfavorable Unsure/Never heard ofRow % Row % Row %
29% 48% 23%24% 28% 48%
Marist Poll Republicans and Republican leaning IndependentsJohn Kasich
Mitt Romney
REPFAV1. Marist Poll National TablesRepublicans and Republican leaning Independents
Overall, do you have a favorable or an unfavorable impression of:
30

Favorable Unfavorable Unsure-Never HeardRow % Row % Row %
24% 28% 48%Republican 23% 28% 49%Independent 26% 28% 45%Strong Republicans 25% 34% 41%Soft Republicans 23% 24% 53%Republican men 27% 32% 41%Republican women 18% 25% 57%
22% 34% 43%Less than $50,000 21% 24% 55%$50,000 or more 26% 31% 43%Not college graduate 20% 29% 51%College graduate 28% 28% 45%White 24% 28% 48%Non-white 24% 25% 51%White - Not College Graduate 18% 30% 51%White - College Graduate 30% 27% 43%Under 45 29% 18% 54%45 or older 22% 35% 44%Gen Z/Millennials (18-37) 25% 22% 52%Gen X (38-53) 25% 22% 53%Baby Boomers (54-72) 27% 40% 33%Silent-Greatest (Over 72) 13% 28% 59%Men 30% 32% 38%Women 17% 24% 59%
19% 34% 47%
KASJ020R. NPR/PBS NewsHour/Marist Poll National Tables January 10th through January 13th, 2019
Republicans and Republican leaning independentsOverall, do you have a favorable or an unfavorable impression of John
Kasich?
Household Income
Education
Race
Race and Education
Age
Republicans and Republican leaning independents
Party Identification
Party Identification
Party ID and Gender
Trump Supporters
Generation
Gender
White Evangelical Christians
NPR/PBS NewsHour/Marist Poll National Republicans and Republican leaning Independents. Interviews conducted January 10th through January 13th, 2019, n=324 MOE +/- 6.8 percentage points. Totals may not add to 100% due to rounding.*Soft Republicans include those registered voters who identify as "not strong Republicans" or Republican leaning independents.
31

Favorable Unfavorable Unsure-Never HeardRow % Row % Row %
29% 48% 23%Republican 30% 45% 25%Independent 27% 53% 20%Strong Republicans 27% 55% 18%Soft Republicans 31% 43% 27%Republican men 30% 47% 23%Republican women 31% 43% 26%
25% 54% 20%Less than $50,000 21% 54% 25%$50,000 or more 35% 47% 18%Not college graduate 26% 51% 23%College graduate 32% 45% 23%White 33% 47% 19%Non-white 17% 47% 37%White - Not College Graduate 30% 51% 19%White - College Graduate 37% 44% 19%Under 45 39% 37% 24%45 or older 24% 53% 23%Gen Z/Millennials (18-37) 39% 31% 30%Gen X (38-53) 27% 48% 25%Baby Boomers (54-72) 25% 58% 17%Silent-Greatest (Over 72) 28% 51% 21%Men 29% 52% 20%Women 30% 43% 27%
31% 51% 18%
Republicans and Republican leaning independentsOverall, do you have a favorable or an unfavorable impression of Mitt
Romney?
Republicans and Republican leaning independents
Party Identification
ROMM020R. NPR/PBS NewsHour/Marist Poll National Tables January 10th through January 13th, 2019
Race
Race and Education
Age
Generation
Gender
Party Identification
Party ID and Gender
Trump Supporters
Household Income
Education
White Evangelical Christians
NPR/PBS NewsHour/Marist Poll National Republicans and Republican leaning Independents. Interviews conducted January 10th through January 13th, 2019, n=324 MOE +/- 6.8 percentage points. Totals may not add to 100% due to rounding.*Soft Republicans include those registered voters who identify as "not strong Republicans" or Republican leaning independents.
32

Yes No UnsureRow % Row % Row %
44% 45% 11%Republican 43% 46% 11%Independent 47% 44% 9%Strong Republicans 32% 56% 12%Soft Republicans 53% 37% 10%Republican men 43% 45% 12%Republican women 43% 47% 10%
33% 56% 11%Less than $50,000 49% 46% 5%$50,000 or more 45% 46% 10%Not college graduate 42% 47% 11%College graduate 47% 43% 10%White 48% 42% 10%Non-white 37% 49% 14%White - Not College Graduate 46% 44% 10%White - College Graduate 51% 39% 9%Under 45 51% 34% 15%45 or older 40% 51% 8%Gen Z/Millennials (18-37) 52% 31% 17%Gen X (38-53) 49% 43% 8%Baby Boomers (54-72) 38% 53% 9%Silent-Greatest (Over 72) 36% 54% 9%Men 43% 49% 8%Women 46% 41% 13%
44% 49% 8%
Republicans and Republican leaning independents
Party Identification
Party Identification
Party ID and Gender
Trump Supporters
PRSR102. NPR/PBS NewsHour/Marist Poll National Tables January 10th through January 13th, 2019
Republicans and Republican leaning independents
Do you want another Republican to challenge Donald Trump for the Republican nomination for president in the 2020 primaries?
Generation
Gender
White Evangelical Christians
NPR/PBS NewsHour/Marist Poll National Republicans and Republican leaning Independents. Interviews conducted January 10th through January 13th, 2019, n=324 MOE +/- 6.8 percentage points. Totals may not add to 100% due to rounding.*Soft Republicans include those registered voters who identify as "not strong Republicans" or Republican leaning independents.
Household Income
Education
Race
Race and Education
Age
33

Yes No UnsureRow % Row % Row %
January 2019 44% 45% 11%November 2010* 45% 46% 9%
Republicans and Republican leaning independents
Do you want another Republican (Democrat) to challenge Donald Trump (Barack Obama) for the Republican (Democratic) nomination for president in the 2020 (2012) primaries?
Marist Poll Republicans and Republican leaning independents*Asked of Democrats and Democratic leaning independents
PRSR102TRND. Marist Poll National Trend
34