Natural Gas Facts & Figures - International Gas · PDF fileNatural Gas reserves: ... The total...
124
Natural Gas Facts & Figures New Approach & Proposal
Transcript of Natural Gas Facts & Figures - International Gas · PDF fileNatural Gas reserves: ... The total...
Natural Gas
Facts & Figures
New Approach & Proposal
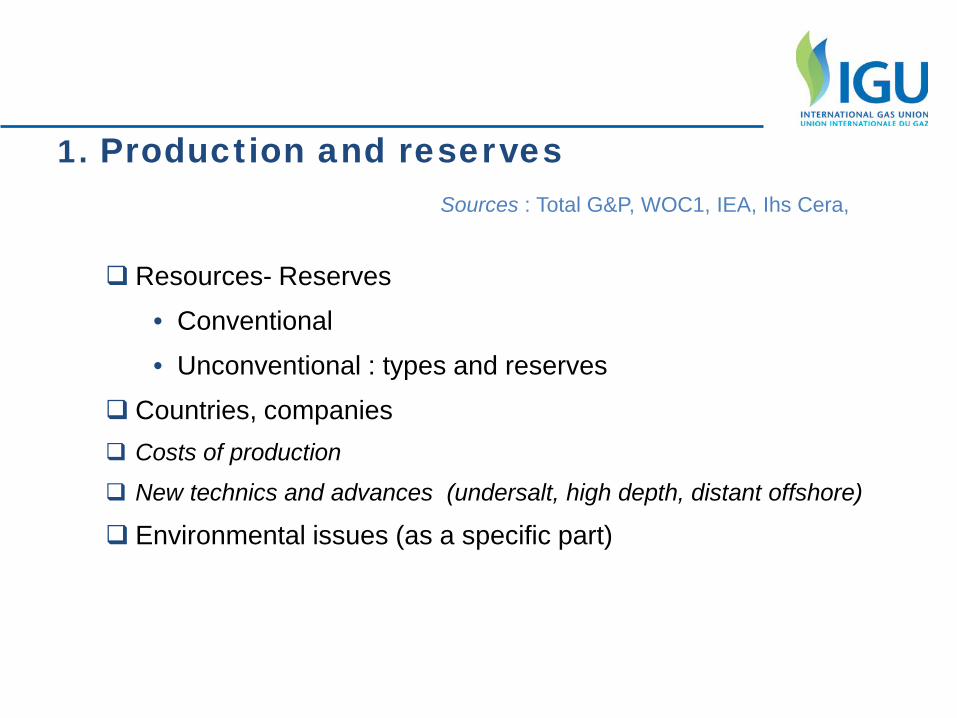
1. Production and reserves Sources : Total G&P, WOC1, IEA, Ihs Cera,
Resources- Reserves
• Conventional
• Unconventional : types and reserves
Countries, companies Costs of production
New technics and advances (undersalt, high depth, distant offshore)
Environmental issues (as a specific part)
3
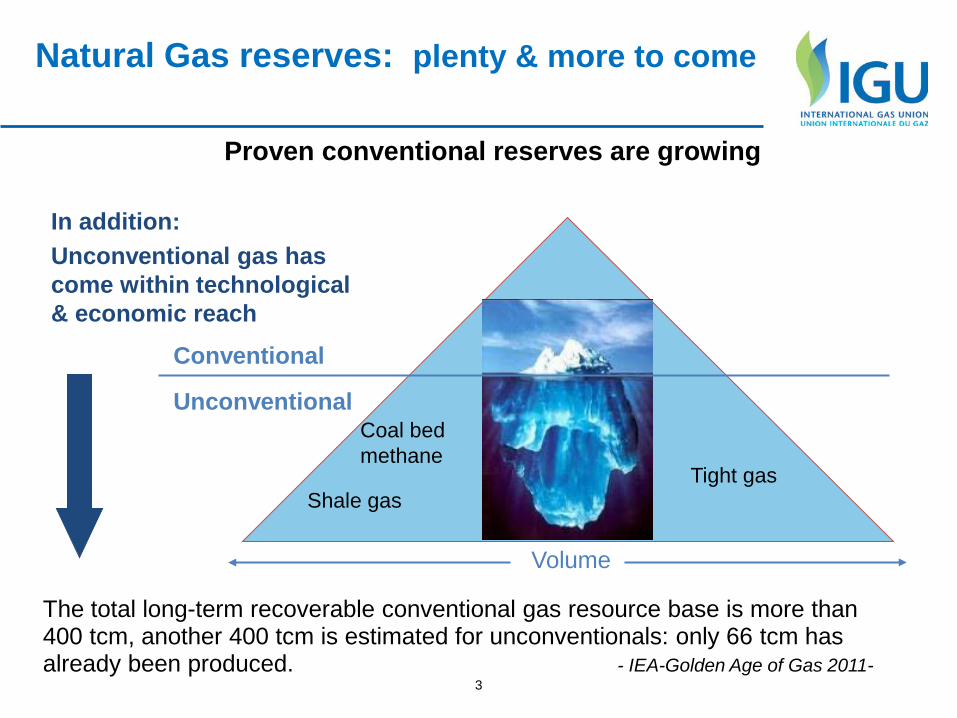
Natural Gas reserves: plenty & more to come
Proven conventional reserves are growing
In addition: Unconventional gas has come within technological & economic reach
Volume
Conventional
Unconventional
The total long-term recoverable conventional gas resource base is more than 400 tcm, another 400 tcm is estimated for unconventionals: only 66 tcm has already been produced. - IEA-Golden Age of Gas 2011-
Shale gas
Coal bed methane
Tight gas
4
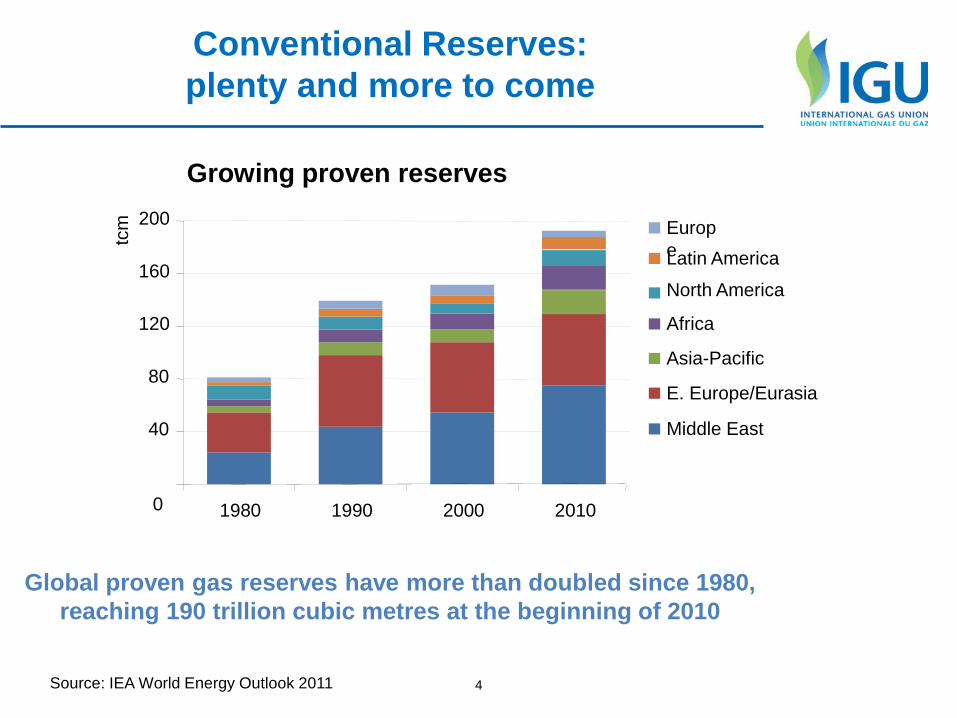
Conventional Reserves: plenty and more to come
Global proven gas reserves have more than doubled since 1980, reaching 190 trillion cubic metres at the beginning of 2010
0
40
80
120
160
200
1980 1990 2000 2010
tcm
Europe Latin America
North America
Africa
Asia-Pacific
E. Europe/Eurasia Middle East
Source: IEA World Energy Outlook 2011
Growing proven reserves
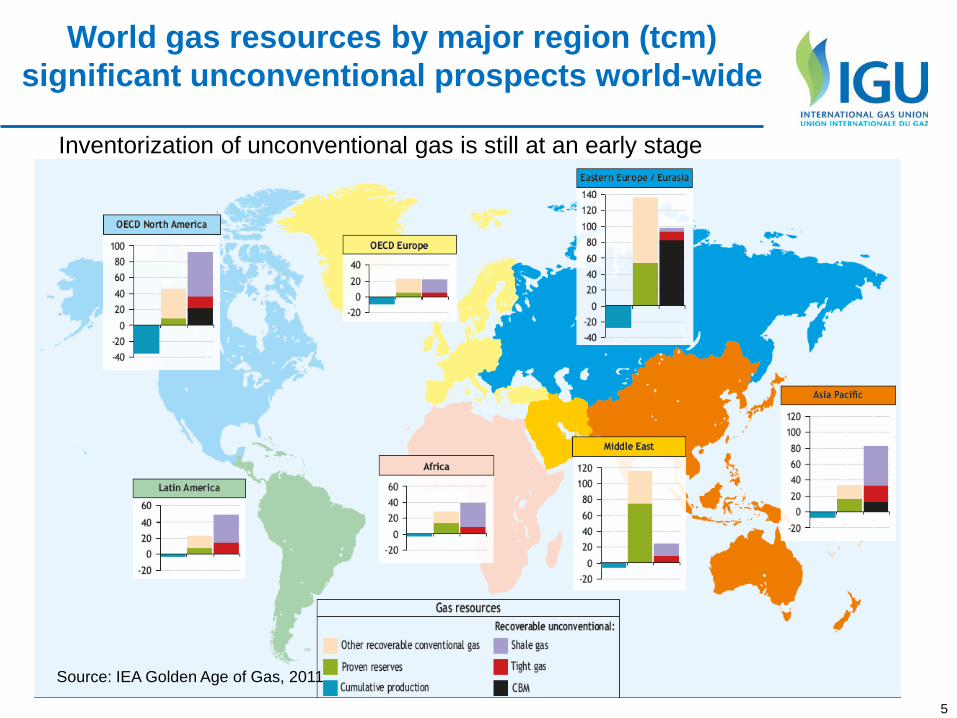
World gas resources by major region (tcm) significant unconventional prospects world-wide
5
Source: IEA Golden Age of Gas, 2011
Inventorization of unconventional gas is still at an early stage
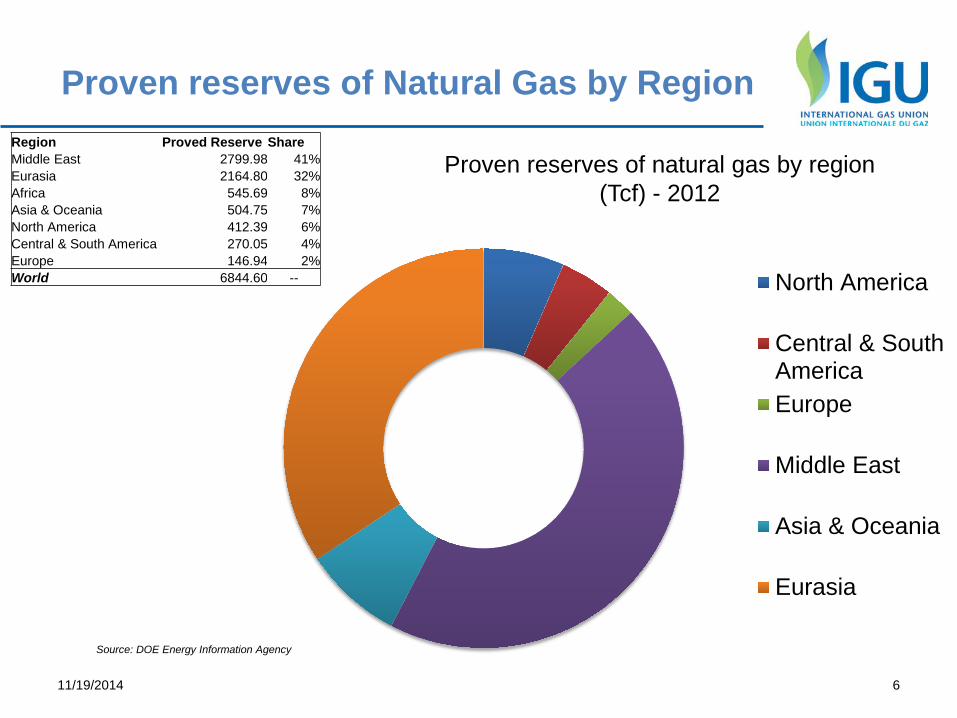
Proven reserves of Natural Gas by Region
6 11/19/2014
North America
Central & SouthAmericaEurope
Middle East
Asia & Oceania
Eurasia
Region Proved Reserve Share Middle East 2799.98 41% Eurasia 2164.80 32% Africa 545.69 8% Asia & Oceania 504.75 7% North America 412.39 6% Central & South America 270.05 4% Europe 146.94 2% World 6844.60 --
Source: DOE Energy Information Agency
Proven reserves of natural gas by region (Tcf) - 2012
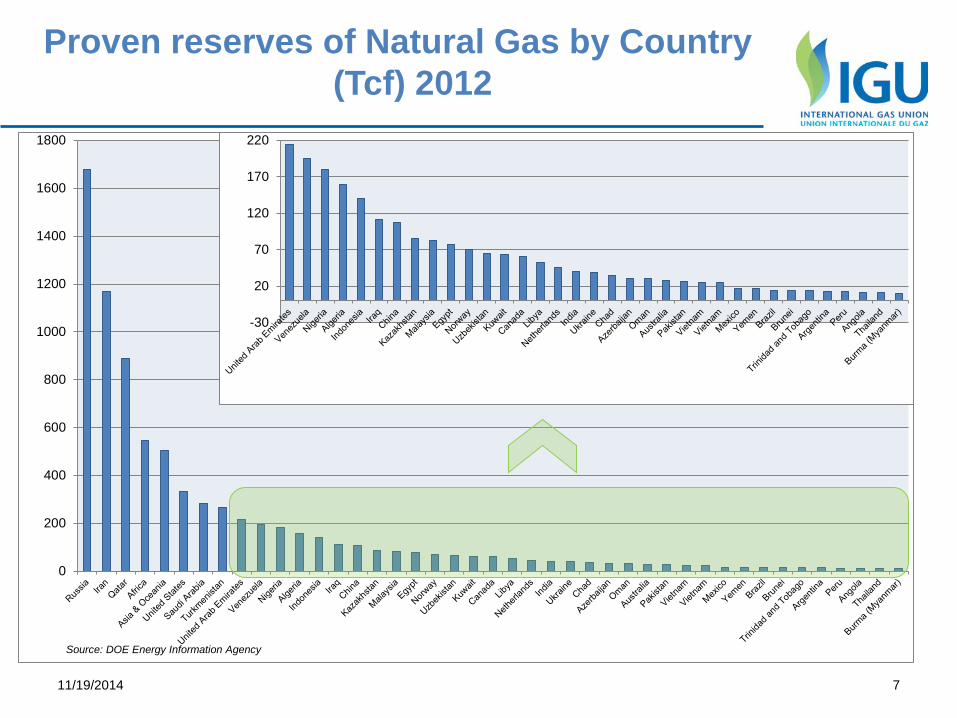
Proven reserves of Natural Gas by Country (Tcf) 2012
7 11/19/2014
0
200
400
600
800
1000
1200
1400
1600
1800
-30
20
70
120
170
220
Source: DOE Energy Information Agency
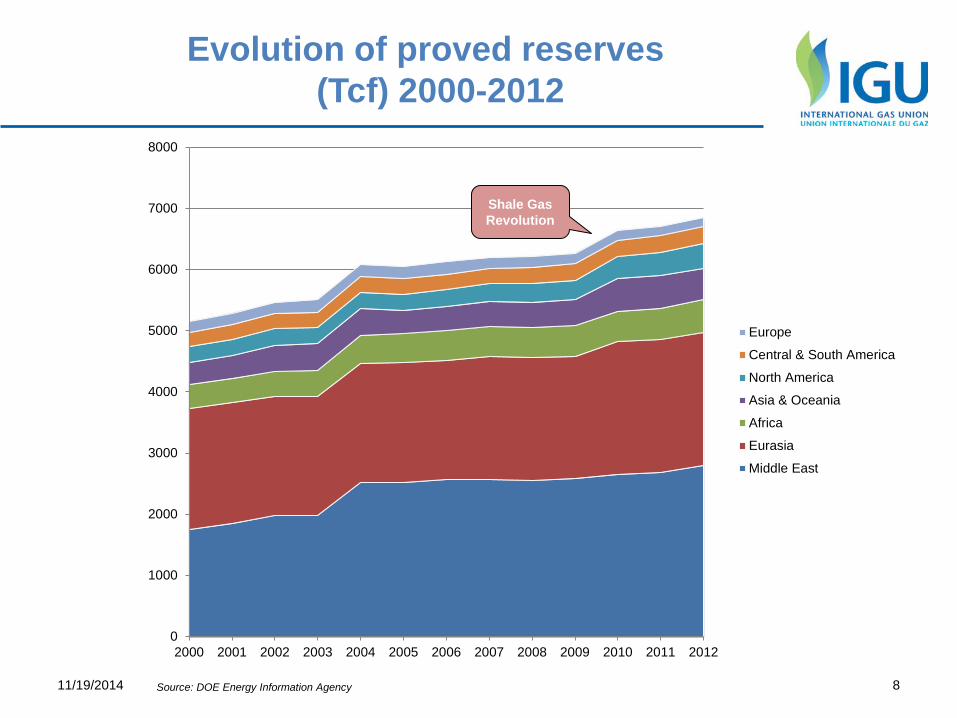
Evolution of proved reserves (Tcf) 2000-2012
8 11/19/2014
0
1000
2000
3000
4000
5000
6000
7000
8000
2000 2001 2002 2003 2004 2005 2006 2007 2008 2009 2010 2011 2012
Europe
Central & South America
North America
Asia & Oceania
Africa
Eurasia
Middle East
Shale Gas Revolution
Source: DOE Energy Information Agency
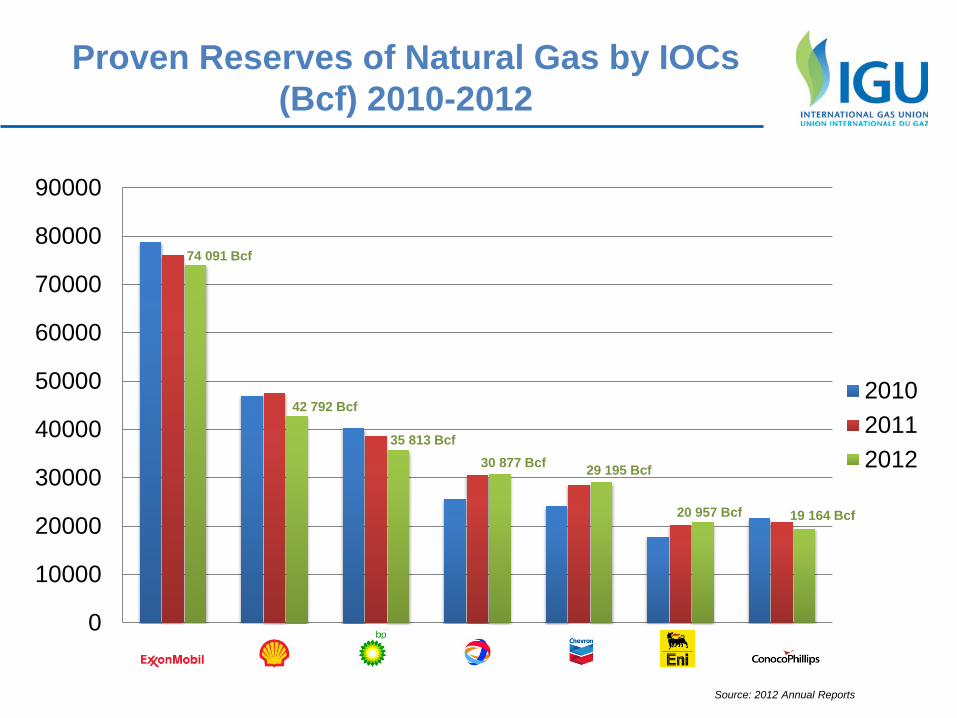
Proven Reserves of Natural Gas by IOCs (Bcf) 2010-2012
0
10000
20000
30000
40000
50000
60000
70000
80000
90000
201020112012
74 091 Bcf
42 792 Bcf
35 813 Bcf 30 877 Bcf 29 195 Bcf
20 957 Bcf 19 164 Bcf
Source: 2012 Annual Reports
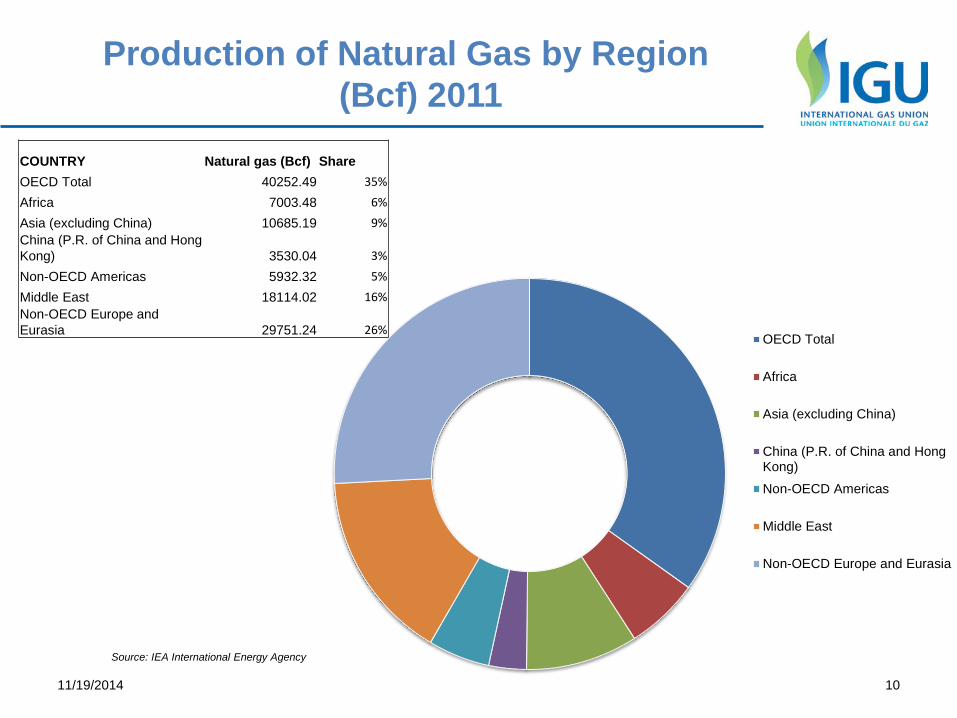
Production of Natural Gas by Region (Bcf) 2011
10 11/19/2014
OECD Total
Africa
Asia (excluding China)
China (P.R. of China and HongKong)
Non-OECD Americas
Middle East
Non-OECD Europe and Eurasia
COUNTRY Natural gas (Bcf) Share OECD Total 40252.49 35%
Africa 7003.48 6%
Asia (excluding China) 10685.19 9% China (P.R. of China and Hong Kong) 3530.04 3%
Non-OECD Americas 5932.32 5%
Middle East 18114.02 16% Non-OECD Europe and Eurasia 29751.24 26%
Source: IEA International Energy Agency
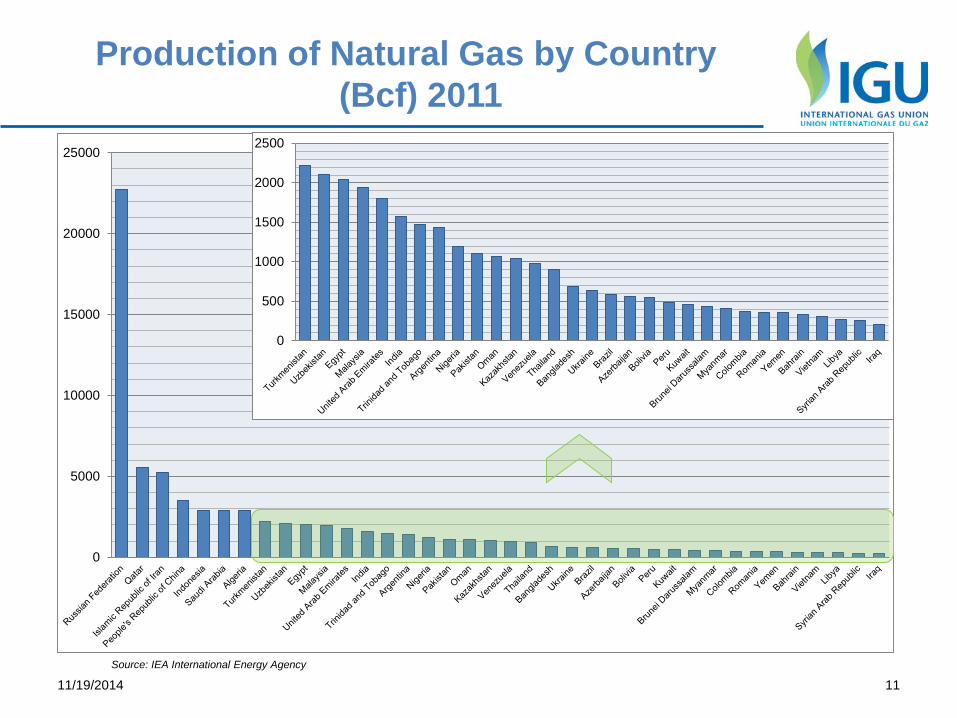
Production of Natural Gas by Country (Bcf) 2011
11 11/19/2014
0
5000
10000
15000
20000
25000
0
500
1000
1500
2000
2500
Source: IEA International Energy Agency
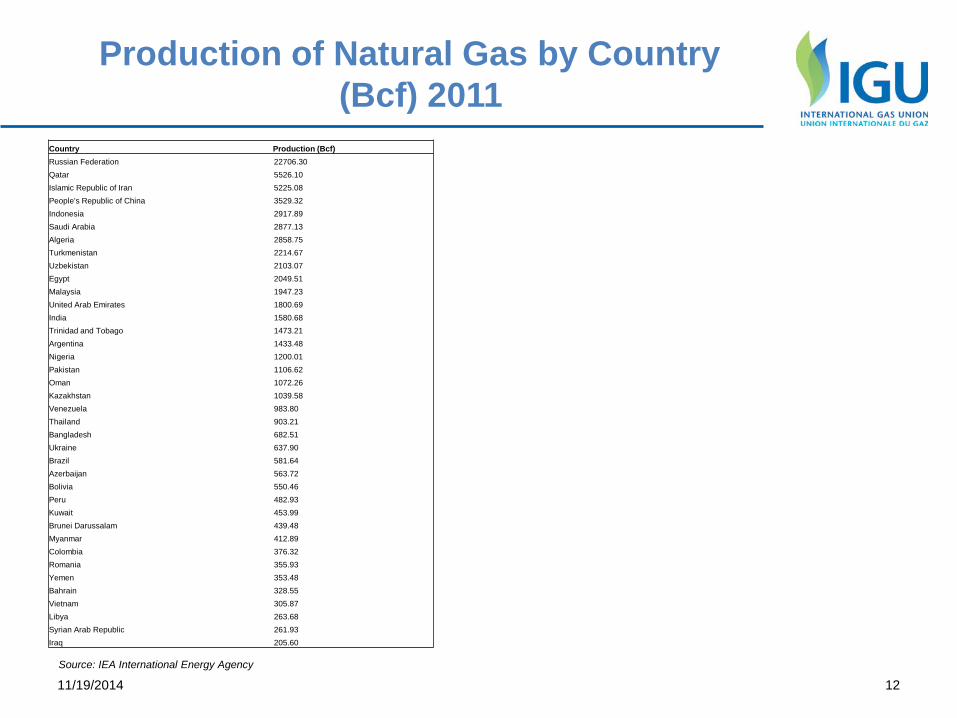
Production of Natural Gas by Country (Bcf) 2011
12 11/19/2014
Country Production (Bcf) Russian Federation 22706.30 Qatar 5526.10 Islamic Republic of Iran 5225.08 People's Republic of China 3529.32 Indonesia 2917.89 Saudi Arabia 2877.13 Algeria 2858.75 Turkmenistan 2214.67 Uzbekistan 2103.07 Egypt 2049.51 Malaysia 1947.23 United Arab Emirates 1800.69 India 1580.68 Trinidad and Tobago 1473.21 Argentina 1433.48 Nigeria 1200.01 Pakistan 1106.62 Oman 1072.26 Kazakhstan 1039.58 Venezuela 983.80 Thailand 903.21 Bangladesh 682.51 Ukraine 637.90 Brazil 581.64 Azerbaijan 563.72 Bolivia 550.46 Peru 482.93 Kuwait 453.99 Brunei Darussalam 439.48 Myanmar 412.89 Colombia 376.32 Romania 355.93 Yemen 353.48 Bahrain 328.55 Vietnam 305.87 Libya 263.68 Syrian Arab Republic 261.93 Iraq 205.60
Source: IEA International Energy Agency
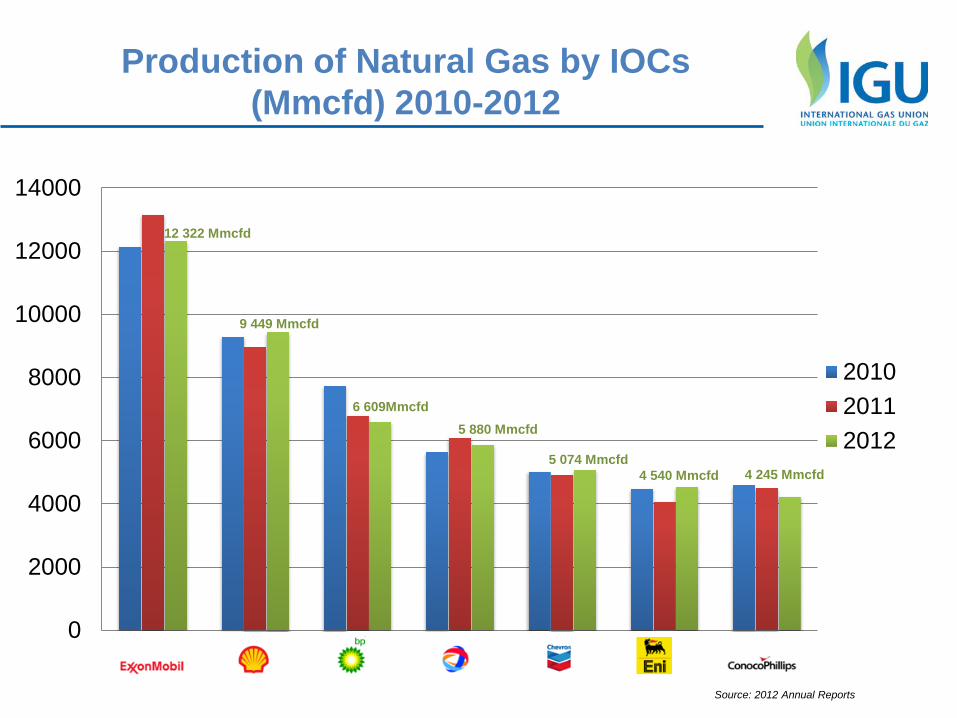
Production of Natural Gas by IOCs (Mmcfd) 2010-2012
0
2000
4000
6000
8000
10000
12000
14000
201020112012
12 322 Mmcfd
9 449 Mmcfd
6 609Mmcfd 5 880 Mmcfd
5 074 Mmcfd 4 540 Mmcfd 4 245 Mmcfd
Source: 2012 Annual Reports
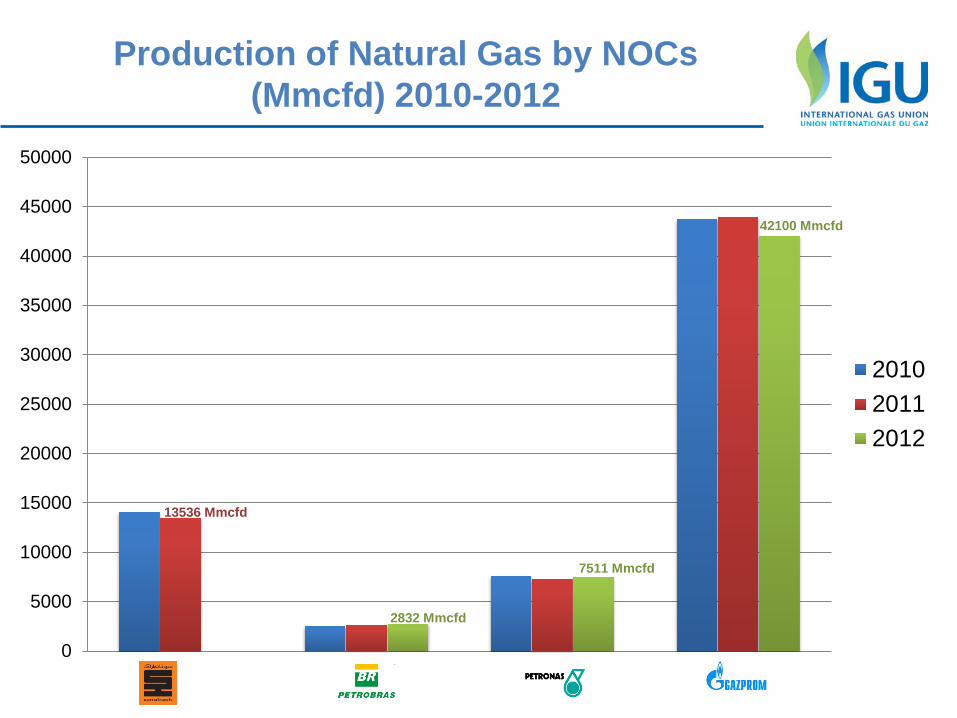
Production of Natural Gas by NOCs (Mmcfd) 2010-2012
0
5000
10000
15000
20000
25000
30000
35000
40000
45000
50000
201020112012
2832 Mmcfd
7511 Mmcfd
42100 Mmcfd
13536 Mmcfd
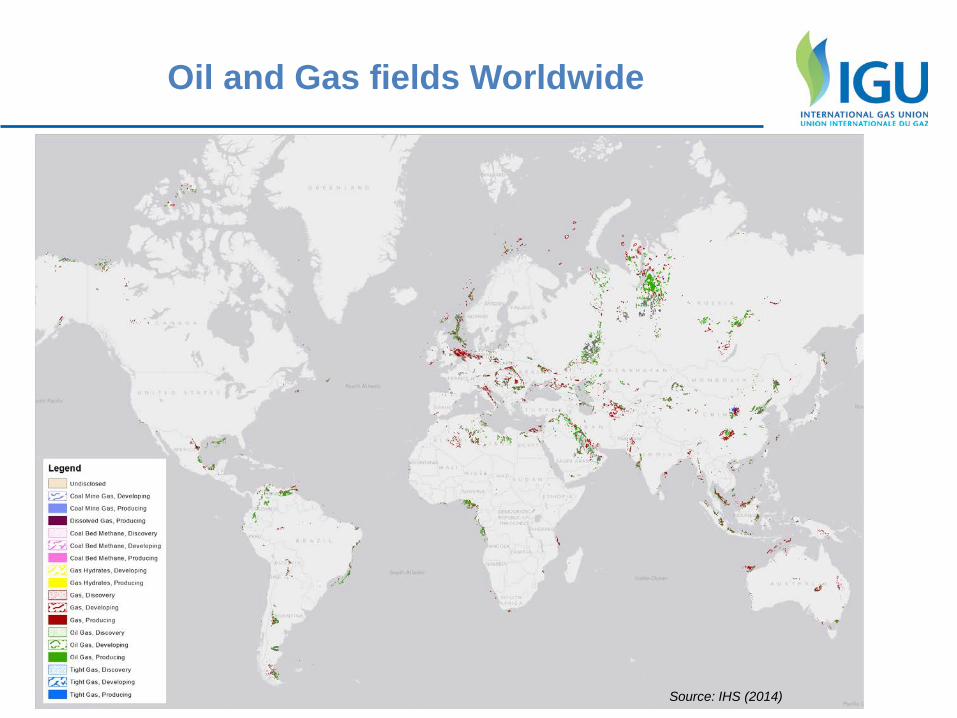
Oil and Gas fields Worldwide
Source: IHS (2014)
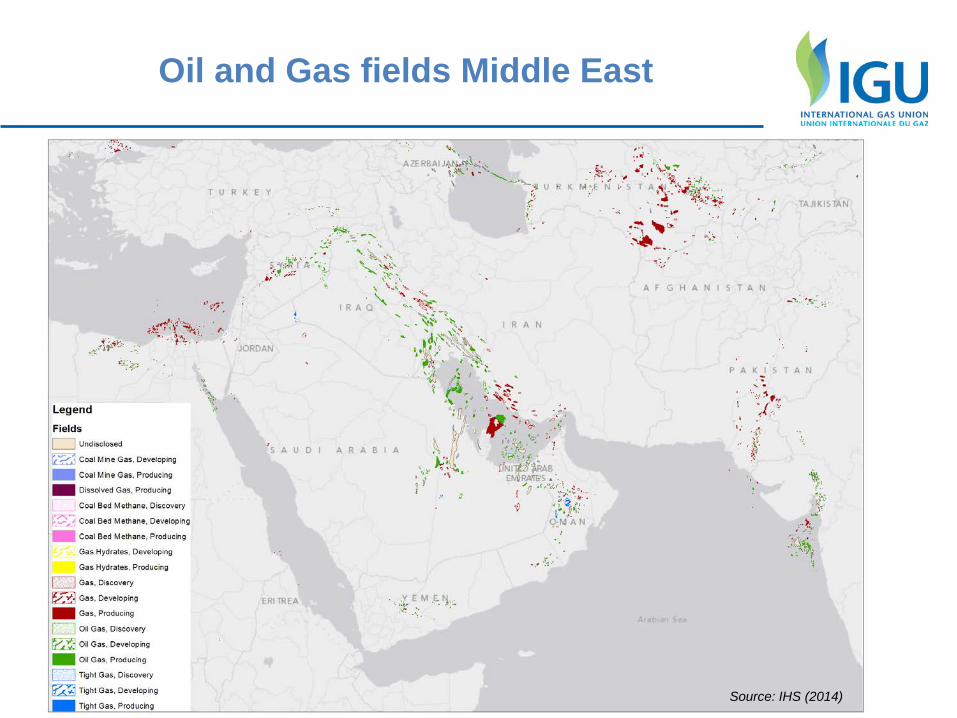
Oil and Gas fields Middle East
Source: IHS (2014)
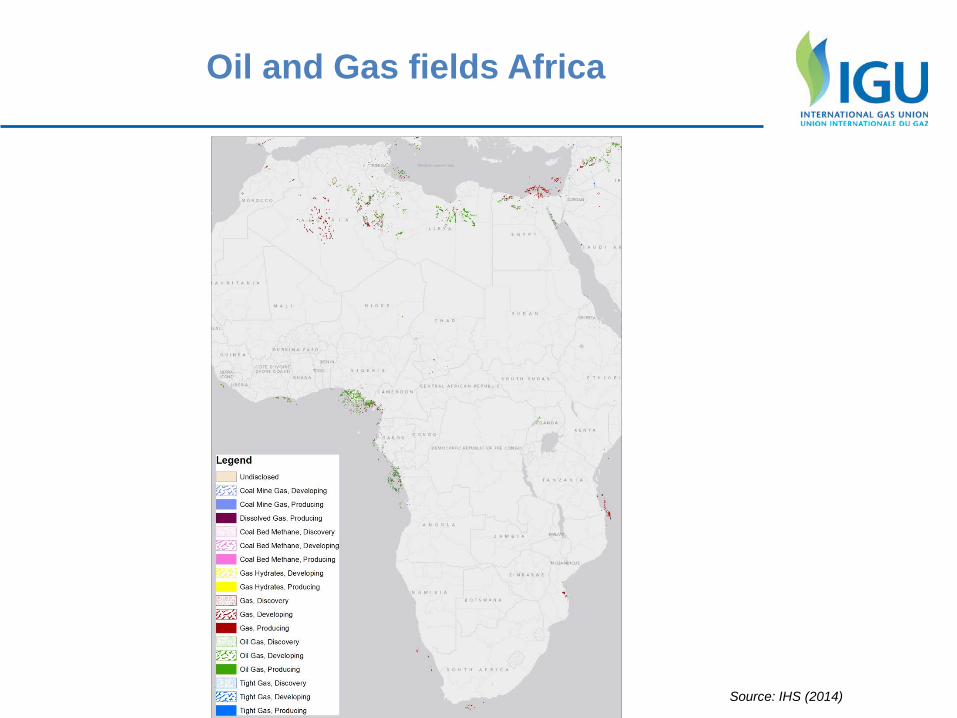
Oil and Gas fields Africa
Source: IHS (2014)
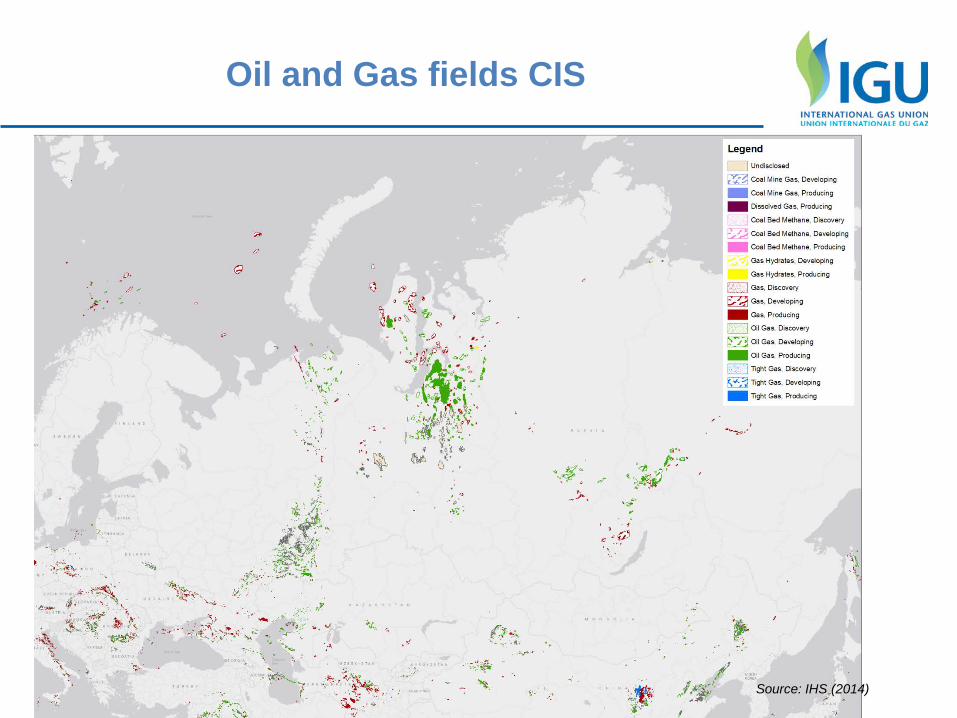
Oil and Gas fields CIS
Source: IHS (2014)
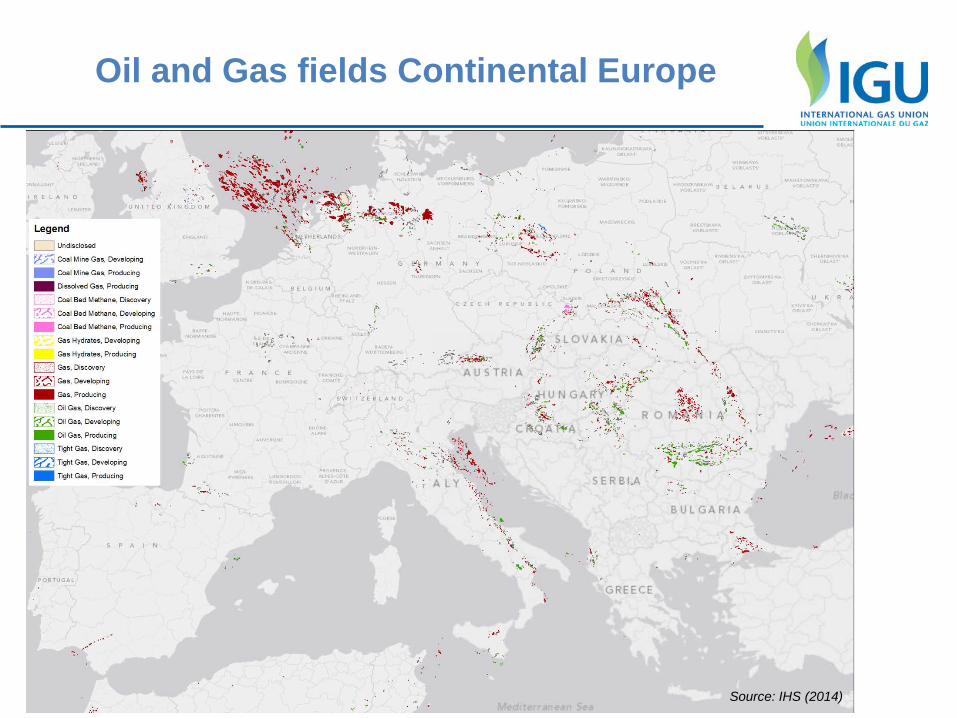
Oil and Gas fields Continental Europe
Source: IHS (2014)
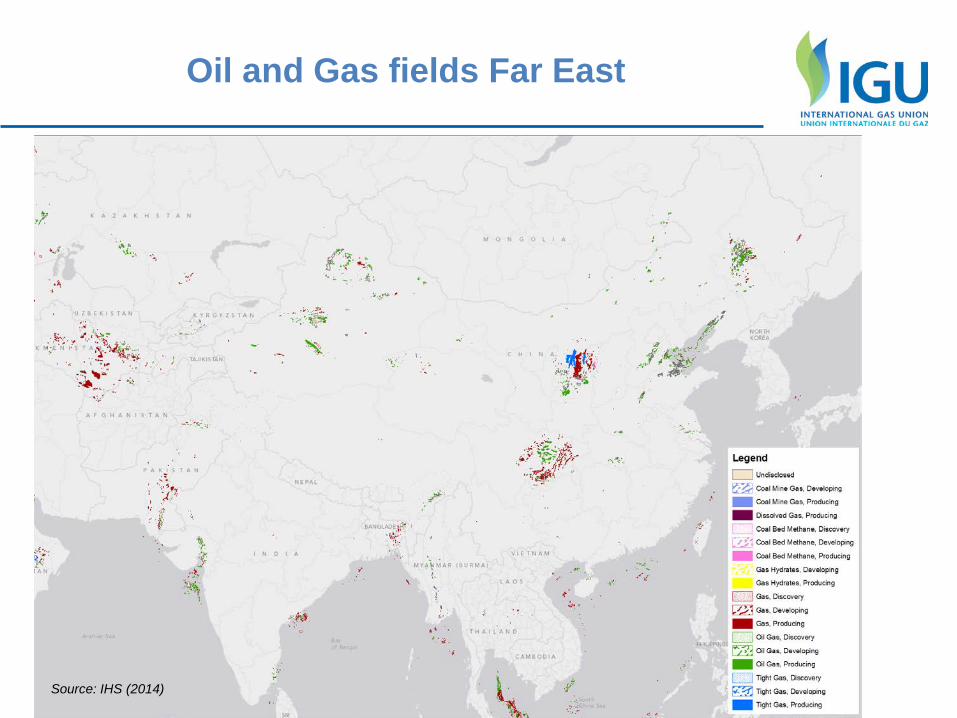
Oil and Gas fields Far East
Source: IHS (2014)
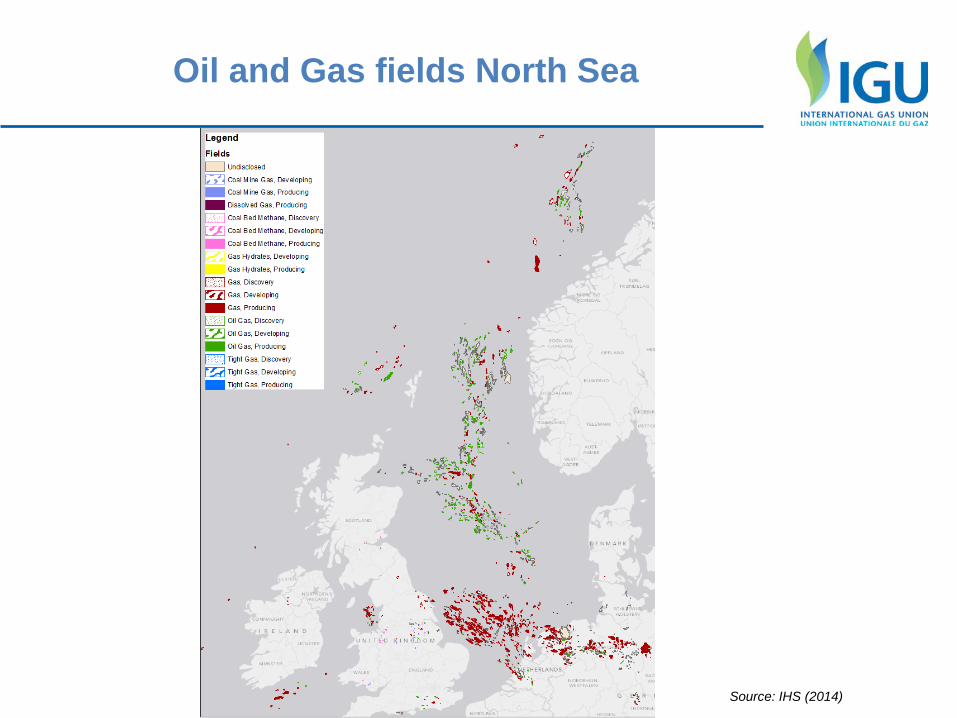
Oil and Gas fields North Sea
Source: IHS (2014)
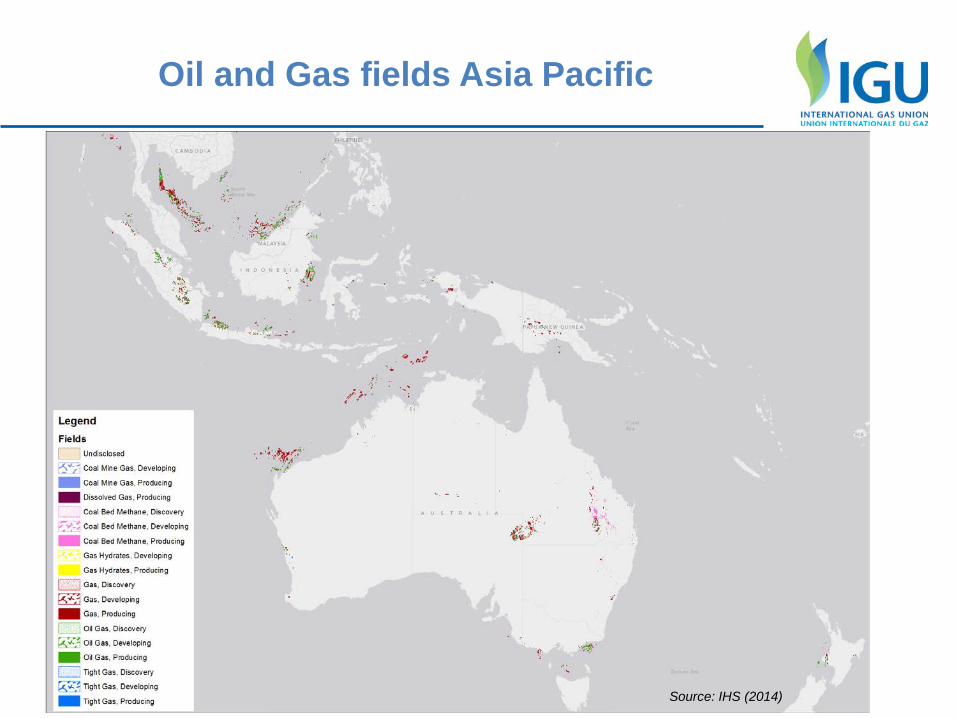
Oil and Gas fields Asia Pacific
Source: IHS (2014)
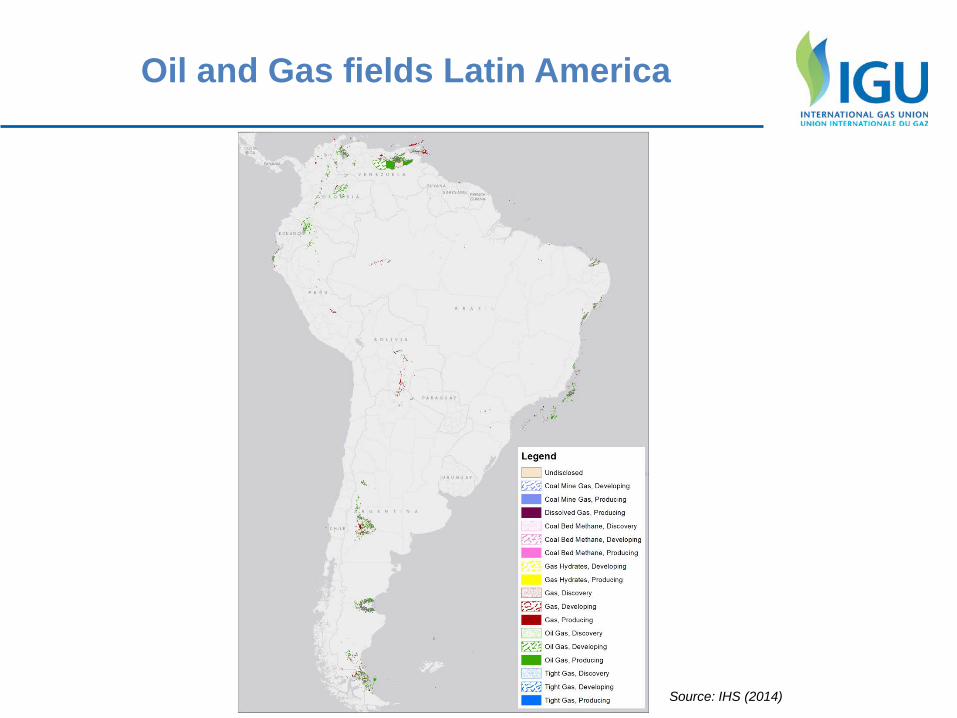
Oil and Gas fields Latin America
Source: IHS (2014)
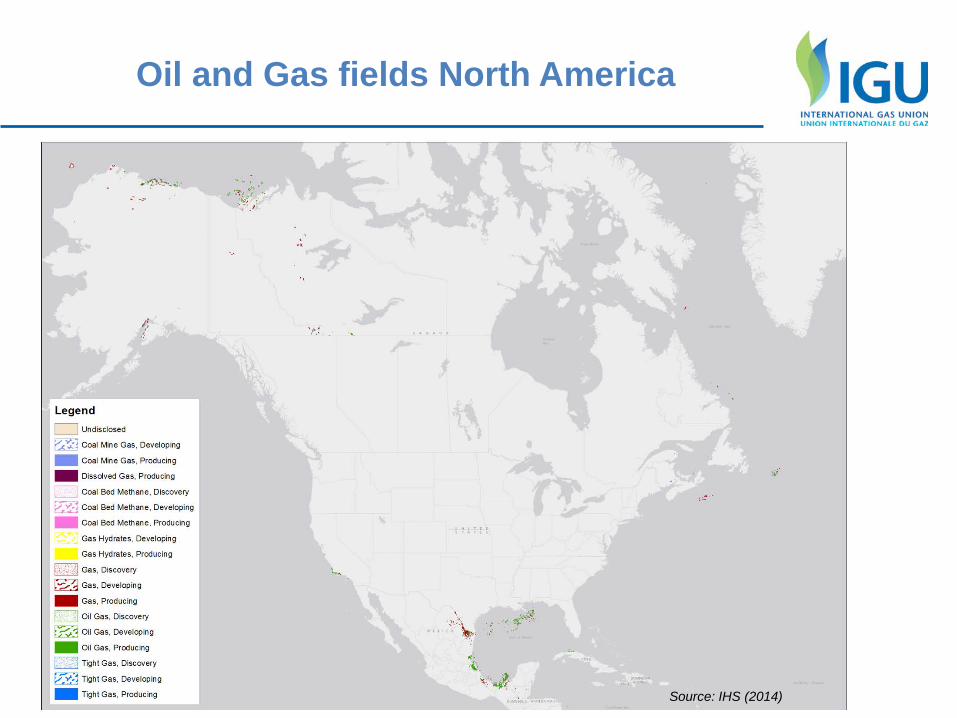
Oil and Gas fields North America
Source: IHS (2014)
Unconventional resources
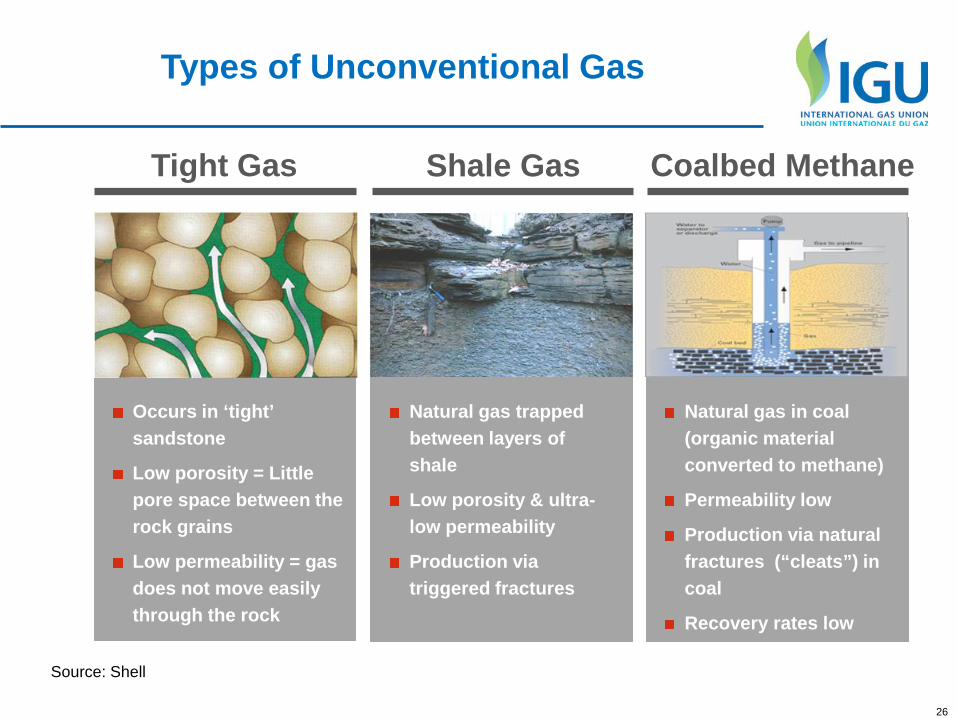
Tight Gas Shale Gas Coalbed Methane
26
Occurs in ‘tight’ sandstone
Low porosity = Little pore space between the rock grains
Low permeability = gas does not move easily through the rock
Natural gas trapped between layers of shale
Low porosity & ultra-low permeability
Production via triggered fractures
Natural gas in coal (organic material converted to methane)
Permeability low
Production via natural fractures (“cleats”) in coal
Recovery rates low
Source: Shell
Types of Unconventional Gas
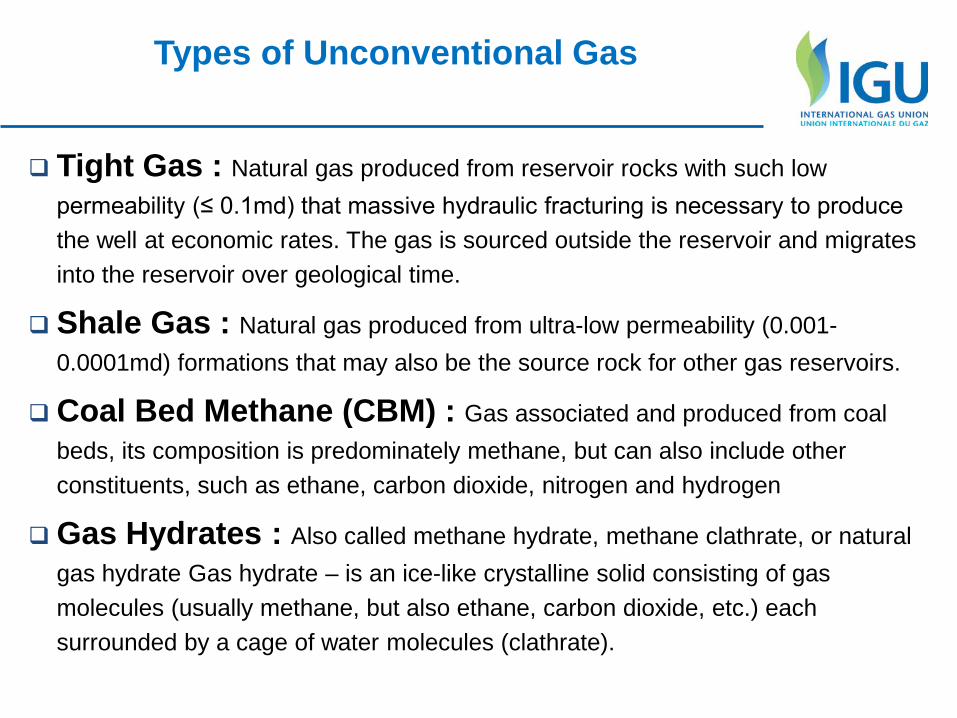
Types of Unconventional Gas
Tight Gas : Natural gas produced from reservoir rocks with such low permeability (≤ 0.1md) that massive hydraulic fracturing is necessary to produce the well at economic rates. The gas is sourced outside the reservoir and migrates into the reservoir over geological time.
Shale Gas : Natural gas produced from ultra-low permeability (0.001-0.0001md) formations that may also be the source rock for other gas reservoirs.
Coal Bed Methane (CBM) : Gas associated and produced from coal beds, its composition is predominately methane, but can also include other constituents, such as ethane, carbon dioxide, nitrogen and hydrogen
Gas Hydrates : Also called methane hydrate, methane clathrate, or natural gas hydrate Gas hydrate – is an ice-like crystalline solid consisting of gas molecules (usually methane, but also ethane, carbon dioxide, etc.) each surrounded by a cage of water molecules (clathrate).
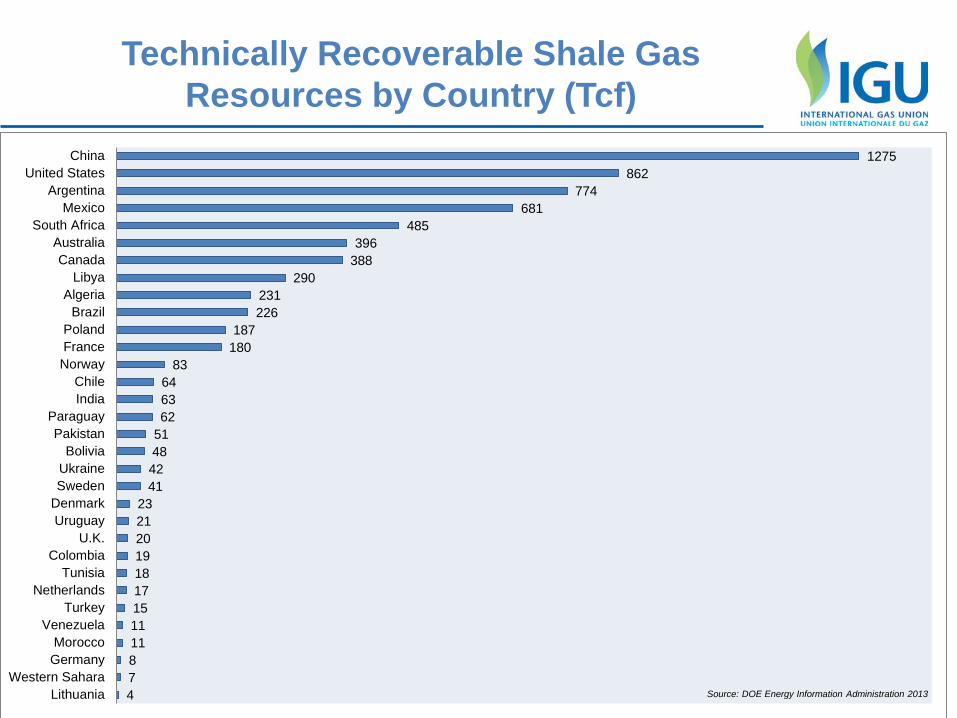
Technically Recoverable Shale Gas Resources by Country (Tcf)
4 7 8 11 11 15 17 18 19 20 21 23
41 42 48 51 62 63 64
83 180 187
226 231
290 388 396
485 681
774 862
1275
LithuaniaWestern Sahara
GermanyMorocco
VenezuelaTurkey
NetherlandsTunisia
ColombiaU.K.
UruguayDenmarkSwedenUkraineBolivia
PakistanParaguay
IndiaChile
NorwayFrancePoland
BrazilAlgeria
LibyaCanada
AustraliaSouth Africa
MexicoArgentina
United StatesChina
Source: DOE Energy Information Administration 2013
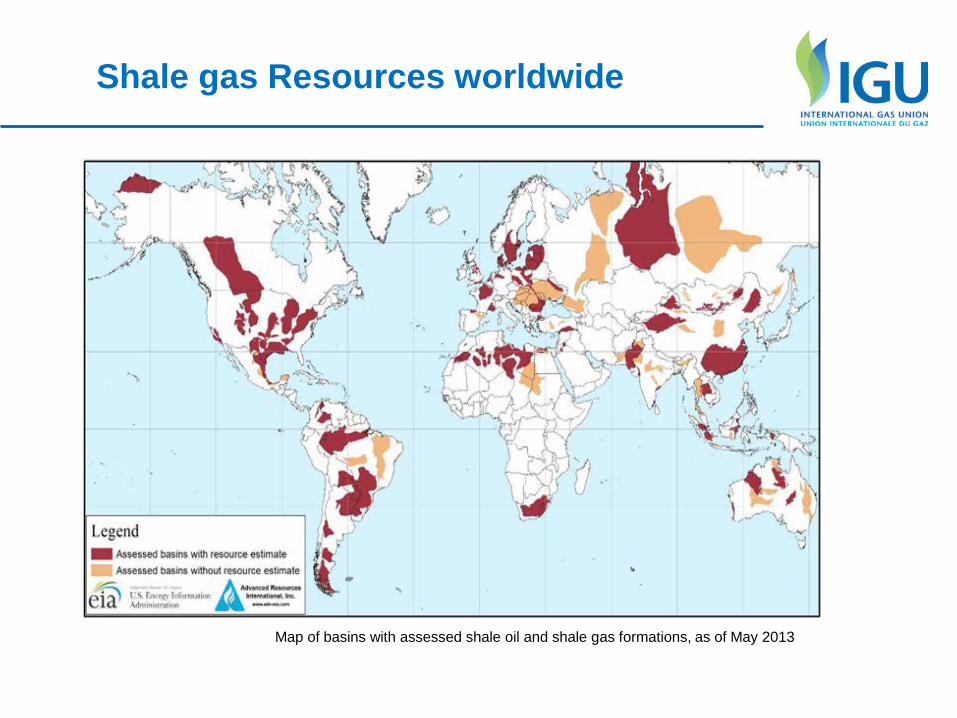
Map of basins with assessed shale oil and shale gas formations, as of May 2013
Shale gas Resources worldwide
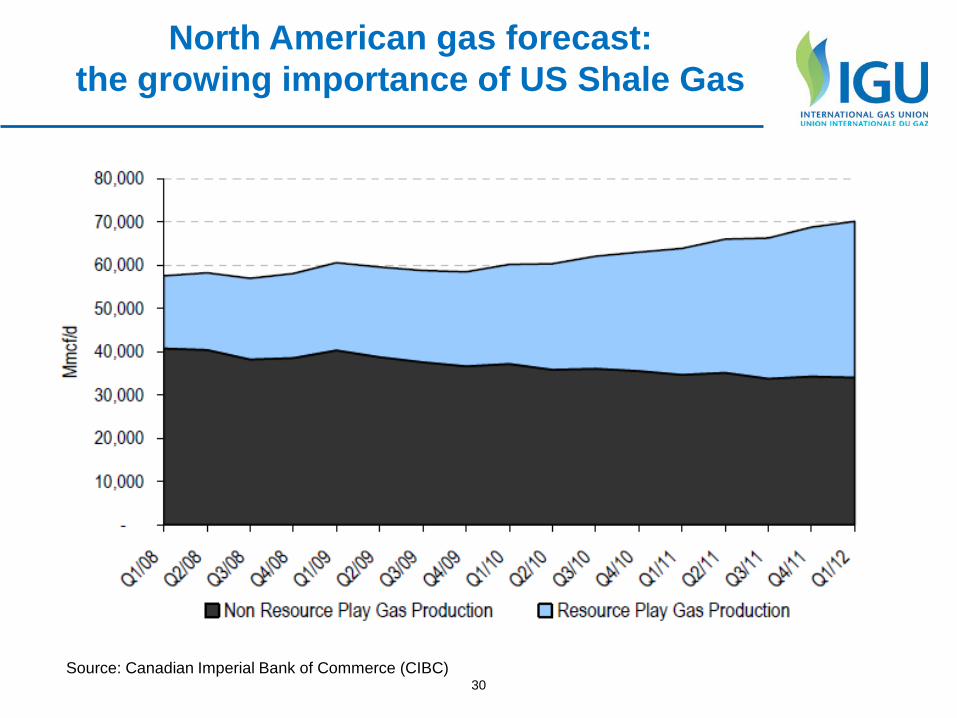
30 Source: Canadian Imperial Bank of Commerce (CIBC)
North American gas forecast: the growing importance of US Shale Gas
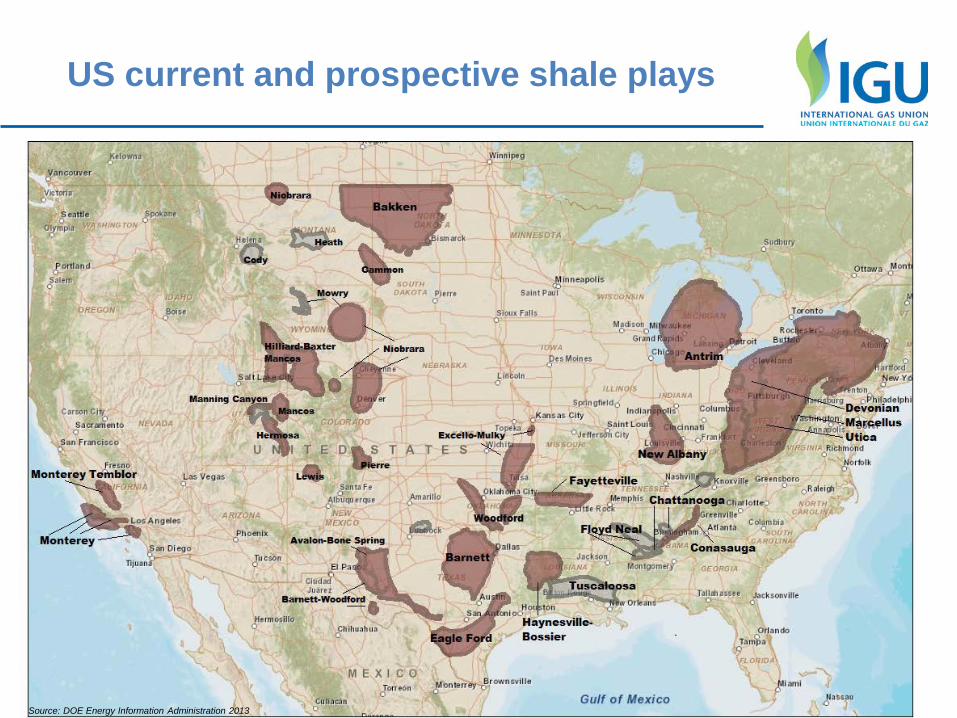
US current and prospective shale plays
Source: DOE Energy Information Administration 2013
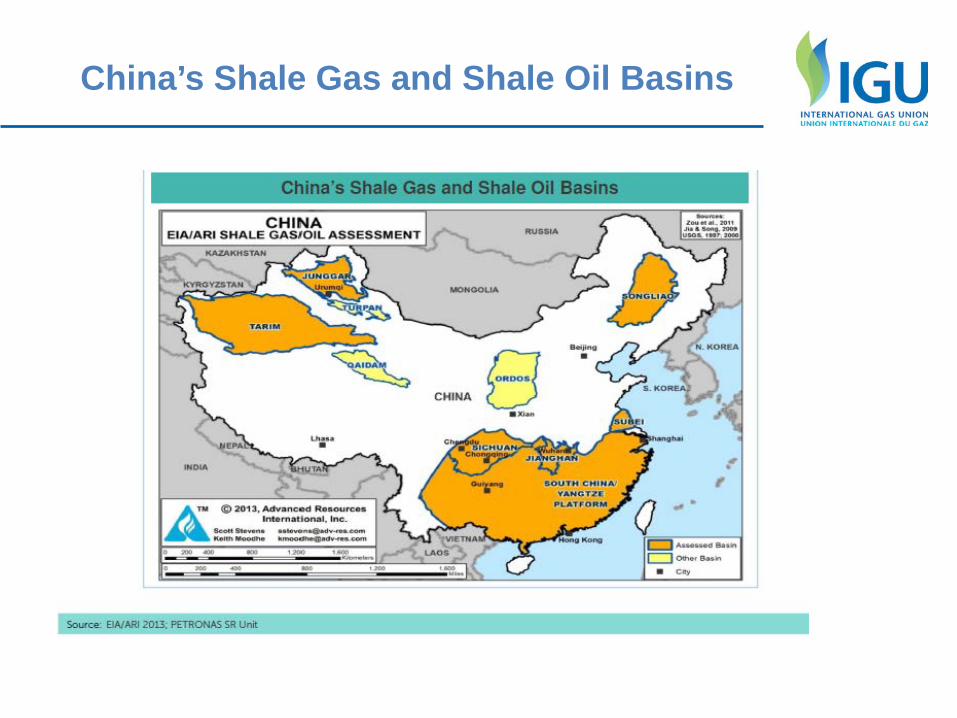
China’s Shale Gas and Shale Oil Basins
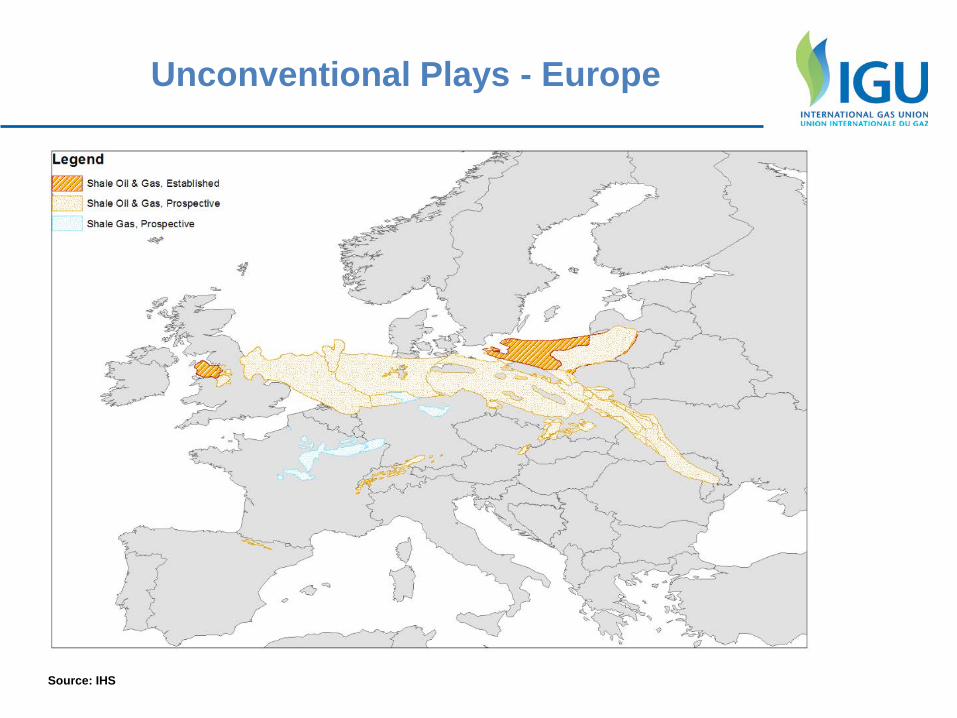
Unconventional Plays - Europe
Source: IHS
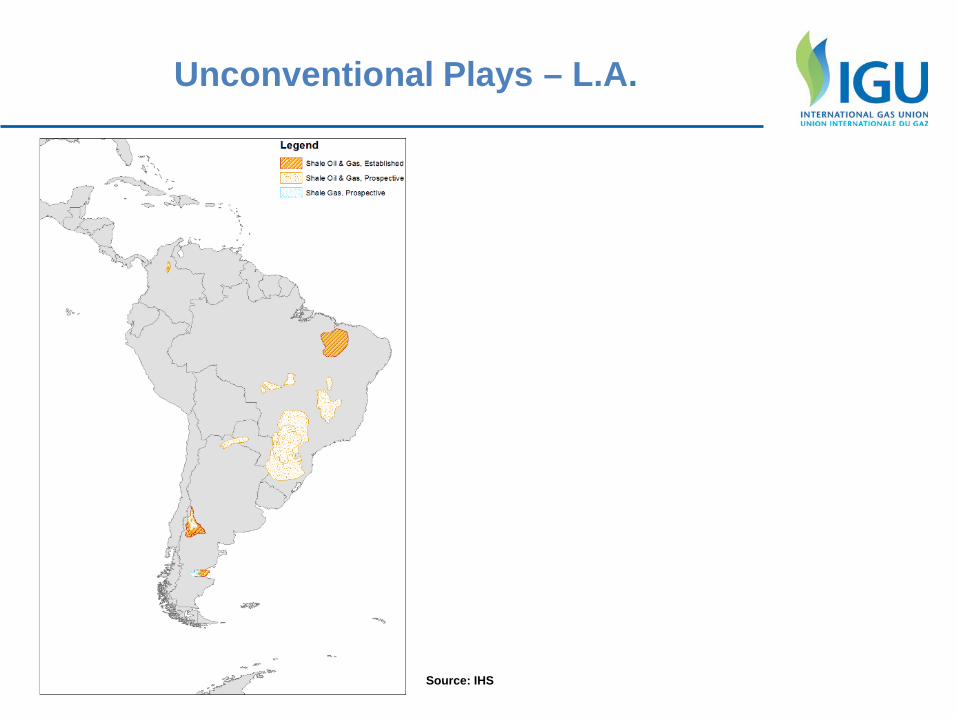
Unconventional Plays – L.A.
Source: IHS
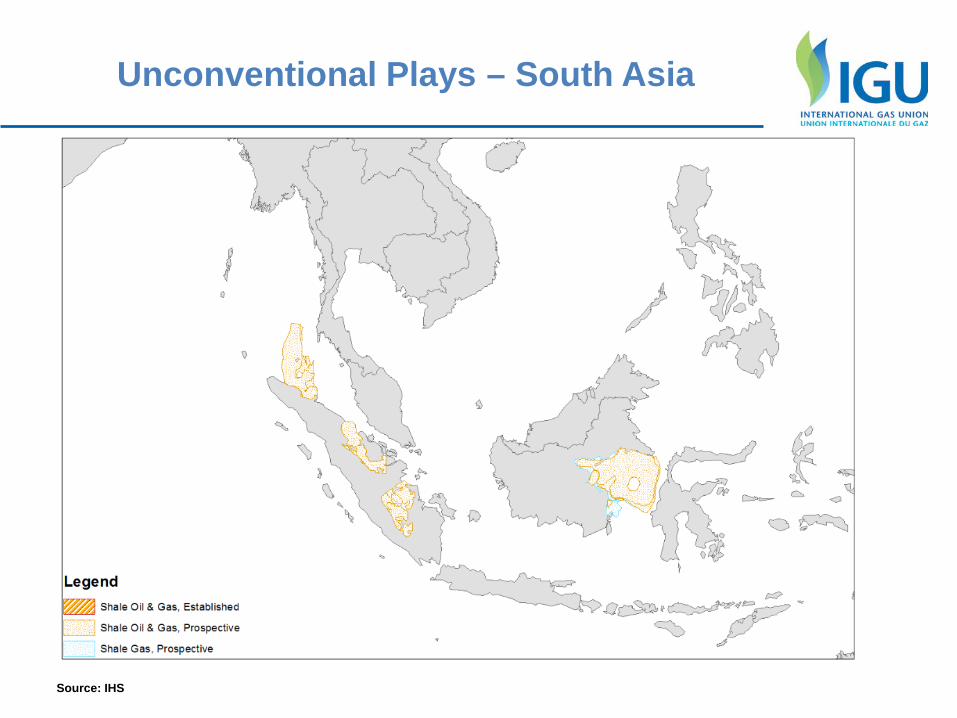
Unconventional Plays – South Asia
Source: IHS
New technics and developments
Brazilian Pre-Salt
Heterogeneous carbonate reservoirs, with highly variable petrophysical properties.
Pre-Salt fields mostly located at water depths exceeding 2,000m. Reservoirs depths at 5,000 to 6,000 meters below sea level. Natural gas associated with oil, in a gas-oil ratio between 200
and 300 m3/m3 Variable contents of CO2, ranging from 8 to 12% under an
extensive salt layer (up to 2,000 meters in some areas)
New technics and developments
Arctic Shelf in Russia
Special physical hurdles – lots of ice, extremely low temperatures, remote locations and long periods of darkness Challenges : Geographic Location Deep Water Large fields Ultra long distance
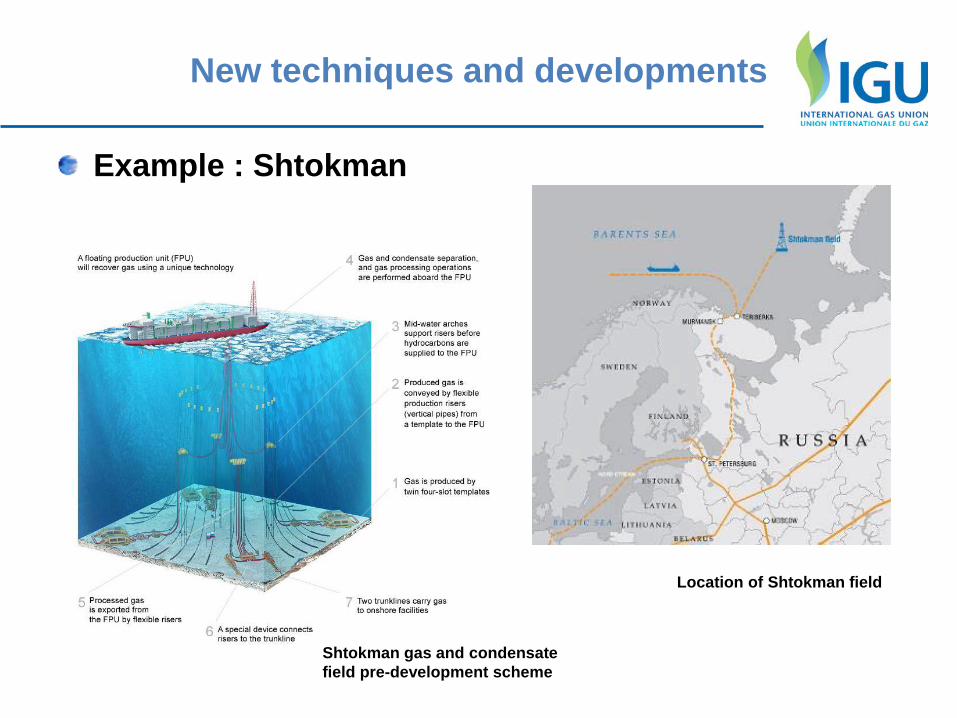
New techniques and developments
Example : Shtokman
Shtokman gas and condensate field pre-development scheme
Location of Shtokman field
Technical challenges
Deep gas (below 4500m) and ultra-deep gas (below 7500m)
Some examples Russia : structure of Achimov of the Urengoy fields China : Dina2 gas field in the Tarim basin Azerbaidjan : Shaz Deniz II Australia : Martell, Noblige and Larsen
HP/HT Sour gas (H2S and CO2)
Some examples US Norphlet play China Puguang field, with H2S at 15% Tunisia Hasdrubal plant
2. Transmission
Sources : WOC3 , Total G&P
Gas pipelines Main roads and infrastructures New projects Costs, losses, ..
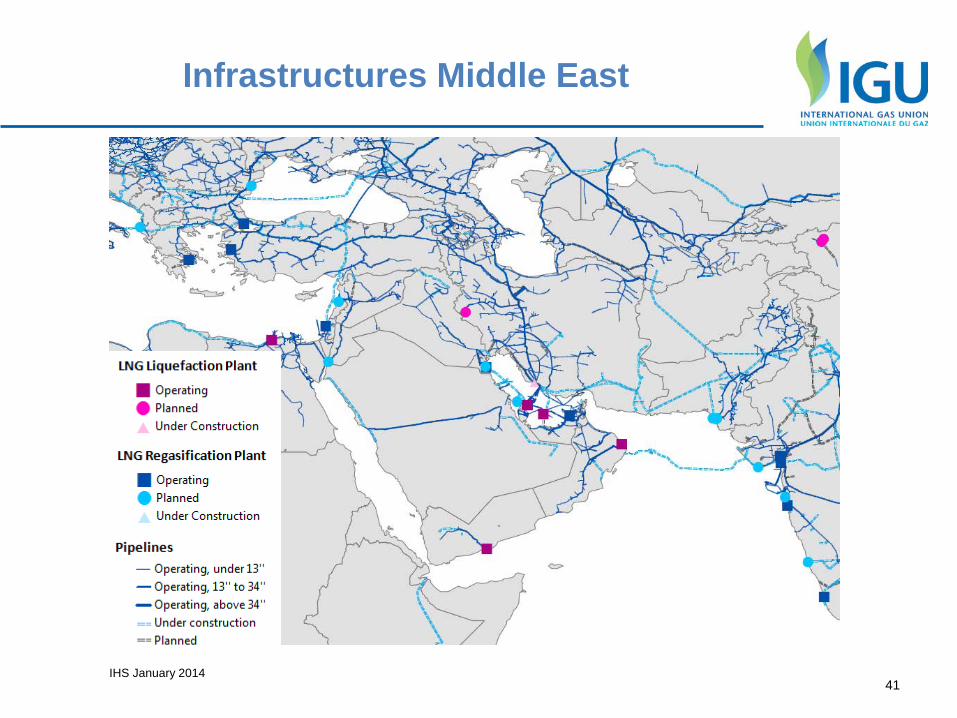
Infrastructures Middle East
41 IHS January 2014
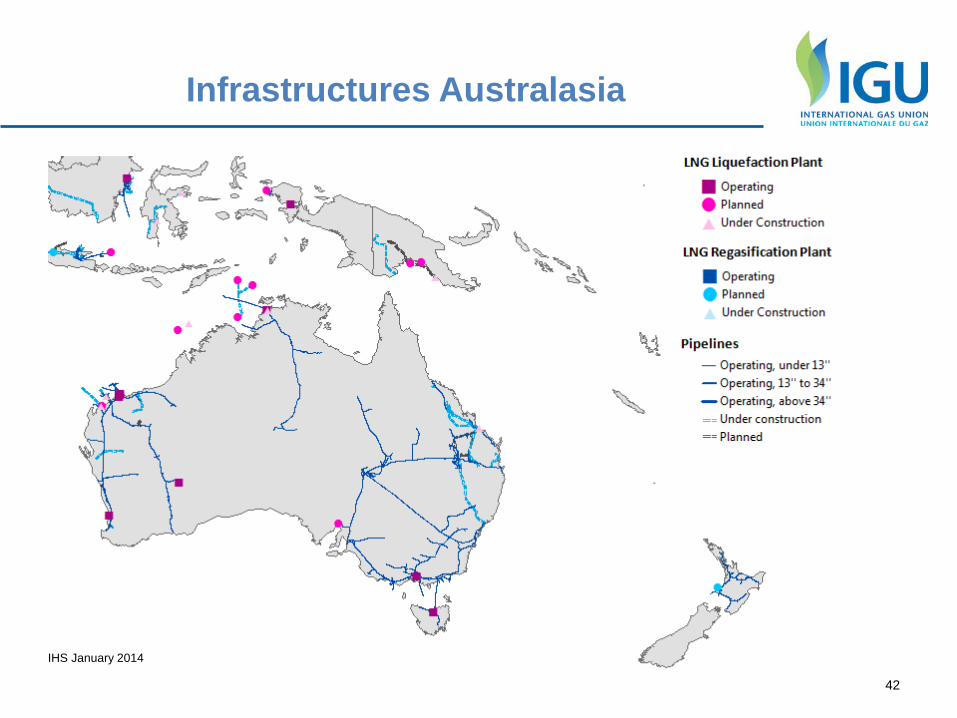
Infrastructures Australasia
42
IHS January 2014
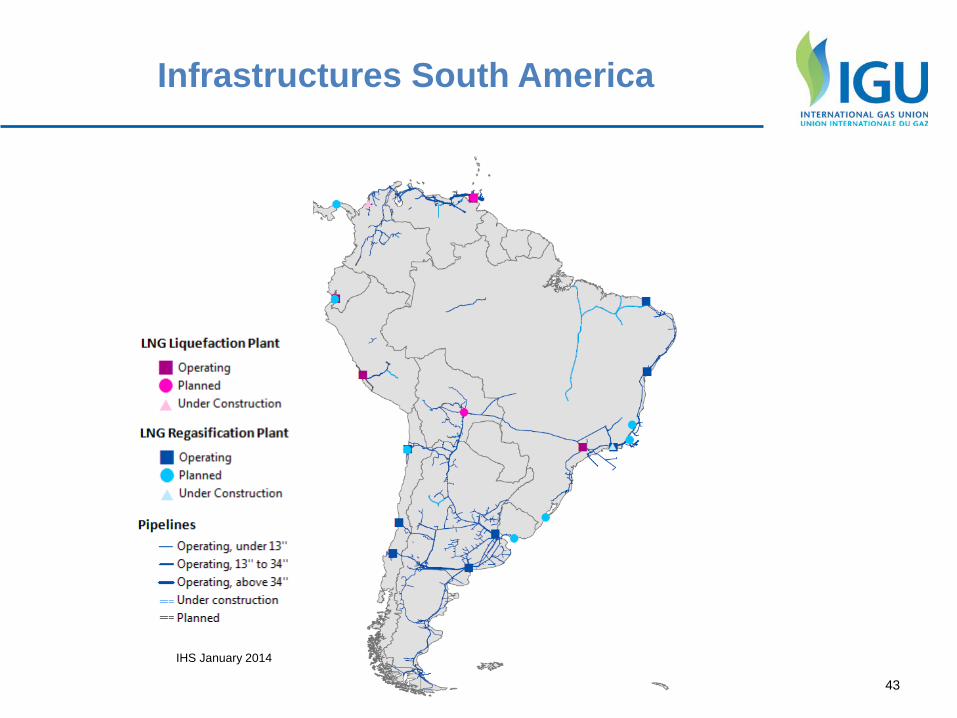
Infrastructures South America
Titre de la Présentation – Lieu et Pays – Date Jour Mois Année 43
IHS January 2014
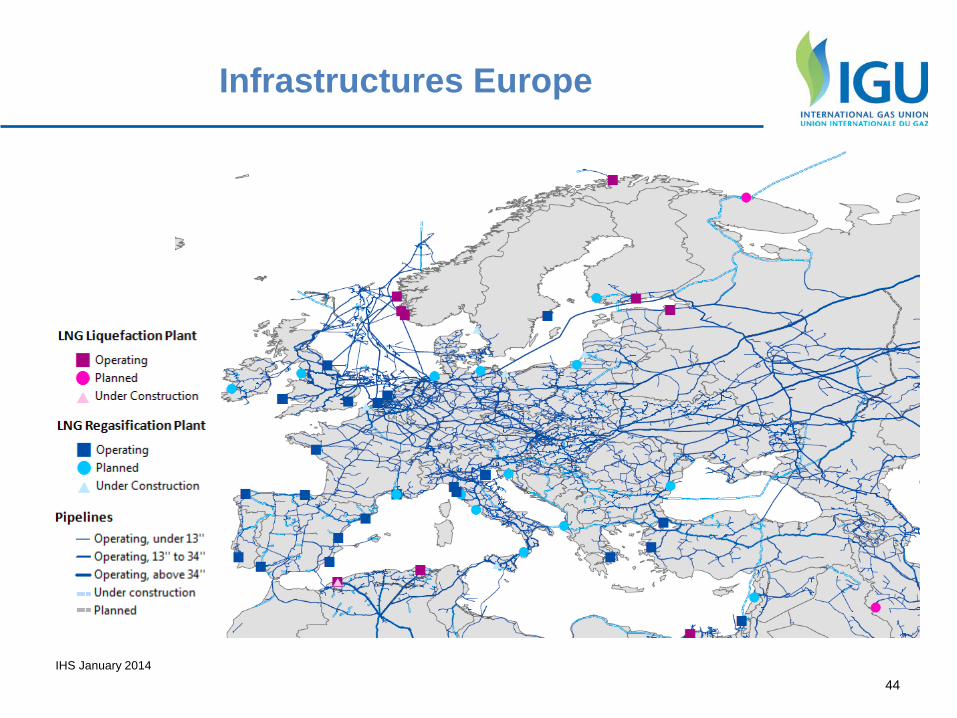
Infrastructures Europe
44 IHS January 2014
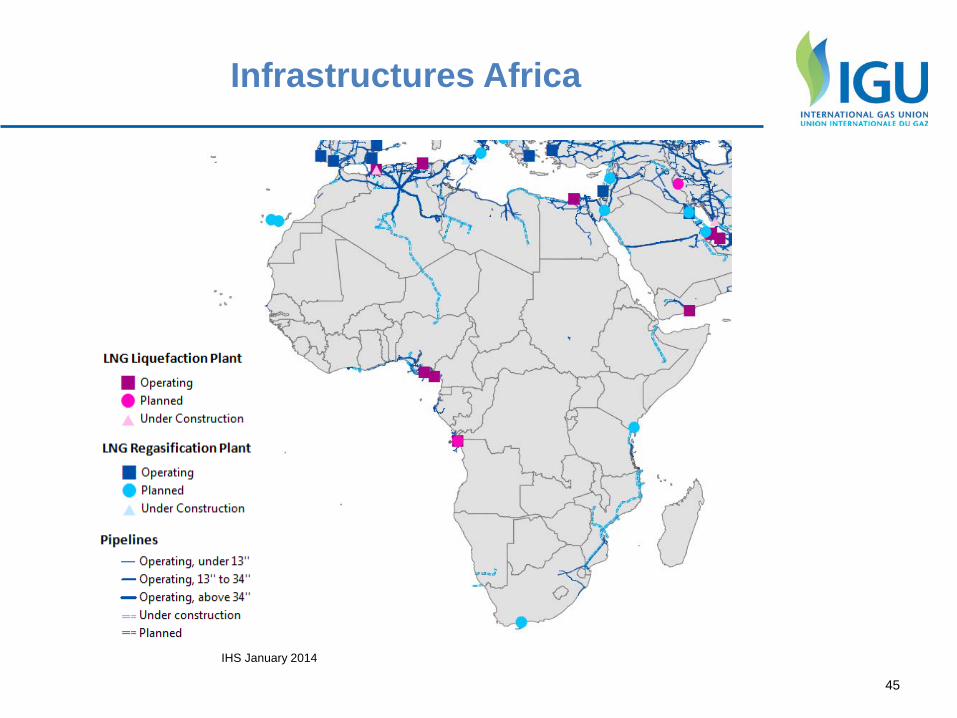
Infrastructures Africa
45
IHS January 2014
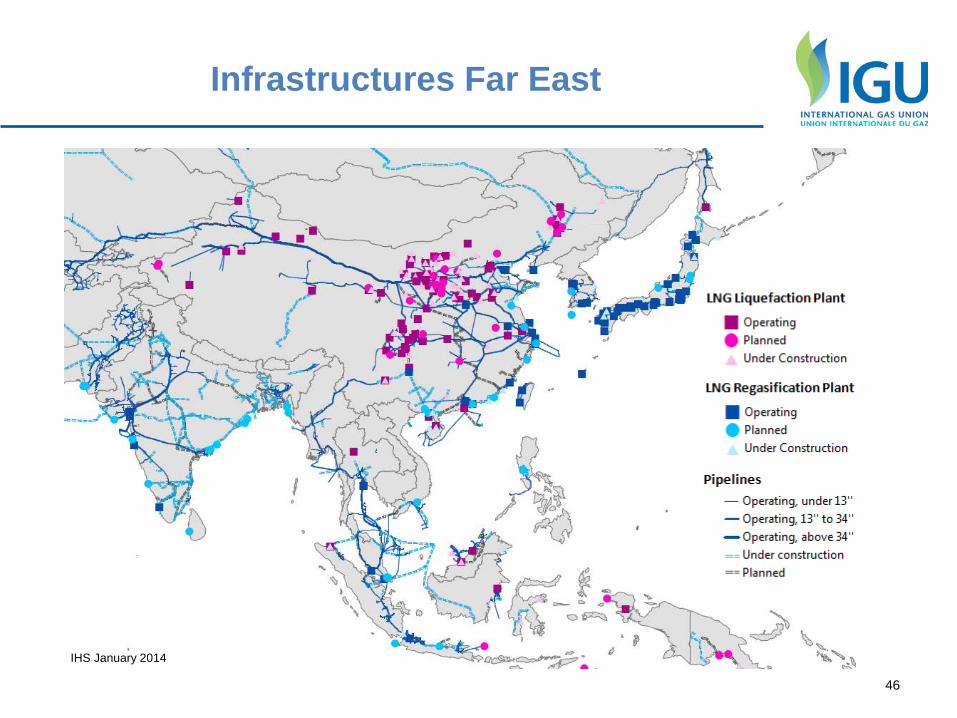
Infrastructures Far East
46
IHS January 2014
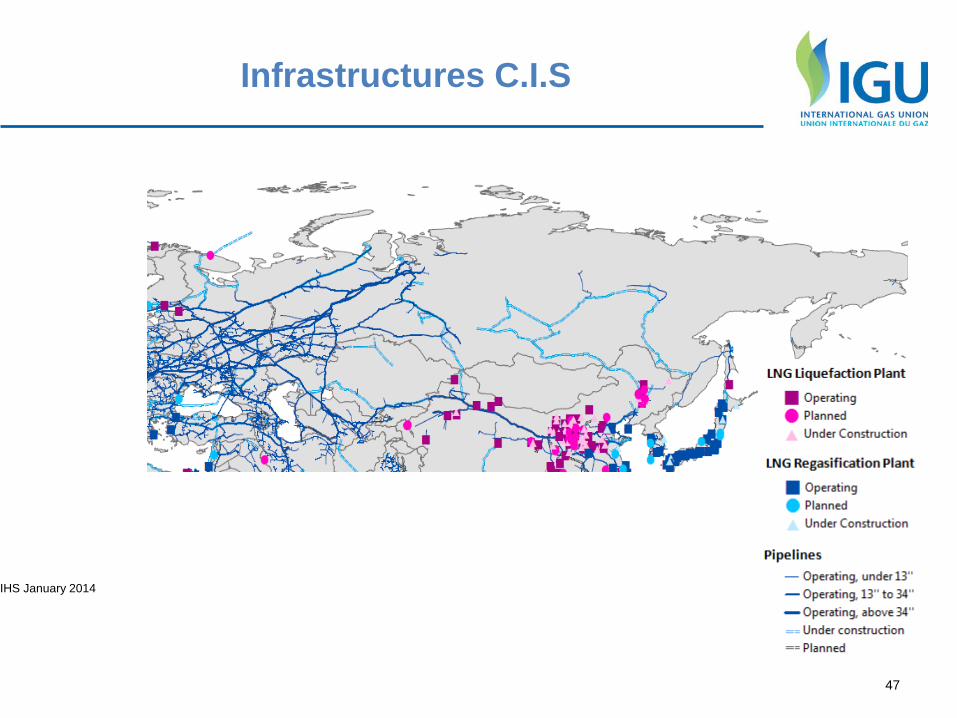
Infrastructures C.I.S
47
IHS January 2014
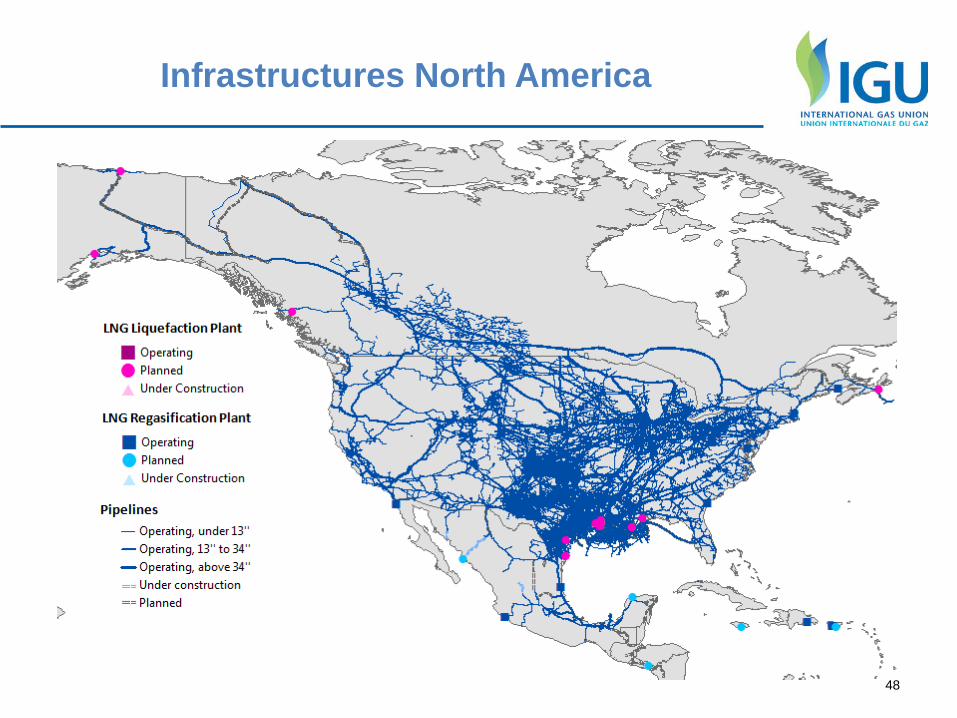
Infrastructures North America
48
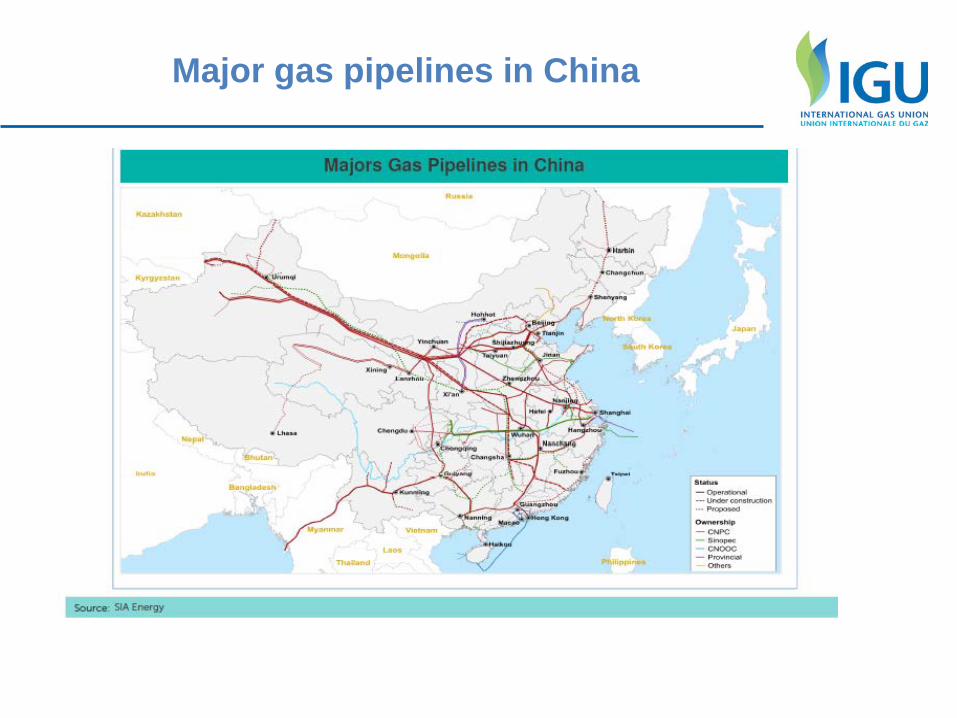
Major gas pipelines in China
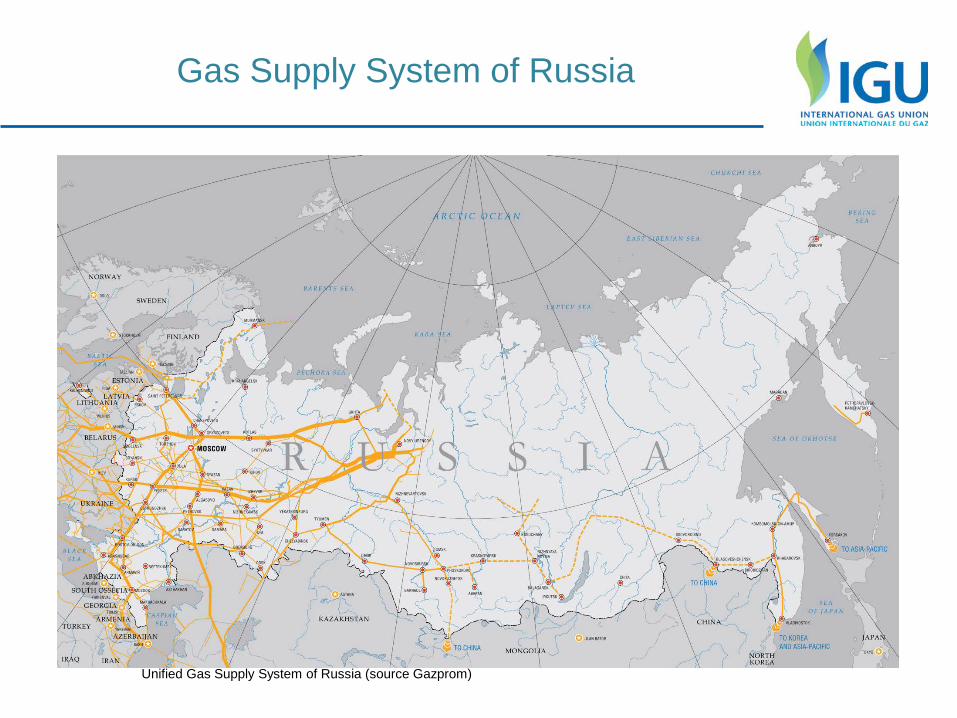
Gas Supply System of Russia
Unified Gas Supply System of Russia (source Gazprom)
3. LNG Sources : Total LNG group, PGCD special report
Trade movements Terminals for import, terminals for exports Liquefaction, regasification LNG Fleet LNG by road, fluvial
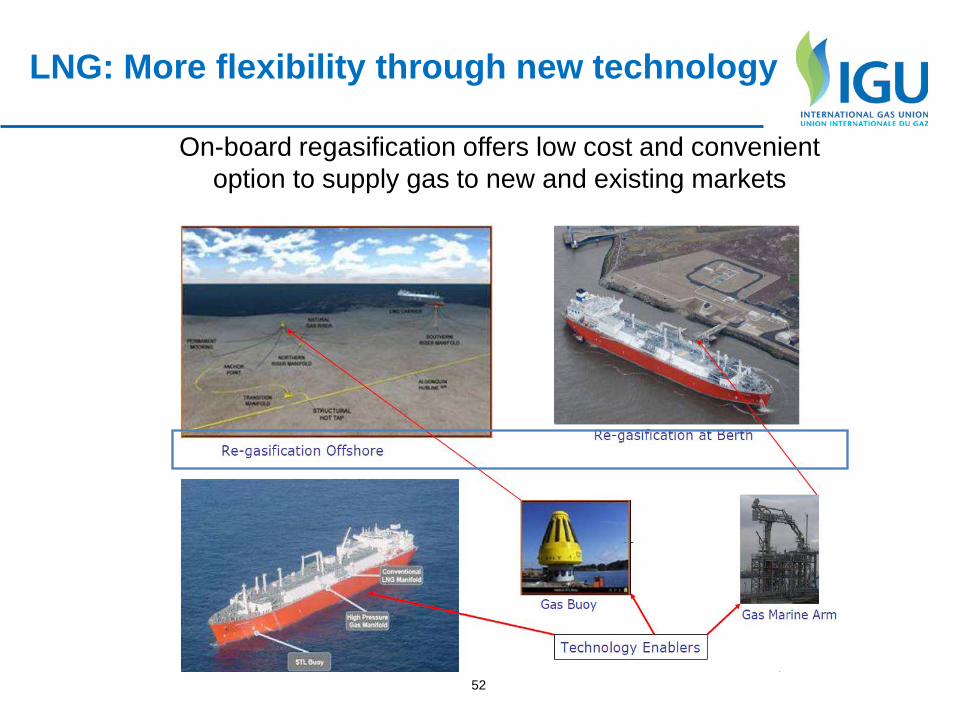
52
On-board regasification offers low cost and convenient option to supply gas to new and existing markets
LNG: More flexibility through new technology
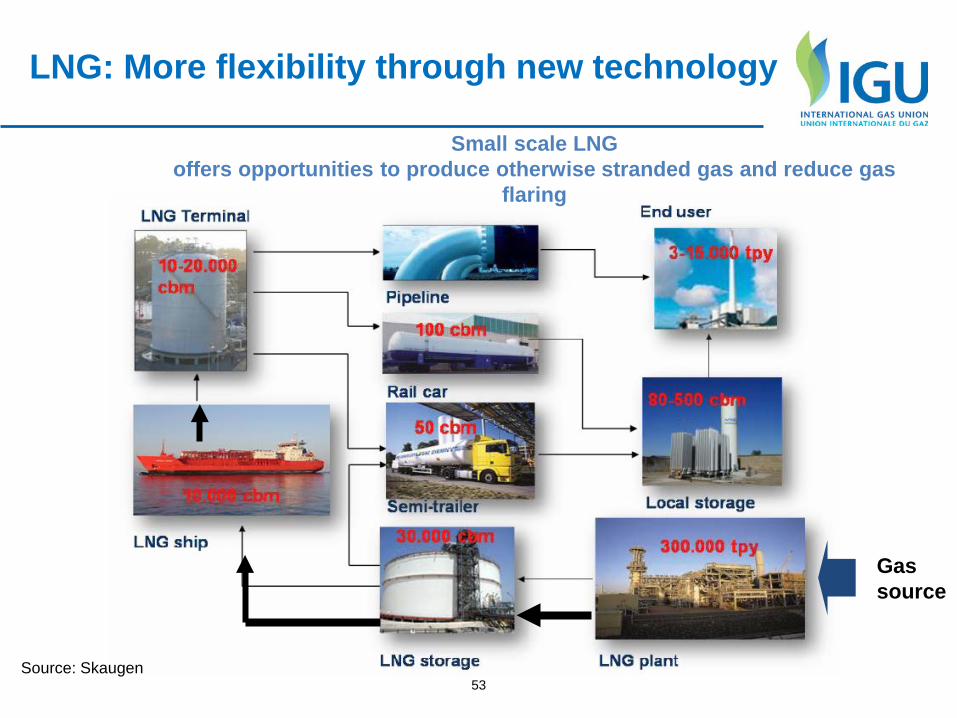
53 Source: Skaugen
Gas source
Small scale LNG offers opportunities to produce otherwise stranded gas and reduce gas
flaring
LNG: More flexibility through new technology
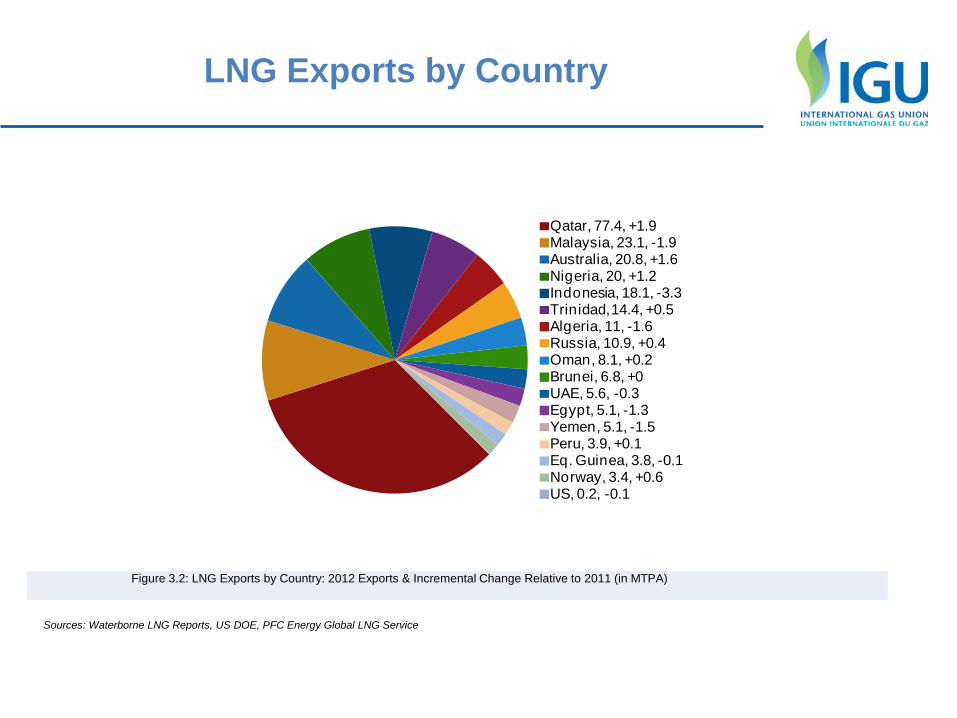
LNG Exports by Country
Qatar, 77.4, +1.9Malaysia, 23.1, -1.9Australia, 20.8, +1.6Nigeria, 20, +1.2Indonesia, 18.1, -3.3Trinidad, 14.4, +0.5Algeria, 11, -1.6Russia, 10.9, +0.4Oman, 8.1, +0.2Brunei, 6.8, +0UAE, 5.6, -0.3Egypt, 5.1, -1.3Yemen, 5.1, -1.5Peru, 3.9, +0.1Eq. Guinea, 3.8, -0.1Norway, 3.4, +0.6US, 0.2, -0.1
Figure 3.2: LNG Exports by Country: 2012 Exports & Incremental Change Relative to 2011 (in MTPA)
Sources: Waterborne LNG Reports, US DOE, PFC Energy Global LNG Service
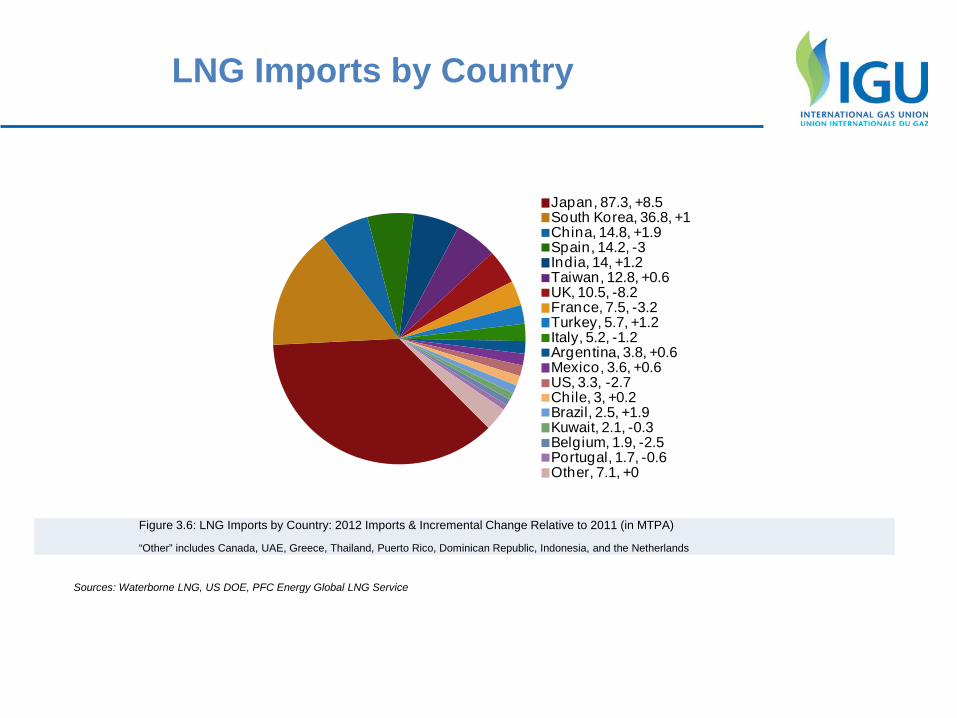
LNG Imports by Country
Japan, 87.3, +8.5South Korea, 36.8, +1China, 14.8, +1.9Spain, 14.2, -3India, 14, +1.2Taiwan, 12.8, +0.6UK, 10.5, -8.2France, 7.5, -3.2Turkey, 5.7, +1.2Italy, 5.2, -1.2Argentina, 3.8, +0.6Mexico, 3.6, +0.6US, 3.3, -2.7Chile, 3, +0.2Brazil, 2.5, +1.9Kuwait, 2.1, -0.3Belgium, 1.9, -2.5Portugal, 1.7, -0.6Other, 7.1, +0
Figure 3.6: LNG Imports by Country: 2012 Imports & Incremental Change Relative to 2011 (in MTPA)
“Other” includes Canada, UAE, Greece, Thailand, Puerto Rico, Dominican Republic, Indonesia, and the Netherlands
Sources: Waterborne LNG, US DOE, PFC Energy Global LNG Service
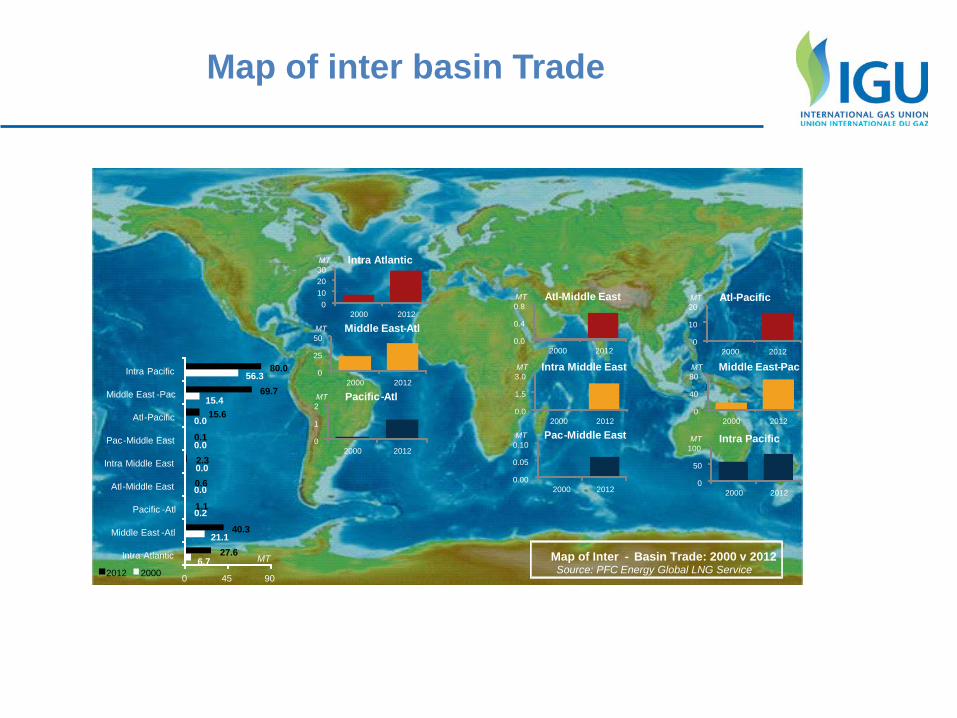
Map of inter basin Trade
6.7
21.1
0.2
0.0
0.0
0.0
0.0
15.4
56.3
27.6
40.3
1.1
0.6
2.3
0.1
15.6
69.7
80.0
0 45 90
Intra Atlantic
Middle East - Atl
Pacific - Atl
Atl - Middle East
Intra Middle East
Pac - Middle East
Atl - Pacific
Middle East - Pac
Intra Pacific
MT 2012 2000
0 10 20 30
2000 2012
MT Intra Atlantic
0.0
0.4
0.8
2000 2012
MT Atl - Middle East
0
10
20
2000 2012
MT Atl - Pacific
0
25
50
2000 2012
MT Middle East - Atl
0.0
1.5
3.0
2000 2012
MT Intra Middle East
0
40
80
2000 2012
MT Middle East - Pac
0
1
2
2000 2012
MT Pacific - Atl
0.00
0.05
0.10
2000 2012
MT Pac - Middle East
0
50
100
2000 2012
MT Intra Pacific
Map of Inter - Basin Trade: 2000 v 2012 Source: PFC Energy Global LNG Service
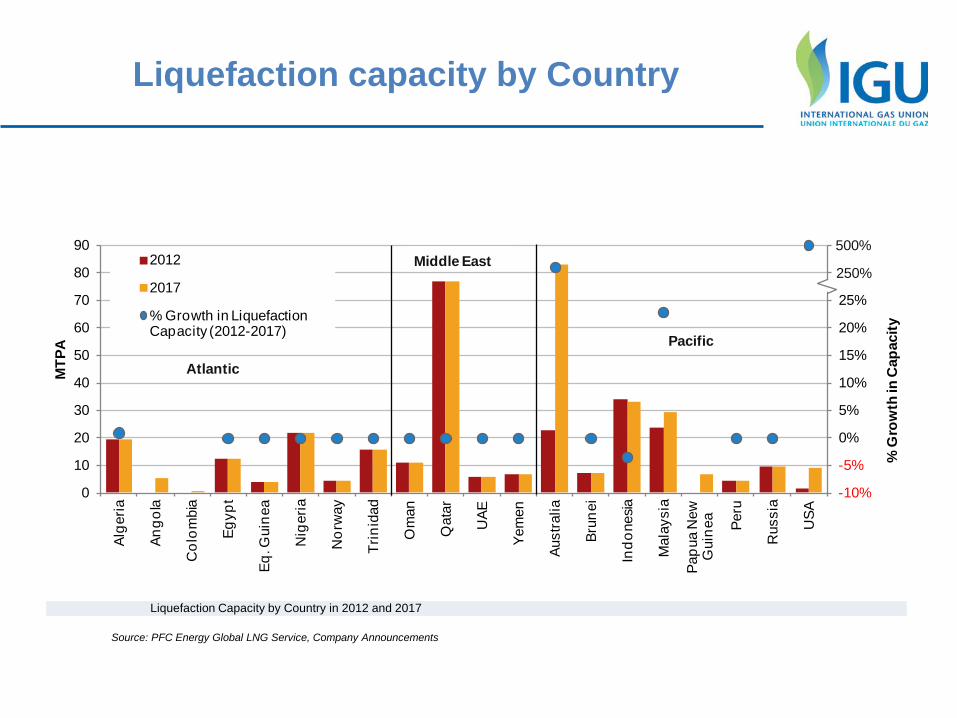
Liquefaction capacity by Country
-10%
-5%
0%
5%
10%
15%
20%
25%
30%
35%
0
10
20
30
40
50
60
70
80
90
Alge
ria
Ango
la
Col
ombi
a
Egyp
t
Eq. G
uine
a
Nig
eria
Nor
way
Trin
idad
Om
an
Qat
ar
UAE
Yem
en
Aust
ralia
Brun
ei
Indo
nesia
Mal
aysi
a
Papu
a N
ew
Gui
nea
Peru
Rus
sia
USA
% G
row
th in
Cap
acity
MTP
A
2012
2017
% Growth in Liquefaction Capacity (2012-2017)
Middle East
Pacific
Atlantic
250%
500%
Liquefaction Capacity by Country in 2012 and 2017
Source: PFC Energy Global LNG Service, Company Announcements
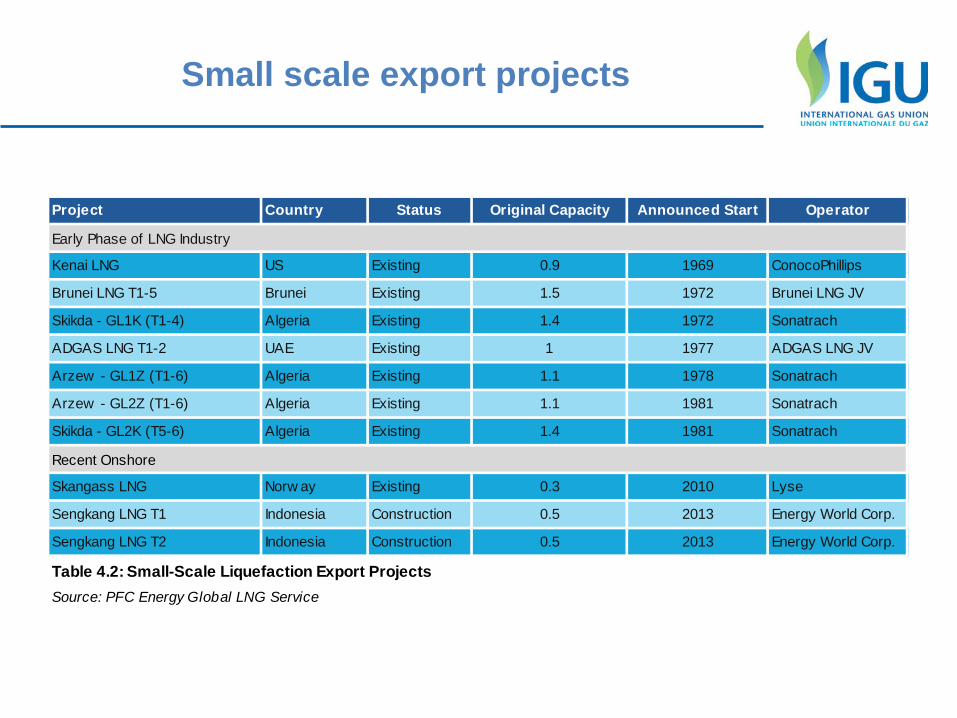
Small scale export projects
Project Country Status Original Capacity Announced Start Operator
Kenai LNG US Existing 0.9 1969 ConocoPhillips
Brunei LNG T1-5 Brunei Existing 1.5 1972 Brunei LNG JV
Skikda - GL1K (T1-4) Algeria Existing 1.4 1972 Sonatrach
ADGAS LNG T1-2 UAE Existing 1 1977 ADGAS LNG JV
Arzew - GL1Z (T1-6) Algeria Existing 1.1 1978 Sonatrach
Arzew - GL2Z (T1-6) Algeria Existing 1.1 1981 Sonatrach
Skikda - GL2K (T5-6) Algeria Existing 1.4 1981 Sonatrach
Skangass LNG Norw ay Existing 0.3 2010 Lyse
Sengkang LNG T1 Indonesia Construction 0.5 2013 Energy World Corp.
Sengkang LNG T2 Indonesia Construction 0.5 2013 Energy World Corp.
Early Phase of LNG Industry
Recent Onshore
Table 4.2: Small-Scale Liquefaction Export ProjectsSource: PFC Energy Global LNG Service
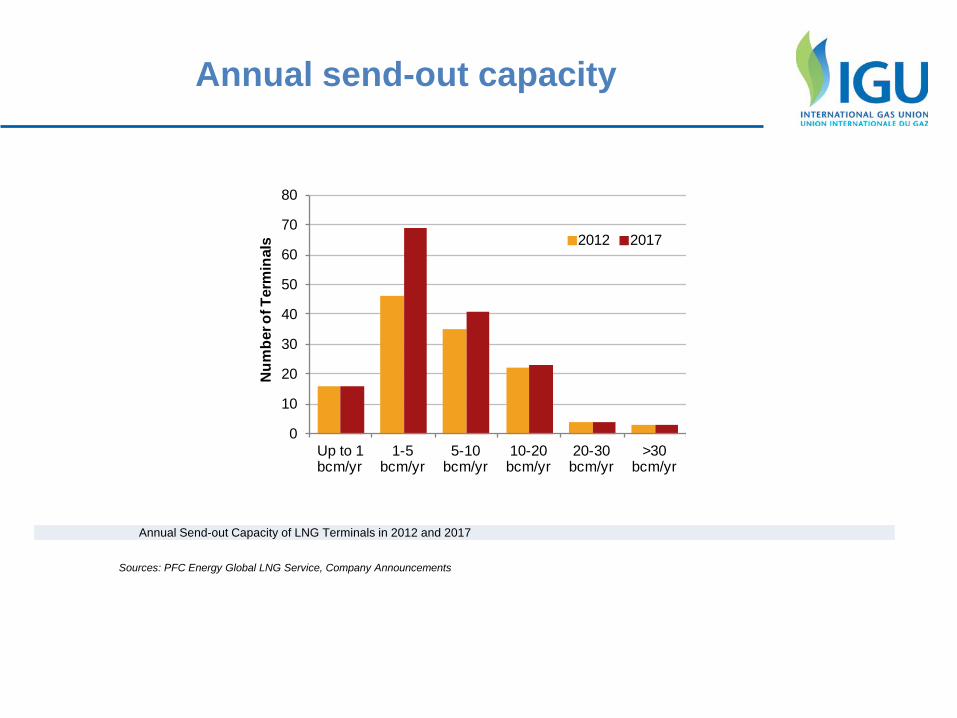
Annual send-out capacity
0
10
20
30
40
50
60
70
80
Up to 1 bcm/yr
1-5 bcm/yr
5-10 bcm/yr
10-20 bcm/yr
20-30 bcm/yr
>30 bcm/yr
Num
ber o
f Ter
min
als 2012 2017
Annual Send-out Capacity of LNG Terminals in 2012 and 2017
Sources: PFC Energy Global LNG Service, Company Announcements
Receiving terminal import capacity
0%
50%
100%
150%
200%
250%
300%
0
50
100
150
200
Arge
ntin
aBr
azil
Can
ada
Chi
leD
om. R
ep.
Mex
ico
Puer
to R
ico
US
Chi
naIn
dia
Indo
nesia
Japa
nKo
rea
Taiw
anTh
aila
ndM
alay
sia
Sing
apor
eBe
lgiu
mFr
ance
Gre
ece
Italy
Net
herla
nds
Nor
way
Portu
gal
Spai
nSw
eden
Turk
ey UK
Lith
uani
aPo
land
Kuw
ait
UAE
Isra
el
MTP
A
2012 2017 % Growth
Americas Asia Europe Middle East
Receiving Terminal Import Capacity by Country in 2012 and 2017
Source: PFC Energy Global LNG Service, Company Announcements
LNG fleet
05
101520253035404550
1969
1973
1976
1978
1980
1983
1985
1989
1991
1993
1995
1997
1999
2001
2003
2005
2007
2009
2011
Q-Max
Q-Flex
Floating Regas & Storage
Conventional
#of v
esse
ls
Global LNG Fleet by Year of Delivery
Sources: PFC Energy Global LNG Service
05
1015202530
Nak
ilat
Gol
ar L
NG
MIS
CM
aran
G.M
.Bo
nny G
.T.
MO
LBG
Gro
upTe
ekay
LN
GG
asLo
g LN
GN
WSS
SCN
YK L
ine
BW G
as/M
arub
eni
NG
SCO
Dyn
agas
BP S
hipp
ing
Hyu
ndai
M.M
.K
Line
Knut
sen
OAS
Hoe
gh L
NG
Chi
na L
NG
S.C
.JC
Nak
ilat
Teek
ay/N
akila
tTe
ekay
/Mar
uben
iSo
vcom
flot
Alm
i Gas
Che
vron
S.C
.H
ypro
c S.
C.
SK S
hipp
ing
BW G
asAw
ilco
Brun
ei G
.C.
Exce
lera
te E
nerg
yC
ardi
ff M
arin
eBr
unei
She
ll T.
CPC
/NYK
/MO
LEx
mar
/Exc
eler
ate
Han
jin S
hipp
ing
Kore
a Li
neM
aran
/Nak
ilat
MO
L/N
YK/T
eeka
yN
akila
t/Ove
rsea
sPr
oNav
/Nak
ilat
Sovc
omflo
t/NYK
Om
an S
.C.
Chi
na S
.G.
MO
L/C
hina
S.G
.
# of
ves
sels On Order
Current Fleet
Source: PFC Energy Global LNG Service
New-build Orders (3 or more vessels)
Liquefaction capacity: operating and planned
020406080
100120140160180200
Operating Capacity
Under ConstructionCapacityPlanned Capacity *
62 IHS January 2014
MMty
* All on-going planned projects till 2023
Liquefaction capacity: operating and planned
63
IHS January 2014
MMty Operating Capacity Under Construction Capacity
Planned Capacity *
Africa 62,1 4,7 187,5
Australasia 24,95 68,7 152,47
C.I.S. 10,61 10 153,77
Europe 4,76 19,1
Far East 74,7 21,45 38,68
Latin America 19,92 0,54 33,01
Middle East 100,25 10,8 59,15
North America 9 449,63
Total 297.29 125,19 1093,31 * All on-going planned projects till 2023
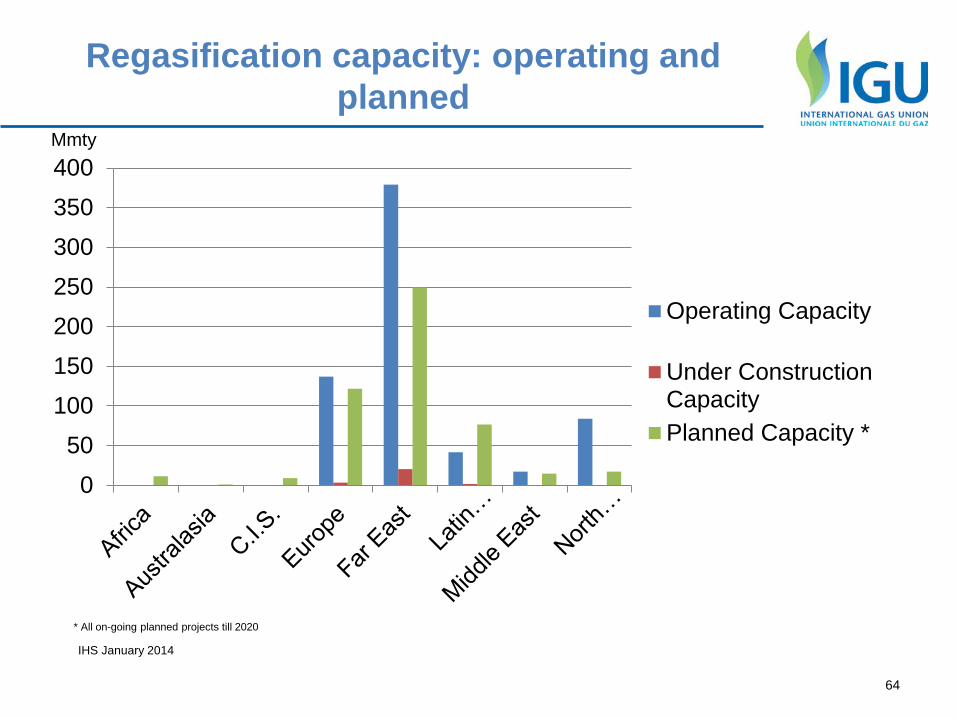
Regasification capacity: operating and planned
050
100150200250300350400
Operating Capacity
Under ConstructionCapacityPlanned Capacity *
64
IHS January 2014
Mmty
* All on-going planned projects till 2020
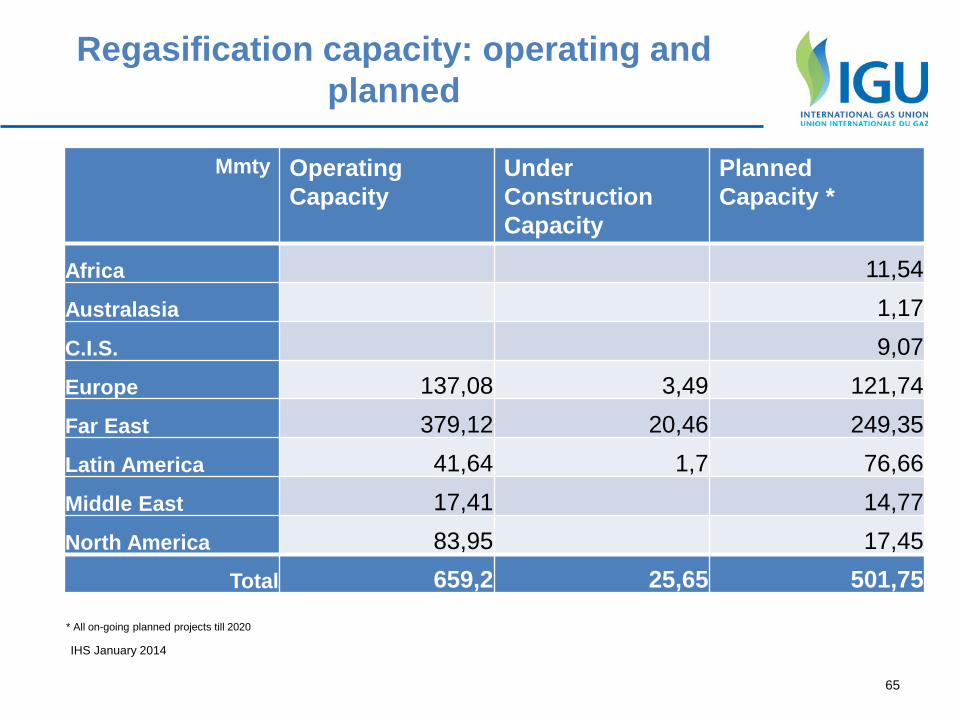
Regasification capacity: operating and planned
65
IHS January 2014
Mmty Operating Capacity
Under Construction Capacity
Planned Capacity *
Africa 11,54 Australasia 1,17 C.I.S. 9,07 Europe 137,08 3,49 121,74 Far East 379,12 20,46 249,35 Latin America 41,64 1,7 76,66 Middle East 17,41 14,77 North America 83,95 17,45
Total 659,2 25,65 501,75
* All on-going planned projects till 2020
66
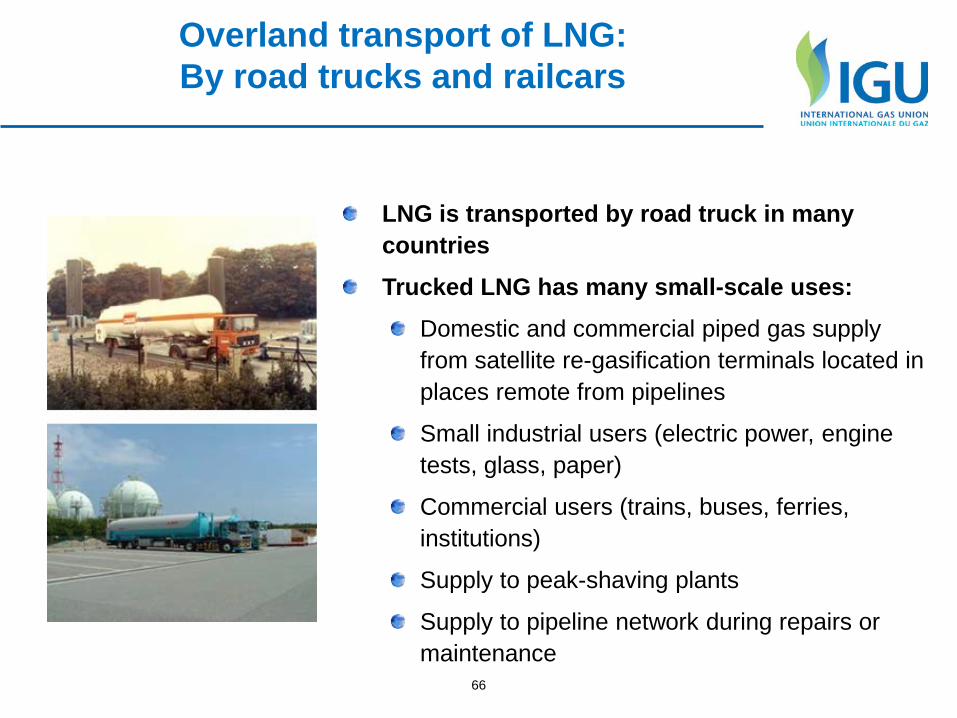
Overland transport of LNG: By road trucks and railcars
LNG is transported by road truck in many countries Trucked LNG has many small-scale uses:
Domestic and commercial piped gas supply from satellite re-gasification terminals located in places remote from pipelines
Small industrial users (electric power, engine tests, glass, paper)
Commercial users (trains, buses, ferries, institutions)
Supply to peak-shaving plants
Supply to pipeline network during repairs or maintenance
4. Underground Gas Storage
Source : WOC2 database
Types of UGS, per countries : distribution, WGV, maps per type : distribution, WGV, TPA Projects
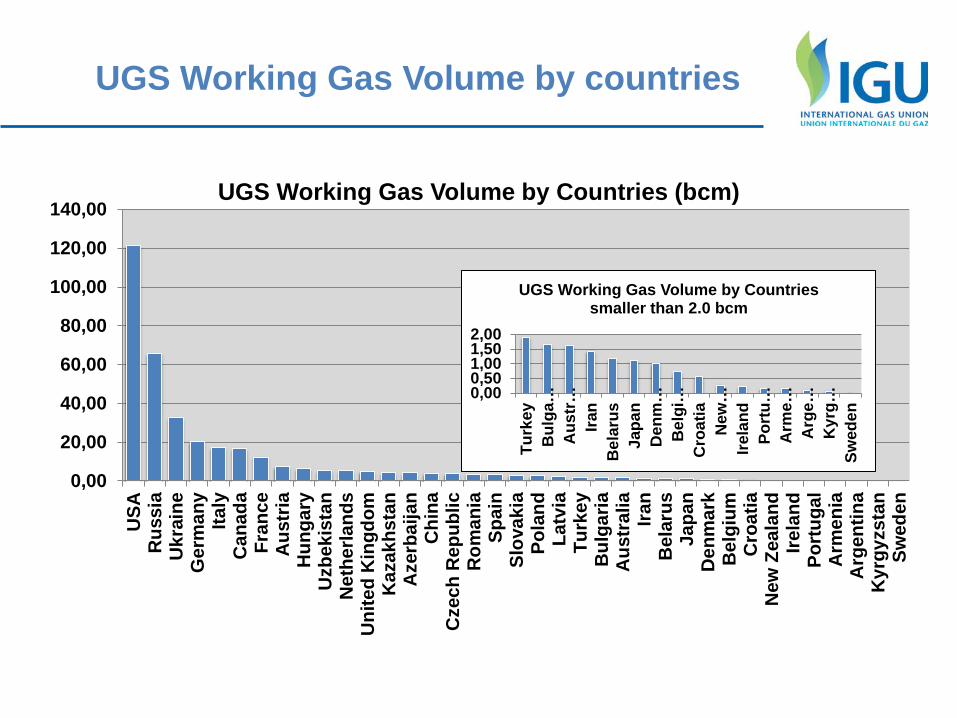
UGS Working Gas Volume by countries
0,00
20,00
40,00
60,00
80,00
100,00
120,00
140,00
USA
Rus
sia
Ukr
aine
Ger
man
yIta
lyC
anad
aFr
ance
Aus
tria
Hun
gary
Uzb
ekis
tan
Net
herla
nds
Uni
ted
Kin
gdom
Kaz
akhs
tan
Aze
rbai
jan
Chi
naC
zech
Rep
ublic
Rom
ania
Spai
nSl
ovak
iaPo
land
Latv
iaTu
rkey
Bul
garia
Aus
tral
iaIra
nB
elar
usJa
pan
Den
mar
kB
elgi
umC
roat
iaN
ew Z
eala
ndIre
land
Port
ugal
Arm
enia
Arg
entin
aK
yrgy
zsta
nSw
eden
UGS Working Gas Volume by Countries (bcm)
0,000,501,001,502,00
Turk
eyB
ulga
…A
ustr
…Ira
nB
elar
usJa
pan
Den
m…
Bel
gi…
Cro
atia
New
…Ire
land
Port
u…A
rme…
Arg
e…K
yrg…
Swed
en
UGS Working Gas Volume by Countries smaller than 2.0 bcm
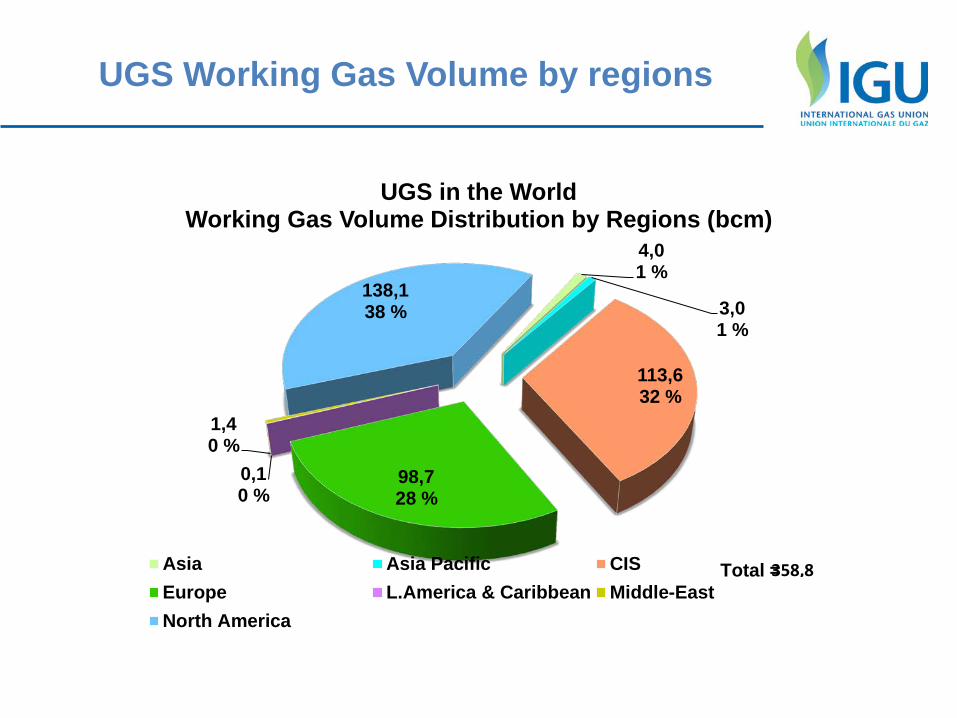
UGS Working Gas Volume by regions
4,0 1 %
3,0 1 %
113,6 32 %
98,7 28 %
0,1 0 %
1,4 0 %
138,1 38 %
UGS in the World Working Gas Volume Distribution by Regions (bcm)
Asia Asia Pacific CISEurope L.America & Caribbean Middle-EastNorth America
358,8 Total =
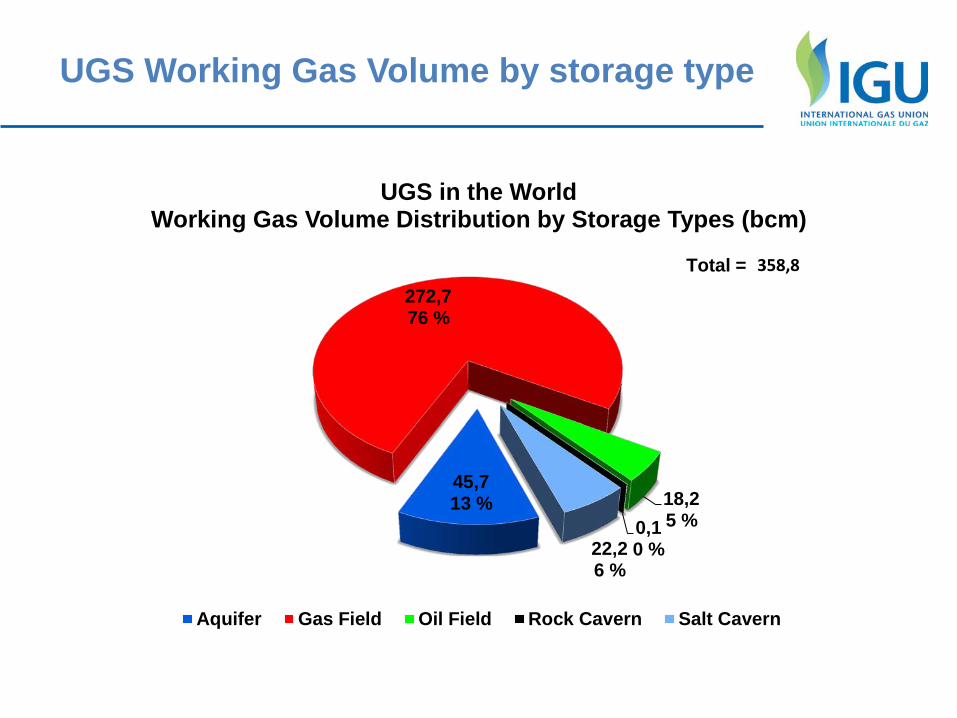
UGS Working Gas Volume by storage type
45,7 13 %
272,7 76 %
18,2 5 % 0,1
0 % 22,2 6 %
UGS in the World Working Gas Volume Distribution by Storage Types (bcm)
Aquifer Gas Field Oil Field Rock Cavern Salt Cavern
358,8 Total =
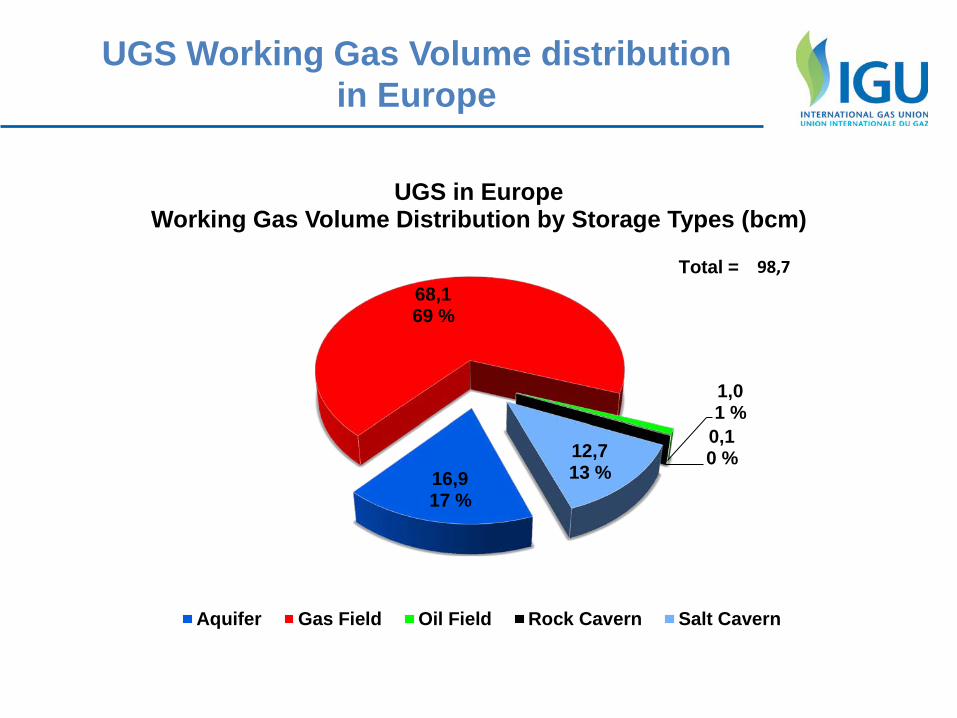
UGS Working Gas Volume distribution in Europe
16,9 17 %
68,1 69 %
1,0 1 %
0,1 0 % 12,7
13 %
UGS in Europe Working Gas Volume Distribution by Storage Types (bcm)
Aquifer Gas Field Oil Field Rock Cavern Salt Cavern
98,7 Total =
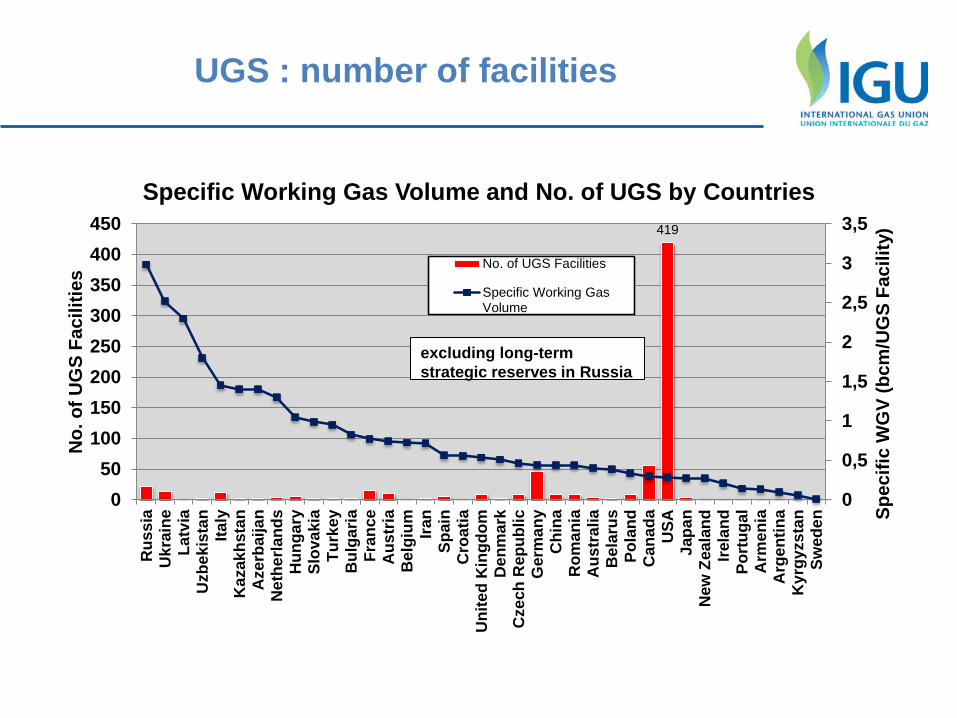
UGS : number of facilities
419
0
0,5
1
1,5
2
2,5
3
3,5
050
100150200250300350400450
Rus
sia
Ukr
aine
Latv
iaU
zbek
ista
nIta
lyK
azak
hsta
nA
zerb
aija
nN
ethe
rland
sH
unga
rySl
ovak
iaTu
rkey
Bul
garia
Fran
ceA
ustr
iaB
elgi
um Iran
Spai
nC
roat
iaU
nite
d K
ingd
omD
enm
ark
Cze
ch R
epub
licG
erm
any
Chi
naR
oman
iaA
ustr
alia
Bel
arus
Pola
ndC
anad
aU
SAJa
pan
New
Zea
land
Irela
ndPo
rtug
alA
rmen
iaA
rgen
tina
Kyr
gyzs
tan
Swed
en Spec
ific
WG
V (b
cm/U
GS
Faci
lity)
No.
of U
GS
Faci
litie
s
Specific Working Gas Volume and No. of UGS by Countries
No. of UGS Facilities
Specific Working GasVolume
excluding long-term strategic reserves in Russia
Age of UGS facilities
6 6 29 30
10
44 56 58
80 58
73
45 21
4
4
4 2
8
11 2
3 14
27 12
14
6
0
20
40
60
80
100
120
140
No.
of U
GS
Faci
litie
s
Age of storages
Abandoned mine Aquifer Gas Field Oil Field Rock Cavern Salt Cavern
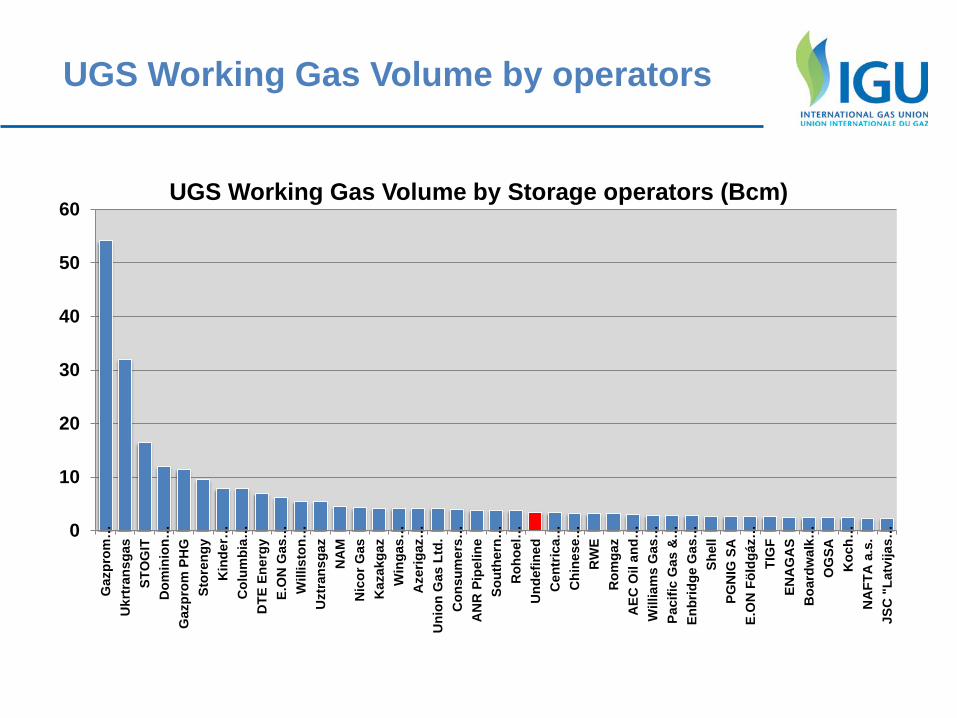
UGS Working Gas Volume by operators
0
10
20
30
40
50
60
Gaz
prom
…U
krtr
ansg
asST
OG
ITD
omin
ion…
Gaz
prom
PH
GSt
oren
gyK
inde
r…C
olum
bia…
DTE
Ene
rgy
E.O
N G
as…
Will
isto
n…U
ztra
nsga
zN
AM
Nic
or G
asK
azak
gaz
Win
gas…
Aze
rigaz
…U
nion
Gas
Ltd
.C
onsu
mer
s…A
NR
Pip
elin
eSo
uthe
rn…
Roh
oel…
Und
efin
edC
entr
ica…
Chi
nese
…R
WE
Rom
gaz
AEC
Oil
and…
Will
iam
s G
as…
Paci
fic G
as &
…En
brid
ge G
as…
Shel
lPG
NIG
SA
E.O
N F
öldg
áz…
TIG
FEN
AG
AS
Boa
rdw
alk…
OG
SAK
och…
NA
FTA
a.s
.JS
C "
Latv
ijas…
UGS Working Gas Volume by Storage operators (Bcm)
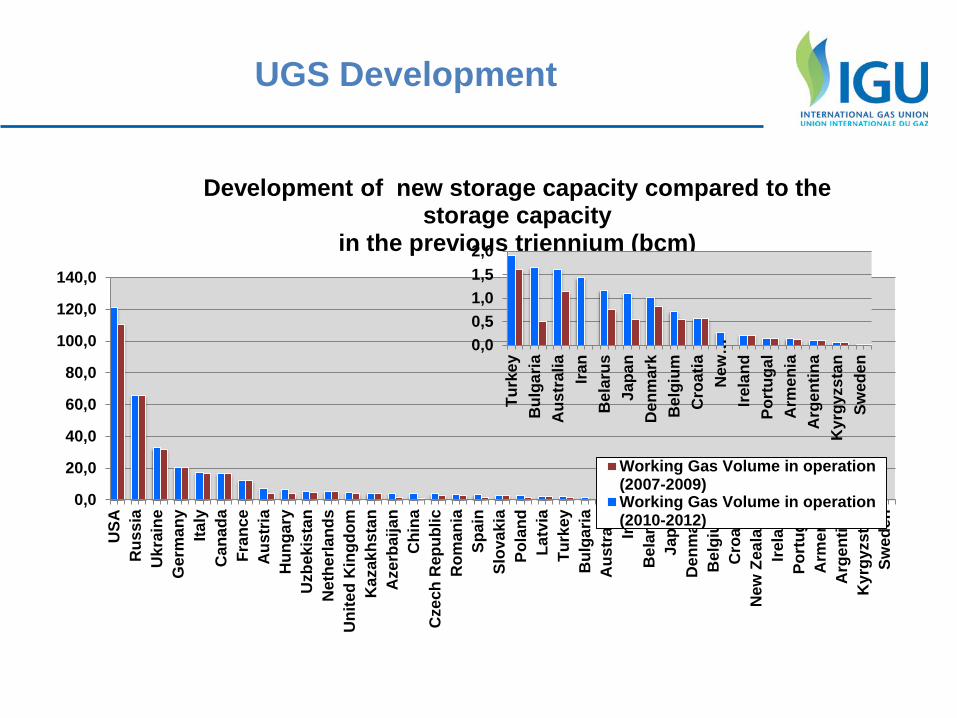
UGS Development
0,0
20,0
40,0
60,0
80,0
100,0
120,0
140,0
USA
Rus
sia
Ukr
aine
Ger
man
yIta
lyC
anad
aFr
ance
Aus
tria
Hun
gary
Uzb
ekis
tan
Net
herla
nds
Uni
ted
Kin
gdom
Kaz
akhs
tan
Aze
rbai
jan
Chi
naC
zech
Rep
ublic
Rom
ania
Spai
nSl
ovak
iaPo
land
Latv
iaTu
rkey
Bul
garia
Aus
tral
iaIra
nB
elar
usJa
pan
Den
mar
kB
elgi
umC
roat
iaN
ew Z
eala
ndIre
land
Port
ugal
Arm
enia
Arg
entin
aK
yrgy
zsta
nSw
eden
Development of new storage capacity compared to the storage capacity
in the previous triennium (bcm)
Working Gas Volume in operation(2007-2009)Working Gas Volume in operation(2010-2012)
0,00,51,01,52,0
Turk
eyB
ulga
riaA
ustr
alia
Iran
Bel
arus
Japa
nD
enm
ark
Bel
gium
Cro
atia
New
…Ire
land
Port
ugal
Arm
enia
Arg
entin
aK
yrgy
zsta
nSw
eden
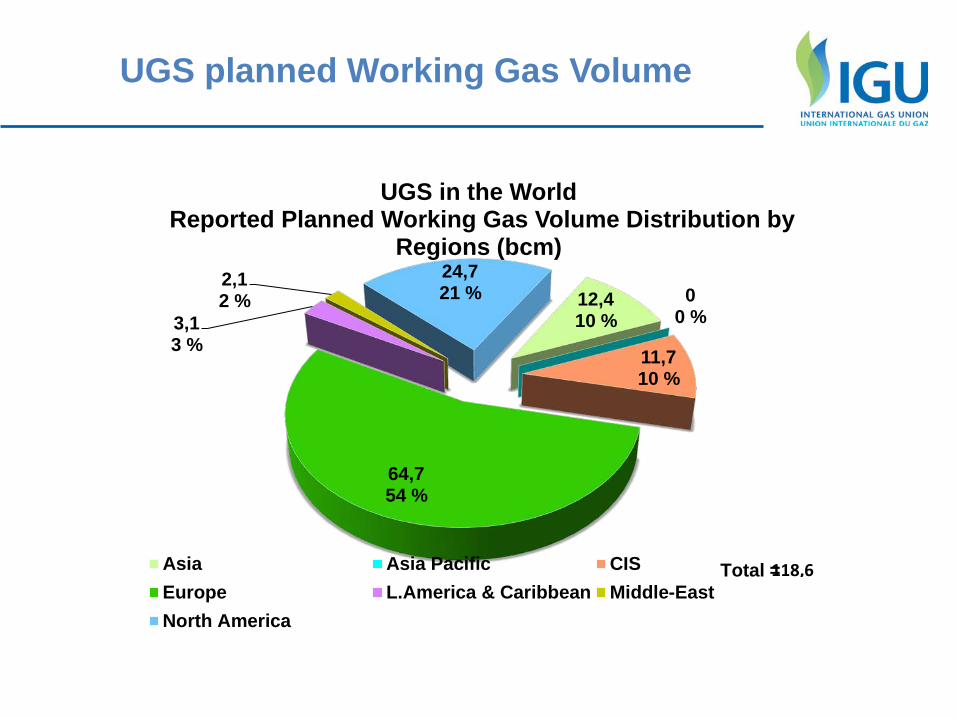
UGS planned Working Gas Volume
12,4 10 %
0 0 %
11,7 10 %
64,7 54 %
3,1 3 %
2,1 2 %
24,7 21 %
UGS in the World Reported Planned Working Gas Volume Distribution by
Regions (bcm)
Asia Asia Pacific CISEurope L.America & Caribbean Middle-EastNorth America
118,6 Total =
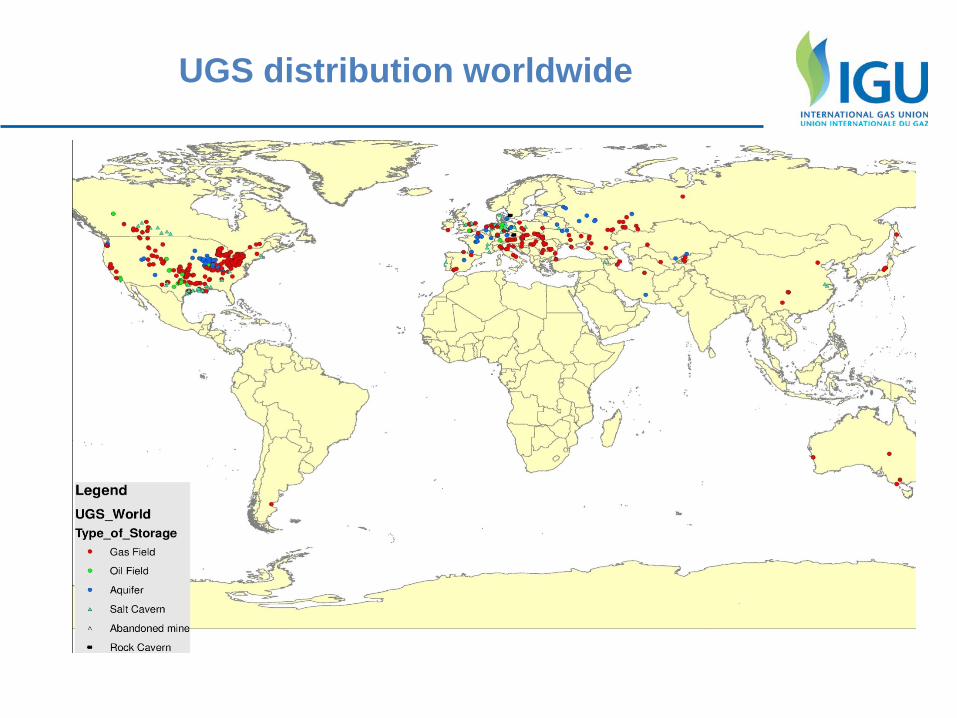
UGS distribution worldwide
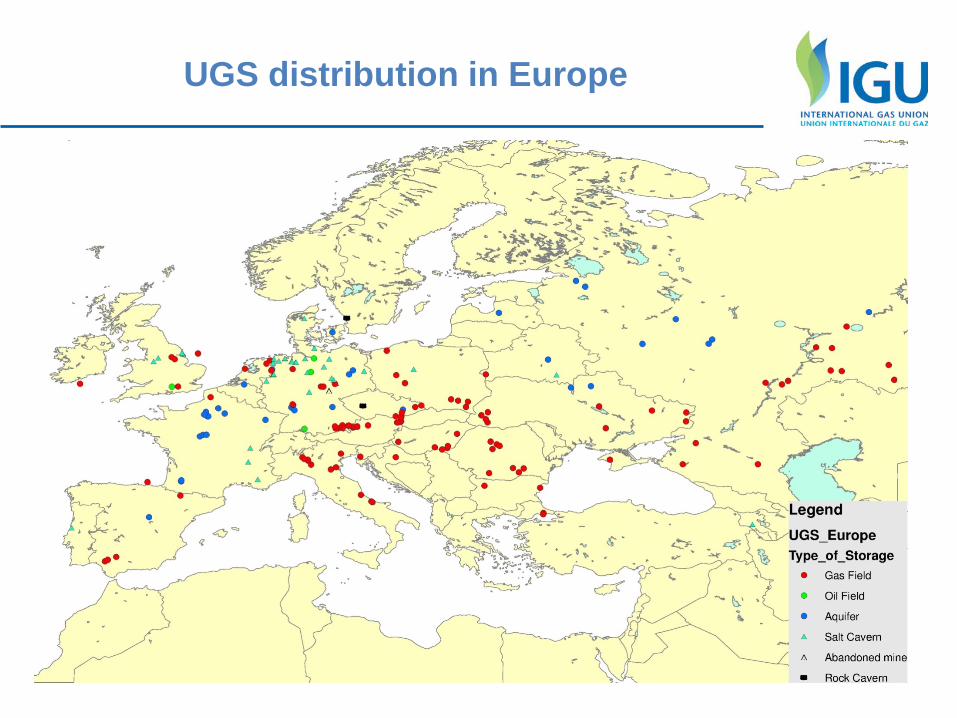
UGS distribution in Europe
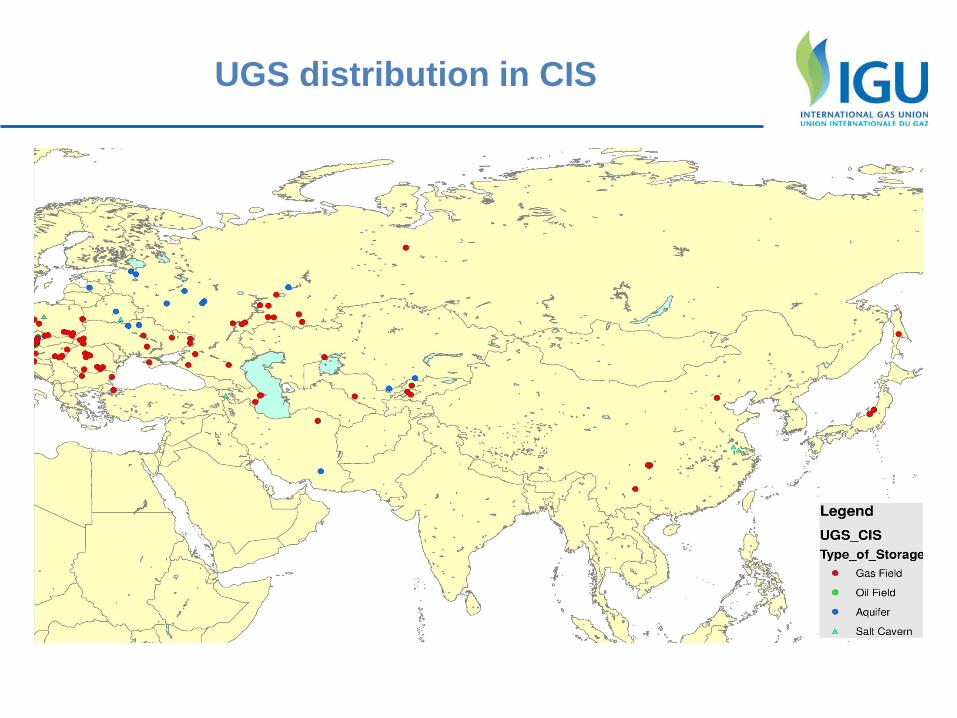
UGS distribution in CIS
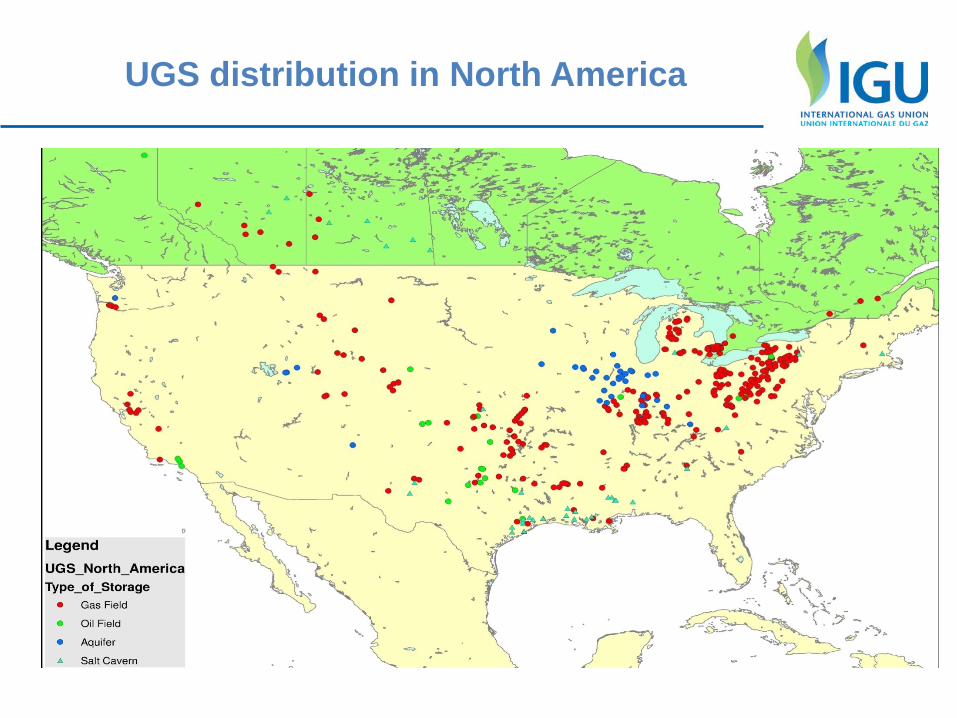
UGS distribution in North America
5. Distribution Source : Woc4 and national websites
Grids & networks (characteristics) Companies ? Gas quality
Smart grids TPA
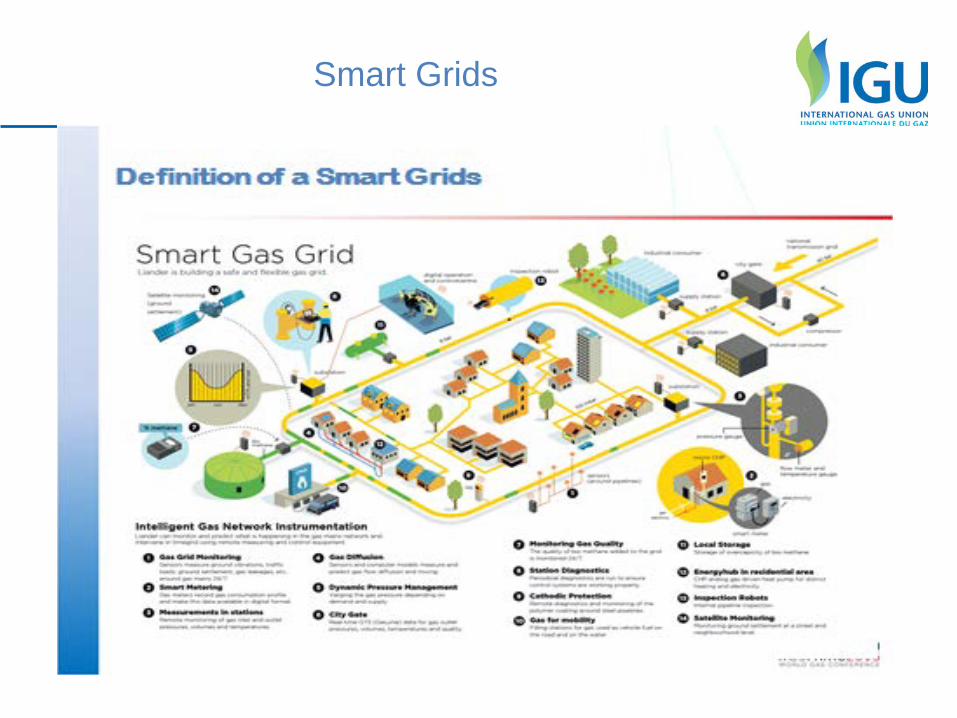
Smart Grids
6. Utilisation Source : WOC5, SG5,3
Industrial uses Domestic and commercial uses Natural gas vehicles LNG vehicles
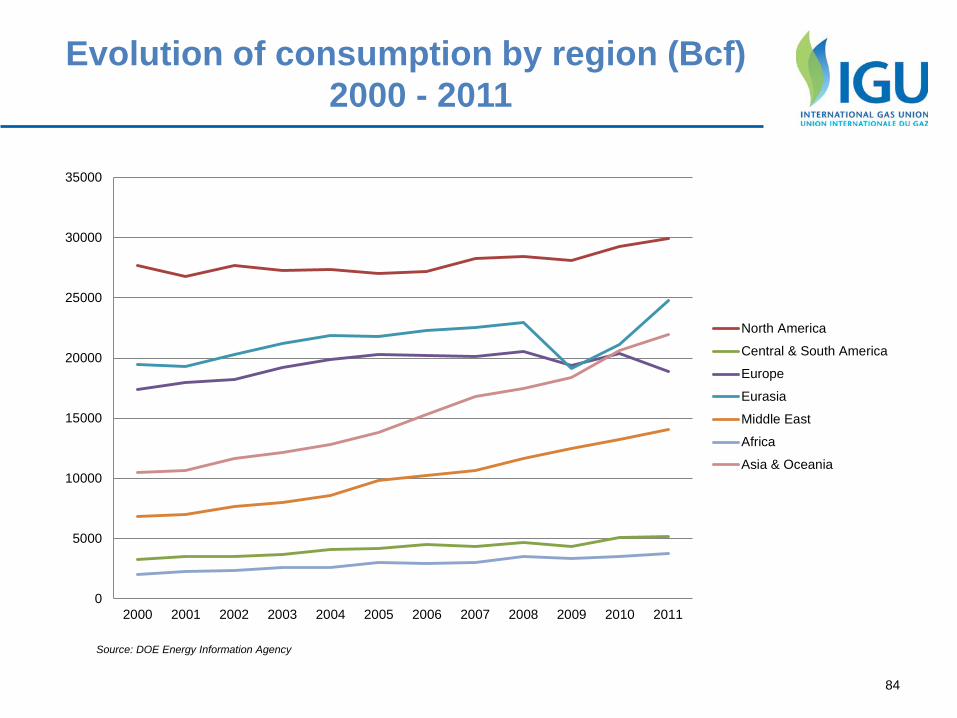
Evolution of consumption by region (Bcf) 2000 - 2011
84
0
5000
10000
15000
20000
25000
30000
35000
2000 2001 2002 2003 2004 2005 2006 2007 2008 2009 2010 2011
North America
Central & South America
Europe
Eurasia
Middle East
Africa
Asia & Oceania
Source: DOE Energy Information Agency
Demand Evolution of Asian Countries (Bcf) 2000-2011
85
Source: DOE Energy Information Agency
0
500
1000
1500
2000
2500
3000
3500
4000
4500
5000
2000 2001 2002 2003 2004 2005 2006 2007 2008 2009 2010 2011
China
Japan
India
Thailand
Korea, South
Pakistan
Indonesia
Australia
Malaysia
86
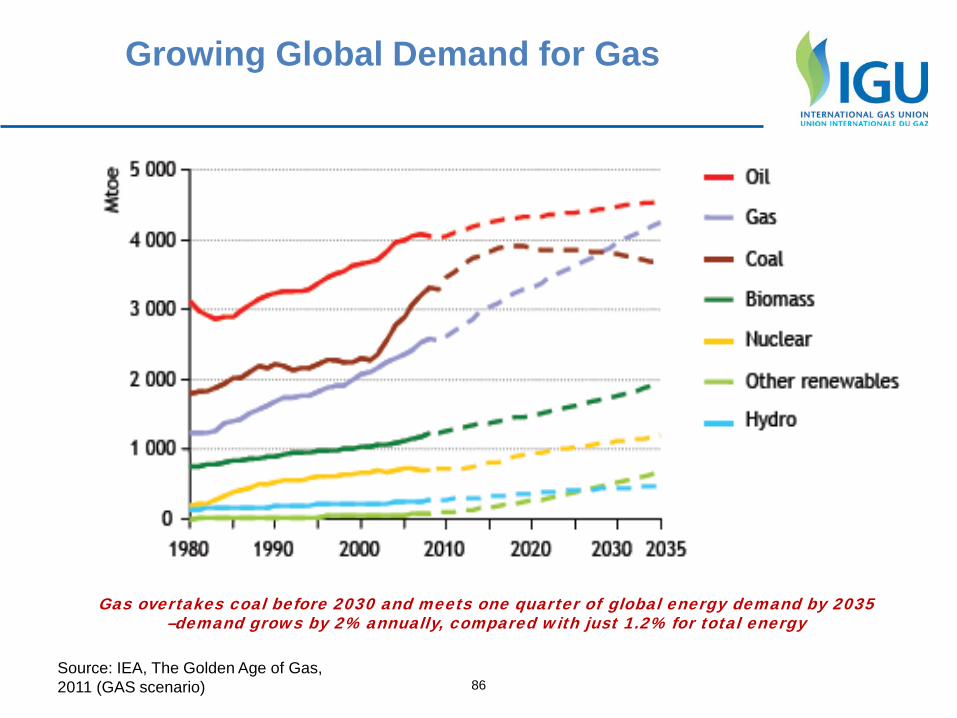
Growing Global Demand for Gas
Source: IEA, The Golden Age of Gas, 2011 (GAS scenario)
Gas overtakes coal before 2030 and meets one quarter of global energy demand by 2035 –demand grows by 2% annually, compared with just 1.2% for total energy
87
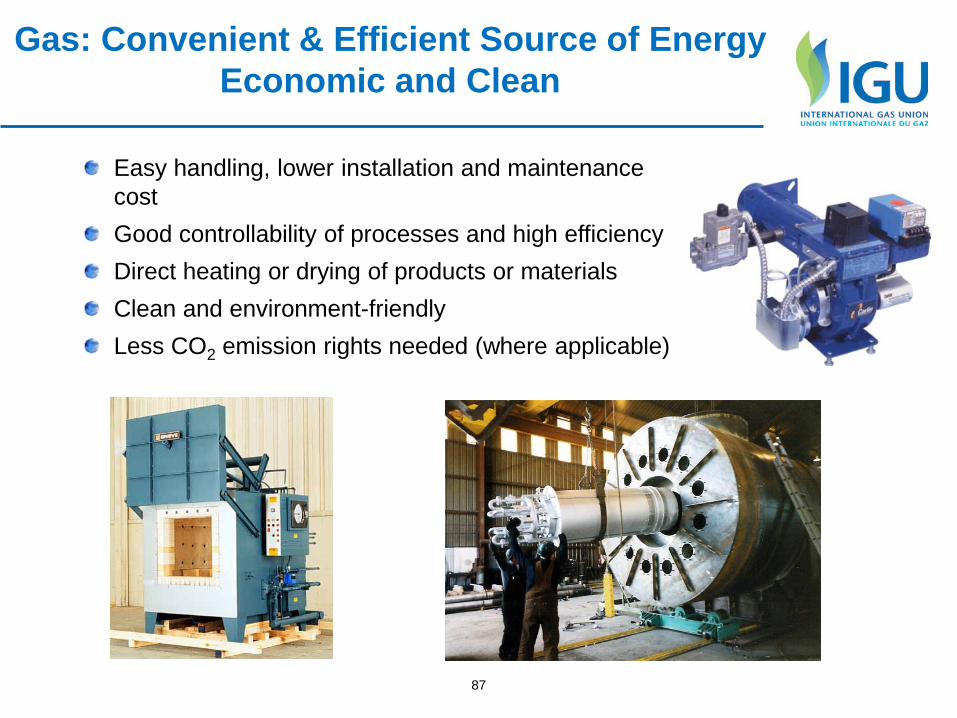
Gas: Convenient & Efficient Source of Energy Economic and Clean
Easy handling, lower installation and maintenance cost Good controllability of processes and high efficiency Direct heating or drying of products or materials Clean and environment-friendly Less CO2 emission rights needed (where applicable)
88
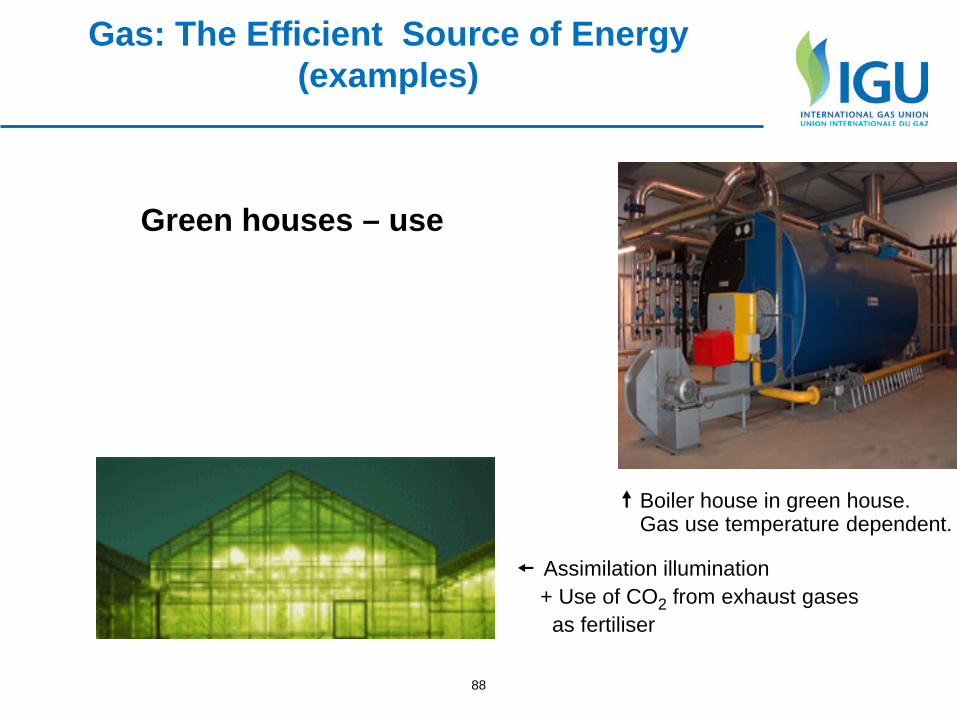
Gas: The Efficient Source of Energy (examples)
Green houses – use
Boiler house in green house. Gas use temperature dependent.
Assimilation illumination + Use of CO2 from exhaust gases as fertiliser
Industrial Utilization of gas
1
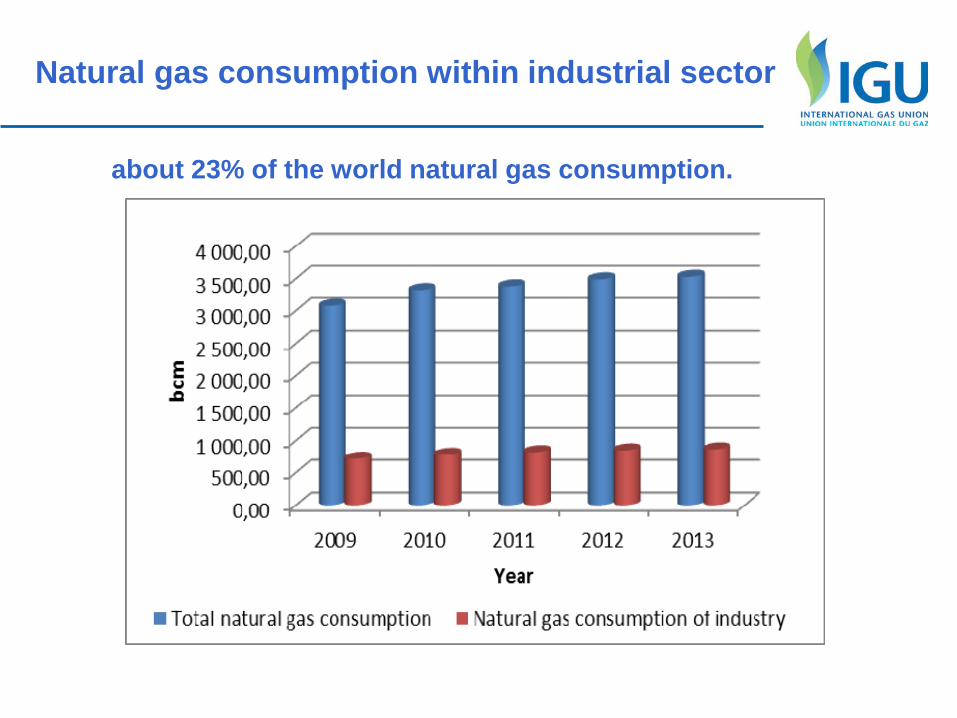
Natural gas consumption within industrial sector
about 23% of the world natural gas consumption.
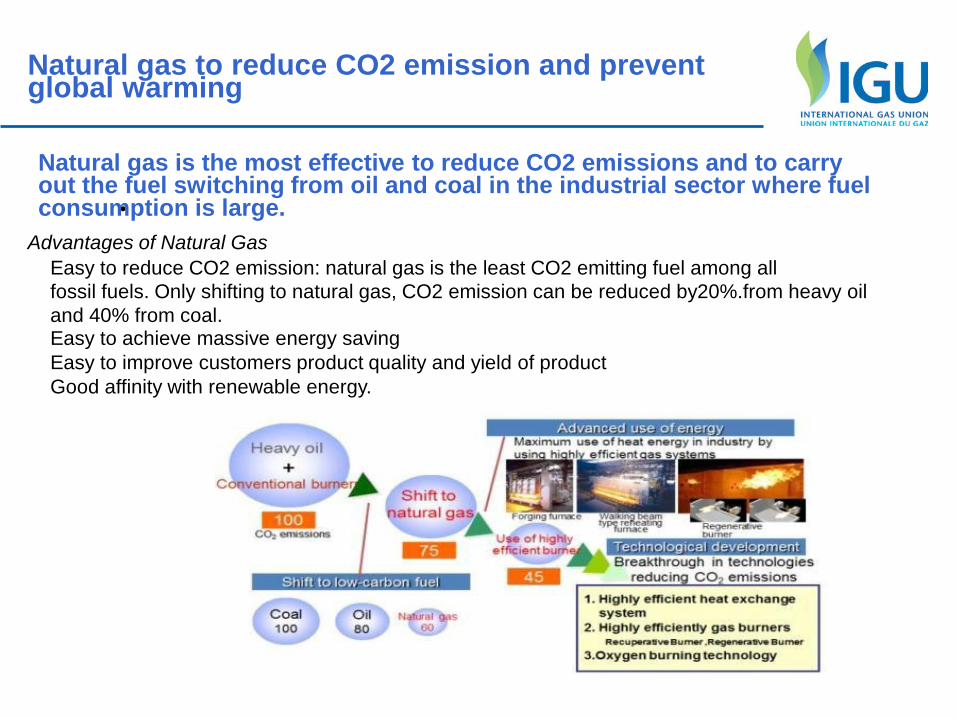
Natural gas to reduce CO2 emission and prevent global warming
Advantages of Natural Gas
•
Easy to reduce CO2 emission: natural gas is the least CO2 emitting fuel among all fossil fuels. Only shifting to natural gas, CO2 emission can be reduced by20%.from heavy oil and 40% from coal. Easy to achieve massive energy saving Easy to improve customers product quality and yield of product Good affinity with renewable energy.
Natural gas is the most effective to reduce CO2 emissions and to carry out the fuel switching from oil and coal in the industrial sector where fuel consumption is large.
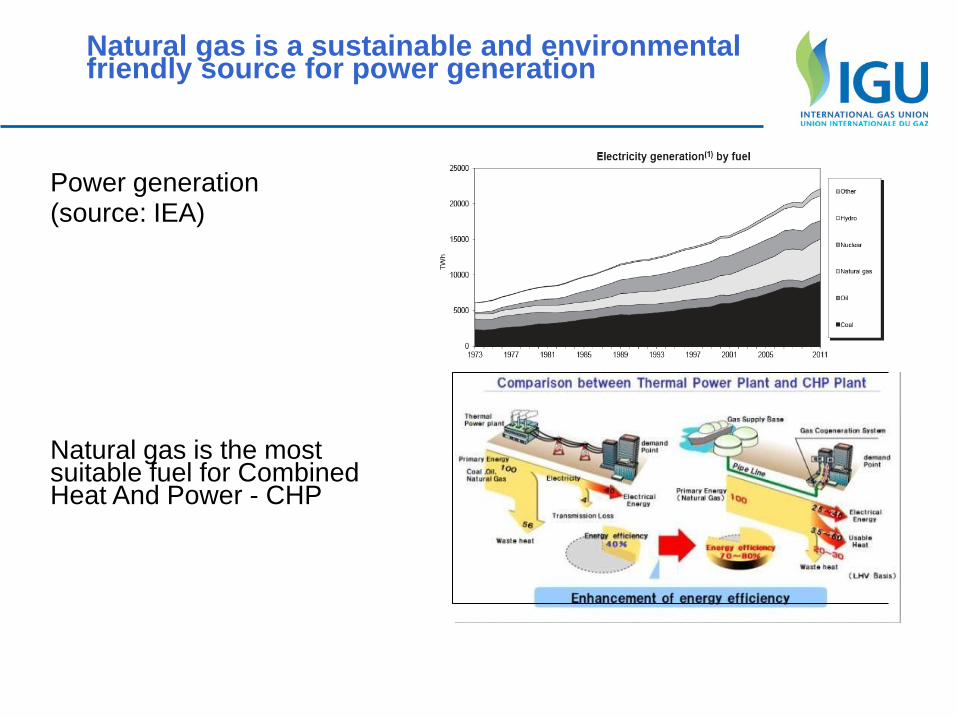
Natural gas is a sustainable and environmental friendly source for power generation
Power generation (source: IEA)
Natural gas is the most suitable fuel for Combined Heat And Power - CHP
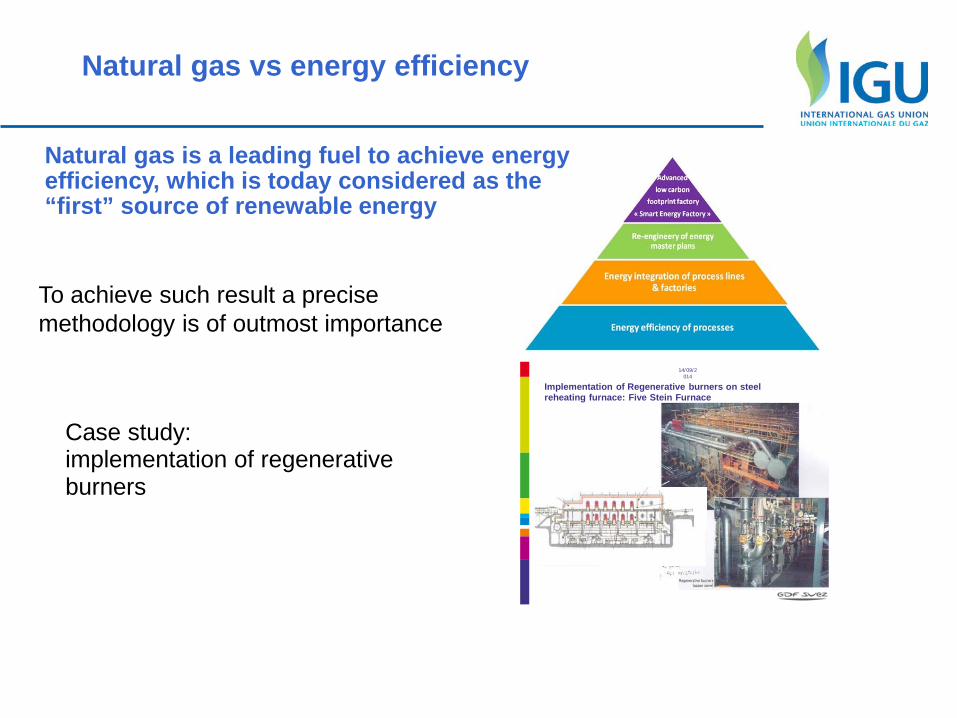
Natural gas vs energy efficiency
To achieve such result a precise methodology is of outmost importance
Case study: implementation of regenerative burners
14/09/2
014
Implementation of Regenerative burners on steel reheating furnace: Five Stein Furnace
Natural gas is a leading fuel to achieve energy efficiency, which is today considered as the “first” source of renewable energy
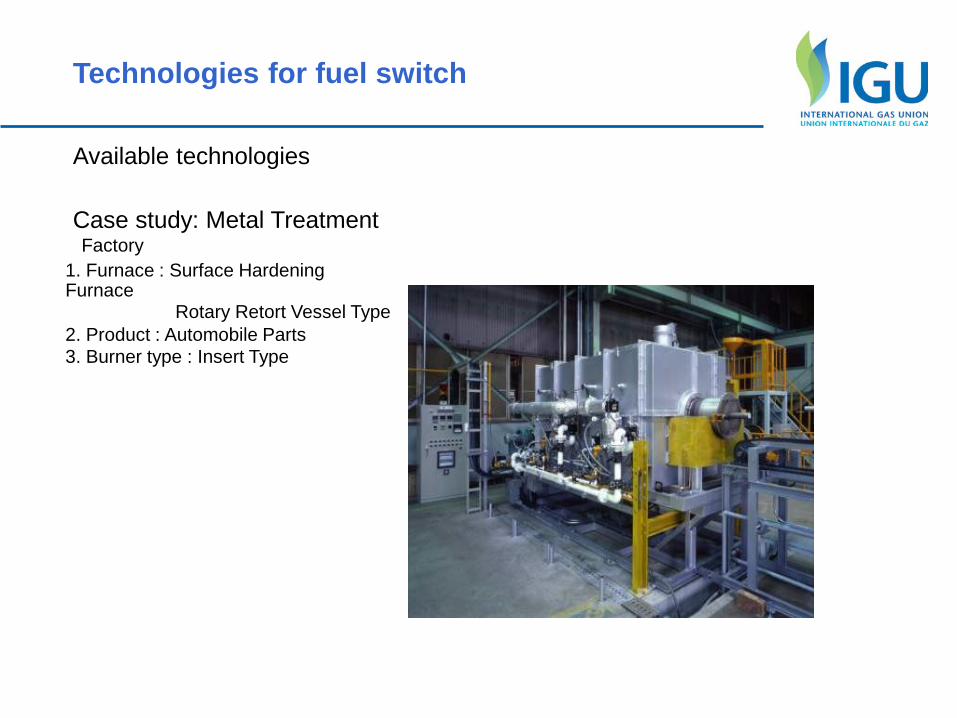
Technologies for fuel switch
Available technologies Case study: Metal Treatment
1. Furnace : Surface Hardening Furnace
Rotary Retort Vessel Type 2. Product : Automobile Parts 3. Burner type : Insert Type
Factory
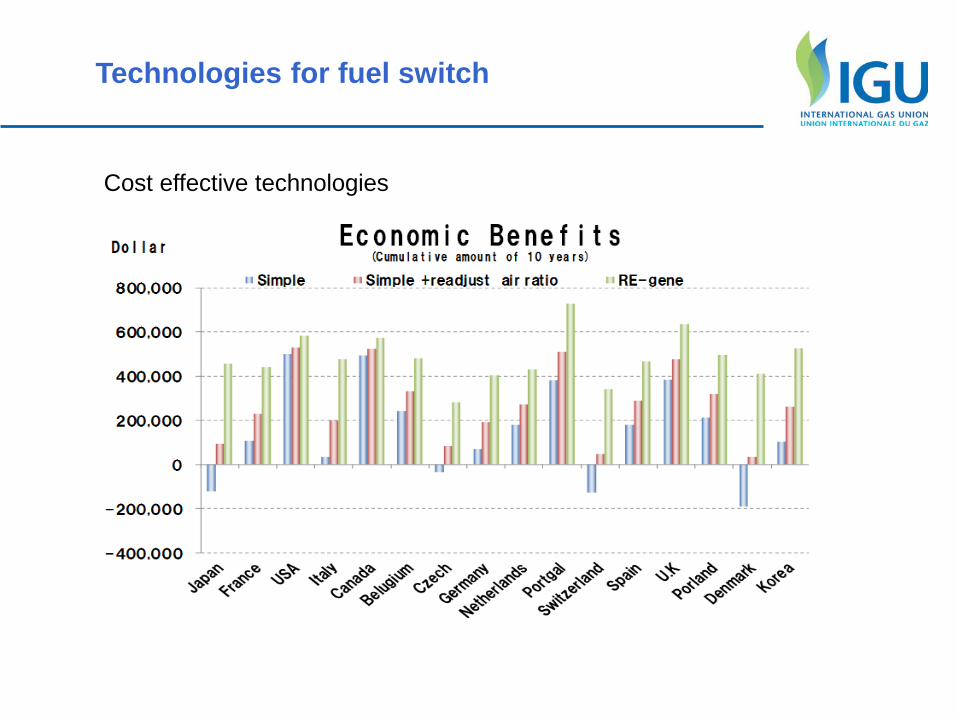
Technologies for fuel switch
Cost effective technologies
Natural Gas Vehicles
97
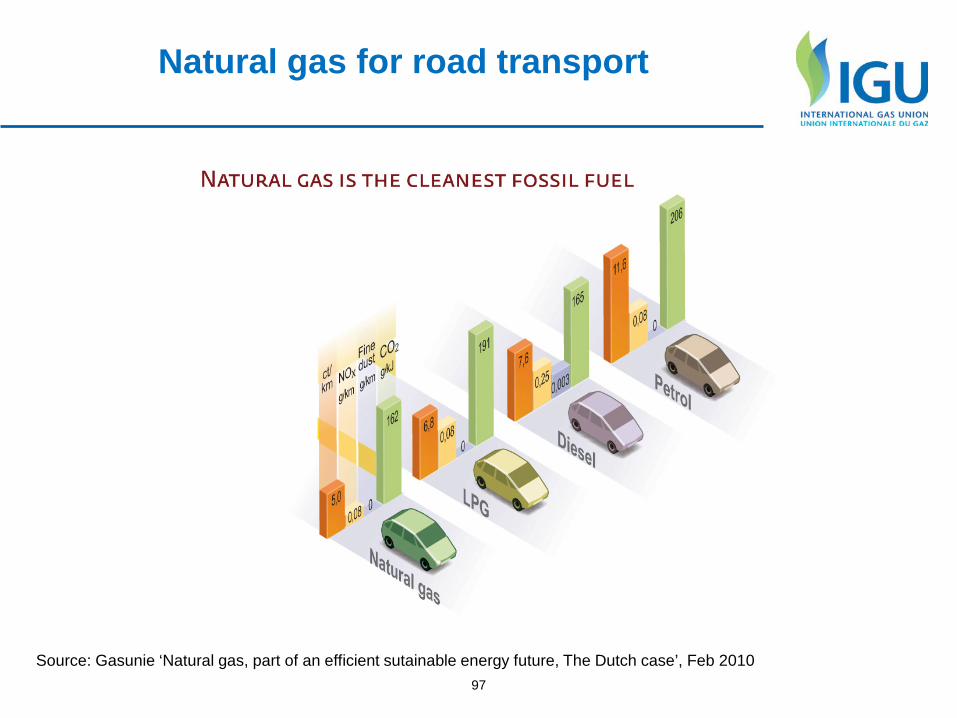
Natural gas for road transport
Source: Gasunie ‘Natural gas, part of an efficient sutainable energy future, The Dutch case’, Feb 2010
Data source: NGVA Europe, Worldwide shares in vehicle market , june 2013
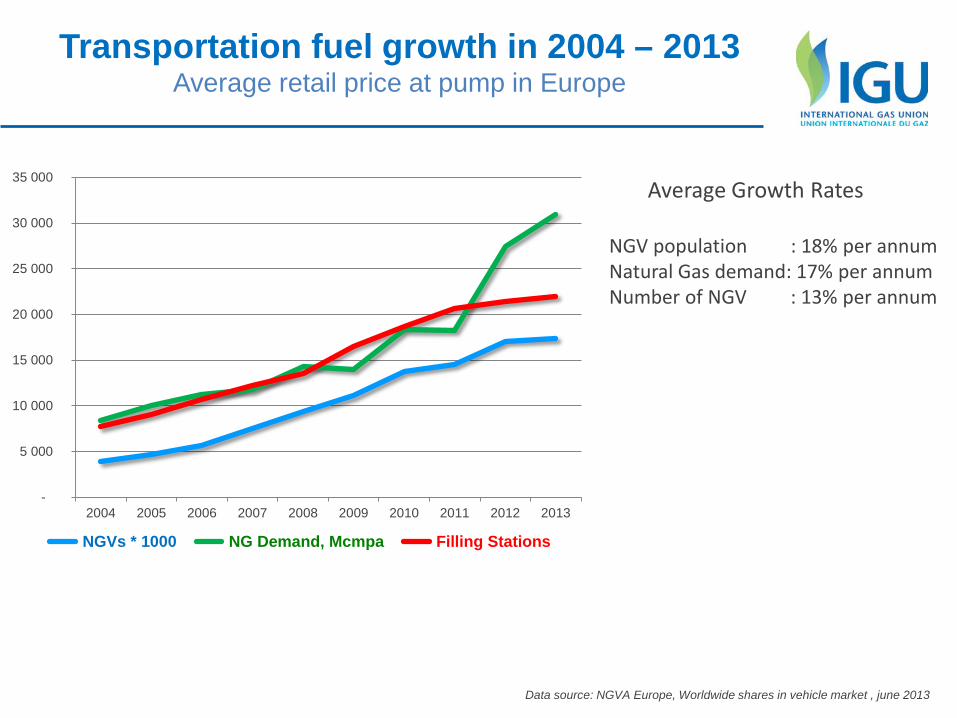
Transportation fuel growth in 2004 – 2013 Average retail price at pump in Europe
-
5 000
10 000
15 000
20 000
25 000
30 000
35 000
2004 2005 2006 2007 2008 2009 2010 2011 2012 2013
NGVs * 1000 NG Demand, Mcmpa Filling Stations
Average Growth Rates NGV population : 18% per annum Natural Gas demand: 17% per annum Number of NGV : 13% per annum
Data source: NGVA Europe, Worldwide shares in vehicle market , june 2013
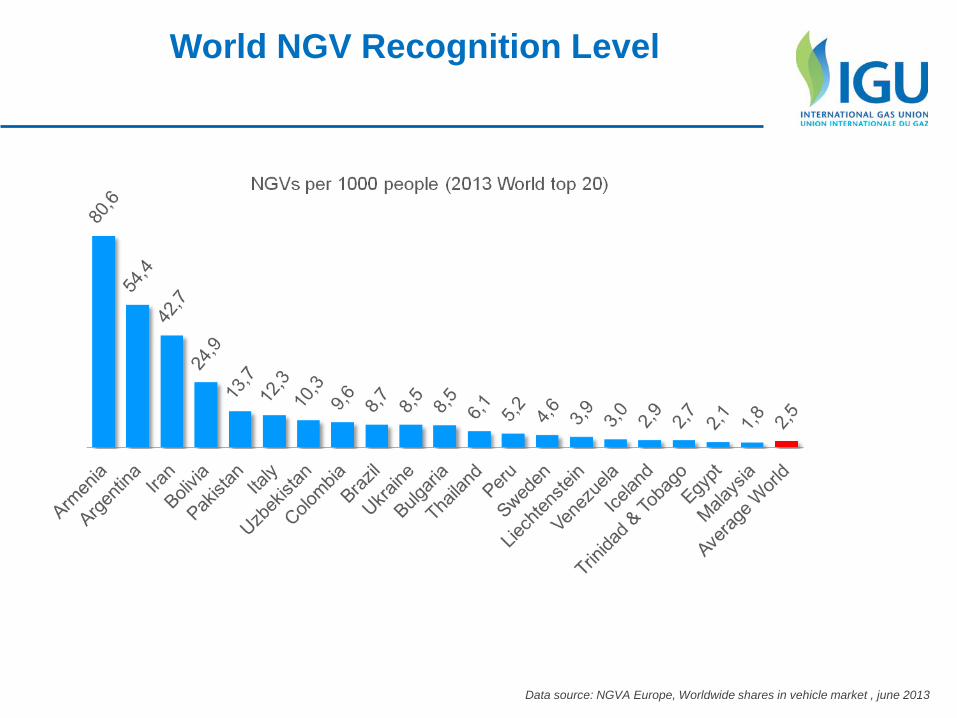
World NGV Recognition Level
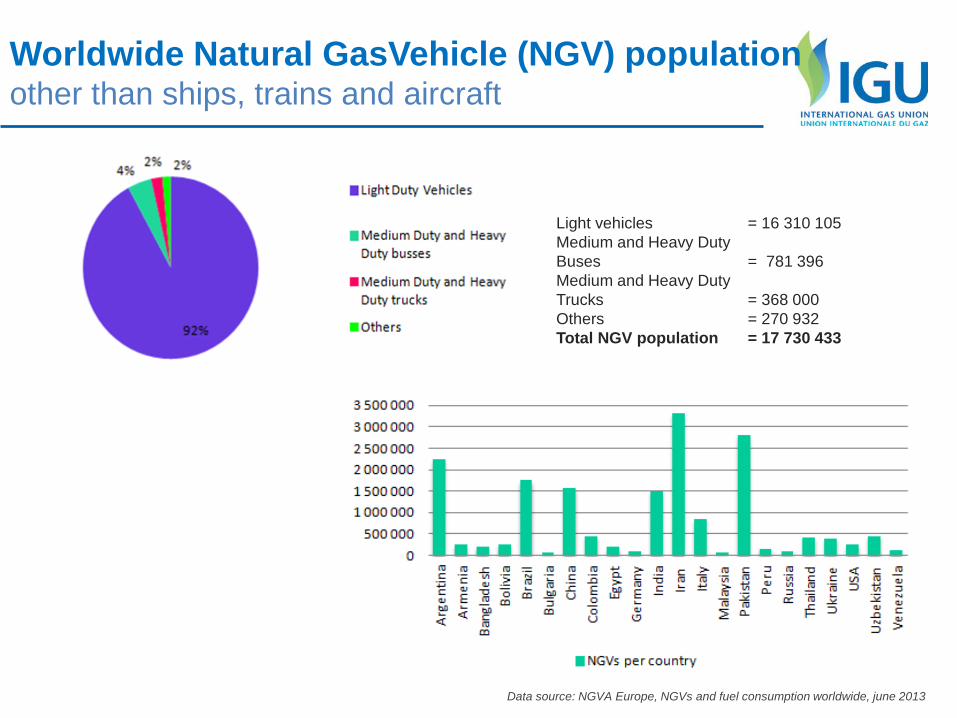
Light vehicles = 16 310 105 Medium and Heavy Duty Buses = 781 396 Medium and Heavy Duty Trucks = 368 000 Others = 270 932 Total NGV population = 17 730 433
Data source: NGVA Europe, NGVs and fuel consumption worldwide, june 2013
Worldwide Natural GasVehicle (NGV) population other than ships, trains and aircraft
Data source: NGVA Europe, Worldwide shares in vehicle market , june 2013
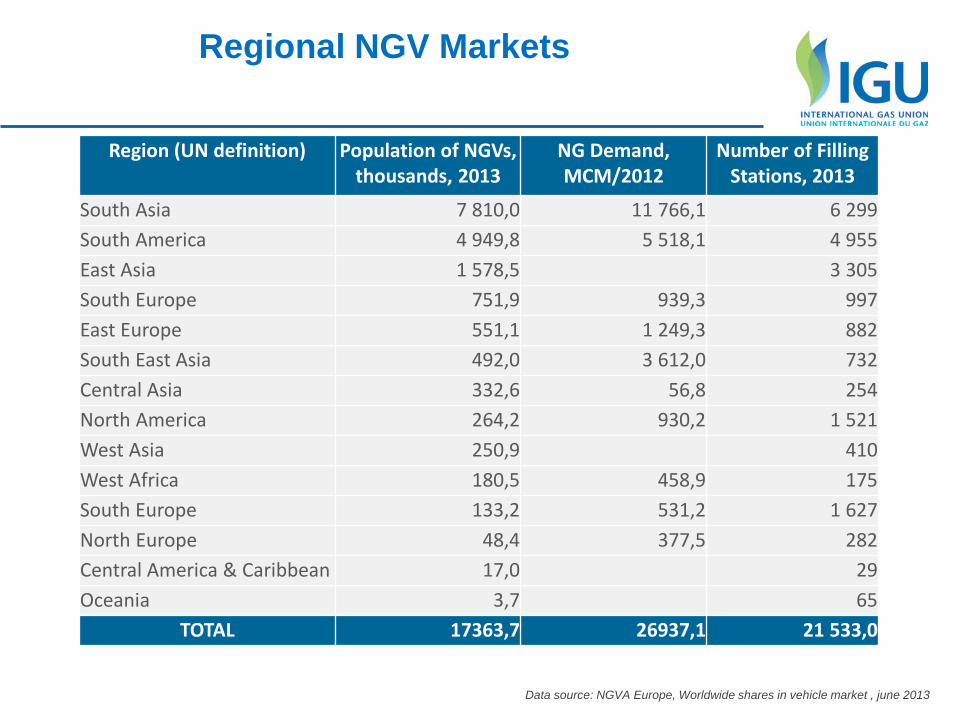
Regional NGV Markets
Region (UN definition) Population of NGVs, thousands, 2013
NG Demand, MCM/2012
Number of Filling Stations, 2013
South Asia 7 810,0 11 766,1 6 299 South America 4 949,8 5 518,1 4 955 East Asia 1 578,5 3 305 South Europe 751,9 939,3 997 East Europe 551,1 1 249,3 882 South East Asia 492,0 3 612,0 732 Central Asia 332,6 56,8 254 North America 264,2 930,2 1 521 West Asia 250,9 410 West Africa 180,5 458,9 175 South Europe 133,2 531,2 1 627 North Europe 48,4 377,5 282 Central America & Caribbean 17,0 29 Oceania 3,7 65
TOTAL 17363,7 26937,1 21 533,0
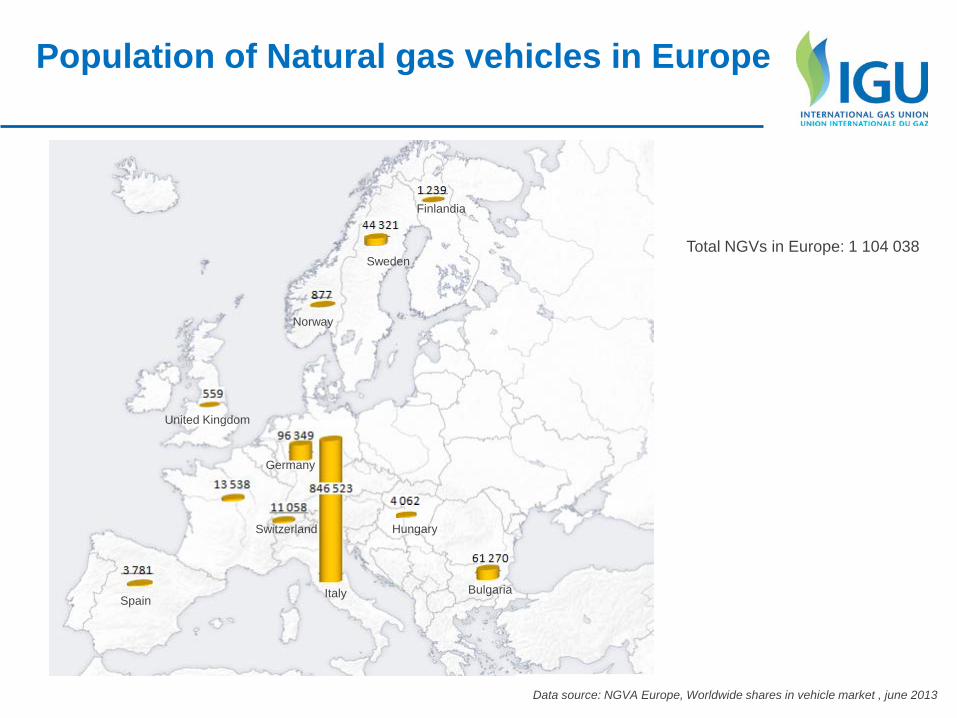
Population of Natural gas vehicles in Europe
Italy
Hungary
Bulgaria
Switzerland
Spain
United Kingdom
Sweden
Finlandia
Norway
Germany
Total NGVs in Europe: 1 104 038
Data source: NGVA Europe, Worldwide shares in vehicle market , june 2013
Data source: NGVA Europe, Worldwide shares in vehicle market , june 2013
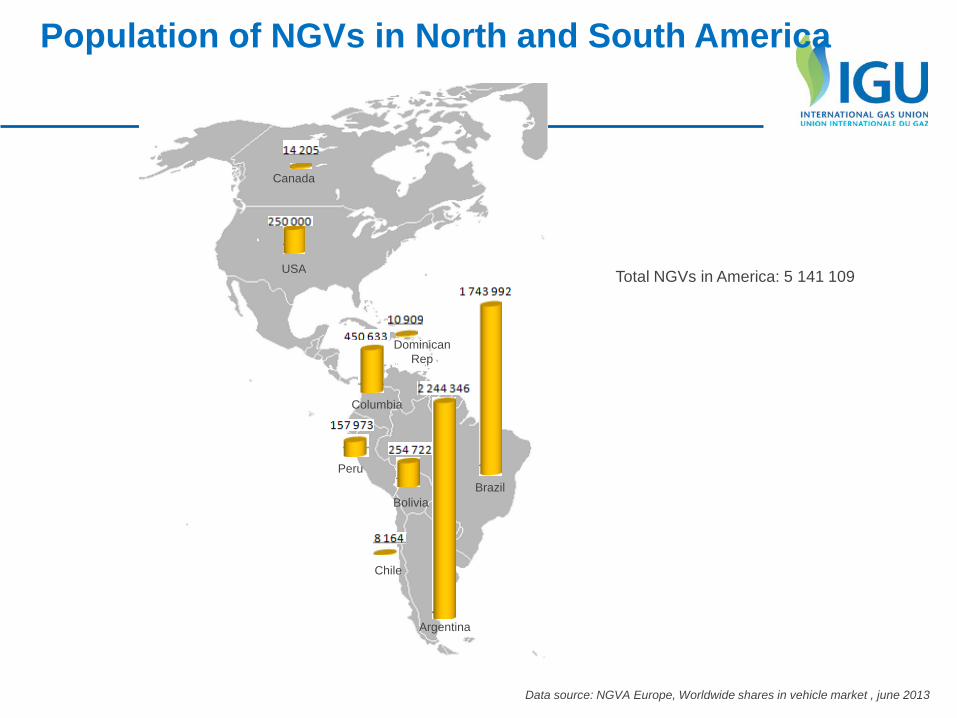
Population of NGVs in North and South America
Argentina
Chile
Brazil
Columbia
USA
Bolivia
Peru
Dominican Rep
Canada
Total NGVs in America: 5 141 109
Data source: NGVA Europe, Worldwide shares in vehicle market , june 2013
Number of natural gas vehicles in Russia and Asia
Total NGVs in Asia: 7 738 863
Pakistan
Chine
Inde
Thailand
Uzbekistan
Russia
Bangladesh
Environmental efficiency
Well-to-wheel greenhouse gas emissions in g CO2 eq./km for different fuels
Source: Dena, German Energy Agency, The role of natural gas and biomethane in the fuel mix of the future in Germany, June 2010
Monthly theoritical consumption (M Nm3)
Data source: NGVA Europe, NGVs and fuel consumption worldwide, june 2013
Data source: NGVA Europe, Worldwide shares in vehicle market , june 2013
Transportation fuel growth in 2004 – 2013 Average retail price at pump in Europe
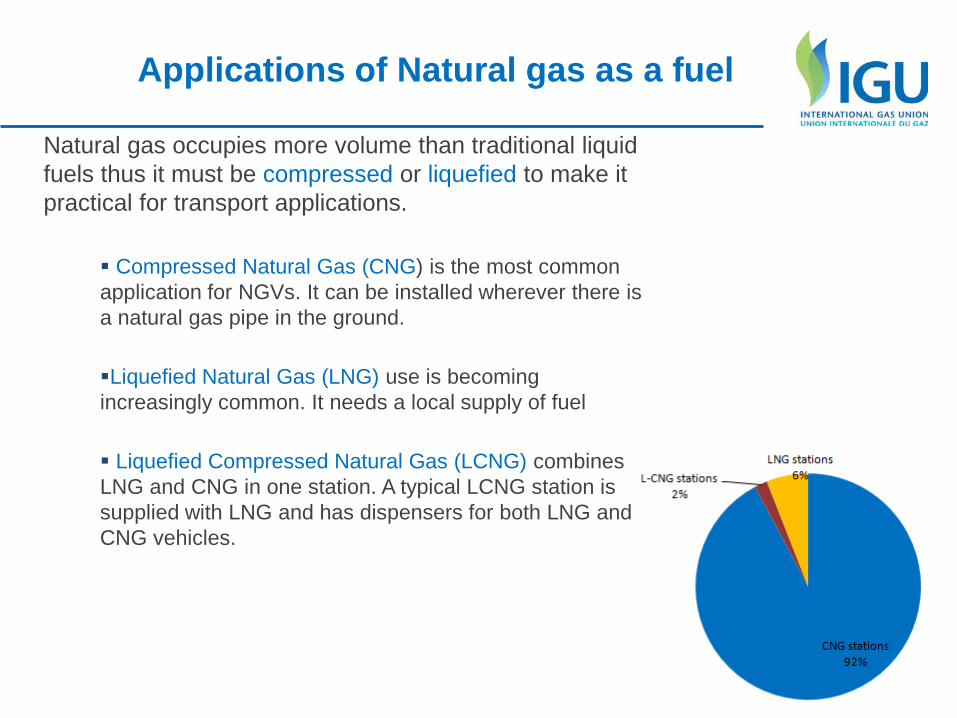
Applications of Natural gas as a fuel
Natural gas occupies more volume than traditional liquid fuels thus it must be compressed or liquefied to make it practical for transport applications.
Compressed Natural Gas (CNG) is the most common application for NGVs. It can be installed wherever there is a natural gas pipe in the ground. Liquefied Natural Gas (LNG) use is becoming increasingly common. It needs a local supply of fuel Liquefied Compressed Natural Gas (LCNG) combines LNG and CNG in one station. A typical LCNG station is supplied with LNG and has dispensers for both LNG and CNG vehicles.
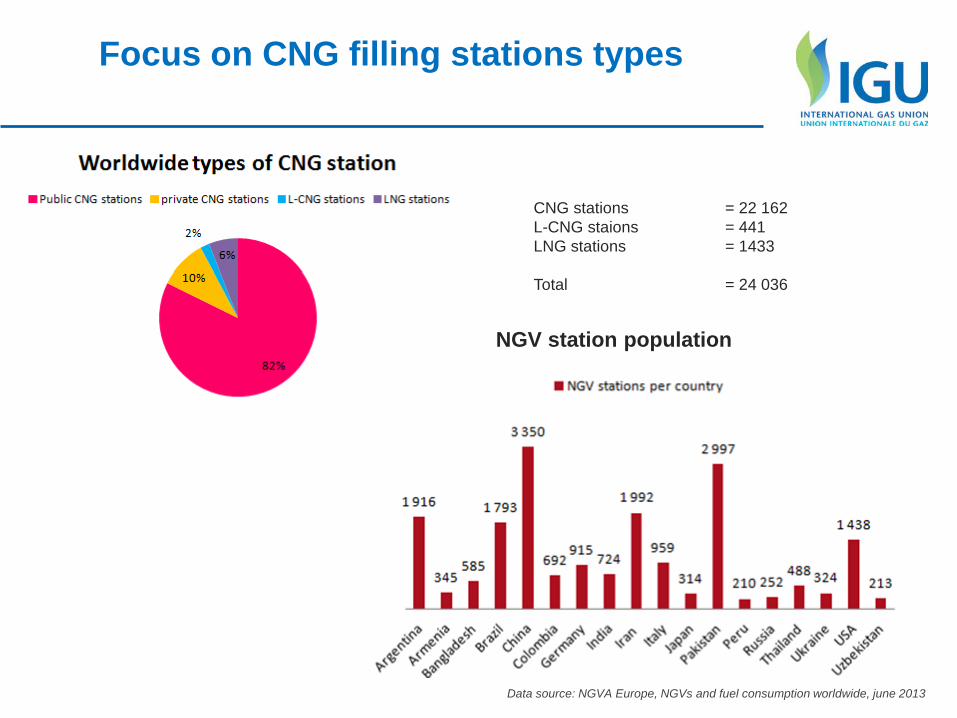
CNG stations = 22 162 L-CNG staions = 441 LNG stations = 1433 Total = 24 036
Data source: NGVA Europe, NGVs and fuel consumption worldwide, june 2013
Focus on CNG filling stations types
NGV station population
Data source: NGVA Europe, more examples on http://www.ngvaeurope.eu/cars
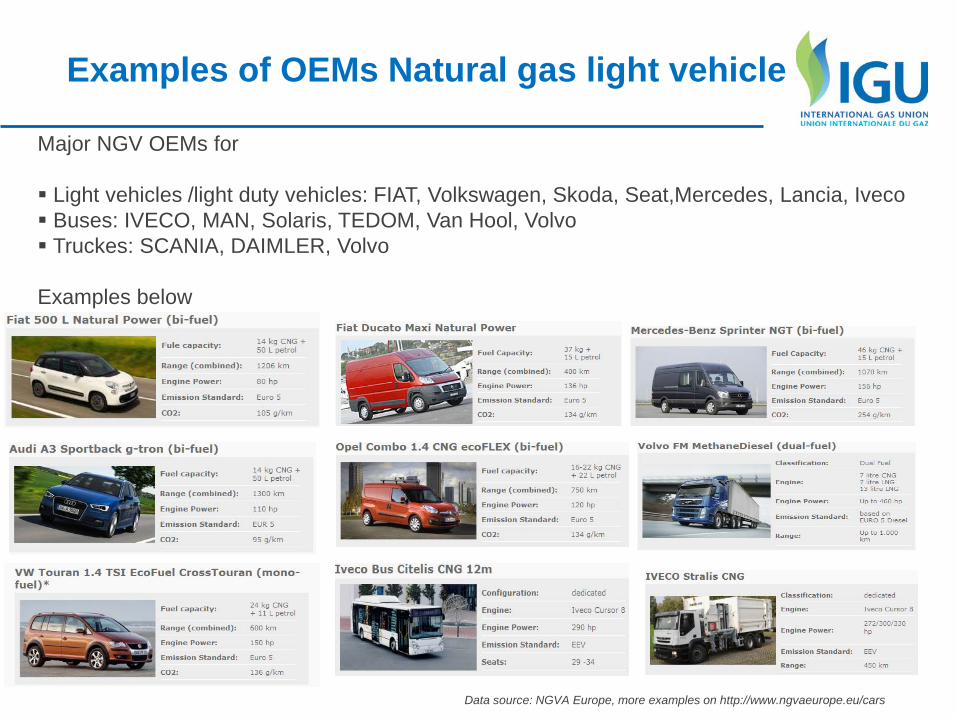
Examples of OEMs Natural gas light vehicle
Major NGV OEMs for Light vehicles /light duty vehicles: FIAT, Volkswagen, Skoda, Seat,Mercedes, Lancia, Iveco Buses: IVECO, MAN, Solaris, TEDOM, Van Hool, Volvo Truckes: SCANIA, DAIMLER, Volvo Examples below
Data source: NGVA Europe, more examples on http://www.ngvaeurope.eu/cars
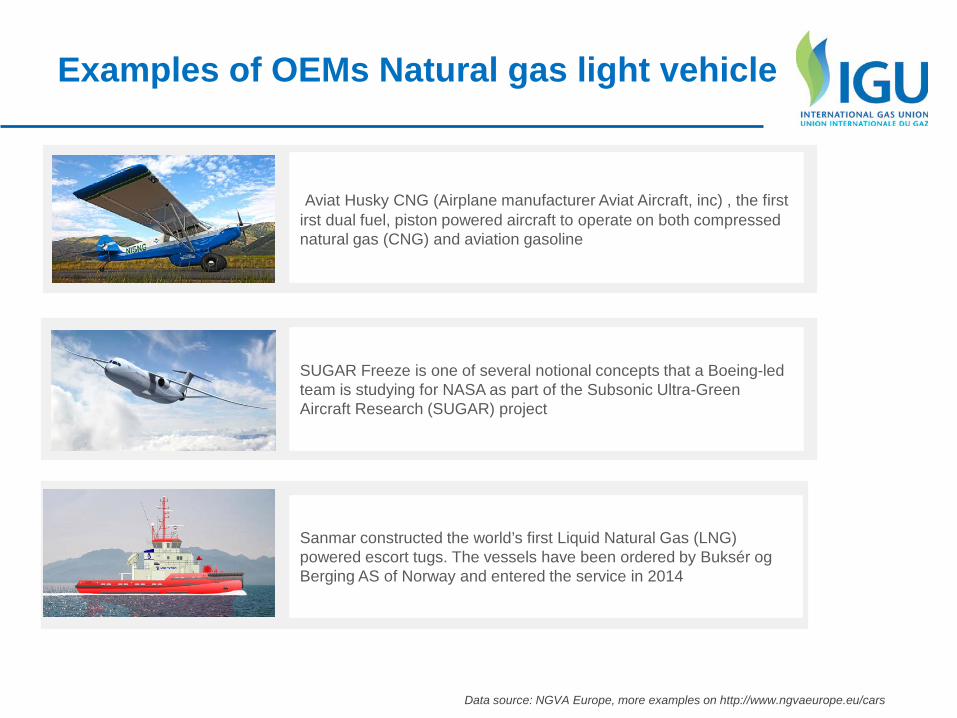
Examples of OEMs Natural gas light vehicle
Aviat Husky CNG (Airplane manufacturer Aviat Aircraft, inc) , the first irst dual fuel, piston powered aircraft to operate on both compressed natural gas (CNG) and aviation gasoline
Sanmar constructed the world’s first Liquid Natural Gas (LNG) powered escort tugs. The vessels have been ordered by Buksér og Berging AS of Norway and entered the service in 2014
SUGAR Freeze is one of several notional concepts that a Boeing-led team is studying for NASA as part of the Subsonic Ultra-Green Aircraft Research (SUGAR) project
112
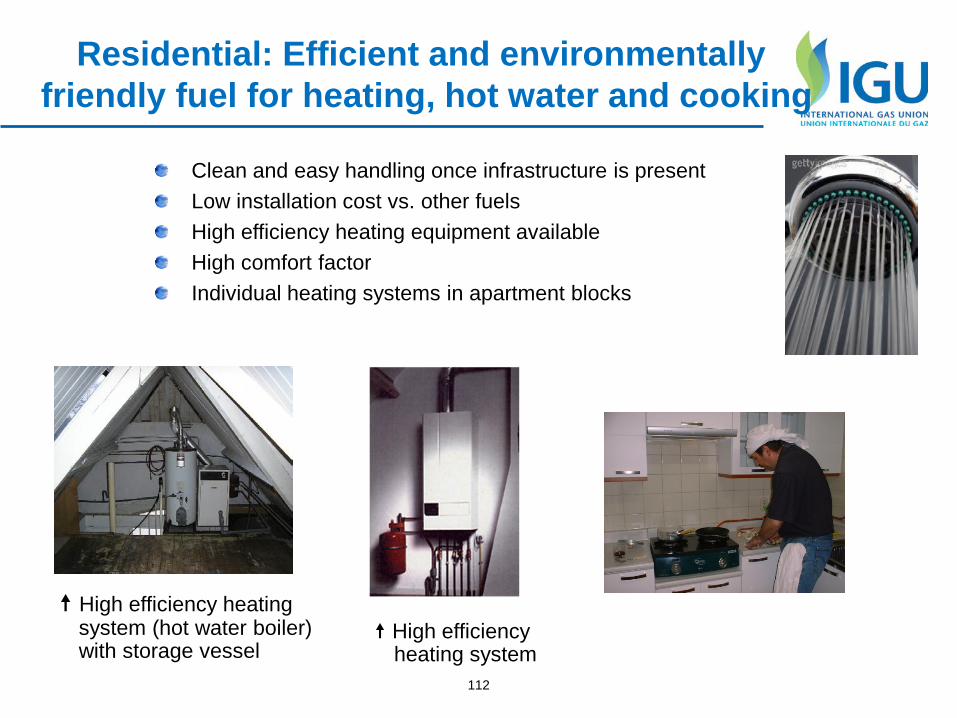
Residential: Efficient and environmentally friendly fuel for heating, hot water and cooking
High efficiency heating system (hot water boiler) with storage vessel
High efficiency heating system
Clean and easy handling once infrastructure is present Low installation cost vs. other fuels High efficiency heating equipment available High comfort factor Individual heating systems in apartment blocks
113
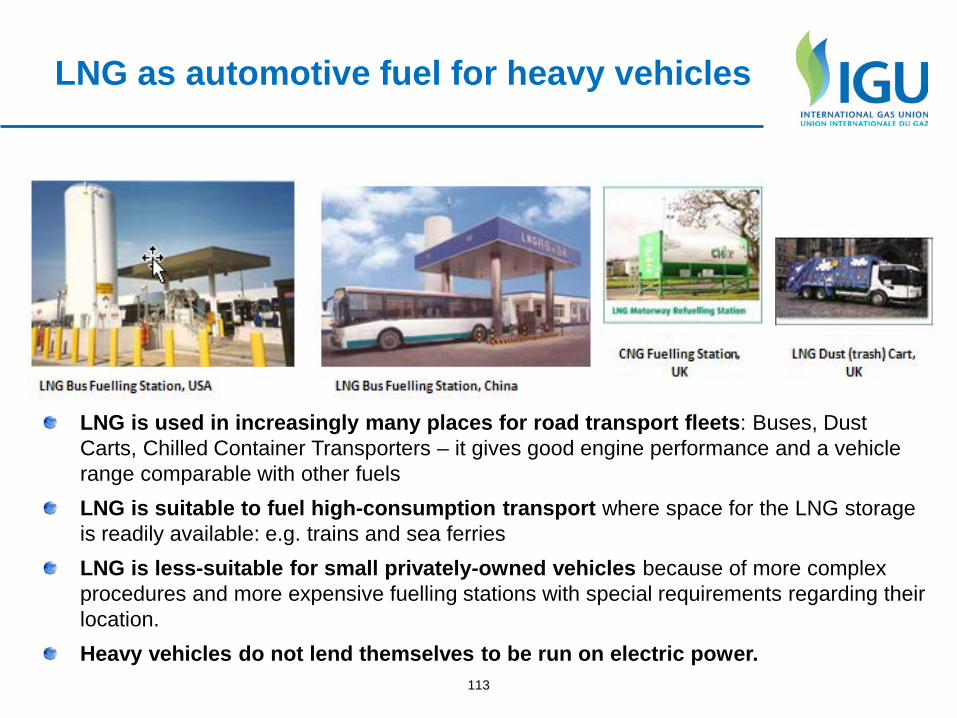
LNG as automotive fuel for heavy vehicles
LNG is used in increasingly many places for road transport fleets: Buses, Dust Carts, Chilled Container Transporters – it gives good engine performance and a vehicle range comparable with other fuels LNG is suitable to fuel high-consumption transport where space for the LNG storage is readily available: e.g. trains and sea ferries LNG is less-suitable for small privately-owned vehicles because of more complex procedures and more expensive fuelling stations with special requirements regarding their location. Heavy vehicles do not lend themselves to be run on electric power.
7. Gas markets Source : PGCE, SGE1, Total G&P
See trading aspect : LT contracts, open-season Industrial aspect : Power generation, Industry Markets lists or map
8. Environmental impact Source : PGCA, life cycle analysis
Life Cycle Analysis approach Impact effect for each step of the chain ( including uses) Greenhouse gases and others emissions Water management Energy efficiency (for all the chain) Gas advocacy
116
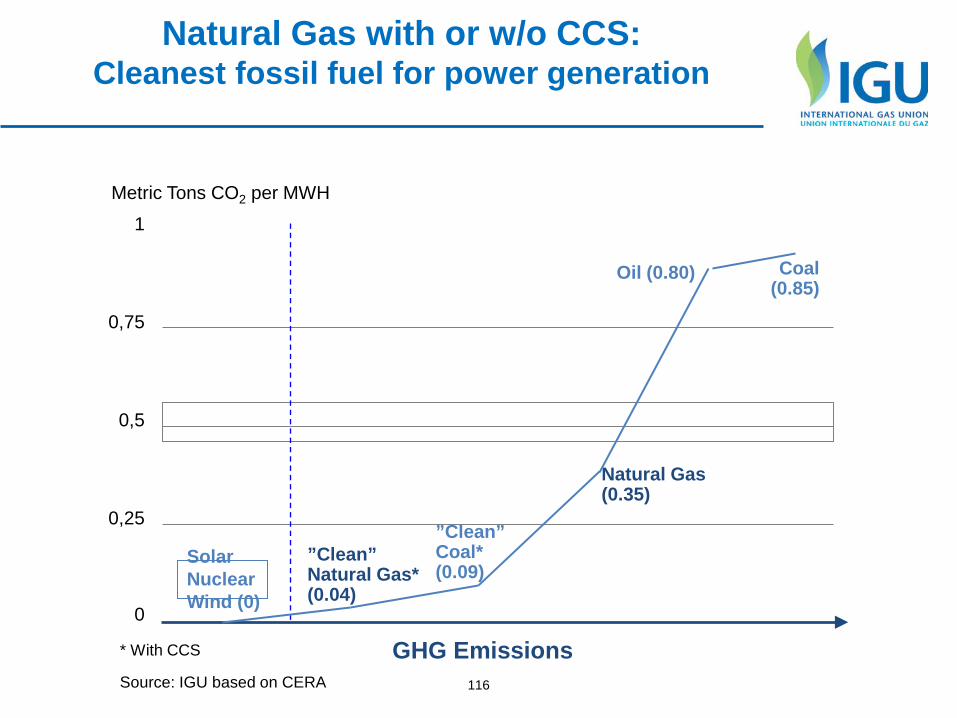
Natural Gas with or w/o CCS: Cleanest fossil fuel for power generation
1
0,75
0,5
0,25
0
GHG Emissions
Metric Tons CO2 per MWH
Wind (0) Nuclear Solar ”Clean”
Natural Gas* (0.04)
”Clean” Coal* (0.09)
Oil (0.80) Coal (0.85)
Natural Gas (0.35)
* With CCS
Source: IGU based on CERA
117
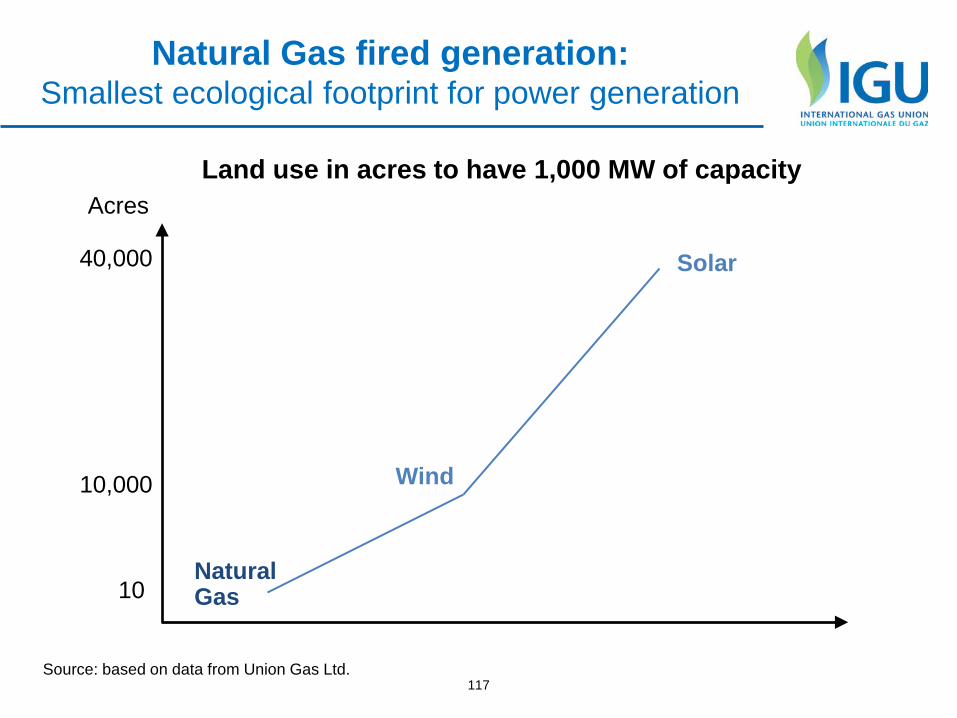
Natural Gas fired generation: Smallest ecological footprint for power generation
Natural Gas
Wind
Solar
10
10,000
40,000
Land use in acres to have 1,000 MW of capacity
Source: based on data from Union Gas Ltd.
Acres
118
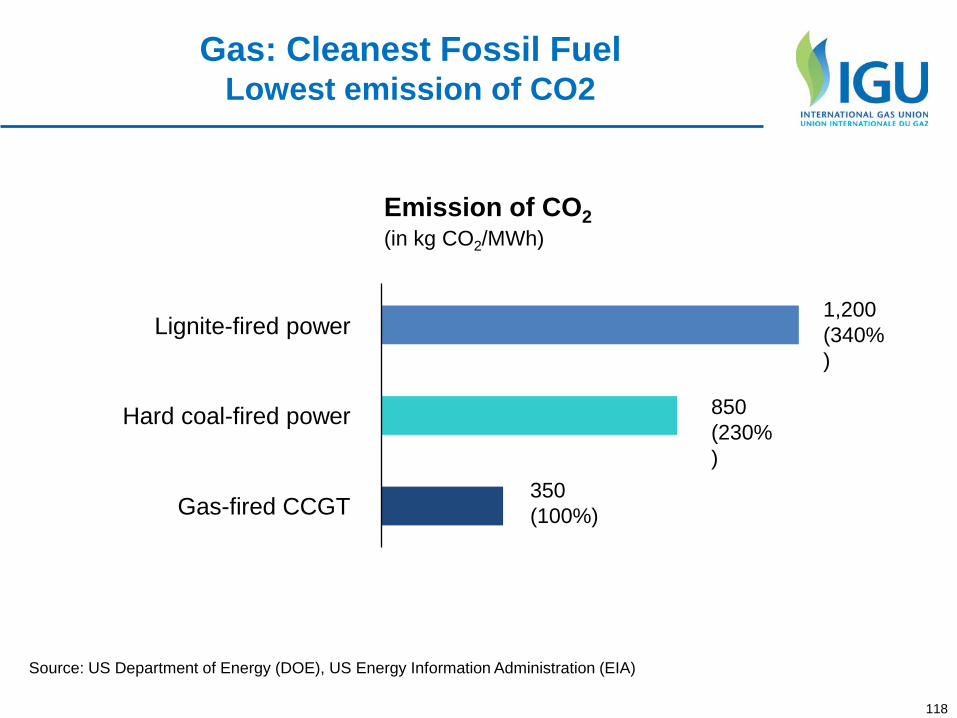
Source: US Department of Energy (DOE), US Energy Information Administration (EIA)
350 (100%)
850 (230%)
1,200 (340%)
Lignite-fired power
Hard coal-fired power
Gas-fired CCGT
Emission of CO2 (in kg CO2/MWh)
Gas: Cleanest Fossil Fuel Lowest emission of CO2
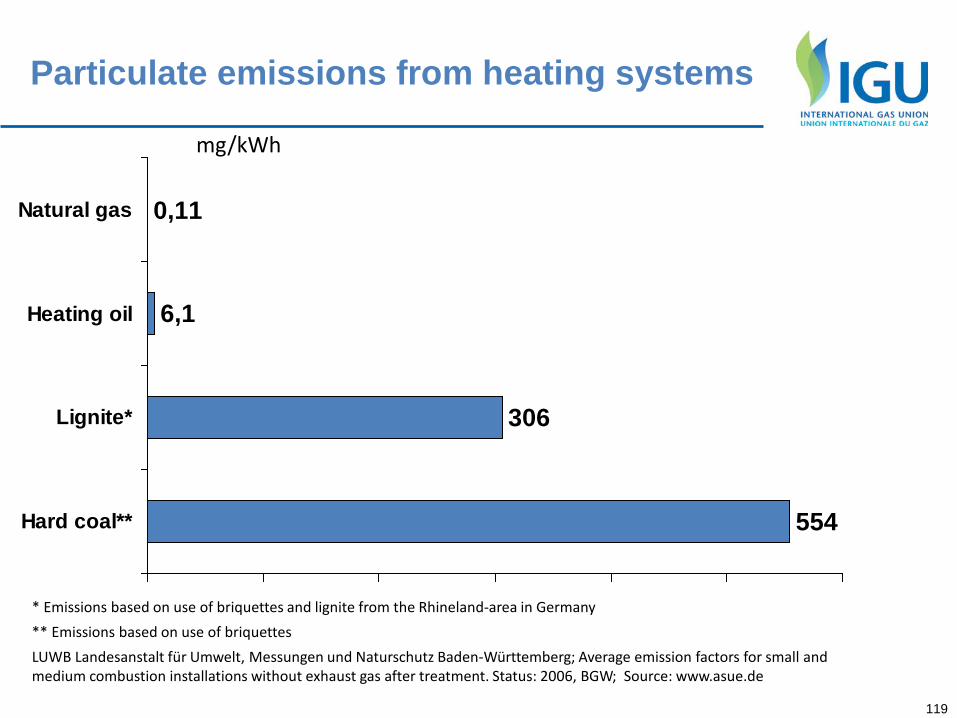
Particulate emissions from heating systems
554
306
6,1
0,11
Hard coal**
Lignite*
Heating oil
Natural gas
mg/kWh
* Emissions based on use of briquettes and lignite from the Rhineland-area in Germany ** Emissions based on use of briquettes LUWB Landesanstalt für Umwelt, Messungen und Naturschutz Baden-Württemberg; Average emission factors for small and medium combustion installations without exhaust gas after treatment. Status: 2006, BGW; Source: www.asue.de
119
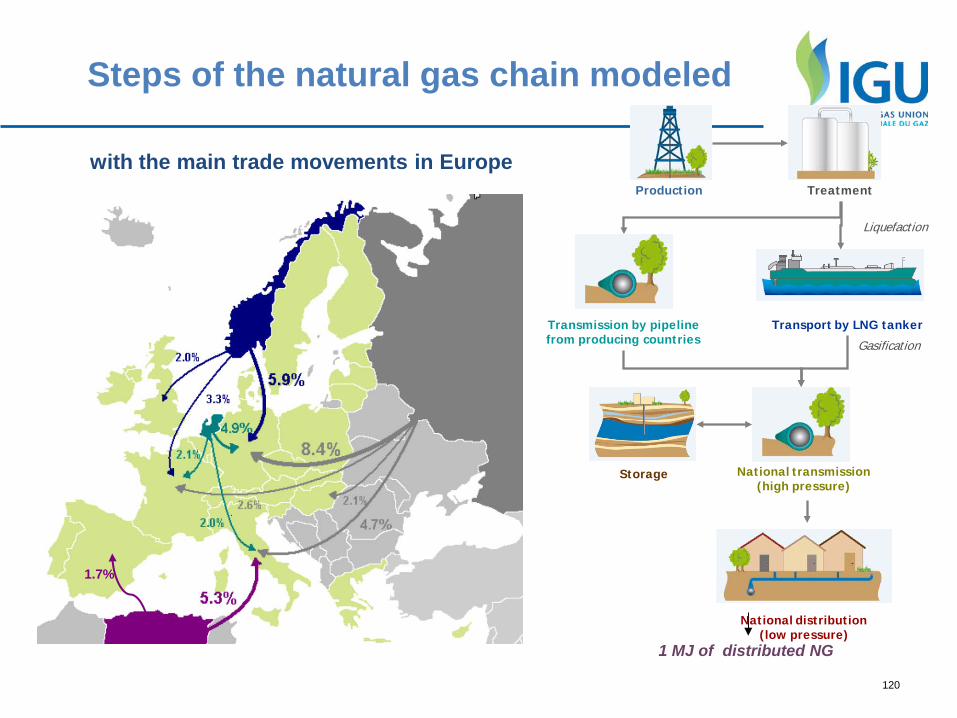
Steps of the natural gas chain modeled
1 MJ of distributed NG
Production Treatment
Transport by LNG tankerTransmission by pipeline from producing countries
National transmission (high pressure)
Storage
National distribution (low pressure)
Liquefaction
Gasification
with the main trade movements in Europe
1.7%
120
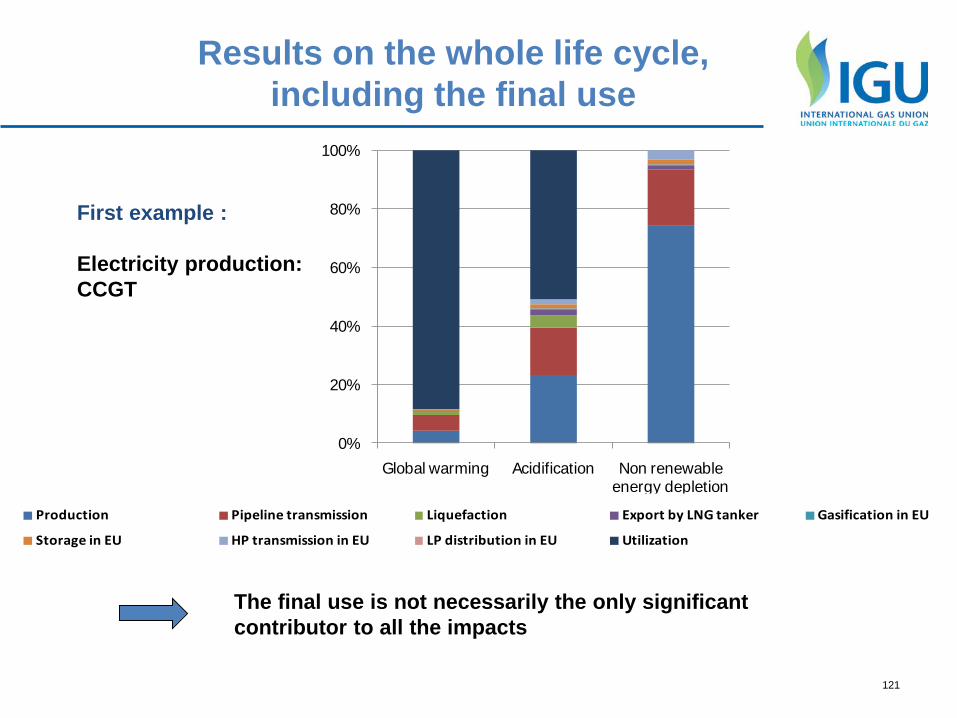
Results on the whole life cycle, including the final use
First example : Electricity production: CCGT
0%
20%
40%
60%
80%
100%
Global warming Acidification Non renewable energy depletion
The final use is not necessarily the only significant
contributor to all the impacts
Production Pipeline transmission Liquefaction Export by LNG tanker Gasification in EU
Storage in EU HP transmission in EU LP distribution in EU Utilization
121
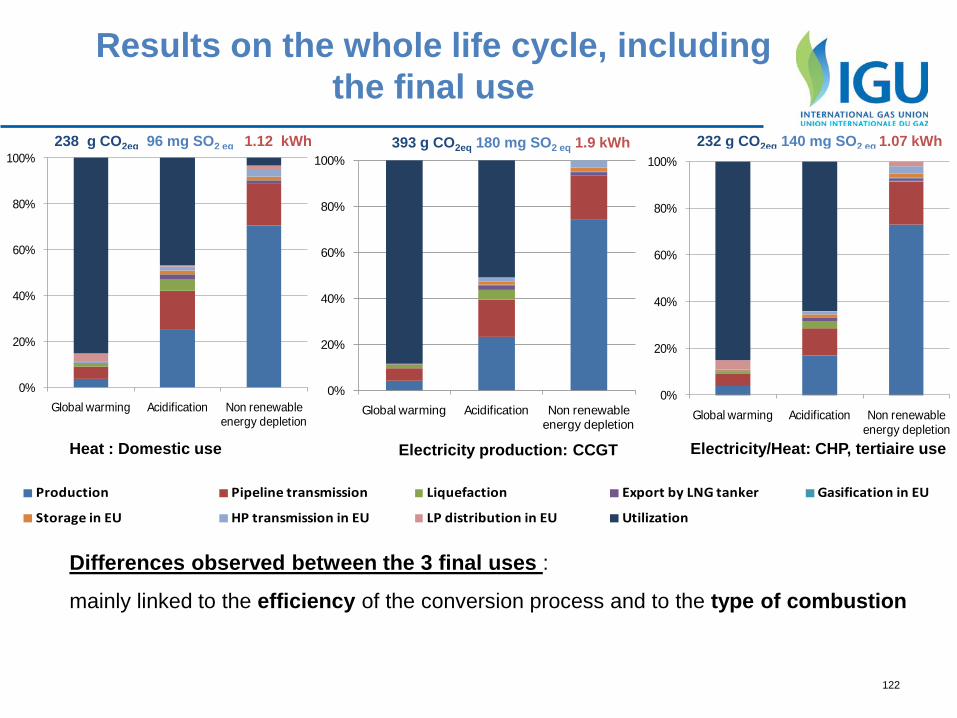
Results on the whole life cycle, including the final use
Electricity production: CCGT Heat : Domestic use Electricity/Heat: CHP, tertiaire use
238 g CO2eq 96 mg SO2 eq 1.12 kWh 232 g CO2eq 140 mg SO2 eq 1.07 kWh
Differences observed between the 3 final uses :
mainly linked to the efficiency of the conversion process and to the type of combustion
Production Pipeline transmission Liquefaction Export by LNG tanker Gasification in EU
Storage in EU HP transmission in EU LP distribution in EU Utilization
0%
20%
40%
60%
80%
100%
Global warming Acidification Non renewable energy depletion
393 g CO2eq 180 mg SO2 eq 1.9 kWh
0%
20%
40%
60%
80%
100%
Global warming Acidification Non renewable energy depletion
0%
20%
40%
60%
80%
100%
Global warming Acidification Non renewable energy depletion
122
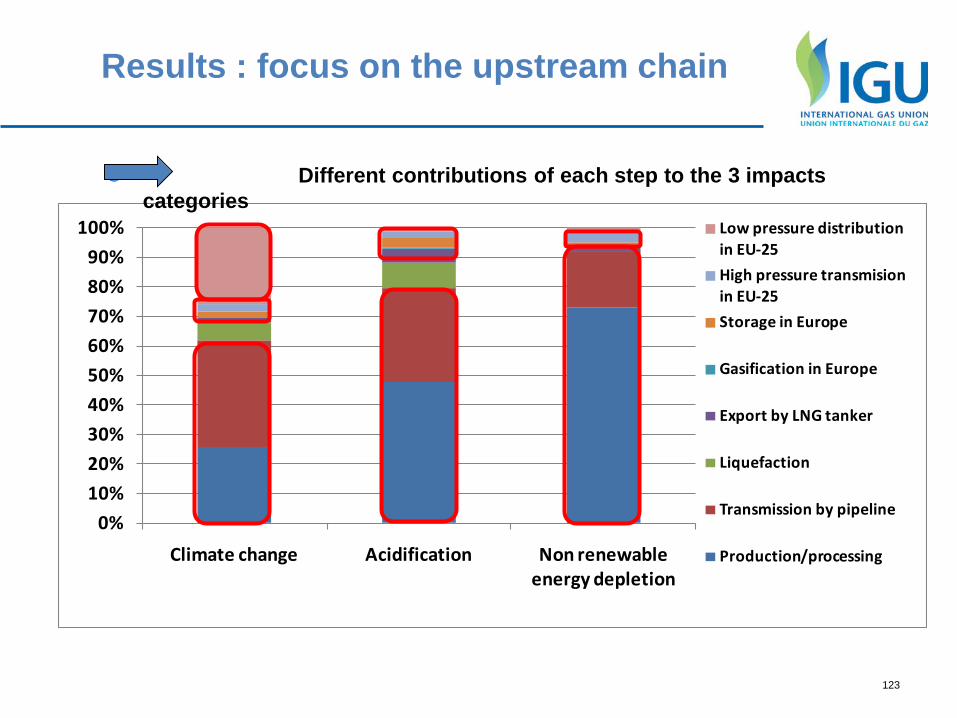
0%10%20%30%40%50%60%70%80%90%
100%
Climate change Acidification Non renewable energy depletion
Low pressure distribution in EU-25High pressure transmision in EU-25Storage in Europe
Gasification in Europe
Export by LNG tanker
Liquefaction
Transmission by pipeline
Production/processing
Results : focus on the upstream chain
Different contributions of each step to the 3 impacts categories
123
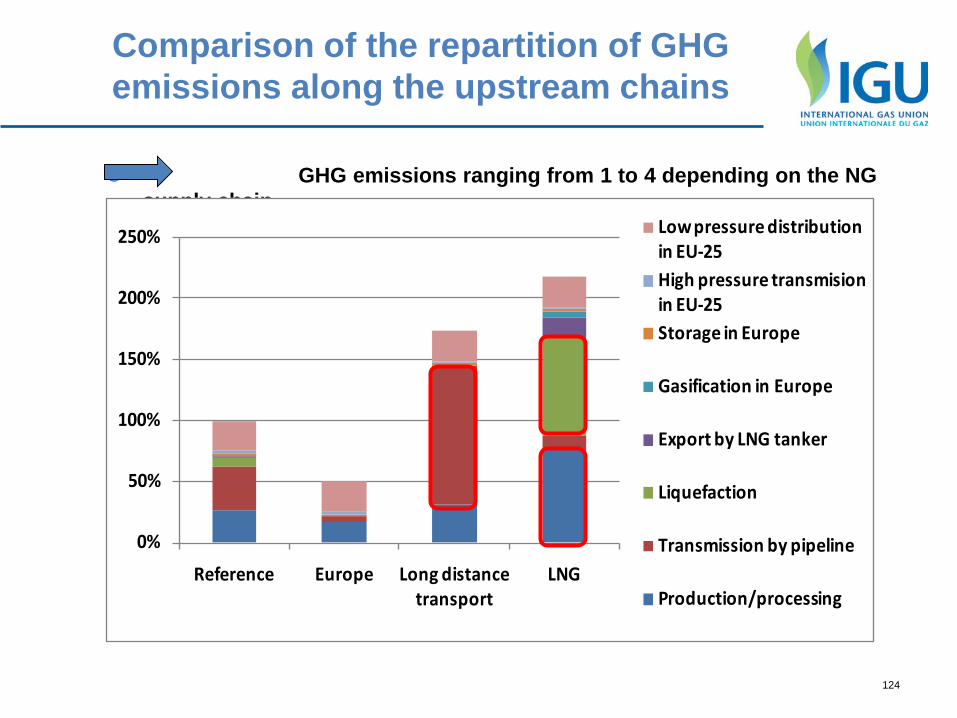
GHG emissions ranging from 1 to 4 depending on the NG supply chain
0%
50%
100%
150%
200%
250%
Reference Europe Long distance transport
LNG
Low pressure distribution in EU-25High pressure transmision in EU-25Storage in Europe
Gasification in Europe
Export by LNG tanker
Liquefaction
Transmission by pipeline
Production/processing
Comparison of the repartition of GHG emissions along the upstream chains
124