Hydrocarbon Gas Liquids (HGL): Recent Market Trends · PDF fileNatural gas processing and...
31
Hydrocarbon Gas Liquids (HGL): Recent Market Trends and Issues November 2014 Independent Statistics & Analysis www.eia.gov U.S. Department of Energy Washington, DC 20585
Transcript of Hydrocarbon Gas Liquids (HGL): Recent Market Trends · PDF fileNatural gas processing and...

Hydrocarbon Gas Liquids (HGL): Recent Market Trends and Issues
November 2014
Independent Statistics & Analysis
www.eia.gov
U.S. Department of Energy
Washington, DC 20585
U.S. Energy Information Administration | Hydrocarbon Gas Liquids (HGL): Recent Market Trends and Issues i
This report was prepared by the U.S. Energy Information Administration (EIA), the statistical and analytical agency within the U.S. Department of Energy. By law, EIA’s data, analyses, and forecasts are independent of approval by any other officer or employee of the United States Government. The views in this report therefore should not be construed as representing those of the U.S. Department of Energy or other federal agencies.

November 2014
U.S. Energy Information Administration | Hydrocarbon Gas Liquids (HGL): Recent Market Trends and Issues ii
Table of Contents Table of Contents .......................................................................................................................................... ii
Table of Figures ............................................................................................................................................ iii
Table of Tables ............................................................................................................................................. iii
Executive summary ....................................................................................................................................... 1
HGL definition ............................................................................................................................................... 2
HGL supply .................................................................................................................................................... 3
Hydrocarbon resources ........................................................................................................................... 3
HGL production trends ............................................................................................................................ 4
Natural gas processing and fractionation facilities.................................................................................. 6
Crude oil refineries and splitters ........................................................................................................... 10
HGL logistics ................................................................................................................................................ 14
HGL transport ........................................................................................................................................ 14
HGL storage ........................................................................................................................................... 17
HGL markets ................................................................................................................................................ 20
HGL prices .............................................................................................................................................. 20
HGL end uses ......................................................................................................................................... 22
HGL imports and exports ....................................................................................................................... 26

November 2014
U.S. Energy Information Administration | Hydrocarbon Gas Liquids (HGL): Recent Market Trends and Issues iii
Table of Figures Figure 1. HGL taxonomy, simplified .............................................................................................................. 2
Figure 2. U.S. Lower 48 tight oil and shale gas plays .................................................................................... 3
Figure 3. HGL production from U.S. gas processors and refineries, 2004—14 ............................................ 5
Figure 4. Natural gas processing and fractionation schematic ..................................................................... 7
Figure 5. HGL production from U.S. gas processors, 2000—2014 ................................................................ 8
Figure 6. Existing and announced U.S. gas processors and fractionators, 2012 ........................................ 10
Figure 7. Refinery processes, generalized to highlight HGL production (simplified) .................................. 11
Figure 8. Propane and propylene production from U.S. refineries, 2000—2014 ....................................... 12
Figure 9. Existing and planned U.S. refineries and splitters, 2014 ............................................................. 13
Figure 10. Existing and planned U.S. HGL pipelines, 2014 .......................................................................... 15
Figure 11. Existing U.S. rail terminals, waterways, and ports handling HGL, 2014 .................................... 16
Figure 12. Operating underground and aboveground U.S. HGL storage facilities, 2014 ........................... 18
Figure 13. Comparison of select HGL, petroleum, and natural gas spot prices, 2000—2014 .................... 20
Figure 14. U.S. NGPL composite spot price and NGPL/natural gas price spread, 2009—14 ...................... 22
Figure 15. Petrochemicals produced from ethane/ethylene as feedstock (simplified) ............................. 24
Figure 16. Petrochemicals produced from propane/propylene as feedstock (simplified) ......................... 25
Table of Tables Table 1. U.S. production by HGL purity product, 2008—14 ......................................................................... 5
Table 2. Attributes and end uses of HGL purity products .......................................................................... 23

November 2014
U.S. Energy Information Administration | Hydrocarbon Gas Liquids (HGL): Recent Market Trends and Issues 1
Executive summary Over the past five years, rapid growth in U.S. onshore natural gas and oil production has led to increased volumes of natural gas plant liquids (NGPL) and liquefied refinery gases (LRG). The increasing economic importance of these volumes, as a result of their significant growth in production, has revealed the need for better data accuracy and transparency to improve the quality of historical data and projections for supply, demand, and prices of these liquids, co-products, and competing products. To reduce confusion in terminology and improve its presentation of data, EIA has worked with industry and federal and state governments to clarify gas liquid terminology and has developed the term Hydrocarbon Gas Liquids, or HGL.
HGL is both fuel and feedstock in various markets (petrochemicals, residential heating/cooking, agriculture, and motor fuel blending). Seasonal and regional fluctuations in these end-use sectors, including export markets, affect investment and production decisions throughout the upstream, midstream, and downstream sectors of the oil and gas industry. Billions of dollars have been invested recently in the field gathering systems, lease separators, crude/condensate stabilizers, natural gas processing plants, fractionation facilities, refineries, condensate splitters, pipelines, storage caverns, rail terminals, port facilities, ethylene crackers, and other petrochemical plants that constitute HGL infrastructure.
Since HGL is co-produced with natural gas and petroleum fuels, HGL production and prices are affected by changing production and prices of natural gas and petroleum fuels, including crude oil prices. General economic and market-specific disruptions, including severe weather, also affect HGL production and prices.
The domestic HGL market is growing dramatically, with supply increasing faster than domestic demand. In 2011, the United States switched from being a net importer to a net exporter of HGL, and investments in export terminal projects and associated pipelines and storage facilities are occurring on the U.S. Gulf, Atlantic, and Pacific coasts, as well as along the U.S.-Canadian border.
This report provides an introduction to HGL, defining key terms, describing and mapping key assets, and providing 2000—2014 data on important trends, as well as some insight into the short-term outlook. This report provides a reference that supports and explains changes to EIA’s real-time analysis and outlooks, data presentation on EIA’s website, and, ultimately, survey data collection.
Hydrocarbon gas liquids (HGL) refers to both the natural gas liquids (paraffins or alkanes) and olefins (alkenes) produced by natural gas processing plants, fractionators, crude oil refineries, and condensate splitters but excludes liquefied natural gas (LNG) and aromatics.

November 2014
U.S. Energy Information Administration | Hydrocarbon Gas Liquids (HGL): Recent Market Trends and Issues 2
HGL definition From a supply-side perspective, HGL constitutes liquids produced at both natural gas processing plants (natural gas plant liquids, or NGPL) and refineries (liquefied refinery gases, or LRG). From a demand-side perspective, HGL is marketed as natural gas liquids (NGL) and refinery olefins. From a chemistry perspective, HGL includes the alkanes (paraffins) – ethane, propane, normal butane, isobutane, and natural gasoline (equivalent to pentanes plus and nearly chemically identical to plant condensates) – and the alkenes (olefins) – ethylene, propylene, butylene, and isobutylene. However, HGL does not include liquefied natural gas (LNG) or aromatics.
As defined above, HGL captures the complete set of gas liquids marketed by midstream and downstream companies. Production of HGL by natural gas processing plants, fractionators, refineries, condensate splitters, and other facilities can be surveyed and analyzed with consumption data to build a clearer HGL picture. Figure 1 provides a simplified view of supply, demand, and chemistry of HGL.
This taxonomy was developed to clarify which elements to include when retrieving data from EIA reports, to highlight refinery olefins, and to define more specifically NGL, LRG, and condensate terms used loosely in many publically-available reports.
Figure 1. HGL taxonomy, simplified
Source: U.S. Energy Information Administration.

November 2014
U.S. Energy Information Administration | Hydrocarbon Gas Liquids (HGL): Recent Market Trends and Issues 3
HGL supply Hydrocarbon resources HGL supply begins with extraction of hydrocarbon resources from wells at the lease site. Wells deliver a mixture of hydrocarbons (oil and gas), water, sand, carbon dioxide, and other contaminants that are separated so that the hydrocarbons can be further processed to create marketable products. Advanced drilling and hydraulic fracturing technologies, especially since 2008, have enabled large-scale oil and gas production in lower-permeability rock such as shale. Tight oil and shale gas plays span much of the continental United States and include both new and well-established oil and gas drilling locations (Figure 2).
Beginning in 2010, the average API gravity (a standard measurement of density set by the American Petroleum Institute) of domestic crude oil increased from the historical range of 32 to 33 API gravity to more than 36 in 2014. A higher API gravity indicates lighter crude oil and lease condensate.
This lightening of domestic crude is because of increased domestic tight oil production from onshore plays. Since 2000, U.S. refineries have processed crude oil with an average API gravity of 30-31, and that number is rising in 2014. As greater volumes of lighter crude oil became available domestically, refiners
Figure 2. U.S. Lower 48 tight oil and shale gas plays
Source: U.S. Energy Information Administration.

November 2014
U.S. Energy Information Administration | Hydrocarbon Gas Liquids (HGL): Recent Market Trends and Issues 4
reduced their imports of similar grades of oil. The average API gravity of U.S. crude oil imports has decreased from a historical average of 30 API to below 27 API in 2014.
Some lease condensate has high HGL content and vapor pressure when initially produced, and the lighter types of HGL must first be separated from the condensate before shipping. This can be done at the lease site using a stabilizer, which produces both a liquid stream with lower vapor pressure and a HGL stream (or a rich gas stream).
In recent years, relatively low natural gas prices and high crude oil prices have enticed shale gas developers to focus on wetter gas plays, increasing the yield of NGPL relative to dry natural gas, as measured in gallons of natural gas liquids per thousand cubic feet of dry natural gas, or GPM. EIA does not collect a true GPM measure, but the yields of NGPL from wet gas input and dry natural gas produced by gas processors indicate a wide range of NGPL factors, with the highest reaching over 12 GPM from the wettest plays.
HGL production trends From 2000 to 2008, HGL production from both natural gas processing plants and refineries increased. A major shift occurred after 2008 with the large-scale deployment of advanced horizontal drilling and hydraulic fracturing technology in U.S. shale gas formations and relatively high oil prices and low natural gas prices, which encouraged natural gas drilling in liquid-rich deposits. Between 2008 and 2014, HGL production from natural gas processing plants and refineries has increased by 51% from 2.41 to 3.65 million barrels per day (b/d) (Figure 3). Virtually all of that growth occurred at natural gas processing plants. By contrast, HGL production at refineries has remained relatively unchanged since 2008. While HGL production from natural gas processors dwarfs that from refiners, both must be considered when presenting a complete picture of domestic production.
U. S. refineries generate a wide variety of HGL streams (including purity products, i.e., mixtures of different alkanes up to specified allowances), but most are used internally to produce other higher-value products, resulting in net refinery HGL production of primarily propane and propylene. U.S. refineries have shifted yields to produce more diesel fuel and less motor gasoline, on a percentage basis, in response to changing demand, which in turn has resulted in less propane production. However, propane production at natural gas processing plants and fractionators is increasing by more than the reduction at refineries. This has resulted in year-on-year growth in propane production, which exceeded 1.2 million b/d in the first eight months of 2014. By contrast, propylene and other olefin production, which occurs at refineries, has remained steady at 0.28 million b/d (Table 1).

November 2014
U.S. Energy Information Administration | Hydrocarbon Gas Liquids (HGL): Recent Market Trends and Issues 5
Table 1. U.S. production by HGL purity product, 2008—14
Figure 3. HGL production from U.S. gas processors and refineries, 2004—14
Note: 2014 ytd includes January-August. Source: Calculated using EIA annual and monthly data from U.S. Refiner & Blender Production and U.S. Natural Gas Plant Field Production.
0.0
0.5
1.0
1.5
2.0
2.5
3.0
3.5
2004 2006 2008 2010 2012 2014 ytd
HGL (gas processor)HGL (refinery)
million b/d
million b/d 2008 2009 2010 2011 2012 2013 2014 ytd change 2008-14
Purity Product Ethane 0.71 0.78 0.88 0.94 0.99 0.98 1.07 50% Propane 0.82 0.84 0.87 0.90 0.99 1.11 1.25 51% Normal butane 0.22 0.21 0.24 0.21 0.24 0.28 0.42 87% Isobutane 0.18 0.19 0.18 0.21 0.23 0.24 0.26 43% Natural gasoline 0.26 0.27 0.28 0.29 0.32 0.35 0.37 42%
Propylene & other olefins 0.21 0.25 0.28 0.29 0.28 0.28 0.28 33%
HGL total 2.41 2.53 2.73 2.84 3.04 3.23 3.65 51%
Note: 2014 ytd includes January-August. Source: U.S. Energy Information Administration, annual and monthly data from U.S. Refiner & Blender Production and U.S. Natural Gas Plant Field Production.

November 2014
U.S. Energy Information Administration | Hydrocarbon Gas Liquids (HGL): Recent Market Trends and Issues 6
Propane and ethane production growth has been responsible for the steady increase in U.S. HGL production. While propane remains the largest-volume and highest-revenue HGL purity product, ethane production levels are increasing because of continuing investments in deethanization facilities, and ethane pipelines and export terminals.
Ethane production is increasing as midstream infrastructure projects become operational and ethane recovery and transport capacities grow. During the first eight months of 2014, U.S. ethane production exceeded one million b/d. U.S. and Canadian petrochemical companies are shifting their feedstock slates toward ethane, which is currently priced below natural gas on an energy content basis. Petrochemical companies are investing in additional ethylene capacity with the expectation of continued low ethane prices and increasing demand for ethylene intermediate product exports.
Normal butane production has been trending higher since 2005, exceeding 0.4 million b/d during the first eight months of 2014. Net production of normal butane varies seasonally at refineries because of seasonality of gasoline demand and gasoline vapor pressure specifications. Isobutane production has also been climbing to new levels, mostly due to production at natural gas processing plants. Refineries consume slightly more isobutane than they produce.
The heaviest NGPL produced by natural gas processing plants — natural gasoline, also known as pentanes plus or C5+ — is trending upward, averaging 0.37 million b/d in January-August 2014. Comparable products from refineries are blended directly into gasoline as blendstock or marketed as light naphtha.
In addition to the HGL purity products produced by refineries and gas processors, propylene and other olefins are produced by refineries. Their production has remained flat since 2010. Olefin production by petrochemical plants has increased at a higher rate than growth in gross domestic product, but petrochemical production is not monitored by EIA or included in this report.
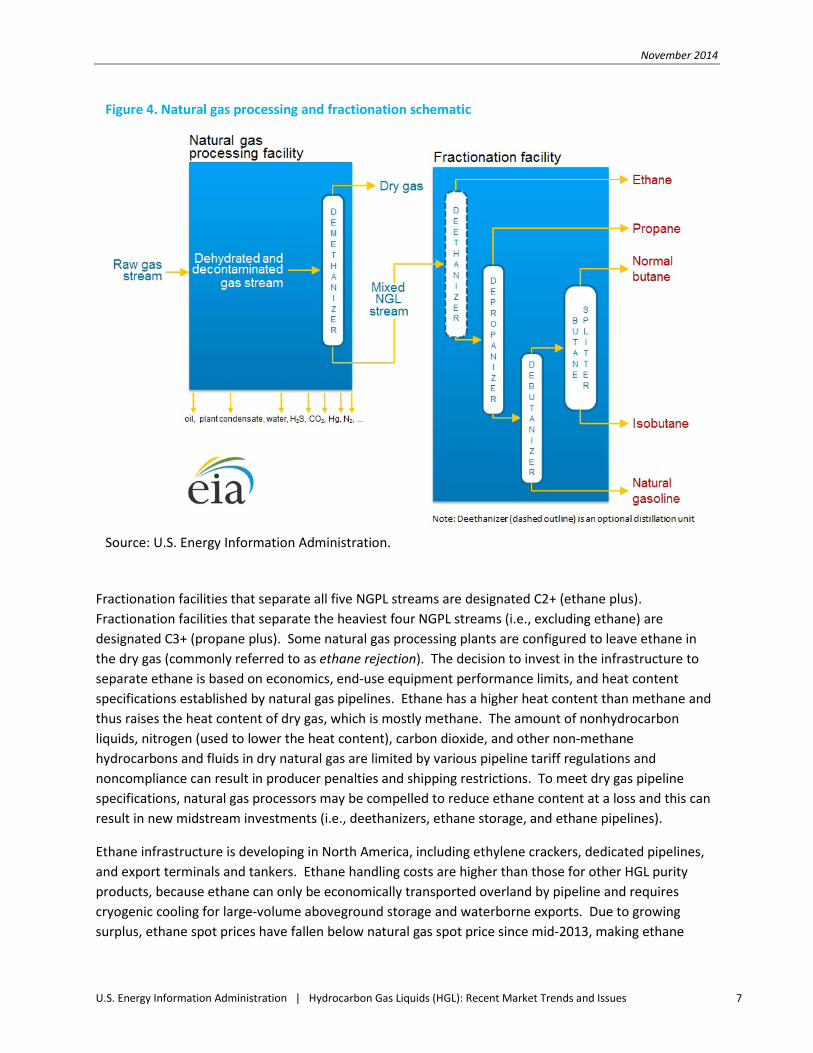
Natural gas processing and fractionation facilities The primary purpose of a natural gas processing plant is to produce pipeline-quality natural gas from raw or wet gas, removing NGPL, carbon dioxide, sulfur, and other contaminants in the process. Depending on economics, a plant may be co-located with a fractionation facility to further separate the mixed NGPL stream using distillation techniques (fractionation) into separate streams of marketable ethane, propane, normal butane, isobutane, and natural gasoline. However, more often fractionation plants receive a mixed NGL stream (sometimes referred to as a “Y-grade” stream) from one or more gas processing plants (Figure 4).
November 2014
U.S. Energy Information Administration | Hydrocarbon Gas Liquids (HGL): Recent Market Trends and Issues 7
Fractionation facilities that separate all five NGPL streams are designated C2+ (ethane plus). Fractionation facilities that separate the heaviest four NGPL streams (i.e., excluding ethane) are designated C3+ (propane plus). Some natural gas processing plants are configured to leave ethane in the dry gas (commonly referred to as ethane rejection). The decision to invest in the infrastructure to separate ethane is based on economics, end-use equipment performance limits, and heat content specifications established by natural gas pipelines. Ethane has a higher heat content than methane and thus raises the heat content of dry gas, which is mostly methane. The amount of nonhydrocarbon liquids, nitrogen (used to lower the heat content), carbon dioxide, and other non-methane hydrocarbons and fluids in dry natural gas are limited by various pipeline tariff regulations and noncompliance can result in producer penalties and shipping restrictions. To meet dry gas pipeline specifications, natural gas processors may be compelled to reduce ethane content at a loss and this can result in new midstream investments (i.e., deethanizers, ethane storage, and ethane pipelines).
Ethane infrastructure is developing in North America, including ethylene crackers, dedicated pipelines, and export terminals and tankers. Ethane handling costs are higher than those for other HGL purity products, because ethane can only be economically transported overland by pipeline and requires cryogenic cooling for large-volume aboveground storage and waterborne exports. Due to growing surplus, ethane spot prices have fallen below natural gas spot price since mid-2013, making ethane
Figure 4. Natural gas processing and fractionation schematic
Source: U.S. Energy Information Administration.

November 2014
U.S. Energy Information Administration | Hydrocarbon Gas Liquids (HGL): Recent Market Trends and Issues 8
recovery unprofitable. Until ethane is able to find its way to higher-value domestic and export markets, ethane rejection is likely to continue.
Between 2008 and 2014, HGL production from natural gas processing plants increased by 62% to 2.9 million b/d from 1.8 million b/d (Figure 5). Yet the share of ethane and propane produced has remained fairly constant at approximately 70% of the HGL total every year. The ethane share would have been higher if all of the ethane currently rejected and put into dry gas pipelines were instead recovered. EIA estimates that a range between 0.4 million and 0.6 million b/d of recoverable ethane was rejected in 2013 (above the published production volumes), primarily in the shale gas plays of Bakken, Marcellus-Utica, and Eagle Ford.1
In 2012, the most recent year for which EIA has published capacity data, 516 U.S. natural gas processing plants had an installed capacity of 64.7 billion cubic feet per day (Bcf/d) and average production of 48 bcf/d of natural gas and 2.4 million b/d of NGPL. Since 2008, NGPL as a percentage of natural gas
1 Based on EIA calculations of acceptable dry natural gas compositions that meet reported heat contents, pipeline heat content and inert gas limits, and gas supply and transport utilities Wobbe index limits.
Figure 5. HGL production from U.S. gas processors, 2000—2014
million b/d
Note: 2014 ytd includes January-August. Source: U.S. Energy Information Administration, annual and monthly U.S. Natural Gas Plant Field Production data.
0.0
0.5
1.0
1.5
2.0
2.5
3.0
2000 2002 2004 2006 2008 2010 2012 2014 ytd
Ethane
Propane
Isobutane
Normal Butane
Natural Gasoline
+ 62%

November 2014
U.S. Energy Information Administration | Hydrocarbon Gas Liquids (HGL): Recent Market Trends and Issues 9
processing plant production has increased nearly 15% (on a gaseous equivalent basis), growing from 6.1% to 7.1%.2
Natural gas processing plants use three main methods for separating NGPL from natural gas—absorption, refrigeration, and cryogenics.
• The absorption method uses lean oil in an absorber column to soak up the heavier NGPL (propane, normal butane, isobutane, and natural gasoline) from the natural gas stream. The resulting rich oil is distilled to separate the NGPL and the resultant lean oil is recycled.
• The refrigeration method uses an external system to chill the natural gas stream to below -30°F in order to condense the heavier NGPL (propane, normal butane, isobutane, and natural gasoline) leaving most of the ethane with the natural gas.
• When ethane removal is desired, cryogenic methods are used to reach temperatures below -120°F. Both low-temperature cooling (external refrigeration) and a turbo expander process (expanding the gas to reduce the temperature) are used to condense NGPL (including ethane) and remove it from the natural gas stream. The cryogenic method is the most efficient method; it removes the highest percentage of NGPL from the natural gas stream. It is also the most energy and capital intensive.
In 2012, EIA identified 16 stand-alone fractionator facilities and 106 fractionator facilities co-located with natural gas processing plants.3
Additional announced construction through 2018 totals 12.9 Bcf/d of gas processing capacity and up to 2.4 million b/d of NGPL fractionation.4 New capacity builds are concentrated in the major shale gas and tight oil formations, particularly the Marcellus-Utica, Eagle Ford, Bakken, and Permian. Existing capacity is concentrated in well-established formations near refinery and petrochemical facilities and ports along the U.S. Gulf Coast (Figure 6).
2 Calculated from EIA-64A data in 2008 and 2012. 3 Compiled from EIA-757A 2012 survey data and company websites. Fractionators co-located with gas processors receive NGPL streams from multiple gas processors. 4 Compiled from company announcements of new facility projects.

November 2014
U.S. Energy Information Administration | Hydrocarbon Gas Liquids (HGL): Recent Market Trends and Issues 10
Crude oil refineries and splitters The primary role of refineries is to produce fuels, lubricants, and other petroleum products. Refineries first distill crude oil into intermediate product streams based on vapor pressures or boiling points. These intermediate products are further processed using a variety of techniques (e.g., cracking, reforming, alkylation, and vacuum distillation) to produce finished products (e.g., motor gasoline blendstocks, kerosene, diesel fuel, heating oil, and asphalt) (Figure 7).
Figure 6. Existing and announced U.S. gas processors and fractionators, 2012
Source: U.S. Energy Information Administration, Form EIA-757, Natural Gas Processing Plant Survey, 2012 capacity data and company and industry websites.

November 2014
U.S. Energy Information Administration | Hydrocarbon Gas Liquids (HGL): Recent Market Trends and Issues 11
The HGL purity products produced in refineries are primarily propane and propylene. Refinery production of propane and propylene depends on the composition of crude oil and the configuration of refinery process units to maximize profits from the production of gasoline, diesel, jet fuel, and other high-value products. Refineries produce most propylene via fluid catalytic cracking, as a byproduct mixed with other compounds, including propane. Propylene is the primary feedstock for alkylation and polymerization, which in turn, produce certain blendstocks for motor gasoline blenders. Petrochemical plants produce more propylene than refineries and the increasing use of ethane as petrochemical feedstock is reducing their propylene production and resulting in a subsequent increase in propylene prices. Anticipation of continued high propylene prices and relatively low propane prices is the key reason for announced investments in new propane dehydrogenation (PDH) projects along the U.S. Gulf Coast.
Some HGL purity products, such as ethane, normal butane, and isobutane, are internally consumed at refineries as still gas or gasoline blendstocks. Ethane is consumed as a refinery fuel (i.e., still gas) and normal butane, isobutane, and olefins (propylene, normal butylene, and isobutylene) are used to
Figure 7. Refinery processes, generalized to highlight HGL production (simplified)
Notes: Gases* include gas collected throughout the refinery. LSR = light straight run gasoline, iC5 = isopentane, and iC6 = isohexane. Source: U.S. Energy Information Administration.

November 2014
U.S. Energy Information Administration | Hydrocarbon Gas Liquids (HGL): Recent Market Trends and Issues 12
produce alkylate for gasoline blending. Natural gasoline, which is produced as light naphtha, is also blended to produce gasoline blendstocks.
U.S. gross inputs to refineries (a measure of refinery production) indicates that refinery activity has increased from 15.3 million b/d in 2011 to 15.7 million b/d in 2013. Refinery production is on pace to increase further, averaging 16.1 million b/d during the first eight months of 2014. Just over 3.6% of refinery production is propane (0.31 million b/d during the first eight months of 2014) and propylene (0.28 million b/d) (Figure 8). HGL production volume trends are mostly determined by refineries adjusting their processing unit configurations to maximize profits from higher-volume products such as diesel, jet fuel, and blendstock for finished motor gasoline.
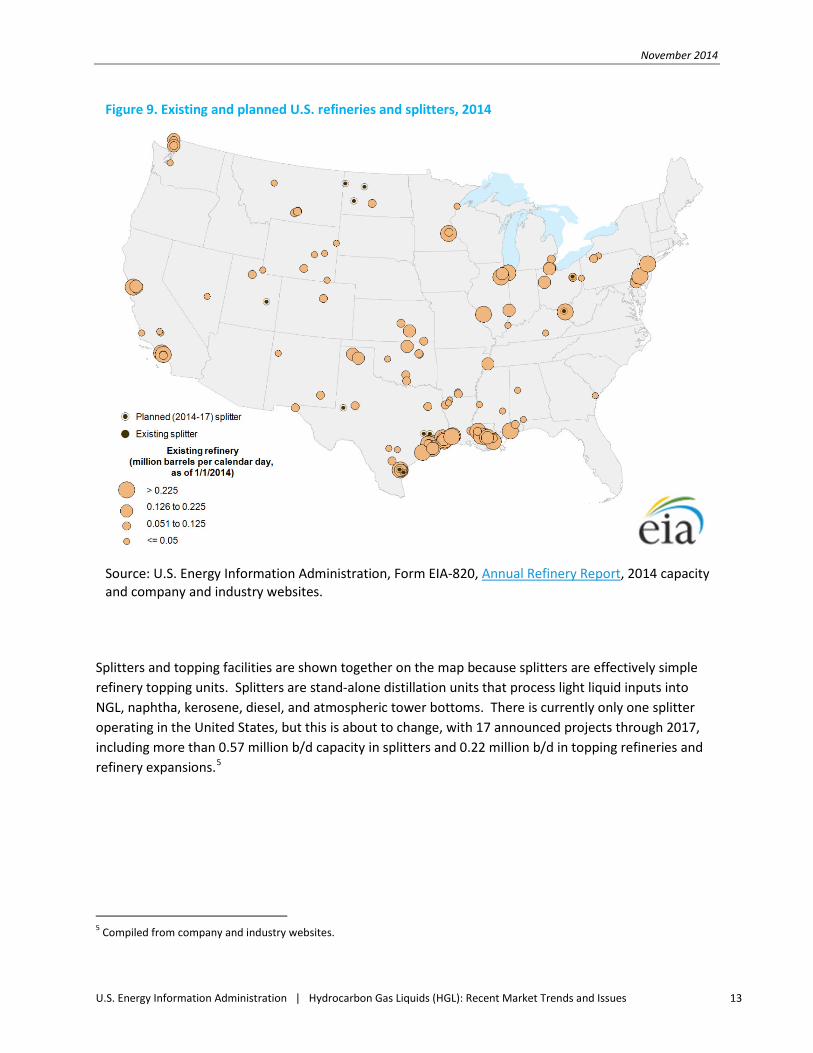
As of January 1, 2014, the United States had 142 operating refineries with a total crude oil processing capacity of 17.9 million b/d, with about half of this capacity concentrated close to logistics and supply markets along the Gulf Coast (Figure 9). As tight oil production increases, the U.S. refinery feed slate is becoming lighter. Refiners are investing in new topping facilities and expansion of existing refineries. Topping facilities are simple refineries that contain atmospheric distillation towers and tend to be considerably smaller than more complex refineries, typically 20,000—50,000 b/d, located near field production. Topping units distill crude oil into ethane, propane, normal butane, naphtha, kerosene, diesel, fuel oil, and other larger hydrocarbons (lubricating oil, paraffin waxes, and asphalt).
Figure 8. Propane and propylene production from U.S. refineries, 2000—2014
Note: 2014 ytd includes January-August. Source: U.S. Energy Information Administration, annual and monthly U.S. Refinery and Blender Net Production data.
0.0
0.1
0.2
0.3
0.4
0.5
0.6
0.7
2000 2002 2004 2006 2008 2010 2012 2014 ytd
Propane Propylene
million b/d
November 2014
U.S. Energy Information Administration | Hydrocarbon Gas Liquids (HGL): Recent Market Trends and Issues 13
Splitters and topping facilities are shown together on the map because splitters are effectively simple refinery topping units. Splitters are stand-alone distillation units that process light liquid inputs into NGL, naphtha, kerosene, diesel, and atmospheric tower bottoms. There is currently only one splitter operating in the United States, but this is about to change, with 17 announced projects through 2017, including more than 0.57 million b/d capacity in splitters and 0.22 million b/d in topping refineries and refinery expansions.5
5 Compiled from company and industry websites.
Figure 9. Existing and planned U.S. refineries and splitters, 2014
Source: U.S. Energy Information Administration, Form EIA-820, Annual Refinery Report, 2014 capacity and company and industry websites.

November 2014
U.S. Energy Information Administration | Hydrocarbon Gas Liquids (HGL): Recent Market Trends and Issues 14
HGL logistics Distance to market is an important factor affecting investment decisions. Accessibility to processing facilities, storage, and transport infrastructure (pipelines, rail, waterways, and roads) minimizes the risk of stranded assets affecting production costs or causing market disruptions.
New plays that lack midstream infrastructure can experience growing pains that can last for years while waiting for billions of dollars of investment. Commitments from producers, processors, distributors, and consumers must often first be demonstrated before significant capital is dedicated to infrastructure projects. For example, rapid growth in natural gas production from the Marcellus and Utica shale formations in Pennsylvania, Ohio, and West Virginia is encouraging proportional midstream investments in natural gas processing plants, fractionators, pipelines, aboveground and underground storage, and export facilities. Where midstream infrastructure already exists, expansions have occurred more quickly than those requiring new construction.
HGL transport Pipelines offer the lowest-cost transportation mode for HGL mixed streams, purity products, and olefins. HGL is moved by pipeline in a variety of forms:
• Y-grade (mixed HGL stream) • E-P mix (80% ethane and 20% propane) • P/P (a refinery-grade propane-propylene mix) • LPG (mixture of propane, normal butane, and isobutane) • Purity products (individual streams)
Gas processing plants produce a mixed stream, in which all of the HGL components are commingled into a single output. The industry refers to the mixed stream as Y-grade or raw make. The majority of HGL transported by pipeline is Y-grade, with limitations on methane content and minimum ethane content set by each pipeline’s tariff, for delivery to fractionators and petrochemical plants.
A smaller portion of the U.S. HGL pipeline infrastructure exists to deliver HGL purity products and mixes, primarily from the U.S. Gulf Coast refinery and petrochemical complexes to regional markets and export/import terminals (Figure 10). The map includes interstate and major intrastate pipelines and excludes gathering systems and smaller-diameter pipelines delivering to wholesalers/resellers. Aboveground and underground storage terminals are pivotal to the smooth operation of these pipelines.
Petrochemical and other industrial plants receive HGL as E-P mix, P/P mix, and purity products. E-P mix is shipped primarily by pipeline from gas plants/fractionators to ethylene crackers where it is used as a feedstock for producing ethylene and other olefins. Pipelines ship P/P mix from refineries to propylene splitters that separate the refinery-grade propylene into either polymer-grade or chemical-grade for ultimate delivery by pipeline to petrochemical facilities. Propane and normal butane (and some isobutane) are transported mixed in dedicated LPG pipelines for use in residential and commercial

November 2014
U.S. Energy Information Administration | Hydrocarbon Gas Liquids (HGL): Recent Market Trends and Issues 15
buildings (e.g., heating, cooking, and refrigeration) or in batches as purity products in petroleum product pipelines.
Recently completed pipeline projects shown on Figure 10 include:6
• Pembina’s Vantage ethane pipeline (to Canada) • Sunoco Logistics’s Mariner West ethane pipelines (to Canada) • Enterprise Products Partners’s ATEX ethane pipeline (from Houston, Pennsylvania, to Mont
Belvieu, Texas) • DCP Midstream’s NGL Front Range pipeline (from Weld County, Colorado, to Skellytown, Texas) • Oneok’s NGL Sterling III pipeline (from Medford, Oklahoma, to Mont Belvieu, Texas)
Sunoco Logistics is currently constructing the Mariner East pipeline from western Pennsylvania to its Marcus Hook, Pennsylvania, facility, scheduled to become operational by year-end 2014.7
6 Compiled from company and industry websites. 7“Sunoco Logistics to Invest approximately $2.5 Billion for Mariner East 2,” 11/6/14, http://www.sunocologistics.com/ SiteData/docs/SXLMariner/391775226a007ab7/SXL_Mariner%20East%202%20Press%20Release_FINAL.pdf.
Figure 10. Existing and planned U.S. HGL pipelines, 2014
Source: U.S. Energy Information Administration, compiled from company and industry websites.

November 2014
U.S. Energy Information Administration | Hydrocarbon Gas Liquids (HGL): Recent Market Trends and Issues 16
There are a number of regions in the United States where no interstate HGL pipelines operate, such as the West Coast, most of the Rocky Mountains, New England, Florida, and other areas where mobile homes and recreational vehicles use LPG. Where pipeline shipments are uneconomical or not possible, distributors rely on rail, tanker/barge, and truck to serve end-use markets and exports (Figure 11). All modes of shipping have specific safety requirements that increase shipping costs. Aboveground storage is needed to facilitate large movements by rail, tanker, and barge.
Mont Belvieu is recognized as the major price hub for HGL in the Gulf Coast, but EIA has identified 31 ports capable of loading and unloading HGL with greater than 100,000 barrels of storage capacity co-located at the port.8 Ports are characterized by the HGL loading method and the maximum ship draft. LPG tankers come in a few varieties, with variation in size as well as different methods of liquefaction. The tankers can be fully pressurized, fully refrigerated, or a combination of pressurized and refrigerated, and they come in four size categories.9
8 100,000 barrels is approximately equal to 628,000 m3. 9 Danish Ship Finance, Segments, http://www.shipfinance.dk/en/SHIPPING-RESEARCH/Tankskibe/LPG-Tankskibe/Segmenter.
Figure 11. Existing U.S. rail terminals, waterways, and ports handling HGL, 2014
Source: U.S. Energy Information Administration, compiled from Form EIA-814, Monthly Imports Report; U.S. Census Bureau; Sulpetro LPG Almanac (with permission); and company and industry websites.

November 2014
U.S. Energy Information Administration | Hydrocarbon Gas Liquids (HGL): Recent Market Trends and Issues 17
Very Large Gas Carrier Large Gas Carrier Medium Gas Carrier Small Gas Carrier
> 60,000 m3 40,000—60,000 m3 20,000—40,000 m3 < 20,000 m3
Ports able to load the very large gas carriers (VLGC) have equipment to load refrigerated liquids and represent the largest capital investments. There are a limited number of marine terminals able to handle VLGC in the United States (labeled on Figure 11): Enterprise Products in the Houston Ship Channel, Texas; Targa Resources in Galena Park, Texas; Sunoco Logistics in Marcus Hook, Pennsylvania; Petrogas in Ferndale, Washington; and others planned for 2015-16.10 Ports configured for either cooled pressurized or fully pressurized gases typically load smaller ships destined for U.S. and Latin American ports.
Several companies such as Phillips 66, Targa Resources Partners, Sunoco Logistics, and Enterprise Products Partners have announced plans to expand or build new HGL export facilities, mostly along the Gulf Coast to take advantage of a growing excess supply of propane, normal butane, and ethane.
Rail movements of HGL are performed on manifest trains (i.e., trains consisting of carloads of various products, not a single class of product, like unit trains). Because of the staging required to load a few tank cars of HGL, adequate underground or aboveground storage is needed. A tank car used to transport Y-grade must be able to withstand high pressures.11 EIA identified 26 rail terminals handling HGL with more than 50,000 barrels of aboveground storage.
HGL storage HGL storage methods depend on both the economics and the vapor pressure of the HGL. Propane, normal butane, isobutane, natural gasoline, and olefins (excluding ethylene) can be stored as pressurized liquids at surface temperatures in aboveground, standard welded steel tanks. Aboveground storage is used for short duration and rapid delivery of purity products and olefins. For larger long-term storage, underground storage is the least expensive option. Since the 1940s, hundreds of caverns have been used to store HGL in the United States as either purity products or mixed HGL, such as LPG or E-P mix. These caverns are primarily located in salt formations, both bedded and domed formations. Most of the domed salt formations are located near the Gulf Coast (Figure 12). Other nonsalt storage cavern geologies include shale, granite, and limestone.
10 Dan Murtaugh, “Booming U.S. NGL Exports Idled With Houston Channel Shut,” Bloomberg, 5/24/14, http://www.bloomberg.com/news/2014-03-25/booming-u-s-ngl-exports-idled-with-houston-channel-shut.html, with permission. 11 Callie Mitchell, “A Tank Car Train for Hire – NGLs on the Rails,” RBN Energy, 9/18/12, https://rbnenergy.com/a-tank-car-train-for-hire-ngls-on-the-rails.

November 2014
U.S. Energy Information Administration | Hydrocarbon Gas Liquids (HGL): Recent Market Trends and Issues 18
E-P mix can be stored in shallow storage wells, such as those at the large underground caverns in Conway, Kansas. Adding 20% propane to ethane is sufficient to reduce the mixture’s vapor pressure for storage in shallow wells.
EIA identified 28 large storage facilities (>5 million barrels capacity) that are underground caverns and another 20 mid-sized storage facilities (>1 million barrels capacity) that are mostly underground caverns. EIA also identified 47 smaller storage facilities (0.3—1.0 million barrels capacity), many of which have both underground and aboveground storage. Most of the mid-size and smaller underground facilities are complemented by co-located aboveground storage or proximity to refineries, splitters, gas processors, fractionators, ports, rail terminals, and in-transit pipeline stocks.
The higher vapor pressures of ethane and ethylene usually require either cryogenic cooling to store as a liquid or large volumetric storage as a gas. Small volumes of liquid ethane and ethylene can be stored in bullet-shaped aboveground tanks specifically built to manage higher pressures. Ethane and ethylene are usually stored as a gas in large volumes and for relatively long periods (months) in underground salt
Figure 12. Operating underground and aboveground U.S. HGL storage facilities, 2014
Source: U.S. Energy Information Administration, compiled from Sulpetro LPG Almanac and U.S. Department of Energy, National Energy Technology Laboratory, Cavern Roof Stability for Natural Gas Storage in Bedded Salt, with permission.

November 2014
U.S. Energy Information Administration | Hydrocarbon Gas Liquids (HGL): Recent Market Trends and Issues 19
caverns (both bedded and salt domes) or temporarily (days to weeks) in cryogenically cooled aboveground tanks, usually as part of an import/export facility or petrochemical complex.
The two largest storage facilities and market hubs in the United States are at Mont Belvieu, Texas, and Conway, Kansas. Mont Belvieu is the main source of supply for the Gulf Coast petrochemical industry and Gulf Coast export terminals, and Conway is the major distribution point for the Midwest. Storage is critical for HGL used seasonally such as propane. Propane is used during the winter to heat homes and livestock buildings and during the fall to supplement natural gas in drying crops (especially corn used for feeding livestock) and to produce ethanol that is blended in motor gasoline.

November 2014
U.S. Energy Information Administration | Hydrocarbon Gas Liquids (HGL): Recent Market Trends and Issues 20
HGL markets HGL prices HGL straddles petroleum and natural gas in terms of how it is produced and priced. HGL markets have both common and unique attributes that link the markets in terms of prices, supply, and demand. Prices for HGL purity products are not as transparent due to lower trading volumes relative to other energy commodities. Spot prices quoted at market hubs (Mont Belvieu and Conway) are available through subscription services; EIA reproduces daily Mont Belvieu propane spot prices.
Domestic spot prices for HGL purity products have historically floated between Henry Hub natural gas spot prices (as a floor) and Gulf Coast motor gasoline spot prices (as a ceiling). When petroleum and natural gas prices were more closely linked, HGL spot prices fell into the narrow band between petroleum and natural gas. Since 2009, when the correlation between domestic natural gas and crude oil prices weakened significantly, heavier domestic HGL products have correlated more with crude oil prices and lighter HGL products have correlated more with natural gas prices (Figure 13).
By mid-2013, this relationship started to dissolve, with all HGL purity products except natural gasoline mirroring spot natural gas price behavior. In fact, ethane prices fell below natural gas spot prices when supply became stranded without adequate infrastructure to move ethane to market. As midstream infrastructure is built to move ethane to ethylene crackers and export facilities, ethane spot prices are likely to stabilize above natural gas prices, provided ethane processing and transportation capacities can catch up to growing supplies. Unlike domestic spot prices, international HGL markets still closely track crude oil prices.
Figure 13. Comparison of select HGL, petroleum, and natural gas spot prices, 2000—2014
dollars per million Btu
Source: Bloomberg, reproduced with permission, through October 2014.
0
5
10
15
20
25
30
2000 2002 2004 2006 2008 2010 2012 2014
Motor Gasoline (Gulf Coast)Crude Oil (WTI)Propane( Mont Belvieu)Ethane (Mont Belvieu)Natural Gas (Henry Hub)

November 2014
U.S. Energy Information Administration | Hydrocarbon Gas Liquids (HGL): Recent Market Trends and Issues 21
Propane, as the most seasonally responsive of HGL products, has spot prices that can vary almost $10 per million British thermal units (MMBtu) over a calendar year. Propane seasonal supply and demand are highly dependent on the severity of winter weather, corn drying conditions, and transportation capacity limits. Combined with growing propane production and exports, propane pricing forecasts carry large uncertainties.
Rapidly growing propane production and limited demand growth have recently contributed to lower prices. In 2011, the propane spot price at Mont Belvieu stopped tracking crude oil and motor gasoline prices and in 2014 fell midway between motor gasoline and natural gas prices. In contrast, natural gasoline, by virtue of its use as a gasoline blendstock, denaturant for ethanol, and diluent for Canadian oil sands, closely tracks crude oil spot prices.
A majority of HGL trading is done in over-the-counter forwards markets with pricing available only through subscription services. Futures prices on the New York Mercantile Exchange recorded by the Intercontinental Exchange and the CME Group are available for all HGL purity products, but the trading is thin.12 As a result, EIA stopped reporting daily closing propane futures prices in September 2009. Monthly average propane reseller and retail prices for select end-users were surveyed by EIA through February 2011. The loss of these price series affected short-term and long-term projections as well as analyses of industrial and petrochemical propane use. During the winter, EIA surveys propane dealers in select states whose homeowners use propane for home heating, and aggregates the data at the state level. This program has been revised to expand coverage to 38 states, and include wholesale propane prices licensed for publication from OPIS (Oil Price Information Service) in addition to retail residential propane prices.
EIA produces a national NGPL composite spot price that is published in its Natural Gas Weekly Update and its Natural Gas Monthly publications.13 The NGPL composite, as it relates to the natural gas spot price at Henry Hub, serves as a measure of the relative value added through gas processing (Figure 14). During most of 2011 and into early 2012, that value added exceeded $10/MMBtu. This period corresponded with an aggressive shift by oil and gas producers toward wetter resources, particularly in new shale formations. Domestic demand and exports were unable to absorb the resulting surplus, and as a result, stocks built and prices fell. Beginning mid-2012, the price spread stabilized at approximately $6/MMBtu as NGPL pricing broke away from predominantly oil-based pricing, aligning instead with natural gas pricing. National spot prices do not fully determine individual plant economics, which will always be more responsive to local yields and netback calculations.
12 The volume traded for propane, the most heavily traded HGL product, is less than 1% of the volume traded for gasoline or crude futures. See CME Group, Petrochemicals tab, http://www.cmegroup.com/trading/energy/#. 13 EIA, Natural Gas Weekly Update, NGPL prices table, http://www.eia.gov/naturalgas/weekly/#tabs-prices-4, and Natural Gas Monthly, Natural Gas Spot and Futures Prices (NYMEX) table, http://www.eia.gov/dnav/ng/ng_pri_fut_s1_m.htm.

November 2014
U.S. Energy Information Administration | Hydrocarbon Gas Liquids (HGL): Recent Market Trends and Issues 22
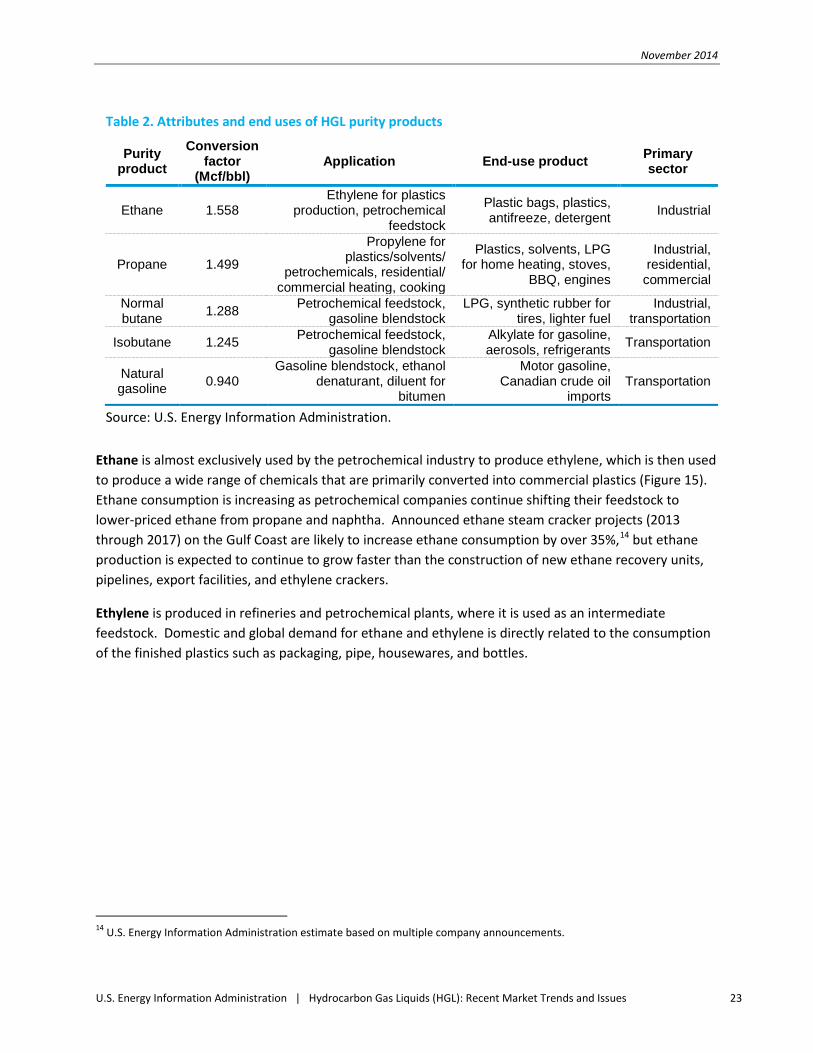
HGL end uses There are many uses for HGL, spanning all sectors of the economy (Table 2). HGL purity products are used as petrochemical feedstocks, burned for space heating and cooking, and blended into vehicle fuel, among other uses. The chemical composition of these hydrocarbons is similar, yet their applications vary widely.
Figure 14. U.S. NGPL composite spot price and NGPL/natural gas price spread, 2009—14
Source: U.S. Energy Information Administration, monthly price averages from January 2009 to August 2014.
0
2
4
6
8
10
12
14
16
18
2009 2010 2011 2012 2013 2014
NGPL/natural gas price spread
NGPL composite spot price
Natural gas spot price (Henry Hub)
dollars per million Btu
November 2014
U.S. Energy Information Administration | Hydrocarbon Gas Liquids (HGL): Recent Market Trends and Issues 23
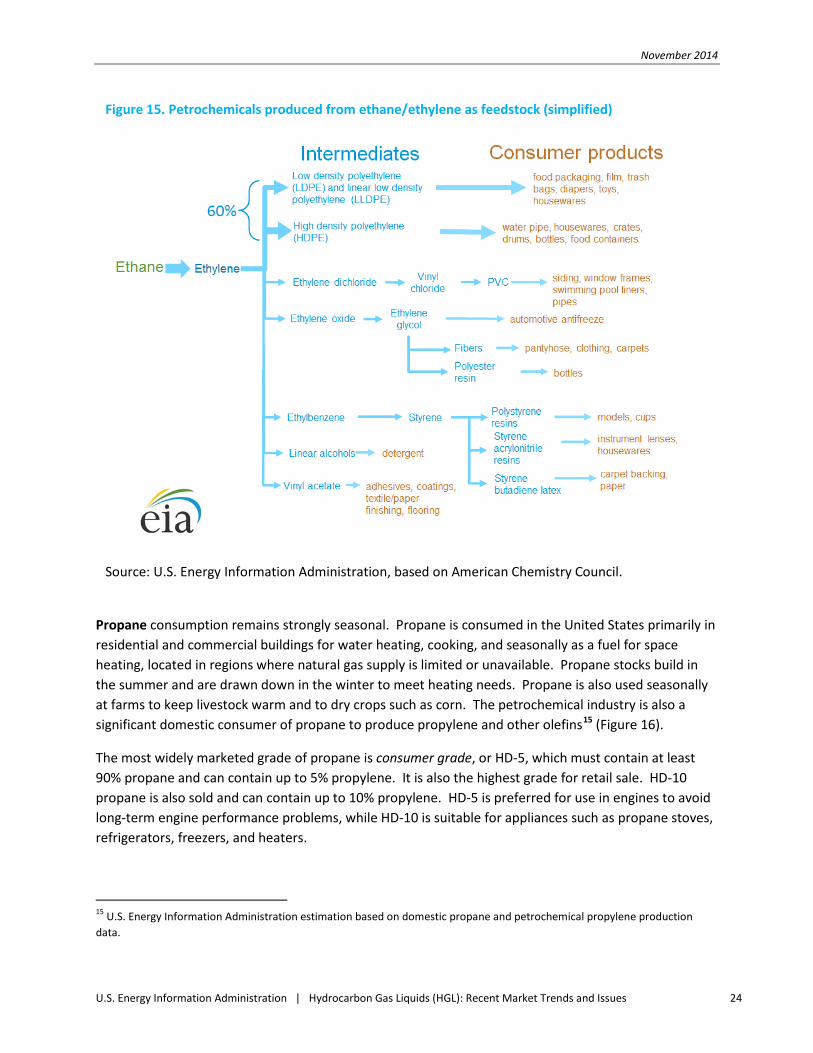
Ethane is almost exclusively used by the petrochemical industry to produce ethylene, which is then used to produce a wide range of chemicals that are primarily converted into commercial plastics (Figure 15). Ethane consumption is increasing as petrochemical companies continue shifting their feedstock to lower-priced ethane from propane and naphtha. Announced ethane steam cracker projects (2013 through 2017) on the Gulf Coast are likely to increase ethane consumption by over 35%,14 but ethane production is expected to continue to grow faster than the construction of new ethane recovery units, pipelines, export facilities, and ethylene crackers.
Ethylene is produced in refineries and petrochemical plants, where it is used as an intermediate feedstock. Domestic and global demand for ethane and ethylene is directly related to the consumption of the finished plastics such as packaging, pipe, housewares, and bottles.
14 U.S. Energy Information Administration estimate based on multiple company announcements.
Table 2. Attributes and end uses of HGL purity products
Purity product
Conversion factor
(Mcf/bbl) Application End-use product Primary
sector
Ethane 1.558 Ethylene for plastics
production, petrochemical feedstock
Plastic bags, plastics, antifreeze, detergent Industrial
Propane 1.499
Propylene for plastics/solvents/
petrochemicals, residential/ commercial heating, cooking
Plastics, solvents, LPG for home heating, stoves,
BBQ, engines
Industrial, residential,
commercial
Normal butane 1.288 Petrochemical feedstock,
gasoline blendstock LPG, synthetic rubber for
tires, lighter fuel Industrial,
transportation
Isobutane 1.245 Petrochemical feedstock, gasoline blendstock
Alkylate for gasoline, aerosols, refrigerants Transportation
Natural gasoline 0.940
Gasoline blendstock, ethanol denaturant, diluent for
bitumen
Motor gasoline, Canadian crude oil
imports Transportation
Source: U.S. Energy Information Administration.
November 2014
U.S. Energy Information Administration | Hydrocarbon Gas Liquids (HGL): Recent Market Trends and Issues 24
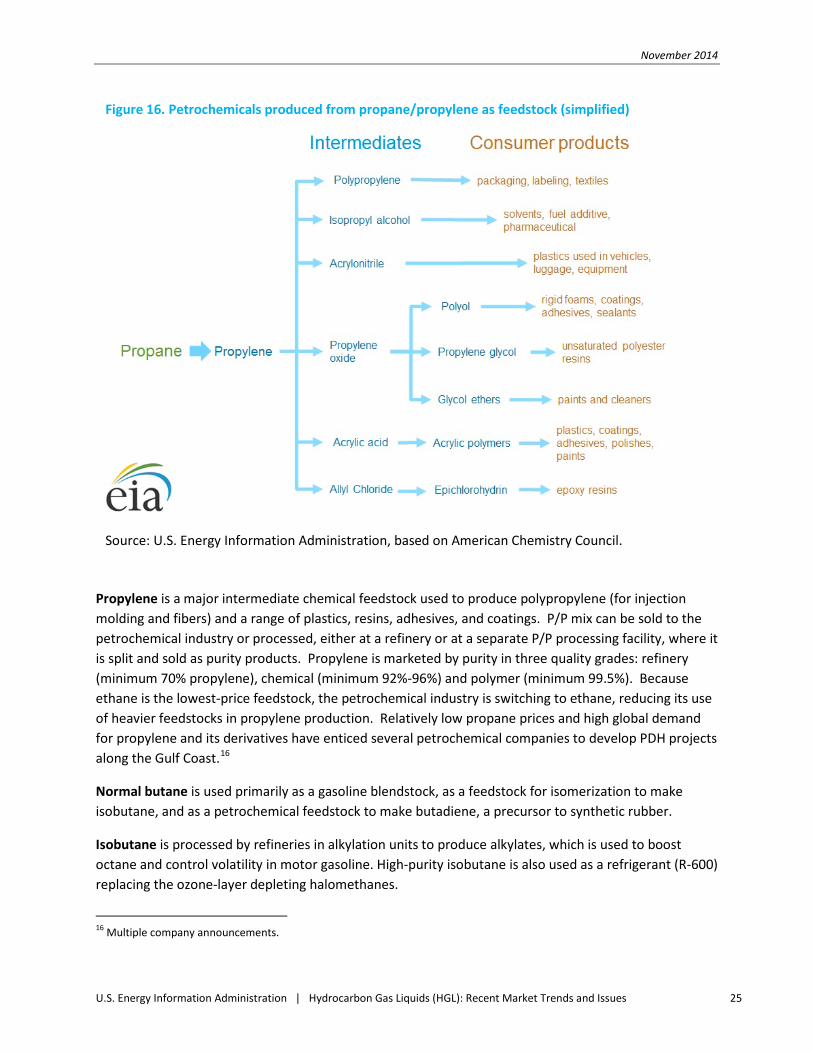
Propane consumption remains strongly seasonal. Propane is consumed in the United States primarily in residential and commercial buildings for water heating, cooking, and seasonally as a fuel for space heating, located in regions where natural gas supply is limited or unavailable. Propane stocks build in the summer and are drawn down in the winter to meet heating needs. Propane is also used seasonally at farms to keep livestock warm and to dry crops such as corn. The petrochemical industry is also a significant domestic consumer of propane to produce propylene and other olefins15 (Figure 16).
The most widely marketed grade of propane is consumer grade, or HD-5, which must contain at least 90% propane and can contain up to 5% propylene. It is also the highest grade for retail sale. HD-10 propane is also sold and can contain up to 10% propylene. HD-5 is preferred for use in engines to avoid long-term engine performance problems, while HD-10 is suitable for appliances such as propane stoves, refrigerators, freezers, and heaters.
15 U.S. Energy Information Administration estimation based on domestic propane and petrochemical propylene production data.
Figure 15. Petrochemicals produced from ethane/ethylene as feedstock (simplified)
Source: U.S. Energy Information Administration, based on American Chemistry Council.
November 2014
U.S. Energy Information Administration | Hydrocarbon Gas Liquids (HGL): Recent Market Trends and Issues 25
Propylene is a major intermediate chemical feedstock used to produce polypropylene (for injection molding and fibers) and a range of plastics, resins, adhesives, and coatings. P/P mix can be sold to the petrochemical industry or processed, either at a refinery or at a separate P/P processing facility, where it is split and sold as purity products. Propylene is marketed by purity in three quality grades: refinery (minimum 70% propylene), chemical (minimum 92%-96%) and polymer (minimum 99.5%). Because ethane is the lowest-price feedstock, the petrochemical industry is switching to ethane, reducing its use of heavier feedstocks in propylene production. Relatively low propane prices and high global demand for propylene and its derivatives have enticed several petrochemical companies to develop PDH projects along the Gulf Coast.16
Normal butane is used primarily as a gasoline blendstock, as a feedstock for isomerization to make isobutane, and as a petrochemical feedstock to make butadiene, a precursor to synthetic rubber.
Isobutane is processed by refineries in alkylation units to produce alkylates, which is used to boost octane and control volatility in motor gasoline. High-purity isobutane is also used as a refrigerant (R-600) replacing the ozone-layer depleting halomethanes.
16 Multiple company announcements.
Figure 16. Petrochemicals produced from propane/propylene as feedstock (simplified)
Source: U.S. Energy Information Administration, based on American Chemistry Council.

November 2014
U.S. Energy Information Administration | Hydrocarbon Gas Liquids (HGL): Recent Market Trends and Issues 26
Natural gasoline (pentanes plus) can be blended into various types of fuel for combustion engines, and is useful in energy recovery from wells and oil sands. Almost half of the natural gasoline produced is exported to western Canada as diluent for heavy crude, enabling its movement in pipelines to the United States. Oil sands bitumen mixed with diluent is known as dilbit. Natural gasoline is also used as a denaturant for ethanol up to 2.5% by volume, making the alcohol unfit for drinking. Denatured ethanol is blended with either conventional or reformulated gasoline to meet octane and other specifications, specifically the Clean Air Act requirement for oxygenated gasoline and the Energy Independence and Security Act requirement for renewable fuel use. In addition, a number of ethanol plants are blending natural gasoline from gas processors instead of refined gasoline blendstocks to create E85, a high-ethanol-blend gasoline. The volume of natural gasoline used this way is not known.
HGL imports and exports While U.S. gas processors/fractionators and refiners/splitters produce more HGL than is needed to meet domestic demand, imports continue to arrive when needed to meet certain geographic or seasonal demand.
• Propane imports arrive from Canada by pipeline and rail to the U.S. Midwest and Northeast. U.S. imports from Canada peak in the winter, approaching 0.2 million b/d and falling below 0.1 million b/d in the summer.
• Natural gasoline imports arrive from Mexico and Peru to the U.S. Gulf Coast, replacing Venezuelan imports that ended in mid-2012.
The United States has been a net exporter (exports exceeding imports) of propane and normal butane since 2011 and natural gasoline since 2008. In 2013, the United States exported 0.3 million b/d of propane, and those exports have grown considerably, reaching 0.45 million b/d in May 2014, or about 25% of total domestic production from gas processors and refiners. U.S. exports of propane are destined to Canada, Japan, and Latin American countries. As HGL production continues to grow and outpace domestic demand, exports are expected to increase and continue strong.
U.S. exports of natural gasoline peaked in June 2013 at 0.25 million b/d, almost exclusively destined to Canada for use as diluent for movements of heavy western Canadian crude. U.S. natural gasoline production is also increasing faster than domestic demand, and to date in 2014, the United States has exported half of its natural gasoline production to Canada. Western Canada oil sands production is projected to grow significantly, requiring additional natural gasoline as diluent. If rail becomes the primary transportation mode for western Canada crude, the demand for incremental natural gasoline will be dampened as additional heated rail cars are added to the rail fleet. Rail shipments of Canadian heavy crude oil require about half the amount of diluent required for pipeline shipments.
Rapid growth in U.S. ethane production has also resulted in exports to Canada by pipeline and to Europe by liquefied ethane tankers. Pipeline exports began in December 2013 with the start of the Mariner

November 2014
U.S. Energy Information Administration | Hydrocarbon Gas Liquids (HGL): Recent Market Trends and Issues 27
West pipeline, which with the Vantage pipeline, is anticipated to reach 0.09 million b/d in 2015.17 The first tanker exports are expected in 2015 with 0.02-million-b/d shipments from Sunoco Logistics’s Marcus Hook terminal to Rafnes, Norway. Enterprise Products Partners has also announced a 0.24 million b/d ethane export facility project on the U.S. Gulf Coast.18 Other announced investments in foreign petrochemical and import terminal upgrades, new dedicated ship builds, and long-term ethane contracts will facilitate the export of U.S. ethane to India and Europe for use as petrochemical feedstock.
17 EIA, “U.S. purity ethane ships to Canada for first time in 25 years,” Today in Energy, 5/6/14, http://www.eia.gov/todayinenergy/detail.cfm?id=16151. 18 Enterprise Products Partners website, 8/25/2014, http://www.enterpriseproducts.com/operations/nglexport.shtm.