Short-Term Outlook for Hydrocarbon Gas Liquids · Short-Term Outlook for Hydrocarbon Gas Liquids...
26
Short-Term Outlook for Hydrocarbon Gas Liquids March 2016 Independent Statistics & Analysis www.eia.gov U.S. Department of Energy Washington, DC 20585
Transcript of Short-Term Outlook for Hydrocarbon Gas Liquids · Short-Term Outlook for Hydrocarbon Gas Liquids...

Short-Term Outlook for
Hydrocarbon Gas Liquids
March 2016
Independent Statistics & Analysis
www.eia.gov
U.S. Department of Energy
Washington, DC 20585

U.S. Energy Information Administration | Short-Term Energy Outlook for Hydrocarbon Gas Liquids i
This report was prepared by the U.S. Energy Information Administration (EIA), the statistical and
analytical agency within the U.S. Department of Energy. By law, EIA’s data, analyses, and forecasts are
independent of approval by any other officer or employee of the United States Government. The views
in this report therefore should not be construed as representing those of the U.S. Department of Energy
or other federal agencies.

March 2016
U.S. Energy Information Administration | Short-Term Energy Outlook for Hydrocarbon Gas Liquids ii
Table of Contents
Overview ....................................................................................................................................................... 1
Ethane Outlook ............................................................................................................................................. 4
Natural gas plant production of ethane .................................................................................................. 5
Domestic consumption of ethane ........................................................................................................... 6
Net exports of ethane .............................................................................................................................. 7
Propane Outlook ........................................................................................................................................... 9
Natural gas plant production of propane ................................................................................................ 9
Domestic consumption of propane ....................................................................................................... 10
Net exports of propane ......................................................................................................................... 11
Propane inventories............................................................................................................................... 12
Butanes Outlook ......................................................................................................................................... 15
Natural gas plant production of butanes ............................................................................................... 15
Refinery and blender net inputs and net production, inventory change, and domestic consumption 16
Net exports of butanes .......................................................................................................................... 17
Natural gasoline (pentanes plus) ................................................................................................................ 18
Natural gas plant production of natural gasoline .................................................................................. 18
Domestic consumption and refinery net inputs of natural gasoline ..................................................... 19
Net exports of natural gasoline ............................................................................................................. 19
Appendix ..................................................................................................................................................... 20

March 2016
U.S. Energy Information Administration | Short-Term Energy Outlook for Hydrocarbon Gas Liquids iii
Tables
Table 1. Ethane supply and disposition, 2013-17 ......................................................................................... 5
Table 2. Additional capacity of ethylene plants to consume ethane feedstock and projected growth in
ethane consumption, 2013-17 ...................................................................................................................... 6
Table 3. Ethane export capacity and net exports ......................................................................................... 7
Table 4. Propane supply and disposition, 2013-17 ..................................................................................... 10
Table 5. U.S. propane/butane export capacity and net exports ................................................................. 12
Table 6. Butanes supply and disposition, 2013-17 ..................................................................................... 15
Table 7. Natural gasoline supply and disposition, 2013-17 ........................................................................ 19
Appendix Tables
Table A1. Assumed timeline for additions to ethane feedstock capacity at ethylene cracking plants,
quarterly 2013-17 ....................................................................................................................................... 20
Table A2. Assumed timeline for startup of U.S. propane dehydrogenation (PDH) plants with related
propane feedstock capacity, quarterly 2010-17 ......................................................................................... 21
Table A3. Assumed timeline for U.S. ethane export pipelines and terminals with related capacities,
quarterly 2013-2017 ................................................................................................................................... 21
Table A4. Assumed timeline for U.S. propane/butane export terminals with related capacities, quarterly
2013-17 ....................................................................................................................................................... 22

March 2016
U.S. Energy Information Administration | Short-Term Energy Outlook for Hydrocarbon Gas Liquids iv
Figures
Figure 1. Growth in hydrocarbon gas liquids production (excluding rejection) at natural gas plants and
marketed natural gas production, quarterly 2008-17 .................................................................................. 1
Figure 2. Natural gas plant production of hydrocarbon gas liquids, quarterly 2008-17 .............................. 2
Figure 3. HGL prices relative to natural gas and crude oil, January 2013 – February 2016 ......................... 3
Figure 4. Ethane supply and disposition, quarterly 2014-17 ....................................................................... 4
Figure 5. Ethane export capacity and net exports, quarterly 2014-17 ........................................................ 8
Figure 6. Propane supply and disposition, quarterly 2014-17 ...................................................................... 9
Figure 7. U.S. propane consumption and population-weighted heating degree days, quarterly 2014-17 11
Figure 8. Propane inventories on the Gulf Coast (PADD 3), monthly 2014-17 ........................................... 14
Figure 9. Butanes supply and disposition, quarterly 2014-17 .................................................................... 16
Figure 10. Natural gasoline supply and disposition, quarterly 2014-17 ..................................................... 18

March 2016
U.S. Energy Information Administration | Short-Term Energy Outlook for Hydrocarbon Gas Liquids 1
Overview
U.S. liquid fuels production increased from 7.43 million barrels per day (b/d) in 2008 to 13.75 million b/d in 2015. However, the Short-Term Energy Outlook (STEO) expects liquid fuels production to decline to 12.99 million b/d in 2017, mainly as a result of prolonged low oil prices. The liquid fuels production forecast reflects a 1.24 million b/d decline in crude oil production by 2017 that is partially offset by a 450,000 b/d increase in the production of hydrocarbon gas liquids (HGL)—a group of products including ethane, propane, normal butane, isobutane, natural gasoline, and refinery olefins.
HGL production happens at natural gas processing plants and petroleum refineries, but between 2008 and 2015, almost all of the growth in HGL production occurred at natural gas processing plants as a by-product of the growing supply of natural gas from shale gas and tight oil formations. Investment projects that increased the capacity to produce, store, transport, export, and consume HGL enabled the supply of HGL to expand at a faster rate than natural gas production (Figure 1). STEO expects HGL production growth to continue to outpace natural gas production in 2016 and 2017, as more HGL infrastructure projects are completed.
Each HGL product serves a different market with a unique set of supply and demand drivers. Recently
expanded export facilities have allowed excess propane, butane, and natural gasoline production to be
shipped to foreign markets. Unlike the other HGL products, ethane production has been constrained by
lack of demand and low prices. This analysis will discuss the outlook for each of these four HGL streams
and related infrastructure projects through 2017. Learn more about the operations of the HGL market in
Hydrocarbon Gas Liquids: Recent Market Trends and Issues.
Figure 1. Growth in hydrocarbon gas liquids production (excluding rejection) at natural gas plants and marketed natural gas production, quarterly 2008-17
Source: U.S. Energy Information Administration, Short-Term Energy Outlook, March 2016

March 2016
U.S. Energy Information Administration | Short-Term Energy Outlook for Hydrocarbon Gas Liquids 2
Key features of the outlook for HGL include:
Forecast growth in marketed natural gas production slows from 5% in 2015 to 1% in 2016 and to 2% in 2017. Natural gas plant HGL production, or natural gas plant liquids (NGPL), which grew by 9% in 2015, is forecast to grow by 5% in 2016, and by 8% in 2017.
From 2015 through 2017, natural gas plant production of HGL is forecast to grow 450,000 b/d, with increased ethane production accounting for 66% of this growth (Figure 2). Ethane production growth occurs as expanded petrochemical and export capacity provides new outlets for supply and allows more ethane to be recovered from raw natural gas. Ethane provides 140,000 b/d of the 180,000 b/d forecast HGL production growth in 2016, and 160,000 b/d of 280,000 b/d HGL production growth in 2017.
Forecast HGL consumption in the United States increases more slowly than production, increasing by 1% in both 2016 and 2017. In 2016, increased ethane consumption offsets reduced consumption for other HGL. In 2017, the expected startup of six ethane-consuming petrochemical plants leads to an 80,000 b/d increase in ethane consumption, which more than offsets a 50,000 b/d decline in propane consumption.
With HGL production outpacing consumption, forecast net exports of HGL increase by 38% (310,000 b/d) in 2016 and by 19% (220,000 b/d) in 2017. New export facilities allow net exports of HGL, which increased 260,000 b/d in 2015, to grow 310,000 b/d in 2016, and 220,000 b/d in 2017.
Figure 2. Natural gas plant production of hydrocarbon gas liquids, quarterly 2008-17
Source: U.S. Energy Information Administration, Short-Term Energy Outlook, March 2016
Much of the growth in HGL markets that occurred in 2015 and that is expected over the next two years is the result of infrastructure investment decisions made before the summer of 2014 when crude oil prices began to drop, changing the economics of crude oil, natural gas, and HGL. Domestic spot prices of HGL products generally fall between crude oil and natural gas spot prices

March 2016
U.S. Energy Information Administration | Short-Term Energy Outlook for Hydrocarbon Gas Liquids 3
prices of HGL products generally fall between crude oil and natural gas spot prices on a heat-content basis, ($/million British thermal units (MMBtu))(Figure 3). Propane, butane, and natural gasoline spot prices, which have historically moved with crude oil prices, have stayed consistently above the Henry Hub natural gas price since 2008, providing positive margins when these products were produced at natural gas plants. On the other hand, an oversupply of ethane kept ethane prices at or below the Henry Hub natural gas price from mid-2012 to late-2015. When ethane margins are negative, producers have an incentive to reject ethane, or leave it in the dry pipeline natural gas stream where it sells for its fuel value. However, ethane prices went above Henry Hub natural gas prices on September 22, 2015, and margins are assumed to be mainly positive through 2017, as new petrochemical demand and exports reduce the oversupply of ethane.
Except for ethane prices, HGL prices have remained higher than natural gas prices on an energy-content basis. Since mid-2014, crude oil prices have fallen, pulling down HGL prices. Natural gas prices have also declined since mid-2014, but by less than HGL prices, causing HGL processing margins to narrow. Despite lower processing margins throughout 2015, prior commitments by producers and midstream operators to process liquids and the continuing preference for liquids over natural gas contributed to estimated HGL production growth of 280,000 b/d (9%) between June 2014 and December 2015.
Figure 3. HGL prices relative to natural gas and crude oil, January 2013 – February 2016
Note: All prices are daily end-of-day spot prices, natural gas is Henry Hub, West Texas Intermediate (WTI) crude oil is at
Cushing, OK, and NGL components are Mont Belvieu. NGPL composite calculated based on calorific contribution of each purity
to total NGPL barrel heat value.
Source: U.S. Energy Information Administration, based on WTI spot prices from Thomson Reuters and all other spot prices from
Bloomberg, L.P.

March 2016
U.S. Energy Information Administration | Short-Term Energy Outlook for Hydrocarbon Gas Liquids 4
Ethane Outlook
STEO projects ethane consumption, which was flat in 2015, to increase by 50,000 b/d in 2016 and by
80,000 b/d in 2017 (Figure 5). Ethane production at natural gas plants, which increased 20,000 b/d in
2015, is forecast to increase by 140,000 b/d in 2016 and by 160,000 b/d in 2017. Net exports are
forecast to grow by 80,000 b/d in 2016 and 90,000 b/d in 2017, compared to growth of 30,000 b/d in
2015.
STEO projects annual average gas plant production of HGL to grow 450,000 b/d by 2017, with increased
ethane production accounting for two-thirds of this growth (Figure 2). Over the past several years, the
amount of ethane contained in raw natural gas has exceeded the U.S. capacity to consume and export it.
This oversupply kept ethane prices relatively low, hovering at or below the price of natural gas on a
heat-content basis ($/million British thermal units (MMBtu)) (Figure 3). The lower prices created an
incentive for producers to reject ethane into pipeline natural gas to capture its value as a fuel, as
opposed to recovering it at gas plants and marketing it as a separate product for use in the
petrochemical manufacturing. As new ethane-consuming petrochemical and export capacity reduces
the ethane oversupply in 2016-17, ethane prices are expected to generally remain above natural gas
prices in $/MMBtu, and ethane recovery is expected to rise to meet demand and export growth.
Figure 4. Ethane supply and disposition, quarterly 2014-17
Note: Consumption, refinery production, and inventories include refinery-sourced ethylene. EIA uses product supplied as a
proxy for consumption.
Source: U.S. Energy Information Administration, Short-Term Energy Outlook, March 2016

March 2016
U.S. Energy Information Administration | Short-Term Energy Outlook for Hydrocarbon Gas Liquids 5
In 2016-17, EIA expects the completion of several infrastructure projects to contribute to higher
consumption, net exports, and gas plant production of ethane. New and expanded petrochemical plant
capacity and new export terminal capacity will provide new outlets for a market that has been over
supplied. At the same time, new pipelines, de-ethanization plants, and storage capacity will allow more
ethane to be separated from natural gas and transported to demand centers.
Natural gas plant production of ethane Raw natural gas has a higher content of ethane than of the other HGL components, but since 2012
natural gas plant recovery of ethane has grown more slowly and sporadically than propane, butane, and
natural gasoline. Although the ethane was produced alongside the other HGL streams, persistently weak
ethane demand and prices provided a disincentive for ethane recovery at natural gas plants and
encouraged producers to reject some ethane into the pipeline gas to capture its value as a fuel at
natural gas prices (Figure 3, Table 1).
Ethane recovery is expected to increase as expanded infrastructure allows it to reach new markets,
where it can fetch a higher price. In recent years, the availability of inexpensive ethane feedstock led to
a wave of investments in ethane-consuming petrochemical plants, export facilities, and the
infrastructure required to recover it from raw natural gas and transport it to market. Many of these
projects are under construction and will come online in the next few years. Among these projects are
new de-ethanization facilities, ethane pipelines, and ethane export facilities. These projects increase
take-away capacity for ethane, especially in the Marcellus and Utica shale regions, where market outlets
for rapidly growing supplies were previously limited to pipeline natural gas.
Increased ethane recovery is expected to result in ethane production (excluding rejection) growth that is
much stronger than natural gas production growth, with annual ethane production rising 27% between
2015 and 2017 and marketed natural gas production rising 3%. STEO projects ethane production to
increase by 140,000 b/d in 2016 and by 160,000 b/d in 2017, compared with annual average growth of
50,000 b/d between 2008 and 2015.
Table 1. Ethane supply and disposition, 2013-17
million barrels per day Annual Average Year-over-year change
Forecast Forecast
2013 2014 2015 2016 2017 2015 2016 2017
Gas Plant Production 0.97 1.09 1.11 1.24 1.41 0.02 0.14 0.16
Refinery and Blender Net Production 0.01 0.01 0.01 0.01 0.00 0.00 0.00 0.00
Net Imports 0.00 -0.04 -0.06 -0.14 -0.23 -0.03 -0.08 -0.09
Stock Build (Draw) -0.01 0.01 0.00 0.00 0.00 -0.01 0.00 0.00
Consumption 0.99 1.05 1.05 1.11 1.18 0.00 0.05 0.08
Note: Consumption, refinery production, and inventories include refinery-sourced ethylene. EIA uses product supplied as a
proxy for consumption.
Source: U.S. Energy Information Administration, Short-Term Energy Outlook, March 2016

March 2016
U.S. Energy Information Administration | Short-Term Energy Outlook for Hydrocarbon Gas Liquids 6
Domestic consumption of ethane STEO forecasts ethane consumption to rise from 1.05 million b/d in 2015 to 1.18 million b/d in 2017.
Ethane is used almost exclusively as a feedstock for ethylene production at petrochemical plants, a use
that is expected to expand as new ethylene plant capacity comes online. Ethylene plants can process
feedstocks including ethane, propane, butane, naphtha, and heavier liquids to produce ethylene, an
important component for manufacturing plastics and other industrial materials. Depending on plant
configuration and feedstocks consumed, ethylene production also results in the coproduction of other
petrochemicals including propylene, butylene, and other aromatics. The relatively low cost of U.S.
ethane led to a wave of investment in ethylene plant projects, including plant restarts, capacity
expansion and feedstock conversions at existing plants, and new ethylene plants, expected to increase
the ethane throughput capacity by 440,000 b/d by the end of 2017 (Table 2), with most of this at the
end of 2017.
Table 2. Additional capacity of ethylene plants to consume ethane feedstock and projected growth in ethane consumption, 2013-17
million barrels per day Forecast
2013 2014 2015 2016 2017
Capacity expansions (including restarts and debottlenecking) 0.04 0.04 0.04 0.03 0.04
New ethylene plants - - - - - - - - 0.37
Feedstock conversions 0.00 0.01 0.01 0.01 - -
Total annual throughput capacity additions (end-of-year) 0.04 0.05 0.05 0.04 0.40
Annual consumption growth 0.11 0.06 0.00 0.05 0.08
- - = Not applicable
Source: U.S. Energy Information Administration, capacities are end-of year estimates based on various company
announcements and trade-press articles. See Table A1 for assumed timeline of projects. Consumption (product supplied)
growth is from Short-Term Energy Outlook, March 2016
A number of projects to restart or expand the capacity of ethylene-producing plants to use ethane as
their feedstock increased ethane throughput capacity by about 140,000 b/d between 2013 and 2015
(Table 2). Most of this new capacity was from expansion projects scheduled to come online late in 2015,
which may not impact feedstock demand until the first or second quarter of 2016, depending on plant
ramp up schedules. Two more expansion projects and a feedstock conversion project, capable of using
another 40,000 b/d of ethane, are expected in 2016 (See Appendix Table A1 for a complete list of
projects). Some existing plants have the flexibility to switch feedstocks and may choose to increase their
ethane throughput or use alternative feedstocks, such as naphtha or propane, when prices are
competitive.
Five new ethylene crackers (from Dow, Formosa, ExxonMobil, Chevron Philips, and
OxyChem/Mexichem) and two expansion projects (Lyondell Bassell and Westlake) are under
construction and are expected to begin operating in 2017. In addition, Indorama Ventures recently
acquired a mothballed plant and has proposed restarting the plant by the end of 2017. These projects

March 2016
U.S. Energy Information Administration | Short-Term Energy Outlook for Hydrocarbon Gas Liquids 7
are expected to expand ethane throughput capacity by more than 400,000 b/d in 2017, with the bulk of
the capacity coming on at the end of the year. The new plants are designed to consume predominantly
light feedstock, and EIA expects ethane to constitute most of their feed. However, the amount of
ethane used in these plants will be determined mainly by the ethylene production margins (cracking
margins), which will be driven by the demand for and price of ethylene and propylene compared with
ethane and other feedstocks.
Net exports of ethane In 2014, the United States switched from being a net importer of ethane to a net exporter after the
opening of two new ethane pipelines that began transporting ethane from North Dakota and
southwestern Pennsylvania to Canada. STEO expects annual average ethane net exports (gross exports
minus gross imports) to increase from 60,000 b/d in 2015 to 230,000 b/d in 2017, as new export
facilities allow ethane to reach foreign markets (Table A3).
Table 3. Ethane export capacity and net exports
Annual average Year-over-year change
Forecast Forecast
million barrels per day 2013 2014 2015 2016 2017 2015 2016 2017
Net exports (annual average) 0.00 0.04 0.06 0.14 0.23 0.03 0.08 0.09
Ethane export capacity 0.05 0.09 0.09 0.39 0.39 0.00 0.30 0.00
Note: Reflects end-of-year export capacity.
Source: U.S. Energy Information Administration, Short Term Energy Outlook, March 2016, and EIA analysis of announced export
projects. See Appendix Table A3 for list of projects.
Early in 2016, the United States is expected to begin exporting ethane to Europe from Sunoco’s Marcus Hook facility near Philadelphia, Pennsylvania. Under a 15-year contract, new purpose-built tankers will move the ethane from Marcus Hook to Scotland and Norway for use in INEOS petrochemical plants. In the third quarter of 2016, Enterprise is expected to open a new ethane export facility at Morgan’s Point, Texas, which will eventually be capable of exporting 240,000 b/d. This new terminal is expected to support exports to Europe and to India. Reliance Industries, a refiner and petrochemical producer, is building terminal and pipeline infrastructure and has ordered six very large ethane carriers to transport ethane to India. The first of Reliance’s ethane carriers is expected to be completed by the end of 2016.

March 2016
U.S. Energy Information Administration | Short-Term Energy Outlook for Hydrocarbon Gas Liquids 8
Figure 5. Ethane export capacity and net exports, quarterly 2014-17
Source: U.S. Energy Information Administration, Short-Term Energy Outlook, March 2016, and EIA analysis of announced export
projects. See Appendix Table A3 for list of projects

March 2016
U.S. Energy Information Administration | Short-Term Energy Outlook for Hydrocarbon Gas Liquids 9
Propane Outlook
The outlook for propane is marked by continued growth in gas plant production, albeit at a slower pace
than in recent years, relatively flat domestic consumption levels, and continued growth in net exports
(Figure 5). STEO projects natural gas plant production of propane to increase by 20,000 b/d in 2016 and
by 60,000 b/d in 2017, compared with estimated annual growth of 130,000 b/d in 2015. After a 50,000
b/d annual decline in 2015, propane consumption, which includes refinery grade propylene, is forecast
to remain flat in 2016 and decline by 50,000 b/d in 2017. Net exports, which grew by an estimated
190,000 b/d in 2015, are forecast to grow by 140,000 b/d in 2016 and by 100,000 b/d in 2017.
Figure 6. Propane supply and disposition, quarterly 2014-17
Note: Consumption, refinery production, and inventories include refinery-sourced propylene. EIA uses product supplied as a
proxy for consumption.
Source: U.S. Energy Information Administration, Short-Term Energy Outlook, March 2016
Natural gas plant production of propane Gas plant production of propane more than doubled between 2008 and 2015, with most of the growth
occurring since 2011. The rate of growth in gas plant propane production outpaced that of natural gas
(Figure 2), as increased natural gas processing and fractionation capacity allowed producers to separate
more liquids from raw natural gas production. Growth in both natural gas and propane production
slowed in 2015, with marketed natural gas increasing by an estimated 5% and propane increasing by an
estimated 13%. STEO projects growth in marketed natural gas will slow to about 1% in 2016 and 2% in
2017, while propane production at natural gas processing plants growth slows to 2% in 2016 and 5% in
2017.

March 2016
U.S. Energy Information Administration | Short-Term Energy Outlook for Hydrocarbon Gas Liquids 10
Table 4. Propane supply and disposition, 2013-17
million barrels/day
Annual average Year-over-year change
Forecast Forecast
2013 2014 2015 2016 2017 2015 2016 2017
Gas Plant Production 0.82 0.98 1.12 1.14 1.20 0.13 0.02 0.06
Refinery and Blender Net Production 0.56 0.59 0.56 0.56 0.57 -0.03 0.00 0.01
Net Imports -0.18 -0.32 -0.50 -0.64 -0.74 -0.19 -0.14 -0.10
Stock Build (Draw) -0.06 0.09 0.05 -0.06 -0.05 -0.04 -0.11 0.01
Consumption 1.28 1.17 1.12 1.12 1.07 -0.05 0.00 -0.05
Note: Consumption, refinery production, and inventories include refinery-sourced propylene. EIA uses product supplied as a
proxy for consumption.
Source: U.S. Energy Information Administration, Short-Term Energy Outlook, March 2016
Domestic consumption of propane In 2015, the United States consumed 1.12 million b/d of propane (including 280,000 b/d of refinery-
sourced propylene) for a combination of uses. In the United States, propane is used mainly for space
heating and as a feedstock for petrochemical plants, and to a lesser extent for agricultural applications
and transportation. Propane’s use as a heating fuel is mainly responsible for the seasonal pattern in its
consumption, which peaks in the winter (fourth and first quarters) (Figure 6). In the fourth quarter of
2015, the warm weather resulted in heating demand, measured by population-weighted heating degree
days (HDD) that was 16% lower than the fourth-quarter average over the previous five years. Mild
weather continued into the first quarter of 2016, and is expected to result in heating demand that is 7%
lower than the first-quarter average over the previous five years. Despite lower than average heating
demand in 2016, STEO projects propane consumption will remain flat because of increased
petrochemical use. Although more typical heating demand is expected in 2017, forecast propane
consumption declines by 50,000 b/d, as petrochemical consumption declines.
Propane is a feedstock used by the petrochemical industry to produce ethylene and propylene for chemicals and plastics. Some ethylene-producing plants can process propane into ethylene, propylene, and a slate of other olefins. As these plants become more reliant on ethane feedstock, propylene production at ethylene plants is expected to decline. To offset the decline in ethylene cracker propylene production, petrochemical companies have invested in propane dehydrogenation (PDH) plants that are dedicated to producing propylene from propane feedstock.

March 2016
U.S. Energy Information Administration | Short-Term Energy Outlook for Hydrocarbon Gas Liquids 11
Figure 7. U.S. propane consumption and population-weighted heating degree days, quarterly 2014-17
Note: Propane consumption include refinery-sourced propylene. EIA uses product supplied as a proxy for consumption.
Source: U.S. Energy Information Administration, Short-Term Energy Outlook, March 2016
The United States currently has two PDH plants (Table A2). The first plant, with an estimated propane
feedstock capacity of 30,000 b/d, was opened by Petrologistics in 2010, and has since been sold to Flint
Hills. A second plant, owned by Dow Chemical, with a propane feedstock capacity of 35,000 b/d, began
commercial operation in December 2015. One additional plant is expected to start up in the forecast
period, Enterprise’s 35,000 b/d feed capacity plant expected to start in the first quarter of 2017. The
amount of propane feedstock consumed depends on plant economics. However, the construction of
new PDH plants may result in a net reduction in petrochemical propane consumption, because a PDH
plant produces more propylene per barrel of propane feedstock than an ethylene plant.
Net exports of propane STEO forecasts imports and exports together as net imports (gross imports minus gross exports). Annual
average net propane exports increased from 10,000 b/d in 2011 to an estimated 500,000 b/d in 2015, as
the capacity to export liquefied petroleum gas (LPG), including propane and butanes, increased by
almost 1 million b/d. Three notable infrastructure changes occurred during this period. In 2014, Kinder
Morgan’s Cochin Pipeline was converted from a pipeline that carried propane imports from Canada to
one that carries natural gasoline exports to Canada. Second, the Marcus Hook terminal near
Philadelphia, Pennsylvania, began exporting propane in the fourth quarter of 2014. Additionally, the
number of vessels designed to carry LPG grew by 185, in anticipation of greater shipping demand. More

March 2016
U.S. Energy Information Administration | Short-Term Energy Outlook for Hydrocarbon Gas Liquids 12
growth in the LPG vessel fleet is expected, according to Bloomberg. As of December 11, 2015, 123
tankers designed to carry LPG were on order, with 60 under construction. 1
STEO projects propane net exports to increase to 640,000 b/d in 2016 (Table 5) and to 740,000 b/d in
2017 as exports ramp up at two Gulf Coast terminal projects that began operating in the second half of
2015, and as Phillips66 opens its new terminal at Freeport, Texas, in the second half of 2016. See
Appendix Table A4 for a list of projects.
Table 5. U.S. propane/butane export capacity and net exports
million barrels/day
Annual average Year-over-year change
Forecast Forecast
2013 2014 2015 2016 2017 2015 2016 2017
Net Exports
Butanes 0.01 0.06 0.08 0.15 0.16 0.03 0.06 0.02
Propane/propylene 0.18 0.32 0.50 0.64 0.74 0.19 0.14 0.10
Propane/butane export capacity 0.43 0.62 1.17 1.32 1.32 0.55 0.15 0.00
Note: Reflects end-of-year export capacity.
Source: U.S. Energy Information Administration, Short-Term Energy Outlook, March 2016 and EIA estimates of export capacity.
See Appendix Table A4 for list of projects.
The relatively low cost of U.S. propane spurred international demand and changed international trade
patterns. Growth in propane exports is expected to be mainly driven by petrochemical demand in Asia
and to a lesser extent Europe.
Propane inventories Inventories of propane, which include 3-4 million barrels of non-fuel use propylene, have remained well
above the five-year range since May 2014, as U.S. production increased more rapidly than domestic
consumption and net exports. Inventories expanded the most in the Gulf Coast region (PADD3), the
location of most petrochemical plants and propane export facilities. In 2015, Gulf Coast propane
inventories exceeded the previous five-year average by nearly 21 million barrels, or by 65%.
Gulf Coast inventories, which reached a record-high of 64.9 million barrels on November 20, 2015, were
drawn down to 41.8 million barrel by February 26, 2016. This unusually strong, 23.1 million barrel, draw
on inventories was mainly the result of higher utilization rates and expanded capacity at export
terminals, in addition to seasonal heating demand, which was actually below normal for most of the
winter. Following the strong drawdown, STEO expects inventories to return to the normal range in the
second quarter of 2016, where they will remain through the end of 2017. STEO projects Gulf Coast
inventories to draw 18.1 million barrels in 2016 and 16.4 million barrels in 2017.
1 Based on Bloomberg’s Vessel Fleet Status LPG Tanker, December 11, 2015, Total in Service (VESLLPIS Index), Total On Order
(VESLLPOO Index), Total Under Construction (VESLLPUC Index).

March 2016
U.S. Energy Information Administration | Short-Term Energy Outlook for Hydrocarbon Gas Liquids 14
Figure 8. Propane inventories on the Gulf Coast (PADD 3), monthly 2014-17
Note: Includes non-fuel use propylene.
Source: U.S. Energy Information Administration, Short-Term Energy Outlook, March 2016

March 2016
U.S. Energy Information Administration | Short-Term Energy Outlook for Hydrocarbon Gas Liquids 15
Butanes Outlook
STEO projections for butanes include normal butane and isobutane, as well as refinery-produced olefins
butylene and isobutylene. STEO projects natural gas plant production to increase by 10,000 b/d in 2016
and by 40,000 b/d in 2017, compared with annual growth of 70,000 b/d in 2015. After growth of 20,000
b/d in 2015, butane consumption is forecast to remain flat in 2016 and increase by 10,000 b/d in 2017.
Net exports, which grew by 30,000 b/d in 2015, are forecast to grow by 60,000 b/d in 2016 and by
20,000 b/d in 2017.
Natural gas plant production of butanes Gas plant production of butanes (normal and iso-), which doubled between 2008 and 2015, accounts for
most of the growth in butanes production. Gas plant production of butanes (normal and iso-) increased
from an annual average of 310,000 b/d in 2008 to an estimated 620,000 b/d in 2015, with about half this
growth occurring since 2013. STEO projects gas plant production to grow to 630,000 b/d in 2016 and to
670,000 b/d in 2017.
The rate of growth of gas plant butanes production exceeded that of natural gas, as increased natural
gas processing and fractionation capacity allowed producers to focus more on wet natural gas, which
has a higher concentration of liquids. Between 2013 and 2015, annual growth in marketed natural gas
production averaged an estimated 6%, and growth in gas plant production of butanes averaged 15%.
STEO projects annual growth in marketed natural gas will slow to 1% in 2016, then rise to 2% in 2017.
Continued expansion of natural gas processing and fractionation capacity, in addition to the changing
composition of recovered natural gas, is expected to lead to 2% growth in butanes production in 2016
and 6% growth in 2017.
Table 6. Butanes supply and disposition, 2013-17
million barrels/day
Annual average Year-over-year change
2013 2014 2015 2016 2017 2015 2016 2017
Gas Plant Production 0.47 0.54 0.62 0.63 0.67 0.07 0.01 0.04
Refinery and Blender Net Production 0.05 0.06 0.05 0.05 0.05 -0.01 0.00 0.00
Net Imports -0.01 -0.06 -0.08 -0.15 -0.16 -0.03 -0.06 -0.02
Refinery and Blender Net Inputs 0.33 0.36 0.37 0.34 0.34 0.01 -0.03 0.00
Stock Build (Draw) 0.00 0.01 0.01 -0.01 0.00 0.00 -0.02 0.01
Consumption 0.17 0.18 0.20 0.20 0.21 0.02 0.00 0.01
Note: Butanes includes normal butane/butylene and isobutane/isobutylene. EIA uses product supplied as a proxy for
consumption.
Source: U.S. Energy Information Administration, Short-Term Energy Outlook, March 2016

March 2016
U.S. Energy Information Administration | Short-Term Energy Outlook for Hydrocarbon Gas Liquids 16
Refinery and blender net inputs and net production, inventory change, and domestic consumption Normal butane is predominantly used by refiners and blenders as a gasoline blendstock and isobutane is
used to produce alkylate, which boosts octane and reduces vapor pressure in gasoline. Refineries and
blenders use both purchased butanes, referred to as net inputs, and refinery-produced butanes.
Refinery and blender net inputs of butane are highly seasonal because they are a function of gasoline
production and gasoline Reid vapor pressure (RVP) specifications (Figure 9). Because normal butane has
a high RVP relative to other blendstock, and gasoline is permitted to have a higher RVP during the
winter, net inputs of gas plant-sourced butane peak in the winter (fourth and first quarters). Net inputs
of butane are lowest in the spring (second quarter), as blenders produce lower RVP gasoline for the
summer. STEO projects annual net inputs in 2016 and 2017 will be 340,000 b/d, which is the same as the
five-year (2011-15) average, but 30,000 b/d lower than the 2015 level.
Figure 9. Butanes supply and disposition, quarterly 2014-17
Note: Butanes includes normal butane/butylene and isobutane/isobutylene. EIA uses product supplied as a proxy for
consumption.
*Refining industry net inputs equals refinery and blender net inputs minus refinery and blender net production (see Table 6).
Source: U.S. Energy Information Administration, Short-Term Energy Outlook, March 2016
In addition to net butane inputs, which are purchased, refineries produce much of the butane used for
gasoline production. In the summer, when less butane is needed for gasoline blending, refineries
produce more butane than is needed, and net refinery and blender production peaks, and inventories
build. During the winter, refinery and blender net production is negative and inventories draw down,
because refineries use more butane for producing gasoline than they produce internally. STEO projects

March 2016
U.S. Energy Information Administration | Short-Term Energy Outlook for Hydrocarbon Gas Liquids 17
net refinery and blender production will average 50,000 b/d annually in 2016 and 2017, which is the
same as the five-year average (2011-15).
Outside of refining, butane is also consumed as a feedstock in petrochemical plants, and a relatively
small amount is consumed as lighter fluid. STEO projects butane consumption, which was an estimated
200,000 b/d in 2015, to remain relatively flat in 2016 and 2017.
Net exports of butanes Annual average net exports of butanes increased from 10,000 b/d in 2013 to 80,000 b/d in 2015, as the capacity to export liquefied petroleum gas (propane and butane) increased by almost 1 million b/d. Nearly all of these exports were normal butane. STEO projects butane net exports to increase to 150,000 b/d in 2016 (Table 5) as exports ramp up at two Gulf Coast terminal projects that began operating in the second half of 2015, and as Phillips66 opens its new Freeport terminal in the second half of 2016. Forecast net exports increase to 160,000 b/d in 2017. See Appendix Table A4 for a list of projects.

March 2016
U.S. Energy Information Administration | Short-Term Energy Outlook for Hydrocarbon Gas Liquids 18
Natural gasoline (pentanes plus)
Natural gasoline, also known as pentanes plus, is produced at natural gas plants and mainly used in the
United States by refiners and blenders to produce finished motor gasoline or as a denaturant for fuel
ethanol. Natural gasoline is also used by some ethanol producers to make E85. Over 40% of the natural
gasoline produced in the United States is exported to Canada, where it is used as a diluent to reduce the
viscosity (increase API gravity) of the heavy crude oil produced in Alberta’s oil sands.
STEO projects production of natural gasoline to increase by 10,000 b/d in 2016 and by 20,000 b/d in
2017, compared to estimated annual growth of 30,000 b/d in 2015. After high natural gasoline
consumption in 2015, forecast consumption declines by 30,000 b/d in 2016, and it remains flat in 2017.
Net exports, which increased by 20,000 b/d in 2015, are forecast to grow by 30,000 b/d in 2016 and by
20,000 b/d in 2017.
Figure 10. Natural gasoline supply and disposition, quarterly 2014-17
Note: EIA uses product supplied as a proxy for consumption.
Source: U.S. Energy Information Administration, Short-Term Energy Outlook, March 2016
Natural gas plant production of natural gasoline STEO forecasts the annual growth of natural gasoline production to slow from an estimated 9% in 2015 to 2% in 2016 and rise to 4% in 2017. The slowdown in natural gasoline production is expected as a result of a lower growth rate for marketed natural gas production from an estimated 5% in 2015 to 1% in 2016 and 2% in 2017.

March 2016
U.S. Energy Information Administration | Short-Term Energy Outlook for Hydrocarbon Gas Liquids 19
Table 7. Natural gasoline supply and disposition, 2013-17
million barrels/day
Annual average Year-over-year change
2013 2014 2015 2016 2017 2015 2016 2017
Gas Plant Production 0.35 0.39 0.43 0.44 0.46 0.03 0.01 0.02
Net Imports -0.10 -0.15 -0.17 -0.20 -0.22 -0.02 -0.03 -0.02
Refinery and Blender Net Inputs 0.17 0.15 0.15 0.15 0.15 -0.01 0.01 0.00
Ethanol Denaturant 0.02 0.02 0.02 0.02 0.02 0.00 0.00 0.00
Stock Build (Draw) 0.00 0.02 0.00 0.00 0.00 -0.02 0.00 0.01
Consumption 0.06 0.05 0.09 0.06 0.06 0.04 -0.03 0.00
Source: U.S. Energy Information Administration, Short-Term Energy Outlook, March 2016
Domestic consumption and refinery net inputs of natural gasoline Refineries and blenders used nearly 150,000 b/d of natural gasoline in 2015 for blending into gasoline
and 20,000 b/d for blending into ethanol, and they are projected to use roughly the same amounts in
both 2016 and 2017. In addition, STEO projects 60,000 b/d of natural gasoline will be consumed for
other purposes in 2016 and 2017, mainly marketed as light naphtha and used as ethylene plant
feedstock. In 2015, petrochemical consumption was relatively high at an estimated 90,000 b/d, which
was 30,000 b/d above the average of the previous five years (2010-14).
Net exports of natural gasoline In 2015, 40% of the natural gasoline produced in the United States was exported. Almost all natural
gasoline exports went to Canada for use as a diluent for heavy crude oil to make the oil flow more easily
in pipelines. In 2014, the capacity to export natural gasoline to Canada expanded when the Cochin
Pipeline, which previously carried propane from Canada to the U.S. Midwest, was converted to export
natural gasoline and other light petroleum liquids from the United States to Canada. STEO forecasts net
exports of natural gasoline, which were 170,000 b/d in 2015, to increase by about 30,000 b/d in 2016
and by 20,000 in 2017.

March 2016
U.S. Energy Information Administration | Short-Term Energy Outlook for Hydrocarbon Gas Liquids 20
Appendix
Table A1. Assumed timeline for additions to ethane feedstock capacity at ethylene cracking plants, quarterly 2013-17
Assumed startup Company Location Project Type
Additional Ethylene nameplate capacity
(thousand metric tons/year)
Additional Ethane
input (thousand
barrels/day)
Pre-2013 28,814
2013Q1* Dow Chemical Co. Hahnville, LA restart 380 23
2013Q2 Westlake Chemical Corp. Lake Charles, LA capacity expansion 109 7
2013Q2 BASF Fina Petrochemicals Port Arthur,TX feedstock conversion 0 4
2013Q2 LyondellBasell Morris, IL capacity expansion 54 3
2013Q3 INEOS Olefins and Polymers USA Chocolate Bayou,TX capacity expansion 115 7
2014Q2 BASF Fina Petrochemicals Port Arthur,TX capacity expansion 141 4
2014Q2 Westlake Chemical Corp. Calvert City, TX feedstock conversion 0 12
2014Q2 Westlake Chemical Corp. Calvert City, TX capacity expansion 82 5
2014Q4 Chevron Phillips Chemical Co. Sweeny,TX capacity expansion 91 5
2014Q4 LyondellBasell LaPorte,TX capacity expansion 363 22
2015Q2 LyondellBasell Channelview, TX capacity expansion 113 14
2015Q2 Williams Olefins Geismar, LA capacity expansion 272 16
2015Q4 Huntsman Corp. Port Neches, TX capacity expansion 13 1
2015Q4 Flint Hills Corp. Port Arthur, TX capacity expansion 100 6
2015Q4 Dow Chemical Co. Plaquemine, LA feedstock conversion 200 12
2016Q1 Dow Chemical Co. Freeport, TX feedstock conversion 0 12
2016Q2 Westlake Chemical Corp. Lake Charles, LA capacity expansion 113 7
2016Q4 LyondellBasell Corpus Christi, TX capacity expansion 363 22
2017Q1 LyondellBasell Channelview, TX capacity expansion 249 15
2017Q2 Westlake Chemical Corp. Calvert City, TX capacity expansion 32 2
2017Q2 Dow Chemical Co. Freeport, TX new plant 1,500 90
2017Q2 OxyChem/Mexichem JV Ingleside, TX new plant 544 33
2017 Q3 Chevron Phillips Chemical Baytown, TX new plant 1,500 90
2017 Q4 ExxonMobil Chemical Co. Baytown, TX new plant 1,500 90
2017Q4 Formosa Plastics Corp. USA Point Comfort, TX new plant 1,043 63
2017Q4 Indorama Ventures Olefins, LLC Carlyss, LA restart 370 19
2013-17 Total United States capacity growth 9,248 583
*Plant restarted at the end of December 2012.
Source: U.S. Energy Information Administration. Ethane throughput capacity is calculated based on announced additions to
ethylene nameplate capacity from various company announcements and trade press articles. Total pre-2013 nameplate
capacity is based on the Oil and Gas Journal, International Survey of Ethylene from Steam Crackers for January 1, 2013.

March 2016
U.S. Energy Information Administration | Short-Term Energy Outlook for Hydrocarbon Gas Liquids 21
Table A2. Assumed timeline for startup of U.S. propane dehydrogenation (PDH) plants with related propane feedstock capacity, quarterly 2010-17
Assumed
startup Company Location
Propylene nameplate
capacity (thousand
metric tons/year)
Propane feedstock
capacity (thousand
barrels per day)
2010 Flint Hills (from PetroLogistics) Houston, TX 659 30
2015Q4 Dow Chemical Freeport, TX 750 35
2017Q1 Enterprise Products Mt. Belvieu, TX 750 35
2013-17 Total United States 1,500 70
Source: U.S. Energy Information Administration estimates based on various company announcements and trade press articles.
Table A3. Assumed timeline for U.S. ethane export pipelines and terminals with related capacities, quarterly 2013-2017
Assumed startup Project Location* Type
Pipeline/terminal capacity
(thousand barrels per day)
2013Q4 Mariner West pipeline to Canada Marysville, MI new pipeline 50
2014Q2 Vantage pipeline to Canada Elkhorn, ND new pipeline 40
2016Q1 Sunoco Logistics LP terminal Marcus Hook, PA new terminal** 35
2016Q2 Vantage pipeline to Canada Elkhorn, ND pipeline expansion 28
2016Q3 Enterprise terminal Morgan's Point, TX new terminal 240
2013-17 Total United States capacity growth 393
*Locations cited for pipelines are at U.S. exit points.
** Existing terminal that did not previously handle ethane.
Source: U.S. Energy Information Administration estimates based on various company announcements and trade press articles.
March 2016
U.S. Energy Information Administration | Short-Term Energy Outlook for Hydrocarbon Gas Liquids 22
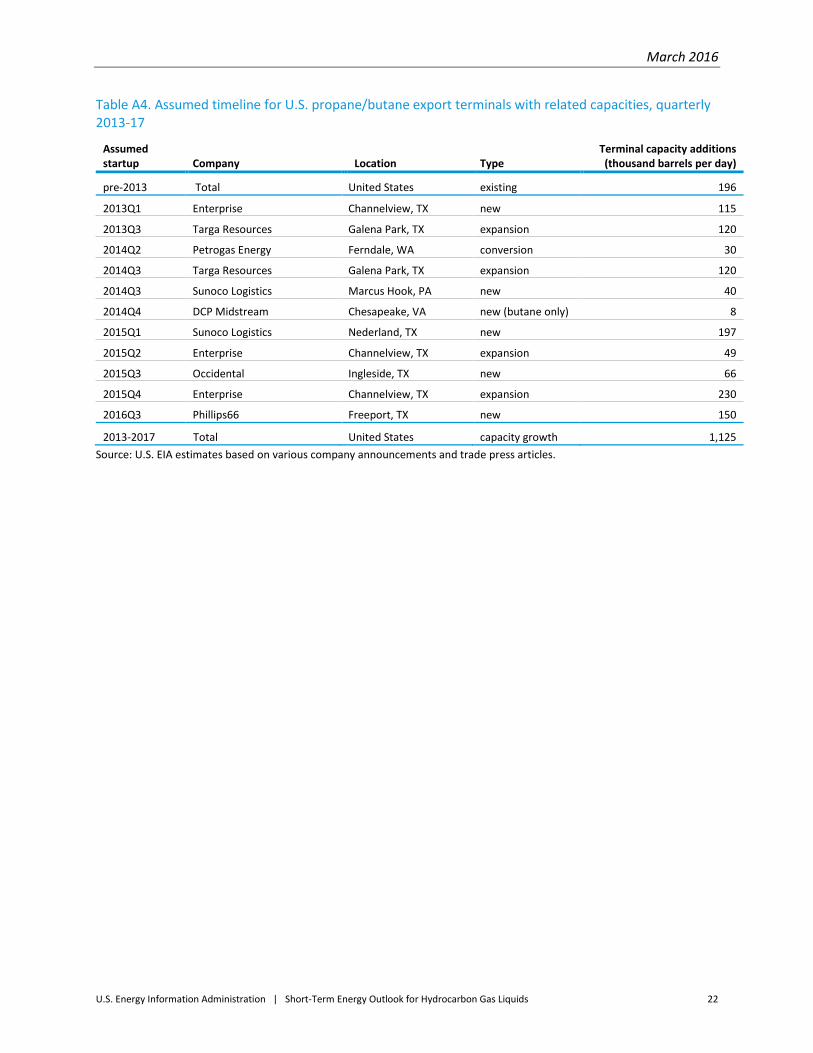
Table A4. Assumed timeline for U.S. propane/butane export terminals with related capacities, quarterly 2013-17
Assumed startup Company Location Type
Terminal capacity additions (thousand barrels per day)
pre-2013 Total United States existing 196
2013Q1 Enterprise Channelview, TX new 115
2013Q3 Targa Resources Galena Park, TX expansion 120
2014Q2 Petrogas Energy Ferndale, WA conversion 30
2014Q3 Targa Resources Galena Park, TX expansion 120
2014Q3 Sunoco Logistics Marcus Hook, PA new 40
2014Q4 DCP Midstream Chesapeake, VA new (butane only) 8
2015Q1 Sunoco Logistics Nederland, TX new 197
2015Q2 Enterprise Channelview, TX expansion 49
2015Q3 Occidental Ingleside, TX new 66
2015Q4 Enterprise Channelview, TX expansion 230
2016Q3 Phillips66 Freeport, TX new 150
2013-2017 Total United States capacity growth 1,125
Source: U.S. EIA estimates based on various company announcements and trade press articles.