NATIONAL STRATEGIC PLAN FOR DEVELOPMENT OF … · Sector for management, planning and development...
82
REPUBLIC OF CROATIA NATIONAL STRATEGIC PLAN FOR DEVELOPMENT OF FISHERIES 2013
Transcript of NATIONAL STRATEGIC PLAN FOR DEVELOPMENT OF … · Sector for management, planning and development...

REPUBLIC OF CROATIA
NATIONAL STRATEGIC PLAN
FOR DEVELOPMENT OF FISHERIES
2013

NATIONAL STRATEGIC PLAN
i
CONTENTS
1 INTRODUCTION ................................................................................................................................... 1
1.2 General Information on the Republic of Croatia .................................................................................................. 2
2 DESCRIPTION OF THE CROATIAN FISHERIES SECTOR ......................................................... 5
2.1 General Characteristics and Administrative Framework ...................................................................................... 5 2.2 Marine Fisheries ................................................................................................................................................... 8 2.3 Freshwater Fisheries ........................................................................................................................................... 12 2.4 Aquaculture ........................................................................................................................................................ 13
2.4.1 Marine aquaculture (mariculture) ............................................................................................................ 13 2.4.2 Freshwater Fish Farming ......................................................................................................................... 14
2.5 Processing and Market ....................................................................................................................................... 15 2.6 Inspection, Control and Data collection ............................................................................................................. 15
2.6.1 Research and surveys ................................................................................................................................ 17
2.7 Education and training ........................................................................................................................................ 19 2.8 Lessons learnt ..................................................................................................................................................... 19
2.8.1 National support schemes to fisheries sector ............................................................................................ 19 2.8.2 Pre-accession programmes ....................................................................................................................... 23
2.9 Administrative framework .................................................................................................................................. 24
2.9.1 Service for management of EU Funds ...................................................................................................... 24 2.9.2. Service for legal affairs ............................................................................................................................. 25 2.9.3. Sector for management, planning and development of fisheries ............................................................... 25 2.9.4. Sector for monitoring and control of fisheries .......................................................................................... 27
3 SWOT ANALYSIS ................................................................................................................................ 29
3.1 Strengths ............................................................................................................................................................. 33 3.2 Weaknesses ........................................................................................................................................................ 34 3.3 Opportunities ...................................................................................................................................................... 34 3.4 Threats ................................................................................................................................................................ 35
4 PRIORITIES AND OBJECTIVES ...................................................................................................... 36
4.1 Short-term priorities and objectives ................................................................................................................... 36
4.1.1 OBJECTIVE: Establishing a sustainable balance between fishing capacity and available resources ..... 36 4.1.2 OBJECTIVE: Increase of Production and Strengthening the Competitiveness of Aquaculture ............... 38 4.1.3 OBJECTIVE: Improvement of Administration capacities and stakeholder´s awareness ......................... 40 4.1.4 OBJECTIVE: Strengthening the Processing and Market Capacities ....................................................... 40
4.2 Long-term Objectives (Projection) ..................................................................................................................... 40
4.2.1 Commercial Fisheries ............................................................................................................................... 41 4.2.2 Aquaculture ............................................................................................................................................... 42 4.2.3 Fisheries areas .......................................................................................................................................... 43 4.2.4 Marketing and Processing ........................................................................................................................ 43 4.2.5 System for Control and Implementation of the Common Fisheries Policy ............................................... 44 4.2.6 Technical assistance ................................................................................................................................. 44
5 FUNDS REQUIRED FOR REALISATION ....................................................................................... 45
5.1 Financial resources for implementation of the Strategy for 2013 (EURO) ........................................................ 45
6 DEVELOPMENT, IMPLEMENTATION AND MONITORING OF THE NSP ........................... 46
6.1 Development of the NSP .................................................................................................................................... 46 6.2 Implementation and monitoring of the NSP ....................................................................................................... 46
6.2.1 Competent Bodies ..................................................................................................................................... 46 6.2.2 Monitoring procedure of the Strategic Plan ............................................................................................. 47 6.2.3 Indicators .................................................................................................................................................. 47
7 APPENDICES ........................................................................................................................................ 49
APPENDIX I: Administrative structure ....................................................................................................................... 49 APPENDIX II: Fisheries products import and export .................................................................................................. 50 APPENDIX III. Commercial marine fishing ............................................................................................................... 59 APPENDIX IV: Freshwater fisheries .......................................................................................................................... 70 APPENDIX V: Freshwater and marine aquaculture .................................................................................................... 71 APPENDIX VI. List of laws and subordinate acts ...................................................................................................... 73 APPENDIX VII. List of projects within the pre-accession programmes of which DoF was the beneficiary .............. 76
NATIONAL STRATEGIC PLAN
ii
LIST OF TABLES
Table 1. Basic macroeconomic indicators from 2002 to 2011 ................................................................................................ 3 Table 2. List of recognised fishing cooperatives and the number members ............................................................................ 8 Table 3. Implementation of the national structural support measures during the period 2010-2012 ................................... 22 Table 4. Implementation of IPARD programme in sector of fisheries (state on 4 April 2013) .............................................. 23 Table 5. Service for management of EU funds – administrative capacities........................................................................... 25 Table 6. Service for legal affairs - administrative capacities ................................................................................................ 25 Table 7. Sector for management, planning and development of fisheries - administrative capacities .................................. 26 Table 8. Sector for monitoring and control of fisheries - administrative capacities ............................................................. 28 Table 9. SWOT analysis of the commercial marine fisheries sector ...................................................................................... 29 Table 10. SWOT analysis of the commercial freshwater fisheries sector .............................................................................. 30 Table 11. SWOT analysis of the mariculture sector .............................................................................................................. 31 Table 12. SWOT analysis of the freshwater aquaculture sector ............................................................................................ 32 Table 13. SWOT analysis of the processing sector and fisheries products market ................................................................ 33
Table 2-1. Fisheries products balance from 2000 to 2011 .................................................................................................... 50 Table 2-2. Fisheries products import by type of products from 2000 to 2011 (t) .................................................................. 51 Table 2-3. Fisheries products import by type of product from 2000 to 2011 (USD) ............................................................. 52 Table 2-4. Fisheries products export by type of product from 2000 to 2011 (t) .................................................................... 54 Table 2-5. Fisheries products export by type of product from 2000 to 2011 (USD) ............................................................. 56
Table 3-1. Number of vessels for commercial marine fishing from 2000 to 2011 ................................................................. 59 Table 3-2. Types of vessels for commercial marine fishing from 2000 to 2011 ..................................................................... 59 Table 3-3. Segmentation of vessels for commercial marine fishing by length and by type in 2011 ....................................... 59 Table 3-4. Segmentation of vessels for commercial marine fishing by counties in 2011 ....................................................... 61 Table 3-5. Fish and other marine organisms catch from 2000 to 2011 (t) ............................................................................ 62 Table 3-6. Fish and other marine organisms catch by species in 2011 (t) ............................................................................ 63 Table 3-7. Fish and other marine organisms catch by fishing zones in 2011 (t) ................................................................... 64 Table 3-8. Some significant fish and marine organisms catch by fishing zones in 2011 (t) .................................................. 64 Table 3-9. Fish and other marine organisms catch by fishing gear in 2011 (t) .................................................................... 65 Table 3-10. Fish and other marine organisms landing by main species in 2011 (t) .............................................................. 68 Table 3-11. Fish and other marine organisms landing by fishing gear in 2011 (t) ............................................................... 68 Table 3-12. Fish and other marine organisms catch by 20 most significant landing sites in 2011 (t) .................................. 69
Table 4-1. Catch of freshwater capture fishery from 2000 to 2011 (t) .................................................................................. 70 Table 4-2. Catch of freshwater capture fishery by species in 2011 (t) .................................................................................. 70
Table 5-1. Marine aquaculture production by species from 2000 to 2011 (t) ....................................................................... 71 Table 5-2. Freshwater aquaculture production by species from 2000 to 2011 (t)................................................................. 71 Table 5-3. Total aquaculture production from 2000 to 2011 (t) ............................................................................................ 72

NATIONAL STRATEGIC PLAN
iii
LIST OF FIGURES Figure 1. Map of NUTS 2 regions and counties in RoC........................................................................................................... 7 Figure 2. Fishing zones of the Croatia................................................................................................................................... 10
Figure 1-1. Organisational scheme of DoF ........................................................................................................................... 49
Figure 2-1. Most significant countries by the quantity of fisheries products import in 2011 ................................................ 58 Figure 2-2. Most significant countries by the value of fisheries products export in 2011 ..................................................... 58
Figure 3-1. Total engine power and tonnage of purse seiners from 2004 to 2011 ................................................................ 60 Figure 3-2. Total engine power and tonnage of trawlers from 2008 to 2011 ........................................................................ 60 Figure 3-3. Segmentation of vessels for commercial marine fishing by age .......................................................................... 61 Figure 3-4. Purse seiners movements in November 2011 according to VMS* ...................................................................... 65 Figure 3-5. Purse seiners catch by hour in 2011 (kg/h) ......................................................................................................... 66 Figure 3-6. Trawlers catch by hour in 2011 (kg/h) ................................................................................................................ 66 Figure 3-7. Purse seiners catch by vessel from 2004 to 2011 (kg) ........................................................................................ 67 Figure 3-8. Trawlers catch by vessel from 2008 to 2011 (kg) ............................................................................................... 67

NATIONAL STRATEGIC PLAN
iv
LIST OF ABBREVIATIONS
ARPA Agency for audit of system of implementation of EU programmes
CBS Croatian Bureau of Statistics
CF Cohesion Fund
CFP Common Fisheries Policy
COM Common Organisation of Markets
DCF Data Collection Framework
DoF Directorate of Fisheries
EUR Euro
EAFRD European Agricultural Fund for Rural Development
EC European Commission
EFF European Fisheries Fund
EMFF European Maritime and Fisheries Fund
ERDF European Regional Development Fund
ESF European Social Fund
EU European Union
FLAG Fisheries Local Action Group
FMC Fisheries Monitoring Centre
HRK Croatian Kuna
GDP Gross Domestic Product
GT Gross Tonnage
GVA Gross Value Added
ICCAT International Commission for the Conservation of Atlantic Tunas
IOF Institute for Oceanography and Fisheries
IPARD Instrument for Pre-Accession Assistance for Rural Development
kg Kilogramme
kW Kilowatt
MA Managing Authority
MINAGRI Ministry of Agriculture
NSP National Strategic Plan
NUTS Nomenclature of Units for Territorial Statistics
OG Official Gazette of RoC
OJ Official Journal of EU
OP Operational Programme
PAAFRD Paying Agency for Agriculture, Fisheries and Rural Development
RoC Republic of Croatia
SWOT Strengths/Weaknesses/Opportunities/Threats
t Ton
VMS Satellite Vessel Monitoring System
% Percentage
NATIONAL STRATEGIC PLAN
1
1 INTRODUCTION
This document represents the National Strategic Plan for Development of Fisheries in Republic of
Croatia (hereinafter: NSP) and it is prepared in accordance with the provisions of Council Regulation
(EC) No 1198/2006 of 27 June 2006 on the European Fisheries Fund (EFF) (OJ L 223, 15.8.2006),
and after consultations with sector stakeholders.
In addition, this document has been developed taking into consideration the following documents:
Commission Regulation (EC) No 498/2007 of 26 March 2007 laying down detailed rules for
the implementation of Council Regulation (EC) No 1198/2006 on the European Fisheries Fund
(OJ L 120, 10.5.2007)
Commission Regulation (EC) No 1249/2010 amending Regulation (EC) No 498/2007 laying
down detailed rules for the implementation of Council Regulation (EC) No 1198/2006 on the
European Fisheries Fund (OJ L 341, 23.12.2010)
Council Regulation (EC) No 861/2006 of 22 May 2006 establishing Community financial
measures for the implementation of the common fisheries policy and in the area of the law of
the sea (OJ L 160, 14.6.2006)
Council Regulation (EC) No 2371/2002 of 20 December 2002 on the conservation and
sustainable exploitation of fisheries resources under the Common Fisheries Policy (OJ L 358,
31.12.2002)
Council Regulation (EC) No 1224/2009 of 20 November 2009 establishing a Community
control system for ensuring compliance with the rules of the common fisheries policy (OJ L
343, 22.12.2009)
Communication (COM/2002/511) from the Commission to the Council and the European
Parliament – Strategy for sustainable development of European aquaculture
Commission working documents concerning the National Strategic Plan.
The document describes the condition of the entire fisheries sector, provides a strategic framework
and identifies the objectives and development guidelines and financial framework for 2013 (the
current programming period) and provides a general vision and development perspective for the
following programming period from 2014 to 2020, taking into account the key elements of the
reformed Common Fisheries Policy of the EU (hereinafter: CFP)..
The current programming period covers the period from 2007 to 2013. Given that the Republic of
Croatia acceded to the EU on 1 July 2013, the implementation of the NSP and co-financing of the
measures by the EU in this financial framework will be limited to 2013, with implementation period
2014-2015. The implementation of the this document in the stated period is in line with the general
n+2 rule which applies to the implementation of the EU structural funds. However, the
implementation of measures envisaged by this document shall partially overlap with the
implementation of the measures to be elaborated within the next programming period (2014-2020).
Within the next programming period, structural measures in fisheries sector shall be implemented
through the European Maritime and Fisheries Fund (hereinafter: EMFF). By the adoption of the new
Basic Regulation of the CFP (which shall replace the Council Regulation No 2371/2002), general
guidelines of the fisheries policy change substantially, and hence the future fund (EMFF) shall first
and foremost be used to support the implementation of the new policy. Since the discussions on the
final contents of the EMFF are still going at the time of creation of this document, the basic elements
and the general guidelines of the goals of Croatian fisheries policy in the forthcoming period are only
outlined in basic lines in this document.
Preparation of this document took into account a number of available studies and previously adopted
strategic documents of Croatia. The objectives of the NSP are in accordance with the provisions of the
Strategy for smart, sustainable and inclusive growth Europe 20201, and the NSP includes segments
1 COM(2010) 2020 final
NATIONAL STRATEGIC PLAN
2
related to data collection in fisheries, inspection and control as well as relevant segments related to the
establishment of a monitoring, as well as management and control system for the EFF.
The NSP represents the basis for the development of the Operational programme for fisheries
(hereinafter: OP), which will further define the measures and activities aimed at achieving the
objectives defined by this plan.
Also, all statutory and regulatory provisions related to any of the activities listed in the NSP which are
under the responsibility of other government bodies will be applied accordingly. This applies in
particular to the provisions on the protection of nature and environment.
1.2 General Information on the Republic of Croatia
The surface of the Republic Croatia is 87,661 km² and it comprises 56,594 km² (64.5%) of land area
and 31,067 km² (35.5%) of territorial sea. With a total population of 4,284,889 (census 2011), the
average density in Croatia is 75.7 inhabitants/km².
According to the data of the State geodetic directorate and Croatian hydrographical institute which are
based on geodetic and hydrographical data available at the moment, the total length of the Croatian
border is 3,318.58 km. The length of the continental border is 2,370.5 km: with Slovenia (659.1 km
till the finalisation of the ongoing arbitrage procedure) to the north, Hungary (355.2 km of border line
defined by the Contract) to the north-east, and Bosnia and Herzegovina (1,010.9 km), Serbia (325.8
km) and Montenegro (19.5 km) to the south-east. The total length of the Croatian territorial sea
border, including the existing lateral borders, amounts to 511.9 nautical miles (948.08 km): 8.2
nautical miles (15.19 km) with Slovenia till the finalisation of the ongoing arbitrage procedure, 14.1
nautical miles (26.14 km) of border dividing territorial seas as well as 356.8 nautical miles (660.73
km) of border dividing the epicontinental areas with the Republic of Italy, 8.1 nautical miles (15.04
km) with Bosnia and Herzegovina which is a temporary border applied as of 1999 when the Contract
on the state border was signed, and 14 nautical miles (25.98 km) of temporary border with
Montenegro which is a border between the territorial seas (established in 2002) along with the 39.5
nautical miles of temporary south lateral border of the Protected ecological and fisheries zone
(hereinafter: PEFZ).
The total length of the Adriatic coastline is 5,835 km (mainland 1,777 km and islands 4,058 km).
Croatia has 1,246 islands of which 48 are inhabited (according to data from Statistical annual for 2011
based on census from 2001). Out of the total area of Croatia, 8.44% is protected and there is a total of
434 protected areas, 64.22% of which are national parks and nature parks, while 35.78% are other
protected categories (strict nature reserves, special nature reserves, regional parks, nature monuments,
important landscapes, forest parks, park architecture monuments).
According to the 2011 census, Croatia has a population of 4,284,889, compared to 4,437,460
inhabitants in 2001 or 4,784,265 in 1991. Out of the total population in 2011, 15.2% were younger
than 14 years of age, 67.1% were between 15 and 64 and 17.7% were older than 65. The average age
is 41.7; the average age of women is 43.4 and of men 39.9.
Unlike the average growth trend in the EU in the period 2000 - 2009, Croatia has a total population
decline of 0.16% annually. By observing the trends related to the part of population of a working age
in the same period, a negative trend that indicates a decline in the share of the population under the
age of 15 and of the working age population is visible. In 2011 the average number of employed
persons decreased, while the number of the unemployed increased at a much lower rate compared to
2010, resulting in a lower increase in the unemployment rate.
From 2000 to 2005 the average annual GDP growth was about 4% whereas imports increased at a
lower rate as a result of negligible economic growth of major trading partners of Croatia. In this
process, the growth in exports of services was higher than the growth in exports of goods; the biggest
increase was recorded in tourist services. Due to the global recession, economic indicators recorded a

NATIONAL STRATEGIC PLAN
3
significant decline in recent years. According to the consolidated estimates, in 2011 GDP growth was
zero; some growth was recorded in the second and third quarters (0.4% and 0.7%), and a decline in
GDP in the first and fourth quarters of 2011 (1.0% and 0.4%) compared with the same quarters of
2010.
Industrial production continued its downward trend, so in 2011 the physical volume of production
decreased by 1.2% compared to 2010. Production was reduced by 0.1% in the manufacturing industry,
4.8% in mining and quarrying, and 6.8% in the energy supply. Positive developments were made in
the field of retail trade, tourism, and partly in foreign trade. Compared with 2010, the nominal retail
trade turnover increased by 4.0%, and the actual one by 1.0% due to the increase of consumer price
index. Croatia's foreign trade with other countries, i.e. exports, measured in HRK at annual level,
increased by 9.9%, but at the same time the imports into Croatia increased by 9.7%. Coverage of
imports by exports remained at the level of 58.9%.
Level of average salaries of employees in 2011 increased nominally by 1.8% compared to 2010, but
due to the inflation rate of 2.3%, real salaries of employees fell by 0.4%. The annual rate of inflation,
as measured by the consumer price index in 2011, was 2.3%.
Table 1. Basic macroeconomic indicators from 2002 to 2011
Indicator 2002 2003 2004 2005 2006 2007 2008 2009 2010 2011
GDP, current prices
(million HRK) 208,7963 228,932 247,428 266,652 291,044 318,308 343,412 328,672 334,564 341,206
GDP, real growth
rates in% 4.9 5.4 4.1 4.3 4.9 5.1 2.1 -6.9 -1.2 0.0
GDP, current prices
(million EUR) 28,189 30,265 33,009 36,034 39,745 43,390 47,543 44,781 45,917 45,897
GDP per capita, EUR 6,349 6,816 7,436 8,112 8,951 9,781 10,722 10,111 10,393 10,697
INDUSTRIAL PRODUCTION
Growth rates in % 5.0 3.3 3.2 4.6 4.1 4.9 1.2 -9.2 -1.4 -1.2
RETAIL TRADE TURNOVER
Real growth rates
in% 12.5 5.8 2.5 3.0 2.2 5.3 -0.5 -15.3 -1.8 1.0
Net salary in HRK 3,720 3,940 4,173 4,376 4,603 4,841 5,178 5,311 5,343 5,441
Unemployment rate
(%) 22.3 19.2 18.0 17.9 16.6 14.8 13.2 14.9 17.4 17.9
FOREIGN TRADE
Export, million EUR 5,188.0 5,464.0 6,454.0 7,069.4 251.6 9,004.1 9,585.1 7,529.4 8,905.2 9,589.7
Import, million EUR 11,327.0 12,538.0 13,354.0 14,949.5 17,104.7 18,833.0 20,817.1 15,220.1 15,137.0 16,275.9
Foreign trade
balance, million EUR -6,139.0 -7,074.0 -6,900.0 -7880.1 -8,853.1 -9,828.8 -11,232.0 -7,690.7 -6,231.8 -6.6862
CENTRAL GOVERNMENT BUDGET
Total revenue,
million HRK 69,869.1 78,260.0 80,463.5 85,653.0 95,235.6 108,320.6 115,772.7 110,257.9 107,466.4 107,069.7
Total expenditure,
million HRK 73,369.6 80,446.6 83,131.1 87,857.5 95,950.0 108,007.6 115,292.4 117,924.0 120,323.3 119,939.5
CENTRAL
GOVERNMENT
DEBT, million HRK
70,996.3 79,735.8 91,113.1 99,958.1 101,183.4 102,473.1 98,486.6 115,769.2 135,990.4 153,969.7
Consumer prices -
inflation - growth
rate in %
1.7 1.8 2.1 3.3 3.2 2.9 6.1 2.4 1.1 2.3
GROSS EXTERNAL
DEBT OF THE RoC,
million EUR
15,144.0 19,883.9 22,933.4 25,990.0 29,725.0 33,720.8 40,590.0 45,243.0 46,483.4 45,733.6

NATIONAL STRATEGIC PLAN
4
Indicator 2002 2003 2004 2005 2006 2007 2008 2009 2010 2011
Exchange rate
HRK/EUR, period
average
7.406976 7.564248 7.49568 7.400047 7.322849 7.336019 7.23178 7.33954 7.286230 7.434204
Source: HGK (CCE - Croatian Chamber of Economy), Gospodarska kretanja (Economic Trends), no.
5, 2012
NATIONAL STRATEGIC PLAN
5
2 DESCRIPTION OF THE CROATIAN FISHERIES SECTOR
2.1 General Characteristics and Administrative Framework
Estimates of direct share of fisheries in GDP vary between 0.2% and 0.7%. However, the contribution
of fisheries has to be analysed taking into account the share of GDP of all activities somehow linked
to the sector. In addition to the direct production value of the sector of capture fisheries, fish farming,
and processing, the assessment of the share of fisheries in GDP should also include the construction
and servicing of vessels, production of fishing gears and equipment, transport, storage and related
logistics, port activities related to fisheries and to a certain extent some forms of tourism. Furthermore,
in general assessments of importance of the fisheries sector one should include the element of supply
of fresh high quality food, a contribution to the positive foreign trade balance, and the significance of
employment on the coast and the islands, where fishery is one of the rare activities that provide a
source of income throughout the year.
As in most Mediterranean countries, indicators on the national level point towards a low significance
of this sector for national economy, as GVA of fishing sector in 2007 was 0.24% of total GVA and
5.16% of total natural resources in GVA (agriculture, forestry, hunting and fishing).
However, it is considered that the sectors’ real contribution is underrated and that, if the value of
accompanying activities is included, the contribution to national GDP exceeds 1%.
Fisheries sector significantly participates in the export of the Republic of Croatia's food products with
the value of total export in 2011 amounting to USD 178,503,695 (38,493 tons). Five most significant
products by export value in 2011 were bluefin tuna (total export value was USD 67,674,780, out of
which USD 67,631,851 exported on Japanese market), salted anchovies (total export value USD
23,001,574, out of which USD 17,389,622 exported on Italian market), canned sardines (total export
value USD 19,622,286), farmed fresh sea bass (total export value USD 10,781,900), and fresh
anchovies (total export value USD 6,526,864).
At the same time, the import value in 2011 reached USD 123,676,657 (38,417 tons), meaning that the
positive financial foreign trade balance of the sector is maintained. Croatia imports significant
quantities of relatively inexpensive products (herring), and exports high-value. Herring is imported
almost exclusively for the needs of tuna farming. Due to the drop of the price of tuna on the global
market, as well as the drop of prices of sea bass and sea bream on the European market by 2011, a
positive balance was decreasing equally by value and by quantity.
Values and quantities of import and export in the last 10 years are shown in Appendix II Table 2-1.
The structure of imports and exports by principal species and values, and major countries is shown in
Appendix II (Tables 2-2 – 2-5 and Figures 2-1 and 2-2).
Consumption of fish in the Republic of Croatia was estimated to be around 8.5 kg per capita. This
estimation should be taken with due reserve, since there is a lack of systematic market and
consumption related surveys and research. Some estimates show that every tenth Croat does not eat
fresh fish or seafood at all, and every twentieth does not eat frozen fish or seafood. Only 3% of Croats
eats fish every day and 33% once a week. Tourism sector also participates in the consumption of fish
on the domestic market, being thus a significant marketing channel for fisheries products in the
summer. Large retail stores and hotel chains usually get supplied by fish farms, and preliminary data
show that there are significant differences in consumption (in quantity and species) in different
regions of Croatia. Although consumer habits and life style have certain influence on consumption of
fish, the high market price of fish products is the most important reason for the low consumption per
capita.
Data on the number of employees in the sector are currently being estimated by taking into account
data from crafts and trade registers, data on number of crew members and number of licences
(vessels) in the fishing fleet of Croatia, as well as the data from the register of fish farms. It is
estimated that approximately 14,000 people (fishermen, employees in companies involved in capture
NATIONAL STRATEGIC PLAN
6
fisheries, farming and processing) are directly employed in the sector. In addition to the permanently
employed, there is a significant number of seasonal workers, especially in the segment of employees
on fishing vessels. It is estimated that around 25,000 people are involved in the sector, directly and
indirectly. More precise data on employees in the fisheries sector will be available after the
implementation of the National Fisheries Data Collection Programme whereas its socio-economic
component shall be launched during 2013.
Tourism on the coast and islands represents an economically significant activity, especially with
seasonal openings of additional market for different products, where fisheries products have a
significant role. Additionally, fisheries in conjunction with tourism offer also an added value to the
tourist service. According to the national strategic guidelines related to tourism development, the
objective is to develop tourism offer through high value- added services. Also, it is important to
emphasize that most of the mariculture segment is directly linked to the islands, and that it positively
effects the development and sustainability of sensitive island communities. Areas and communities
which traditionally depend on fishing and which even today have characteristics of "fishing villages"
in Croatia, especially on islands, represent also a significant asset in terms of developing the tourism
offer in general. Also, fisheries is one of the most important economic sector for very delicate island
communities, providing the basic or additional source of income all year around, in all of its segments
- catch, farming and processing. At the same time, fisheries has a significant traditional cultural value,
and as such is part of the identity of the islands’ population.
In 2012 new National classification of territorial units was defined (OG 96/12 and 102/12)2
according
to which the country is classified as a NUTS I region, and it is divided into two NUTS II regions –
Continental and Adriatic. NUTS II regions are non-administrative units which are composed of
administrative units of the NUTS III level – counties (20 + City of Zagreb). The entire area of the
Republic of Croatia falls under the “convergence objective” in line with the provisions of the Council
regulation (EC) No 1083/2006 of 11 July 2006 on the common provisions for the European Regional
Development Fund, European Social Fund, and Cohesion Fund (OJ L 210, 31.07.2006). The new
classification entered into force on 1st July 2013.
Most coastal areas of the Croatia are classified as areas of special state concern where GDP per capita
is below national average. Main statistical units of NUTS III level, in which fishing activities exist,
are areas (counties) XVII, VIII, IX, XIII, XV, XVII and XIX or regions extending from Istria to
southern Dalmatia. In addition, there are certain areas in the continental part of the country, as is area
XIV, where freshwater aquaculture is developed.
Administrative and statistical division of Croatia on NUTS regions is shown in Figure 1.
2 In line with the Regulation (EC) No 1059/2003 of the European Parliament and of the Council of 26 May 2003 on the
establishment of a common classification of territorial units for statistics (NUTS) (OJ L 154, 21.06.2003.)

NATIONAL STRATEGIC PLAN
7
Figure 1. Map of NUTS 2 regions and counties in RoC
Source: CBS
The fisheries sector in the Republic of Croatia is regulated by the Marine Fisheries Act (OG No
81/13) and Freshwater Fisheries Act (OG No 106/01, 7/03, 174/04, 10/04- corrigendum and 49/05 -
consolidated text) and regulations based upon them. The list of key regulations is provided in
Appendix VI.
In the administrative sense, the Ministry of Agriculture (hereinafter: MINAGRI) is the competent
authority for all issues relating to fisheries. Organizational unit within the MINAGRI directly
responsible for these matters is the Directorate of Fisheries (hereinafter: DoF). The DoF is responsible
for performing all administrative tasks within marine fisheries (managing the fleet and resources),
freshwater fisheries, aquaculture (marine and freshwater), structural measures (as the Managing
Authority) and market policy and fishery inspections. Apart from the central office in Zagreb, the DoF
has seven field offices which perform technical and administrative tasks. The MINAGRI-DoF has an
objective of establishing the system of sustainable management of resources and the fisheries sector in
general. Administrative structure of the DoF is shown in Appendix I, while further description of
organisation and tasks of the DoF is provided in the Chapter 2.9. Administrative framework.
The Department of Fisheries has been established within the Agricultural Advisory Service and its
main task is to link administration and fisheries’ stakeholders, and to provide advisory services to the
sector. Sector stakeholders are associated in chambers and cooperatives The most significant umbrella
institutions are the Croatian Chamber of Economy (CCE) and Croatian Chamber of Trades and Crafts
(CCTC). Membership in Chambers is obligatory, where legal persons must be members of CCE and
NATIONAL STRATEGIC PLAN
8
crafts must be members of CCTC. As for the associating of stakeholders in cooperatives, the growing
interest has been noted over the last few years. To meet this interest and to provide basic guidelines
for development of cooperatives, the legislation for recognition of fishery cooperatives was adopted in
order to additionally stimulate stakeholders to associate and insure monitoring of the work and
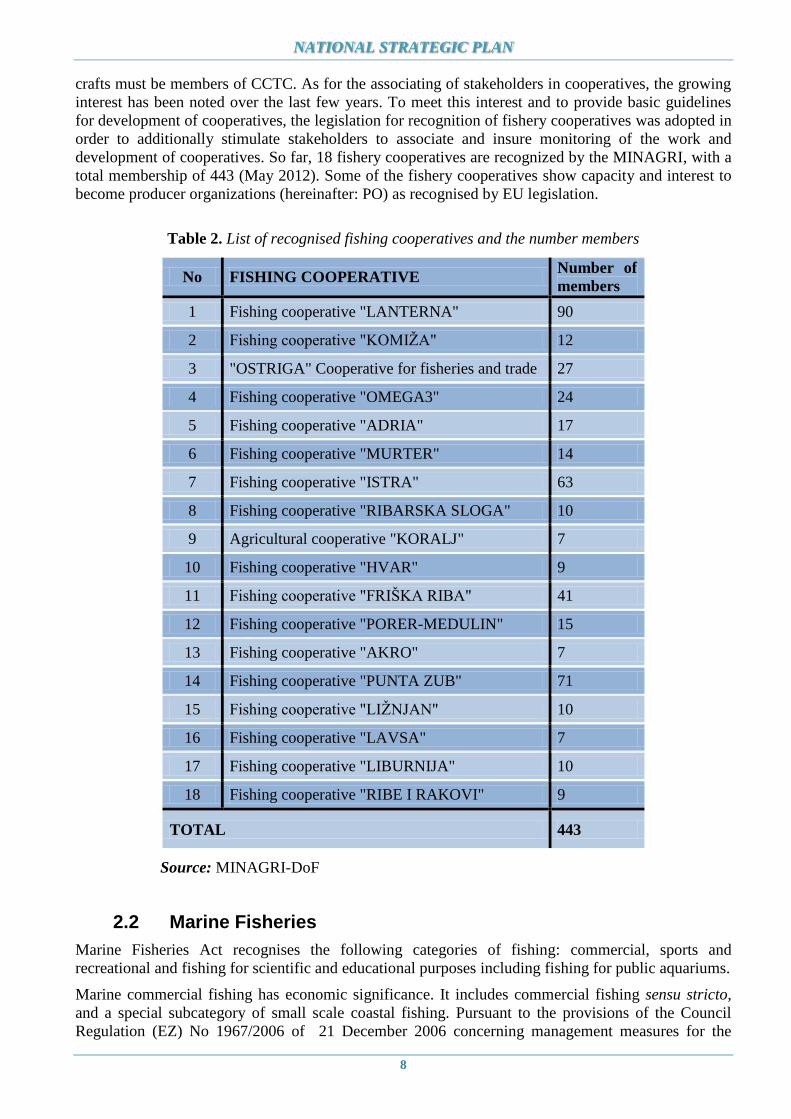
development of cooperatives. So far, 18 fishery cooperatives are recognized by the MINAGRI, with a
total membership of 443 (May 2012). Some of the fishery cooperatives show capacity and interest to
become producer organizations (hereinafter: PO) as recognised by EU legislation.
Table 2. List of recognised fishing cooperatives and the number members
No FISHING COOPERATIVE Number of
members
1 Fishing cooperative "LANTERNA" 90
2 Fishing cooperative "KOMIŽA" 12
3 "OSTRIGA" Cooperative for fisheries and trade 27
4 Fishing cooperative "OMEGA3" 24
5 Fishing cooperative "ADRIA" 17
6 Fishing cooperative "MURTER" 14
7 Fishing cooperative "ISTRA" 63
8 Fishing cooperative "RIBARSKA SLOGA" 10
9 Agricultural cooperative "KORALJ" 7
10 Fishing cooperative "HVAR" 9
11 Fishing cooperative "FRIŠKA RIBA" 41
12 Fishing cooperative "PORER-MEDULIN" 15
13 Fishing cooperative "AKRO" 7
14 Fishing cooperative "PUNTA ZUB" 71
15 Fishing cooperative "LIŽNJAN" 10
16 Fishing cooperative "LAVSA" 7
17 Fishing cooperative "LIBURNIJA" 10
18 Fishing cooperative "RIBE I RAKOVI" 9
TOTAL 443
Source: MINAGRI-DoF
2.2 Marine Fisheries
Marine Fisheries Act recognises the following categories of fishing: commercial, sports and
recreational and fishing for scientific and educational purposes including fishing for public aquariums.
Marine commercial fishing has economic significance. It includes commercial fishing sensu stricto,
and a special subcategory of small scale coastal fishing. Pursuant to the provisions of the Council
Regulation (EZ) No 1967/2006 of 21 December 2006 concerning management measures for the

NATIONAL STRATEGIC PLAN
9
sustainable exploitation of fishery resources in the Mediterranean Sea (hereinafter: Mediterranean
Regulation), the usage of commercial gears such as nets is not allowed in non-commercial fishery, so
it was necessary to recognise the specific situation existing in Croatia in an adequate manner and find
mechanisms for transition of the former non-commercial category into a strictly limited sub-category
of commercial fishing. The subsistence fishery, as it was defined by earlier legal framework, ceases to
exist on 1 January 2015.
Croatian fishing sea is the sea area governed by Croatia, where it exercises its sovereign rights and
jurisdiction in issues related to fishing, and from the spatial aspect, it includes territorial sea of Croatia
as well as the PEFZ (i.e., area over which RH exercises its sovereign rights and jurisdiction).
For the purpose of implementation of management measures of living marine resources as well as for
collecting necessary data, an implementing regulation was adopted regulating the borders of fishing
zones, subzones and areas within the fishing sea of Croatia, as well as the borders of the fishing sea in
rivers flowing into the sea. The fishing sea of Croatia is administratively divided into eleven (11)
fishing zones and thirty-seven (37) fishing subzones. Out of eleven (11) fishing zones, four in the
inner fishing sea of Croatia are parts of zone A and zones E, F and G, while in outer fishing sea is part
of zone A and zones B, C, D, H, I, J and K (Figure 2).

NATIONAL STRATEGIC PLAN
10
Figure 2. Fishing zones of the Croatia

NATIONAL STRATEGIC PLAN
11
The Fishing Fleet Register of Croatia contains commercial fishing vessels (those issued a licence for
commercial fishing as well as those issued an approval for small scale coastal fishing). Subsistence
fishery vessels are entered into a special register. Register of vessels for recreational and sports fishing
is not kept by the DoF, but these vessels are entered in the register of boats at the port authorities. In
2011 4,136 vessels for commercial fishing were registered in the Croatia.
Table 3-1 of Appendix III demonstrates the number of vessels over the period 2001-2011. Increasing
trend can be explained by changes in the methodology and the data validation process. Upon the
establishment of the Fishing fleet register in 2001, the process of entering and validation of data lasted
till 2004. Only data from 2005 onwards can be considered validated. The increase of fishing fleet in
the period from 2005 to 2009 is the result of the development of the fisheries sector and support
programmes which were implemented during that period. As of 2010 the increase of the number of
fishing vessels is a result of the process of transfer of vessels from the non-commercial category of
subsistence fisheries into the commercial category. By accession of Croatia into the EU on 1 July
2013 and in line with the provisions agreed in the process, 3,500 vessels were transferred from the
non-commercial category of subsistence fishery into the commercial one. Since in 2011 there were
around 11,000 fishing units engaged in subsistence fisheries for personal needs, and since this
category ceases to exist as from 1 January 2015, the total number of participants in fisheries using
commercial gears are about to decrease. Number of vessels which are at the moment registered in the
Croatian Fishing fleet register is 7,791.
The largest percentage of fleet (81.29%) includes vessels less than 12 meters in length3 . Total
strength and tonnage of the commercial fishing fleet of Croatia was 326,987 kW and 44,998 GT in
2011. Segmentation of the fleet by length and type is shown in Table 3-3 of the Appendix III.
The largest number of vessels is registered as multi-purpose (45.24% of the fleet). These vessels are
typical for Mediterranean fisheries where there are no clearly defined target species and in which
fishermen change gear during the year. In 2011 the total catch by purse seines was 64,389 tons
achieved by 226 purse seiners. In the same year, 562 vessels were active in bottom trawling, catching
a total of 4,275 tons of marine organisms. Out of all the vessels using bottom trawl nets, some 230 of
them achieve a catch larger than 5 tons a year. This short review of fleet distribution is based upon the
registration of gears and the registration of vessels.
In 2011, catches of purse seine nets made 91.29% of total Croatian catches (Appendix III, Table 3-9).
At the same time 6.10% of the catch was caught using trawl nets while gillnetting achieved around 2%
(24% of fleet registered for this gear). Percentages of other fishing gears are each represented with
less than 1% of the total catch. Small pelagic species make the largest share of catches landed, as well
as the largest share of catches in general (Appendix III, Tables 3-10 and 3-12).
The total catch in 2008 was 49,011 tons, in 2009 - 55,547 tons, in 2010 - 52,395 tons, and in 2011 -
70,535 tons. Over the years, more than 80% of total catch consists of small pelagics (sardine and
anchovy). In 2011, the share of demersal and pelagic fish species in the catches was around 97%,
while cephalopods made 1.50%, and crabs and shellfish around 1%. Most significant landing places in
2011 for small pelagics were Kali, Zadar, Novalja, Biograd na Moru, and Milna, and for the demersal
species, Tribunj, Hvar, Poreč, Komiža and Mali Lošinj.
In accordance with the ICCAT (International Commission for Conservation of Atlantic Tunas)
recommendations, Croatia decreased the number of licences for commercial fishing with tuna purse
seines in order to adjust the fishing capacity with fishing opportunities, i.e. available quotas. During
2009, 2010 and 2011 significant activities were undertaken, mostly in form of providing
compensation for cessation of this type of fishing and erasing tuna purse seine gear from the licences.
Tuna fishing is the only form of fishing which is under a system of quotas.
3 The percentage was calculated prior to the transition of 3500 vessels from the non-commercial category into the
commercial category. With this addition, the fleet structure changed (the percentage of vessels below 12 m has increased
significantly, given that all the vessels entering the fleet were small vessels.)

NATIONAL STRATEGIC PLAN
12
The average age of Croatian fishing fleet is more than 30 years, but it is not equally distributed among
all fleet segments. Average active trawlers are older than active purse seines, and the trawlers are
among the oldest active vessels. The age structure of fishing fleet is presented in Appendix III Figure
3-3. In addition to the age composition of the Croatian fishing fleet, it needs to be highlighted that
most of the vessels are poorly equipped in terms of energy efficiency (old engines with high fuel
consumption), product quality (lack of ice machines and adequate storage and cooling facilities on
board) as well as equipment related to improvement of working conditions and safety on board.
Due to geographical characteristics, and the characteristics of the national fishing fleet (mainly small,
aged and insufficiently equipped vessels), inadequate capacity of the existing infrastructure, and given
the highly pronounced competition for the existing port infrastructure (particularly with nautical
tourism), at the moment there is large number of landing places in Croatia. These fall under two main
categories – landing places for vessels less than 15m (107) and those for vessels above 15m (139).
Although there is an obligation to ensure berth for fishing vessels within each of the listed landing
places, majority of landing places does not have sufficient capacity in terms of operational port area
and auxiliary services. According to the Feasibility study on the development of the fisheries
infrastructure implemented in 2006, it is estimated that Croatian fishermen utilise a total of around
15km of port area, while it is estimated that there is a need for providing additional 3-7km of
operational port area. Apart from the lack of space, another limiting factors are the insufficiently
equipped existing landing places in terms of ability to provide auxiliary services such as fuel, repair
and maintenance, cooling and storage facilities, vicinity of roads (accession roads), etc. Improvement
of port infrastructure is considered as one of the basic prerequisites for successful further development
of the fisheries sector. Furthermore, development of coastal infrastructure is a key element in the
implementation of the landing obligation, which is one of the main elements of the reformed CFP.
Global economic crisis which started in 2008 affected all segments of economy and society on the
national level. Unfavourable economic trends on global level were followed by significant increase of
fuel prices on global market. Fishery, as a particularly sensitive segment of economy, with emphatic
traditional and cultural value, also was affected by negative economic developments. Production costs
of economic operators in marine fishing have suddenly increased and became too high in comparison
to first sale prices which remained on the same level. The cost of fuel represents the largest individual
cost in business activity of the economic entities engaged in marine fishing and it is estimated that
between 50% and 60% of total income is spent on fuel. Although the fuel for fisheries is tax free and
available on the market as “blue diesel”, the market price is still too high and represents the most
significant barrier in achieving sufficient level of profitability.
2.3 Freshwater Fisheries
Freshwater fisheries segment includes commercial, recreational and sports fishing and it is regulated
by Freshwater Fisheries Act, as well as by implementing regulations based upon it. Zones, gears and
equipment, fishing fees, catch quotas, reporting of catches, as well as protection measures for the
conservation of fish stocks are defined for both commercial and sports fishing. Total catches in
freshwater fisheries in 2011 (commercial and sports) amounted to 646 tons (Appendix IV, Table 4-1).
Commercial freshwater fishing in Croatia takes place on the rivers Danube (within the borders of the
Republic of Croatia), and Sava (downstream from Jasenovac within the borders of the Republic of
Croatia). Number of fisherman, quantity of catch and availability of markets in commercial capture
freshwater fishery has decreased more than 10 times in comparison to the pre-war years. The data
from 2011 show a total of 33 licensees for commercial freshwater fishing; 25 of them are registered
for commercial fishing on the Danube and 8 on the Sava river. Total catch in commercial freshwater
fishery in 2011 was 51 tons, out of which some 90% was caught in Danube and 10% in Sava.
There are some 38,500 anglers engaged in sports freshwater fishing in Croatia. These are grouped in
130 fishing right holders. Holders of fishing rights have the obligation to manage the resources based

NATIONAL STRATEGIC PLAN
13
on the annual management plans. Managing of this segment of freshwater fisheries is done through
sports and recreational fishing associations, and in 2011, the total catch in freshwater sport fisheries
was 595 tons.
Commercial fishing can contribute to the market supply and to overall touristic offer through
provision of species and products that go beyond the offer of the farming sector. Furthermore, sports
fishery can contribute to enrichment of touristic offer. Both aspects can contribute to development of
rural areas by providing employment in fishing, processing, tourism, and by contributing to the
preservation of traditional, cultural, ecological and ethnological values. As different interest groups
are concerned, there is a traditional conflict between the commercial and sports fishermen.
2.4 Aquaculture
Aquaculture in Croatia is an economic activity with the objective to ensure ecologically sustainable
economic growth of the fisheries sector, and in the segment of mariculture to, above all, ensure high
quality and competitive food product and contribute to entire development of coastal, island and rural
areas.
2.4.1 Marine aquaculture (mariculture)
Mariculture in Croatia includes farming of finfish and shellfish. The total production in 2011 was
about 7,000 tons (Appendix V, Table 5-1). Finfish farming is dominated by European seabass
(Dicentrarchus labrax), gilthead seabream (Sparus aurata), and Atlantic bluefin tuna (Thunnus
thynnus).
Production of seabass and seabream reaches some 5,000 tons per year. Farming of these two species is
undertaken in floating cages, applying modern technologies, and implies completely closed farming
cycle from controlled spawning to market-size product. Farming activities are wide-spread along the
entire coast, in all Croatian coastal counties. The most significant activity takes place in Zadar County.
Most of the farmed fish is placed on the domestic and the EU market (Italy). The export on the EU
market was in the pre-accession period limited by small duty free quotas. Over the last few years a
constant increase of production of these species has been recorded due to an increase in consumption
on the domestic market, as well as the stabilization of prices on the EU market. The total annual
production of sea bass and sea bream fry in hatcheries (situated on land) is around 15-20 million
pieces. This production is far from the needs of the actual farming capacities, which is why a large
quantity of fry is imported from Italy and France.
Farming of Atlantic bluefin tuna (Thunnus thynnus) takes place in floating cages in the semi-open and
open sea of the Central Adriatic, in the areas of Zadar and Split-Dalmatia counties. Farming is based
on capture of small wild tuna (8-10 kg) and their subsequent farming to the market size (over 30 kg).
The annual production of Atlantic bluefin tuna is some 30% (in volume) of the total mariculture
production, or about 3,000 tons, and it is almost entirely exported to Japanese market. In the last few
years the stagnation of the production is recorded, due to restrictive measures in tuna fisheries.
Shellfish farming takes place in special areas that are under monitoring established pursuant to the
requirements governing the control of hygienic market standards. Shellfish farming in Croatia
comprises farming of mussels (Mytilus galloprovincialis) and oysters (Ostrea edulis) in floating parks.
Shellfish farming takes place mostly in the area of Malostonski zaljev and Malo more, along the
western coast of Istria, estuary of the Krka River and Novigradsko more. Shellfish are farmed by
applying traditional technologies, using the pergolari ropes and is based on collecting shellfish fry
from nature. At the moment there are no hatcheries for shellfish. Around 2,000 tons of mussels and
around 1 million pieces of oysters (i.e. 50 t) are produced per year. The capacity of most farming sites
does not exceed 50 tons per year.
NATIONAL STRATEGIC PLAN
14
While planning further development of marine aquaculture, Croatia has defined specific criteria for
aquaculture zones in order to avoid possible conflicts within sensitive coastal area. Several coastal
counties have developed these zones based on the integrated coastal management principles (ICZM)
and the intention is to apply this tool in all coastal physical plans. This approach is the constituting
element of the implementation of the Integrated maritime Policy within which the integration of
different activities may contribute to the overall blue growth. Given the importance of the IMP
elements in the forthcoming period, it is expected that marine aquaculture activities shall present a key
element in the development of the fisheries sector as a whole.
Legal framework in Croatia related to establishing of farms in mariculture is compliant with EU
standards. Licencing procedure is based on the compliance of the project with the physical planning
on local and regional level. Also, based on the specific legislation related to the protection of nature
and environment, all farms are obliged to undergo an environmental impact assessment (EIA)
procedure depending on the specific site conditions, species farmed and planned production quantity.
In addition, there is a mechanism in place which implies the obligation of continuous monitoring of
prescribed environmental indicators on existing establishments, depending on the size of the farm,
thus enhancing the regard of the operators towards the environment.
2.4.2 Freshwater Fish Farming
Freshwater fish farming in Croatia includes production of cold water species (salmonidae, trout) and
warm water species (cyprinid, carp). Most significant species in freshwater farming are carp
(Cyprinus carpio) and rainbow trout (Oncorhynchus mykiss), Farming of carp mostly implies farming
in a controlled environment either in monoculture or polyculture with other species, predominantly
grass carp (Ctenopharyngodon idella), bighead carp (Hypophthalmichthys nobilis), silver carp
(Hypophthalmichthys molitrix), catfish (Silurus glanis), pike-perch (Stizostedion lucioperca) and pike
(Esox lucius). The production is mainly semi-intensive, and the production cycle generally takes three
years.
Cold water species farming mainly involves farming of rainbow trout (Oncorhynchus mykiss), with
the production cycle of around two years.
Most of the produced freshwater fish is placed on domestic market even though in the last years there
has been an increase of export to the EU (Italy, Germany, Hungary and others) and to Bosnia and
Herzegovina, Macedonia, Serbia and Montenegro.
In 2011, the total production of freshwater fish was 6,283 tons, whereas the largest share of produced
fish includes carp (2,891 tons) and trout (2,489 tons) (Appendix V, Table 5-2). The decrease in
production in 2010 needs to be perceived in context of a new statistical method of data collection,
while in 2011, the increase is recorded in production of freshwater fish compared to the 2010. At the
moment, there are 28 warm-water fish ponds (farms) and 27 cold-water raceways (farms) registered in
Croatia. Total production area of warm-water fish ponds in 2011 amounted to 9,721 ha, and the cold-
water raceways to 61,361 m² 4.
Significant activities are planned to be directed towards the registration of numerous small fish ponds
which exist within family farms and which represents a category that appeared only in the last few
years in Croatia and as such represents a certain novelty. These farms have certain comparative
advantages in term of additional potential to the development of aquaculture, and in particular to
development of rural tourism.
Freshwater fish farms represent areas of a high natural value and are included into the Croatian
ecological network (Regulation on proclamation of ecological network OG No 109/07). These are also
included in the proposal for NATURA 2000 network for Croatia. These are large fish ponds mostly of
extensive nature, characterised by high biodiversity and diversity of habitats, and represent
4 Croatia is going to change data collection system starting with 2013 data.
NATIONAL STRATEGIC PLAN
15
internationally significant wet land birds’ habitats contributing to the diversity of landscapes of the
surrounding area.
Licencing procedure is based on the compliance of the project with the physical planning on local and
regional level. Also, based on the specific legislation related to the protection of nature and
environment, all farms are obliged to undergo an environmental impact assessment (EIA) procedure.
All activities within the freshwater aquaculture must be conducted in accordance with the conditions
set out during the licensing procedure, including also monitoring of the environmental indicators.
2.5 Processing and Market
Processing sector includes relatively small number of processors, especially when it comes to
demersal species where most of this catch is placed on the market as fresh. Small pelagic fish is the
predominant raw material in the traditional processing industry which was once based mainly on
canning. Over the last 5 years canning has been decreasing, compensated by an increase in the
production of salted fish (anchovies) and frozen fish assortment.
As per the National Classification of Activities (NCA) (DA 152), in 2011 there were 76 fish
processing companies in Croatia, out of which 70 were active. It needs to be emphasized that this data
do not include crafts, nor the companies that have registered some other type of activity as their
primary activity - usually trade, production or fisheries.
Difficulties in modernisation of production in this segment during the pre-accession time occurred due
to the fact that only companies and crafts without export number (those which were not listed on the
EU-approved establishments list) could apply for pre-accession funds, thus preventing the financing
of production modernization. Modernisation would however directly result in diversification of
production assortment with products of higher added value, and in more valuable, economic and
efficient business, long term stability and growth and development of the entire fisheries sector.
Trade system in fisheries in Croatia is based on cooperatives and registered first buyers (retailers and
wholesalers). First sale can only be made to registered first buyers. In 2012, 1,039 first buyers were
registered in the corresponding Register of the MINAGRI-DoF. Development of fishing ports, buy off
stations and whole sale markets additionally contributes to improvement of the market organisation in
fisheries and creates environment for more thorough inspection and control activities.
Trade channels and market organization are different for demersal and pelagic species. The largest
part of the demersal catch (trawlers, gillnets, etc.) after the first sale is exported, while the catch of
small pelagics represents raw material for canning and salting industry and feed in tuna farming. Due
to natural fluctuations in the quantity of catch and differences in the composition of the catch, in some
months during the year market gets saturated since there is a lack of storing facilities, so there are
certain marketing difficulties for part of the catches. Lack of storage facilities, as well as the lack of
possibilities of withdrawal, represents significant factors on the market.
During the last few years, significant changes in trade channels for farmed fish have been noted as it
seems that the fish is mainly being sold through big retail chains and less through the fish markets.
Farmed shellfish are placed on the market exclusively through registered distribution centres.
2.6 Inspection, Control and Data collection
The Sector for monitoring and control of fisheries of the MINAGRI-DoF is the administrative unit in
charge for the inspection and control pursuant to the Marine Fisheries Act and Freshwater Fisheries
Act. These activities are being implemented by 26 fishing inspectors and 6 skippers. This number of
employees is not sufficient, and it is planned to hire 11 new inspectors.
NATIONAL STRATEGIC PLAN
16
In addition to the fisheries inspection, there is coordination between different bodies pursuant to the
Marine Fisheries Act which are authorised for conducting the tasks of inspection and control. The
most significant bodies authorised for inspection and control pursuant to the Marine Fisheries Act are
ministry in charge for interior affairs, ministry in charge for maritime affairs and the Coast Guard.
The Sector for monitoring and control of fishery of the DoF drafts an annual and multi-annual plan of
fisheries inspections and controls and is responsible for coordination and integration of reports and the
creation of appropriate plans for inspections and controls over marine fisheries for the fisheries
inspection and other bodies authorised pursuant to the relevant acts.
Fisheries Monitoring Centre (hereinafter: FMC) was established within DoF and it is in charge of
receipt of the data from the satellite-based vessel monitoring system (hereinafter: VMS). The FMC is
also responsible for receipt and transmission of all electronic data stemming from different obligations
of electronic data recording and reporting.
Sport and recreational fishing on tuna and tuna like species is regulated by the national quota (under
the ICCAT annual quota for Croatia) and recreational and sports fishing permit system. Competitions
are organized by Croatian Sports Fishing Association and each participant must have a sports fishing
permit. Fisheries inspector is present at each event, while the sampling of tuna (size, weight, etc.) is
conducted by the Institute of Oceanography and Fisheries (hereinafter: IOF). All recreational fishing
licenses are issued electronically, and all authorized persons acting under the Marine Fisheries Act
have access to the database of licenses issued. The frequency of controls at sea (all forms of fishing
including recreational) are listed in the annual Plan of fisheries inspection.
Over the past years, data in fisheries are gathered through numerous annual monitoring schemes and
data collection programmes. These were conducted by the DoF and the IOF, and were drawn on an
annual basis. The National Fisheries Data Collection Programme started with its implementation as of
2012 while it has been fully harmonised with the provisions of the acquis as from 2013.The National
Fisheries Data Collection Programme shall replace all individual programmes and research listed and
described herewith.
In accordance with the provisions of the Regulation (EC) No 1921/2006 of the European Parliament
and of the Council of 18 December 2006 on the submission of statistical data on landings of fishery
products in Member States and repealing Council Regulation (EEC) No 1382/91 (OJ L 403,
30.12.2006) Croatia has established links between responsible authorities (Croatian Bureau of
Statistics (CBS) and the MINAGRI) in order to meet the relevant requirement and secure the delivery
of statistical data in a unified manner. Since 200, Croatia has been implementing the obligation of all
license holders to keep and submit the logbooks on fishing activities. According to the provisions of
the national regulation, all license holders operating with fishing vessels equal to or longer than 10 m
have to keep and submit the logbook. The logbook has to be kept on board during the fishing
activities, in order to enable inspection and control at any point in time. Logbook contains the data on
catch and landing per species and quantity. Data to be entered are: name or registration of the vessel,
CFR, info on license holder, date/hour/port of departure, date/hour and port of return, date/hour and
port of landing, gear type and quantity, time spent fishing, areas where fish was caught, data on catch,
data on discards, data on landing - landing declaration. In addition to the obligation stipulated in
Article 23 of the Mediterranean Regulation, data on catches over 10 kg has to be entered into the
logbook for all species. Species caught in quantities of less than 10 kg are registered as other catch in
the logbook. Exceptionally, there are 16 species that have to be entered into the logbook regardless of
the quantity caught. These are the following: Spicara sp., Lophius sp., Homarus gammarus, Engraulis
encrasicolus, Palinurus elaphas, Zeus faber, Arca noae, Eledone sp., Merluccius merluccius, Sprattus
sprattus, Maja squinado, Sardina pilchardus, Mullus barbatus, Mullus surmuletus, Nephrops
norvegicus and Scorpaena sp. Each license holder is obliged to submit the logbook to the MINAGRI
no later than 48 hours upon landing. MINAGRI staff (in field offices of the DoF) has to enter all
logbook data in the database. Database is kept per license holder and per vessel (linked with the fleet
register).

NATIONAL STRATEGIC PLAN
17
License holders operating a vessel over 10 m are obliged to fill in the landing declaration upon each
landing, and to submit the copy to the MINAGRI no later than 48 hours upon landing, and all
originals have to be submitted to the MINAGRI by the 15-th of the month after the month in which
the catch was landed.
License holders operating a vessel less than 10 m have the obligation to submit a catch report. The
data entered in the catch report include name and registration of the vessel, serial number of the
license, data on license holder and the vessel, port of operation, date/hour of departure, date/hour of
return, gear used, zones where catch was realized, catch data (per species and quantity). The catch
report is kept in a form of a book with numbered pages, and each page is produced in 2 copies. The
report has to be submitted to MINAGRI each month, and data has to be entered on a daily basis. All
species have to be entered regardless of the quantity caught. If the total catch of a vessel is over 300
kg of small pelagics or over 50 kg of demersal species, it has to keep the logbook regardless of the
length.
First sales of catches have to be made at places designated as points of first sales. Exceptionally, first
sales may take place in a place that is not a designated point of first sales, but only under the condition
that the first buyer is a recognized first buyer and submits the information within 48 hours. A
possibility that landing could be realized in a port state that is not the flag state (Croatia) has been
foreseen, but this situation has not been registered yet. Licensed and designated points of first sales
have the obligation to submit the data on first sales to the MINAGRI within 48 hours. In cases where
the first sales take place in a non-designated place, the first buyer has to submit these information to
the MINAGRI before placing the goods into further circulation and by no means later than 48 hours
upon first sales.
The fishing fleet activity, catch, landing and marketing of the fishery products in Croatia is monitored
using a number of mechanisms including the electronic communication as well as standard ways such
as logbooks. Introduction of electronic system and links between the data bases on licenses, fleet,
catches and landings, first buyers, first sales and VMS system, enabled efficient data cross check.
Considering the geographical characteristics and tradition in Croatia, a large number of landing places
has been identified. This complicates the physical control of catches/landings/sales data and solution
to that problem represents one of the priorities. As to facilitate the on-the-spot control and increase
coverage of the inspection activities on site, Croatia has adopted the electronic system for detection of
the discrepancies between the data and potential irregularities. On-site inspection is planned and
implemented based on risk analysis and potential number of infringements in relation to landed
quantities and/or number of vessels operation within a certain port.
Croatia has started the installation of the equipment for implementation of the electronic logbook
system (including the landing declarations and transhipment declaration) on vessels over 15 meters.
The fleet segment above 15 meters is equipped with VMS equipment.
Croatia has not systematically gathered socio-economic data so far. Gathering of socio-economic data
such as employment, gender specific data, income and expenditures, were sporadic and mainly within
scope of certain projects and as such cannot be used for systematic analysis. Data to be gathered by
the end of 2013 within the framework of the socio-economic component of the National plan for
collection of data in fisheries shall be available for systematic socio-economic analysis in 2014.
2.6.1 Research and surveys
The most significant scientific institution for Croatian fisheries is the IOF.
The state of the demersal fishery resources was monitored via the project DemMon, the state of the
pelagic fishery resources via the project PeriMon, state of coastal fishery resources by the project
PRIMO, and there is also the tuna catches and farming monitoring programme.
NATIONAL STRATEGIC PLAN
18
Along with the listed research and monitoring programmes of commercial fisheries resources, there
are permanent scientific surveys at sea monitoring the status of renewable marine resources and
include MEDITS (international bottom trawl survey) and MEDIAS (pelagic survey by echo detection).
Both surveys are of international character.
DemMon, project for monitoring of demersal resources along the eastern Adriatic coast was
established in 2002. It has been initiated for the purpose of describing the status of demersal resources
and giving recommendations for establishing the long term sustainable management. Demersal
monitoring includes gathering of the fishery, biological and to a certain extent socio-economic data
related to bottom trawling fishery in Croatia. . Sampling is done on commercial fishing vessels in
whole of the fishing seas of Croatia. Data gathered were used as a scientific basis for the management
measures of the regulation of fishery and protection of renewable fishing resources within the
Croatian fishing sea.
PeriMon, project for monitoring of pelagic resources along the eastern coast of the Adriatic Sea –
Croatian territorial waters, was initialised in 2008 as a follow up of project PelMon VPA which was
established in 2006. The main goal of the project was to describe quantitative and qualitative
composition of the catches within the commercial pelagic fisheries in Croatia, to describe the basic
socio-economic elements of this type of fisheries, describe the population structure of the most
important commercial species (sardine and anchovy), which includes composition of populations by
length and weight, to describe the selectivity of purse seine net from the aspect of by catch in pelagic
catches and provide the recommendation for future management and protection of renewable pelagic
resources in Croatian fishing sea.
MEDIAS, former PELMON, has been implemented continuously as of 2002 and includes the survey
of the entire Croatian fishing sea, whereas Italy implements a parallel research along the western
Adriatic coast. The basic goal of this programme is gathering important data on pelagic ecosystems
with a particular focus on commercially important small pelagic species.
Permanent monitoring programme in coastal areas where fishing with traditional fishing techniques
are allowed has been implemented since 2007. The main objective of the research is to gain a
thorough insight into the state of the biological resources with the focus on commercially important
species along the eastern Adriatic coast. The research is done by way of analysing the commercial
catches in particular areas and in cooperation for professional fishermen. During the research, catches
mostly made by gillnets are analysed.
MEDITS represents a systematic and permanent survey of demersal resources at the Mediterranean
and Adriatic Sea. The project is of international character. It was initialised in 1993 and Croatia joined
the project team in 1996. MEDITS among other things provides for mapping the distribution of
species, estimation of biomass, locating nurseries and growth areas, which all results with the
assessment of the status of demersal resources of the most important commercial species in the
Mediterranean and Adriatic Sea and for development of the national and international management
plans for demersal resources.
All the above mentioned researches are included within the National programme for collection of data
in fisheries as from 2013.
Apart from these, it is important to mention other international surveys such as the UWTV Survey and
Deep Sea Survey. The UWTV Survey represents the research of the open middle Adriatic by using
underwater cameras with the final goal of describing the Norwegian lobster population. Participants of
this project are the IOF and Consiglio Nazionale delle Ricerche (National research Committee) from
Ancona. Furthermore, these two Institutes participate in the SOLEMON expedition, which aims at
gathering sufficient data on status of sole species In the Adriatic Sea. In addition, the FAO AdriaMed
project (Scientific collaboration to support responsible fisheries in the Adriatic) has been
implemented as of 1999 and implies collaboration of scientists of all Adriatic countries. Within the

NATIONAL STRATEGIC PLAN
19
framework of this project numerous research programmes are being implemented with unifying
methodologies, training on new methods applied in fishery sciences joint data analysis, etc.
The international survey titled Deep Sea Survey, represents the research of the deepest parts of the
Adriatic Sea (deeper than 1,000 m), and it is implemented with an aim of describing the deep sea
populations and research of the possibility for their eventual exploitation. During the implementation
of the research, bottom trawl nets and pelagic trawl nets are used as well as longlines and traps. All
relevant scientific institutes of the Adriatic countries take place in this research all under the umbrella
of the FAO AdriaMed project.
Additional scientific research programmes are implemented with the purpose of proposing
management measures in aquaculture.
2.7 Education and training
There is a general training programme for sea-farers under the competence of the ministry in charge of
maritime affairs. In addition to the basic requirements for gaining the certificate of the ability to work
on board of fishing vessel, the legal framework asks for additional requirement which relate to basic
capabilities in fisheries (certification gained upon the exam organised and held by the DoF – Field
offices). The legal framework defines which crew members, must also fulfil requirements and
provisions from the scope of fisheries legislation. Technical, undergraduate and postgraduate training
courses provided in Croatia include:
Nautical High School in Split: vocational training in fisheries
University of Split within which Maritime faculty and University department for marine
studies are established. Within the Maritime faculty there are undergraduate and graduate
studies of maritime nautics, ship engineering, maritime electro technical and information
technology and technology related to marinas and yachts and maritime management. Apart
from the mentioned, within the graduate studies there is one additional study – study on
maritime systems and processes. Within the University department for marine studies there are
also undergraduate and graduate studies for marine biology and ecology and study of marine
fisheries, as well as the interuniversity postgraduate study – applied marine sciences.
University of Zagreb: MA in Fisheries and Management, University Specialist in Fisheries,
PhD in Oceanology and PhD in Agricultural Sciences
University of Dubrovnik: PhD studies in Applied Marine Sciences
2.8 Lessons learnt
2.8.1 National support schemes to fisheries sector
Various support models were implemented in Croatia over the past decade. The budget for fisheries
was stable at an average of EUR 13,500,000.00 (HRK 100,000,000.00) per year. It included various
schemes for stakeholders, market mechanisms as well as budget for resource research, survey and
monitoring programmes, strengthening of data collection system and strengthening of inspection and
control services.
Among support schemes for stakeholders, the most significant are structural support schemes similar
to EFF measures and some state aid schemes. As for the state aid schemes, the most important are the
aid to establishing and functioning of fisheries cooperatives (HRK 5,341,592.63 or EUR 733,735.25
paid in 2012) and the aid aimed at maintenance of the fish pond eco systems (HRK 9,841,027.01or
EUR 1,351,789.42 paid in 2012).

NATIONAL STRATEGIC PLAN
20
A legal basis for the national structural support schemes was the Act on structural support and
organisation of market in fisheries (OG No 153/09, 127/10 and 50/12) adopted in 20095. Based on this
act, MINAGRI – DoF has for the first time introduced the structural support measures in 2010 by way
of set of measure-specific Ordinances. The main idea behind this was to promote the structural
support as a new model of support in Croatian fisheries, both at stakeholder and administrative level.
To this end, the DoF took the managing role and was responsible for definition of measures and
related eligibility and selection criteria, while the Paying Agency for Agriculture, Fisheries and Rural
Development (hereinafter: PAAFRD) took the role of a technical body responsible for the technical
elements of implementation for each of the measures. The engagement of the PAAFRD in
implementation of the structural support scheme included thus set of steps starting from the publishing
of public call for proposals to the final payments to beneficiaries. Having such an institutional set up,
DoF and PAAFRD have in close cooperation developed procedures which resulted in gaining relevant
knowledge and experience which represents one of the most valuable assets for the future
implementation of the OP fisheries.
Another important lesson from the 2010-2012 national structural support implementation period is
related to stakeholders Croatia considers that the primary goal– familiarising the sector stakeholders to
measures and implementation mechanisms - was successfully achieved and this can be confirmed by
the number of applicants, beneficiaries and money spent as shown by the figures in Table 3. The same
table presents the “evolution” of structural support measures over the period of three years. These
figures and the related analysis demonstrate several key issues:
General conclusions
There is an evidence of economic crisis and limited investment potential of beneficiaries,
particularly small scale investors in 2012 compared to previous years. This fact is particularly
visible in the decrease of total amount paid to beneficiaries as well as the decrease of the
average value of projects in almost all measures (except the measure related to development of
mariculture);
A relatively high share of applications met the measure-specific requirements which
demonstrates good level of preparation of projects. This share is higher in measure
“Investments on board of fishing vessels in marine fisheries” (80% on the average) and
slightly lower in aquaculture and mariculture related measure(s) (70% on the average).
Due to limitations of the national budget, maximum support amounts per project were fixed.
Analysis shows that this represented rather restrictive and non-stimulating factor for potential
beneficiaries particularly since the investments first had to be realised and support was paid
upon the finalisation of investment. It is also evident that the absorption capacity, particularly
in mariculture and aquaculture, was significantly higher than the aid intensity and co-financing
rate which can be demonstrated by the fact that there were certain projects several times larger
(for example – HRK 6,500,000.00 or approximately EUR 900,000.00) than the maximum
support available (HRK 1,400,000.00 or EUR 200,000.00);
Measure specific conclusions
Investments on board of fishing vessels in marine fisheries
The increase in the number of beneficiaries over the three years period shows the interest by
fishermen on these measures;
Total number of beneficiaries (<300) accounts for over 50% of total catches in Croatia, but
represent just between 10 and 15% of licence holders. This fact proves that the beneficiaries of
5 Act on structural support and organisation of market in fisheries (OG No 153, 127/10 and 50/12) has been ceased and
replaced by the Act on marine fisheries (OG No 81/13)

NATIONAL STRATEGIC PLAN
21
the measure were those fishermen who fully depend on the fisheries activities which was
precisely the targeted population;
The average amount of the support paid per beneficiary within the measure was rather low but
stable. It amounted to HRK 29,750.88 (EUR 4,083.17) in 2010, and afterwards increased to
HRK 34,328.43 (EUR 4,617.63) in 2011 and then decreased to HRK 30,683.18 (EUR
4,081.65) in 2012.
Investments on board of fishing vessels in freshwater fisheries
There has been a very low interest by potential beneficiaries for this measure. This fact,
together with the very small number of potential beneficiaries (33) meant that support for this
measure was discontinued in the structural measures package for 2012.
Investments in development of mariculture and freshwater aquaculture
There has been a decrease in the total number of beneficiaries from measure(s) related to
freshwater and marine aquaculture, which can be explained by economic crisis which reduced
the investment potential of small farms in particular;
The average amount of support paid per beneficiary in 2010 was HRK 176,668.00 (EUR
24,246.83), increased to HRK 405,449.24 (EUR 54,538.35) in 2011. In 2012 measures
targeting at development of mariculture and freshwater aquaculture were separately
implemented and the average amount of support paid per beneficiary, in comparison to total
amount of support paid for both of the subject measures, was HRK 305,441.14 (EUR
40,631.55).
Investments in fish processing industry
A decrease in the number of beneficiaries can be noted. In addition, overall support is quite
low which can be explained by the fact that similar measure is implemented through the
IPARD measure 103 (see later in the text). The national measure was envisaged to supplement
IPARD and to provide support to those beneficiaries which are not eligible under IPARD;
Also, when compared to IPARD, national support for processing is significantly smaller than
under IPARD, which indicates that it was probably less attractive to potential beneficiaries
(maximum support amount within the national support measures was HRK 500,000.00 – EUR
68,681.32 while the IPARD allows for maximum support amounting to HRK 10,095,000.00 –
EUR 1,500,000.00).

NATIONAL STRATEGIC PLAN
22
Table 3. Implementation of the national structural support measures during the period 2010-2012
STRUCTURAL MEASURE APPLICATION FOR SUPPORT
TOTAL AMOUNT OF
SUPPORT PAID (HRK)
TOTAL AMOUNT OF
SUPPORT PAID (EUR)**
APPLIED APPROVED PAID
2010
Implementation of regional
observer programme on tuna farms and tuna fishing vessels
11 11 11 1,347,551.85 184,945.01
Investments on board of fishing vessels in marine fisheries
225 192 177 5,265,906.14 722,720.27
Development of aquaculture 26 19 18 3,180,023.94 436,442.98
Investments on board of fishing vessels in freshwater fisheries
1 0 0 0.00 0.00
TOTAL 263 222 206 9,793,481.93 1,344,108.26
2011
Investments on board of fishing
vessels in marine fisheries 286 252 239 8,204,494.76 1,103,614.42
Development of aquaculture 25 16 16 6,487,187.78 872,613.64
Development of fish processing
industry 15 13 13 2,367,732.52 318,491.73
Investments on board of fishing
vessels in freshwater fisheries 1 1 1 46,762.36 6,290.16
TOTAL 327 282 269 17,106,177.42 2,301,009.95
2012 (21 August 2013)
Investments on board of fishing
vessels in marine fisheries 299 258 246 7,548,063.56 1,004,087.02
Development of freshwater
aquaculture 6 3+1 3+1*
1,789,791.64
+ 135,823.44*= 1,925,615.08
238,088.42
+18,068.02= 256,156.44
Development of mariculture 12 9+1 9+1* 2,242,460.77
+ 108,100.10*=2,350,560.87
298,305.09
+14,380.10= 312,685.19
Development of fish processing industry
10 10 10 1,571,386.92 209,034.97
TOTAL 327 280+2* 268+2* 13,151,702.89
+ 243,923.54*= 13,395,626.43
1.749.515.50
+32,448.12=1,781,963.62
* provisionally approved but not paid yet
** according to annual averages of the central currency rates of the Croatian National Bank
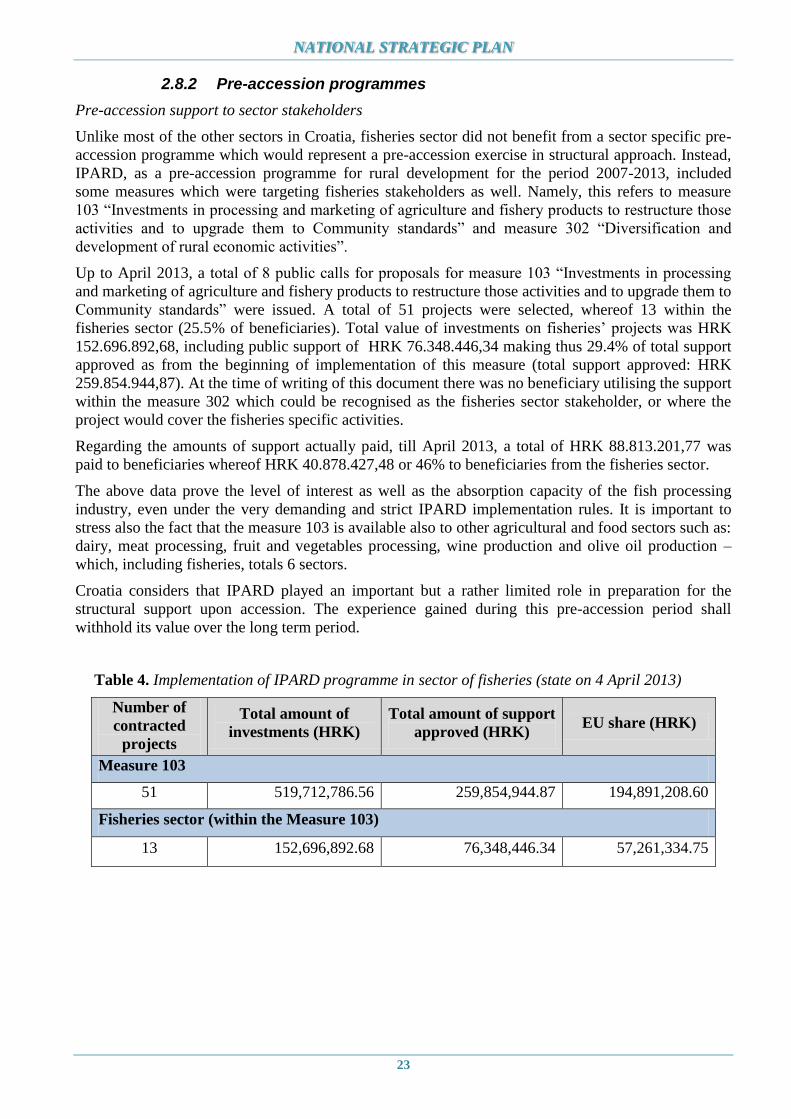
NATIONAL STRATEGIC PLAN
23
2.8.2 Pre-accession programmes
Pre-accession support to sector stakeholders
Unlike most of the other sectors in Croatia, fisheries sector did not benefit from a sector specific pre-
accession programme which would represent a pre-accession exercise in structural approach. Instead,
IPARD, as a pre-accession programme for rural development for the period 2007-2013, included
some measures which were targeting fisheries stakeholders as well. Namely, this refers to measure
103 “Investments in processing and marketing of agriculture and fishery products to restructure those
activities and to upgrade them to Community standards” and measure 302 “Diversification and
development of rural economic activities”.
Up to April 2013, a total of 8 public calls for proposals for measure 103 “Investments in processing
and marketing of agriculture and fishery products to restructure those activities and to upgrade them to
Community standards” were issued. A total of 51 projects were selected, whereof 13 within the
fisheries sector (25.5% of beneficiaries). Total value of investments on fisheries’ projects was HRK
152.696.892,68, including public support of HRK 76.348.446,34 making thus 29.4% of total support
approved as from the beginning of implementation of this measure (total support approved: HRK
259.854.944,87). At the time of writing of this document there was no beneficiary utilising the support
within the measure 302 which could be recognised as the fisheries sector stakeholder, or where the
project would cover the fisheries specific activities.
Regarding the amounts of support actually paid, till April 2013, a total of HRK 88.813.201,77 was
paid to beneficiaries whereof HRK 40.878.427,48 or 46% to beneficiaries from the fisheries sector.
The above data prove the level of interest as well as the absorption capacity of the fish processing
industry, even under the very demanding and strict IPARD implementation rules. It is important to
stress also the fact that the measure 103 is available also to other agricultural and food sectors such as:
dairy, meat processing, fruit and vegetables processing, wine production and olive oil production –
which, including fisheries, totals 6 sectors.
Croatia considers that IPARD played an important but a rather limited role in preparation for the
structural support upon accession. The experience gained during this pre-accession period shall
withhold its value over the long term period.
Table 4. Implementation of IPARD programme in sector of fisheries (state on 4 April 2013)
Number of
contracted
projects
Total amount of
investments (HRK)
Total amount of support
approved (HRK) EU share (HRK)
Measure 103
51 519,712,786.56 259,854,944.87 194,891,208.60
Fisheries sector (within the Measure 103)
13 152,696,892.68 76,348,446.34 57,261,334.75

NATIONAL STRATEGIC PLAN
24
Institutional strengthening
As of 2001 Croatia has been building its institutional system through EU pre-accession programmes –
CARDS programme over the period 2001-2004, replaced by its successors PHARE, ISPA and
SAPARD from 2005-2006 and finally a single “Instrument for pre-accession assistance” (IPA) as
from 2007. Over the observed period, the Croatian fisheries administration benefitted from a number
of pre-accession projects (list of projects given in Appendix VII) which contributed to significant
strengthening of its administrative capacity. The benefits of participation in these projects go far
beyond their financial value. Apart from the obvious institutional strengthening of the administration
in charge for fisheries sector which was clearly noted upon finalisation of each project, the Croatian
fisheries administration gained invaluable experience in programming, drafting of technical
documentation and implementing various types of contracts for procurement of services (Twinning
and Technical Assistance projects), goods (Supply contracts) and works (Works contracts). This has
made the fisheries administration one of the most successful sector-specific administrations within the
agro complex – not only by the percentage of approved projects, but by their number and value.
Moreover, pre-accession projects programmed and implemented by the fisheries administration
represented a first encounter with the “structural” approach. By way of participation in the pre-
accession projects, the fisheries administration gained insight into the main elements of the
functioning of structural instruments as well as the practical experience, thorough knowledge and
skills in project cycle management which most certainly represent some of the most important assets
for the post-accession period and the actual implementation of structural policy in fisheries.
2.9 Administrative framework
A new organizational scheme of MINAGRI-DoF has been established in June 2013, with the aim to
increase efficiency and functionality. DoF now consists of two (2) Sectors and two (2) Independent
Services (Appendix I, Figure 1-1.) whose scope of work covers all segments of the Common Fisheries
Policy, and these are:
Service for management of EU Funds;
Service for legal affairs
Sector for management, planning and development of fisheries
Sector for monitoring and control of fisheries.
All employees of the DoF are employed on the basis of specific work contract issued for every
individual working post, while the job description and duties for each position are defined by the
Regulation on internal rules of the MINAGRI. DoF has its headquarters in Zagreb and Field offices in
each of the seven (7) coastal counties (Pula, Rijeka, Senj, Zadar, Šibenik, Split and Dubrovnik). In
addition, fishery inspection has six (6) offices in the counties in the continental part of Croatia
(Vukovar, Vinkovci, Osijek, Slavonski Brod, Čakovec and Koprivnica). DoF is managed by Assistant
Minister.
2.9.1 Service for management of EU Funds
Main duties of the Service for management of EU Funds are:
developing strategic, programming and technical framework for the implementation of EU
funds in fisheries;
cooperating in creation of a Common strategic framework for the utilisation of EU funds
within its scope of competence;
coordination and development of a management and control system for implementation of the
OP fisheries;
implementing the functions of the Managing Authority (hereinafter: MA).

NATIONAL STRATEGIC PLAN
25
Given that the Service performs the functions of the MA for the OP fisheries, it undertakes all
functions as per its definition. However, given that the the possibility to delegate certain tasks to
the Intermediate body exists, some of them shall be delegated to the PAAFRD acting as
Intermediate Body of the MA which is further elaborated in the relevant chapters of this
document.
Table 5. Service for management of EU funds – administrative capacities
“ Employees employed for limited period of time
2.9.2. Service for legal affairs
The main duties of the Service for legal affairs are:
following and coordinating the harmonisation of the Croatian legislation in the field of fishery
with the EU acquis;
providing technical legal assistance to other services in the DoF in administrative proceedings,
and if necessary, implementing the administrative, criminal an infringement procedures, and
participating in the preparation of procedures’ related laws and legislation in the field of
fishery;
ensuring compliance with the requirements of the courts and the prosecutor's office, preparing
responses to the claims in administrative disputes;
Table 6. Service for legal affairs - administrative capacities
2.9.3. Sector for management, planning and development of fisheries
The main duties of the Sector for management, planning and development of fisheries are:
carrying out activities in the field of marine and fresh water resources, aquaculture, fleet
management, market organization and state aid;
proposing appropriate measures to ensure the sustainable management of resources in
accordance with the principles of the CFP, and coordinating the development and
implementation of Management plans;
establishing and implementing market organization measures in accordance with the
provisions of the EU market policy;
proposing, coordinating and implementing activities related to the implementation of state aid
in fisheries
keeping registers and ensuring their continuous improvement and upgrading in accordance
with the relevant part of EU acquis;
participating in the development and implementation of strategic and programming documents
for the implementation of EU funds within its scope of competence.
The Sector consists of three (3) services:
Unit Foreseen number
of employees
Current number
of employees
Service for management of EU Funds 5 4+1”
TOTAL 5 4+1’’
Unit Foreseen number
of employees
Current number
of employees
Service for legal affairs 5 4
TOTAL 5 4

NATIONAL STRATEGIC PLAN
26
Service for aquaculture;
Service for management of capture fisheries;
Service for cooperation, state aid and market organization in fisheries.
Service for aquaculture is responsible for aquaculture (freshwater and marine). Within this Service all
activities related to aquaculture are carried out, such as the license issuing as well as collecting,
monitoring and analysis of data related to aquaculture. To that end, Service is also responsible for the
coordination of development and implementation of Multi-annual national strategic plan for
aquaculture in collaboration with all the relevant stakeholders.
Within that Service two (2) units are established:
Unit for freshwater aquaculture;
Unit for mariculture.
Service for management of capture fisheries is responsible for the management of marine and
freshwater resources, including commercial and non-commercial fisheries.. The Service is responsible
for the maintenance of the Fishing fleet register and implements other measures related to fleet
management. Also, the Service is responsible for collecting and analysing data on the overall statistics
and economics of the entire fisheries sector.
Within that Service three (3) units are established:
Unit for marine capture fisheries;
Unit for freshwater capture fisheries;
Unit for Fishing fleet register, statistics and economics in fisheries.
Service for cooperation, state aid and market organization in fisheries is responsible for the
international and institutional cooperation, implementation of state aid and measures of market policy
in fisheries. It is responsible for proposing measures for the implementation of the common market
standards in fisheries and the collection and analysis of prices. Important element of work of the
Service relates to the activities regarding associations in fisheries, especially the associations such as
fisheries cooperatives and producer organizations. Also, the Service is responsible for the
establishment and enforcement of state aid in fisheries.
Within that Service two (2) units are established:
Unit for international, institutional and economic cooperation;
Unit for state aid and organization of market in fisheries.
Table 7. Sector for management, planning and development of fisheries - administrative capacities
Unit Foreseen number of
employees
Current number of
employees
Sector for management, planning and development of
fisheries
1 1
Service for aquaculture 1 1
Unit for freshwater aquaculture 5 1
Unit for mariculture 5 2
Service for management of capture fisheries 1 1
Unit for marine capture fisheries 15 15
Unit for freshwater capture fisheries 3 2+1”
Unit for Fishing fleet register, statistics and economics in
fisheries
7 6+1”
NATIONAL STRATEGIC PLAN
27
“ Employees employed for defined period of time
2.9.4. Sector for monitoring and control of fisheries
The main duties of the Sector for monitoring and control of fisheries are as follows:
organising and implementing inspection and control activities in accordance with the relevant
acts and subordinate legislation;
drafting the annual reports on the inspection activities (including compiling reports of other
authorised services for performing inspection activities in fisheries sector);
developing the inspection related operating procedures;
developing an inspection and control plan as well as a plan of necessary means for
implementation of the inspection activities;
organizing and implementing occupational trainings for the inspectors from other institutions
authorised for inspection activities in fisheries;
managing the Fisheries monitoring centre – managing and maintaining the satellite vessels
monitoring system; collecting, storing, updating and processing of all the data on fishing
vessels; communicating and exchanging data with other monitoring centres and the European
Commission;
development and coordination of the National Fisheries Data Collection Programme;
The sector is comprised of two (2) services:
Service for fisheries inspection;
Service for monitoring and geo information system in fisheries.
Service for fisheries inspection undertakes the inspection activities over the implementation of the acts
and subordinate legislation regulating fisheries and participates in the work of the Coordination body
for the control at sea. As well, this Service develops standard operating procedures for implementation
of inspection activities and it also drafts plans of inspection activities. In line with the acquis it
develops the plan of the necessary means for implementation of inspection and control activities.
Within this service four (4) units are established:
Unit Zagreb;
Unit Pula;
Unit Zadar;
Unit Split.
Service for monitoring and geo information system in fishery is responsible for geo information
system in fishery and functional FMC. FMC is responsible for the management and coordination of
satellite vessel monitoring system, communication with other fisheries monitoring centres and the
maintenance and improvement of the GIS. Also, this Service is responsible for implementation of the
National data collection programme.
Within this Service two (2) units are established:
Unit for monitoring centre;
Unit for geo information system in fisheries and information.
Service for cooperation, state aid and market
organization in fisheries
1 1
Unit for international, institutional and economic cooperation 6 3+1”
Unit for state aid and organization of market in fisheries 6 4
TOTAL 51 37+3”

NATIONAL STRATEGIC PLAN
28
Table 8. Sector for monitoring and control of fisheries - administrative capacities
Unit Foreseen number
of employees
Current
number of
employees
Sector for monitoring and control of fisheries 1 1
Service for fisheries inspection 1 1
Unit Zagreb; 11 8
Unit Pula 11 4+2“
Unit Zadar 8 4+2“
Unit Split 12 7+3“
Service for monitoring and geo information system
in fisheries
1 1
Unit for monitoring centre 5 1+1”
Unit for geo information system in fisheries and
information
5 1+1”
TOTAL 55 28+9”
“ Employees employed for defined period of time
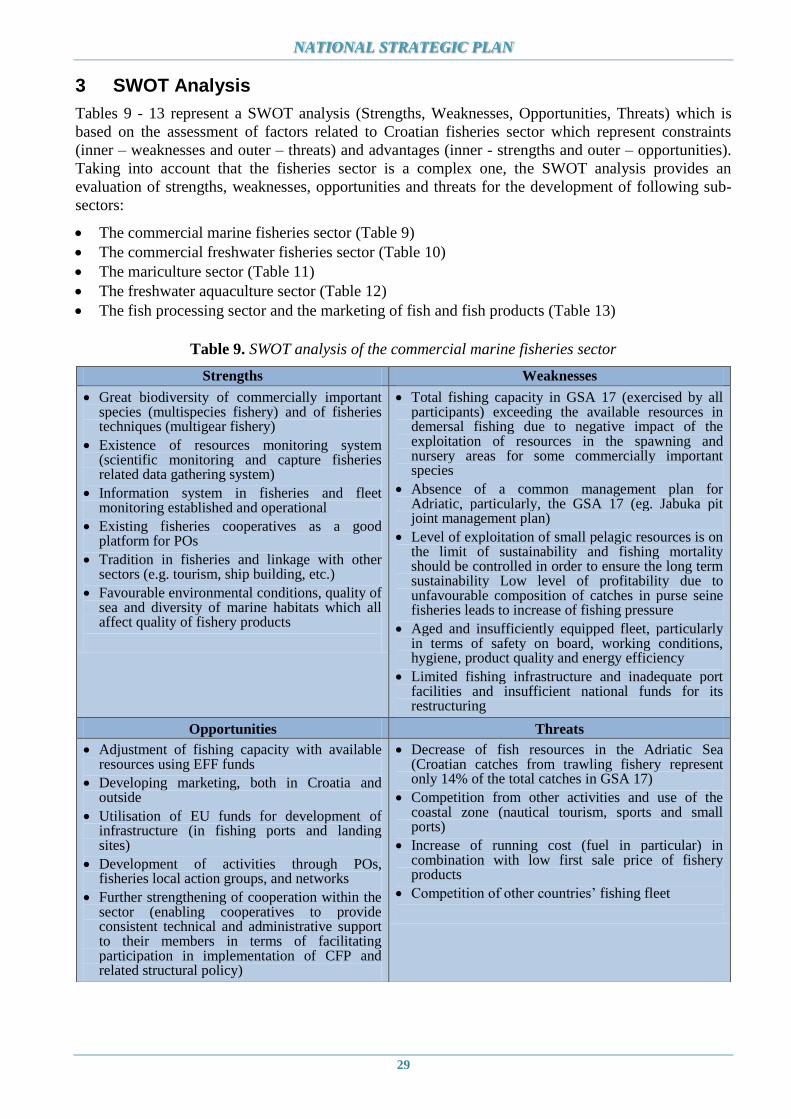
NATIONAL STRATEGIC PLAN
29
3 SWOT Analysis
Tables 9 - 13 represent a SWOT analysis (Strengths, Weaknesses, Opportunities, Threats) which is
based on the assessment of factors related to Croatian fisheries sector which represent constraints
(inner – weaknesses and outer – threats) and advantages (inner - strengths and outer – opportunities).
Taking into account that the fisheries sector is a complex one, the SWOT analysis provides an
evaluation of strengths, weaknesses, opportunities and threats for the development of following sub-
sectors:
The commercial marine fisheries sector (Table 9)
The commercial freshwater fisheries sector (Table 10)
The mariculture sector (Table 11)
The freshwater aquaculture sector (Table 12)
The fish processing sector and the marketing of fish and fish products (Table 13)
Table 9. SWOT analysis of the commercial marine fisheries sector
Strengths Weaknesses
Great biodiversity of commercially important species (multispecies fishery) and of fisheries techniques (multigear fishery)
Existence of resources monitoring system (scientific monitoring and capture fisheries related data gathering system)
Information system in fisheries and fleet monitoring established and operational
Existing fisheries cooperatives as a good platform for POs
Tradition in fisheries and linkage with other sectors (e.g. tourism, ship building, etc.)
Favourable environmental conditions, quality of sea and diversity of marine habitats which all affect quality of fishery products
Total fishing capacity in GSA 17 (exercised by all participants) exceeding the available resources in demersal fishing due to negative impact of the exploitation of resources in the spawning and nursery areas for some commercially important species
Absence of a common management plan for Adriatic, particularly, the GSA 17 (eg. Jabuka pit joint management plan)
Level of exploitation of small pelagic resources is on the limit of sustainability and fishing mortality should be controlled in order to ensure the long term sustainability Low level of profitability due to unfavourable composition of catches in purse seine fisheries leads to increase of fishing pressure
Aged and insufficiently equipped fleet, particularly in terms of safety on board, working conditions, hygiene, product quality and energy efficiency
Limited fishing infrastructure and inadequate port facilities and insufficient national funds for its restructuring
Opportunities Threats
Adjustment of fishing capacity with available resources using EFF funds
Developing marketing, both in Croatia and outside
Utilisation of EU funds for development of infrastructure (in fishing ports and landing sites)
Development of activities through POs, fisheries local action groups, and networks
Further strengthening of cooperation within the sector (enabling cooperatives to provide consistent technical and administrative support to their members in terms of facilitating participation in implementation of CFP and related structural policy)
Decrease of fish resources in the Adriatic Sea (Croatian catches from trawling fishery represent only 14% of the total catches in GSA 17)
Competition from other activities and use of the coastal zone (nautical tourism, sports and small ports)
Increase of running cost (fuel in particular) in combination with low first sale price of fishery products
Competition of other countries’ fishing fleet

NATIONAL STRATEGIC PLAN
30
Table 10. SWOT analysis of the commercial freshwater fisheries sector
Strength Weaknesses
Tradition of commercial fishing
Available freshwater resources for commercial fishing
Habitat diversity
Existence of domestic market
New trends in sports fishing, and sustainable approach
Limited knowledge on the capacity of the environment and the assessment of stocks
Lack of modern management measures in freshwater fisheries
Opportunities Threats
Contribution to the rural way of life
Development of fishing, especially in terms of enriching tourism and gastronomy
Rural development and rural tourism
Traditional, ecological, cultural and ethnological character
Conflict of interest between commercial and sports fishing
Conflict between the environmental protection, water management and fishery
Using of allochthonous species for ranching and translocation of species from one river system to the other

NATIONAL STRATEGIC PLAN
31
Table 11. SWOT analysis of the mariculture sector
Strength Weaknesses
Extremely favourable environmental conditions and sea water quality
Tradition in fish farming and cooperation between industry and science
Production of food of high nutritional value
All fish farms meet the environmental and nature protection standards
Information system in aquaculture established
Contribution to the development of islands by providing main or alternative source of income to sensitive island communities and contributing to decrease of depopulation trends noted on Croatian islands
Possibility of permanent supply of market with steady quantity and quality of products
Insufficient capacity of existing hatcheries
Poor diversification of species and products
Equipment, fish fry and fish feed import
Poorly developed coastal infrastructure
Unspecified minimum standards of product quality
Lack of long-term development strategy
Insufficient organisation within the sector
Lack of the marketing strategy
Insufficiently explored domestic market
Lack of cooperation with consumers
Opportunities Threats
Possibilities of professional staff education
Sufficient space for further development applying Integrated Coastal Zone Management (ICZM)
Production diversification through the production of new species and development of new products and technologies, and linkages with the processing sector
Development of organic and ecological fish farming
Availability of EU funds
New markets (including development of the domestic market)
Possibility to increase production of shellfish farming which is currently far below its natural potential
Applying quality management techniques
Promotion of high nutritional value of fish and shellfish
Low per capita consumption
Competitive conflicts in relation to space (especially with tourism)
Increasing cost of equipment and production
Tuna catch restrictions which results in decrease of tuna farming activities, causing negative socio economic effects
Damage done by predator species
Low selling prices
Rise of prices of inputs (fish feed, energy, etc)
Increased production costs due to the increasingly strict environmental, hygiene and safety requirements
Lack of institutions for business development and insufficient funding

NATIONAL STRATEGIC PLAN
32
Table 12. SWOT analysis of the freshwater aquaculture sector
Strengths Weaknesses
Extremely favourable environmental conditions and quality of water
Tradition in fish farming
Production of food of high nutritional value
Fish farms represent significant habitats and contribute to preservation of biodiversity
Possibility of permanent supply of market with steady quantity and quality of products
Information system in aquaculture established
Contribution to environmental protection and biodiversity conservation
Contribution to the development of rural areas and rural tourism, including fishing and aquaculture
Outdated fish farming technology
Poor diversification of species and products
Uneven quality and insufficient quantity of water available in certain periods of the production cycle
High fixed costs
Unspecified minimum standards of product quality
Lack of funding
Insufficiently explored domestic market
Unregistered small fishponds
Insufficient organisation within the sector
Opportunities Threats
Sufficient space for fish farming
Production of new species and development of new products and technologies, and linkages with the processing sector
Development of organic and ecological fish farming
Existence of domestic market
Possibilities of professional staff education
Availability of EU funds
Increase of production by introducing small ponds in the system resulting in rural area development through additional activities and total traceability over the final product
Introduction of quality management techniques
Promotion of high nutritional value of fish
Low per capita consumption
Quantity of available water
Disease transmission (farmed and wild resources, in both directions)
Increased predation
Increasingly strict environmental, hygiene and safety requirements
Degradation of environment and nature
Lack of institutions for business development and insufficient funding
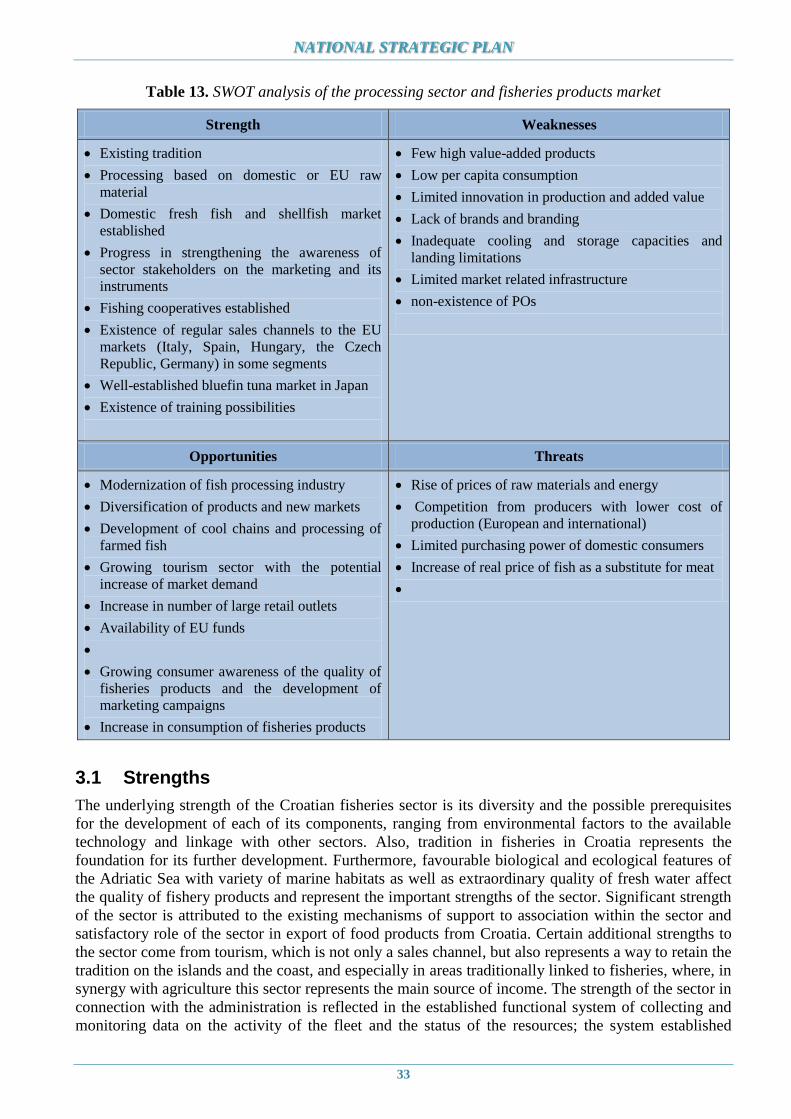
NATIONAL STRATEGIC PLAN
33
Table 13. SWOT analysis of the processing sector and fisheries products market
Strength Weaknesses
Existing tradition
Processing based on domestic or EU raw
material
Domestic fresh fish and shellfish market
established
Progress in strengthening the awareness of
sector stakeholders on the marketing and its
instruments
Fishing cooperatives established
Existence of regular sales channels to the EU
markets (Italy, Spain, Hungary, the Czech
Republic, Germany) in some segments
Well-established bluefin tuna market in Japan
Existence of training possibilities
Few high value-added products
Low per capita consumption
Limited innovation in production and added value
Lack of brands and branding
Inadequate cooling and storage capacities and
landing limitations
Limited market related infrastructure
non-existence of POs
Opportunities Threats
Modernization of fish processing industry
Diversification of products and new markets
Development of cool chains and processing of
farmed fish
Growing tourism sector with the potential
increase of market demand
Increase in number of large retail outlets
Availability of EU funds
Growing consumer awareness of the quality of
fisheries products and the development of
marketing campaigns
Increase in consumption of fisheries products
Rise of prices of raw materials and energy
Competition from producers with lower cost of
production (European and international)
Limited purchasing power of domestic consumers
Increase of real price of fish as a substitute for meat
3.1 Strengths
The underlying strength of the Croatian fisheries sector is its diversity and the possible prerequisites
for the development of each of its components, ranging from environmental factors to the available
technology and linkage with other sectors. Also, tradition in fisheries in Croatia represents the
foundation for its further development. Furthermore, favourable biological and ecological features of
the Adriatic Sea with variety of marine habitats as well as extraordinary quality of fresh water affect
the quality of fishery products and represent the important strengths of the sector. Significant strength
of the sector is attributed to the existing mechanisms of support to association within the sector and
satisfactory role of the sector in export of food products from Croatia. Certain additional strengths to
the sector come from tourism, which is not only a sales channel, but also represents a way to retain the
tradition on the islands and the coast, and especially in areas traditionally linked to fisheries, where, in
synergy with agriculture this sector represents the main source of income. The strength of the sector in
connection with the administration is reflected in the established functional system of collecting and
monitoring data on the activity of the fleet and the status of the resources; the system established
NATIONAL STRATEGIC PLAN
34
enables surveillance, control and management of fleet and resources and guarantees the traceability
from catch to the first sale. Special strength of the sector lies within the aquaculture segment that
stands out as the only alternative to fishing in the long-term planning of the fisheries sector, able to
provide the market with steady quantity and quality of food of high nutritional value. Also, it is
important to note that farming in Croatia complies with all standards related to environmental
protection and conservation, where particular significance is given to fish ponds which represent an
international natural value and as such provide important habitats for migrating bird species.
Processing industry relying on fish and other aquatic organisms is developed and has a long tradition,
and in recent years new production lines have been developed. Market channels for fishery products
are well developed on national and international level. Existing cooperatives provide a solid basis for
increasing the overall profitability of the sector in the catching segment Furthermore, increased
awareness of sector stakeholders on the market mechanisms guarantees the successful continuation of
market organization.
3.2 Weaknesses
The most significant weakness of the fisheries sector is the inadequate manner of placing of products
on the market, mainly due to the fragmentation of production that prevents the concentration of the
supply. The weakness jeopardising further development of the sector also includes insufficiently
developed land logistics and infrastructure, given that in the coastal area there is a strong competition
for coastal infrastructure between existing and potential users. This is particularly significant in
relation to marine commercial fishing where a general lack of coastal logistics and infrastructure
reduces not only the efficiency of inspection and control, but also the quality of the product, which
will adversely affect the price of products from capture fisheries. Inadequate sector involvement in
issues related to maritime strategy can result in marginalization at the county level. Furthermore, there
is a lack of market related infrastructure and the trade channels in fisheries do not include auctions
which results with low prices for primary producers. Increased fishing effort has been noted in the
segment of trawl fisheries. Fishing capacity of demersal trawl fleet in GSA 17 and available resources
are not in balance, and the overexploitation of spawning and nursery grounds adversely affects the
status of the resources. The share of Croatian catches in total demersal catches in GSA 17 represents
only 14%, which hampers management measures given the relatively small participation in total
catches.. Level of exploitation of small pelagic resources is at the limit of sustainability, and fishing
mortality needs to be controlled (decreased or kept at present levels, depending on the fluctuations in
population structures) in order to secure the long term sustainability. Furthermore, the existing fishing
fleet is aged and poorly equipped and does not provide for sufficient level of product quality, energy
efficiency, working and safety conditions on board. As for the aquaculture segment, hatchery
capacities are not sufficient for neither marine nor freshwater farming. Imports of fry may adversely
impact the development of genetic potential of farmed brood-stocks, which may present a guarantee
of future quality and provide possibilities for branding. Furthermore, available marine and aquatic
areas are not used for marine and freshwater fish farming, and there is a lack of storage capacity for
the catch and processing.
Lack of diversification of production, adding value and branding are considered significant
weaknesses in in all segments. The insufficiently explored domestic market and lack of long-term
development and marketing strategies in the field of aquaculture and mariculture as well as inadequate
cooperation with consumers and organisation within the sector also represent a weakness.
3.3 Opportunities
Availability of the EU funds represents a significant source of financial support and enables a
systematic approach to solution of numerous issues, and in particular those related to management of
fleet capacity in certain segments. In addition, the availability of EU funds represents an opportunity

NATIONAL STRATEGIC PLAN
35
for Croatia to develop the infrastructure (fishing port and landing sites) which is necessary particularly
for commercial marine fisheries, as well as for the elements of control and monitoring. Development
opportunities exist for the sector through the development of marketing, adoption of new
technologies, new product development and diversification Given the rising awareness of consumers
at the EU level of the quality and value of fisheries and aquaculture products, and the existence of a
rising number of marketing campaigns (including labelling) the sector can – using its existing
potentials – have an opportunity for a development of high-value end products targeting highly
demanding niche markets. By development of ports and land infrastructure using EU funds the sector
has the opportunity to develop in terms of supply consolidation (cooperatives and producer
organizations), which can directly affect the supply and demand, through possibilities of storage as
well. . Further strengthening of fisheries cooperatives, particularly those able to outgrow into POs,
along with establishing FLAGs and networks, shall facilitate consolidation of the sector and contribute
to the increase its operational performance. Opportunities in the field of aquaculture are based on
diversification of production and linking the aquaculture segment with processing industry. Indented
coastline and proximity to markets provide the possibility for competitive development of mariculture.
Introducing a system of recognition and special labels in all segments (catching, processing, farming)
and involvement in the international eco-labelling systems provide an additional opportunity for
development of the activity.
A particularly significant opportunity lies in excellent possibilities for further development of
aquaculture, both marine and freshwater, as a backbone for development of the entire sector, for
which Croatia has the capacity.
Significant potential for branding of fishery products as well as for development of tourist and
recreational activities related to preservation of biodiversity, can be found in freshwater fish farms
which are making a part of the EU NATURA 2000 ecological network.
3.4 Threats
Croatian fisheries as a whole rely heavily on pelagic species catch (quantity, number of participants),
so changes in this segment can lead to significant social and economic problems. Inability to control
and protect the most important nursery and spawning areas in the Adriatic (Jabuka Pit) can
consequently lead to negative changes in overall sustainability and profitability of the sector. The
existing threat of growing competition for the limited coastal area between different actors
(particularly conflicts with nautical tourism for port infrastructure) could be mitigated by applying
careful and systematic approach to spatial planning. Further increase in costs, primarily fuel, in
combination with low selling prices, could lead to a crisis similar to that which befell the sector 2008.
Realistic threat to further development of the sector represent increasingly strict environmental,
hygiene and safety requirements which, combined with higher production costs can jeopardise the
very survival of the sector.

NATIONAL STRATEGIC PLAN
36
4 PRIORITIES AND OBJECTIVES
The main objective of the strategic plan for the period 2013 to 2020 can be formulated as: To achieve
a competitive, modern and dynamic fisheries and aquaculture sector through sustainable
exploitation of resources.
The main objective of this NSP, albeit its short implementation, is planned to be reached by way of
implementing measures based on this strategic document (short term priorities) as well as by
implementation of measures to be included in strategic documents covering the following
programming period for which this document only provides a general outlines.
4.1 Short-term priorities and objectives
SOURCE OF FUNDING: Public support - EFF, national funds (funds from the State Budget of the
Republic of Croatia, budget of regional and local government authorities, where applicable) and the
IPARD programme (Instrument for pre-accession assistance for rural development) related to
investments in processing facilities.
SUPPORT MODEL: Structural support under the Operational Programme for 2013 with a period of
implementation till the end of 2015, IPARD Programme (till 2015) and state aid measures.
Given that the programme covers the period from the date of accession until 31 December 2013 (with
implementation by 31 December 2015), it is envisaged that in the limited period, Croatia will use the
funds from the EFF along with the national co-funding for the following priorities and objectives:
1. Axis 1: Adjustment of fishing fleet
OBJECTIVE
Establishing a sustainable balance between fishing capacity and available
resources
2. Axis 2: Sustainable development of aquaculture
OBJECTIVE
Increase of production and strengthening the competitiveness of the
aquaculture
3. Axis 2: Sustainable development of processing and marketing
OBJECTIVE
Strengthening the capacities of processing and marketing
4. Axis 5: Strengthening of fisheries administration and the sector for using structural
support through Technical Assistance
OBJECTIVE
Improvement of administration capacities and stakeholders’ awareness
4.1.1 OBJECTIVE: Establishing a sustainable balance between fishing capacity and available resources
Management of fisheries in the Mediterranean is significantly different from the management in the
Atlantic and North Sea, as due to the diversity of fishing activities and catches, fishing quotas do not
apply (except for Atlantic bluefin tuna). Scientific assessments of the status of stocks indicate the need
for regulation of total fishing effort with the aim of decreasing the fishing mortality or ensuring its
long term balance with the status of the biological resources.
General recommendations on the level of GSA 17 are to decrease or at least to maintain the current
level of fishing effort or fishing mortality. As Croatia shares resources in GSA 17 with other countries
around the basin, it recognises it recognises the need to participate in the restriction of the fishing
NATIONAL STRATEGIC PLAN
37
effort proportionally to state of resources in part of the fishing sea for which it holds exclusive
responsibility. Furthermore, to the extent possible, Croatia intends to contribute to an overall decrease
of fishing mortality or maintaining it at levels which could provide the maximum sustainable yield, in
areas outside its territorial sea, where its vessels operate alongside other participants in the Adriatic.
To ensure the level of sustainability in capture fisheries and reduce the impact on the environment, the
capacity of the fleet should be aligned with long-term opportunities and availability of resources.
Croatia will continue to monitor the balance between its fishing capacity and the status of the
resources and, if necessary, undertake appropriate interventions.
Measure: Permanent cessation of fishing activities
Over the past years, a decrease of catch per unit effort in trawl fishery was noted. On the other hand,
in pelagic fishery (targeting small pelagics) indicators show that the structure of catches over the past
years does not result in sufficient level of profitability (small landing sizes). These indicators suggest
that in these types of fishing there is a need to consider the possibility of additional regulation of
fishing effort in order to ensure long-term sustainability of stocks and ecosystems.
Over the past years in the entire Adriatic, as well as in Croatian territorial waters, a decrease of the
biomass index for large number of demersal species has been noted along with the decrease of
quantity of catches of commercially important species. Unfavourable conditions of demersal resources
are the result of the high intensity of exploitation in connection with the unfavourable hydrographical
conditions. Spawning and nursery areas are considered particularly sensitive areas for exploitation.
Exploitation of these areas results in decreased recruitment and consequently lower biomass of
targeted resources in trawl fisheries. One of such areas is Jabuka pit and its exploitation negatively
affects the state of the resources in the entire Adriatic.
The largest number of commercially important species in Adriatic are biologically shared stocks
which are exploited by fleets of different countries with different intensity. As Croatian fishing effort
in trawl fishery contributes with share of 14% in the total fishing effort exercised in GSA 17, it is not
expected that only measures undertaken by Croatia would have positive effect on stocks, particularly
due to the migration of species and the effect of diffusion of stocks from the area of higher density
(low fishing effort) to area of low density (high fishing effort). General assessment of status of
demersal resources in GSA 17 shows that the status of stocks is better in Croatian territorial waters
then in the rest of the GSA 17. However, the status of the stocks is not equal in all fishing zones
within the territorial waters, which is why it is estimated that the measure of decreasing the fishing
effort should be applied to those areas where the scientific indicators suggest the urgent need for
implementation of such measures, or where the status of the stocks is less favourable then in the rest
of the fishing sea.
Considering the general status of the resources in GSA 17, it is possible to contribute to the overall
fishing effort reduction by way of implementing the measure of permanent cessation of fishing
activity.
Regarding the small pelagic fishery, Croatia mainly targets stocks of sardine and anchovy. Pelagic
fishery in Croatia is at the moment regulated by the set of technical measures (characteristics of the
gear, light limitations, closed seasons), while additional element limiting the fishing effort is the lunar
cycle, which dictates the fishing dynamics and limits the maximum amount of fishing days per year.
The scientific indicators of the biomass demonstrate that the fishing mortality is on the very limit of
the F-MSY which is a positive sign. However, in order to secure the long term sustainability of stocks
and maintain these values, it is considered necessary to apply additional measures of fishing effort
control. In addition, a management plan for small pelagic resources in GSA 17 and GSA 18 was
adopted in May 2013 on the level of the GFCM. It is considered that a contribution to achievement of
the goals set by this management plans could be made by way of implementing measures foreseen by
this document.
NATIONAL STRATEGIC PLAN
38
.In addition to the status of the resources, the current economic performance of the fishermen involved
in this type of fishery is at the very edge of a cost-effectiveness balance. The unfavourable structure of
the catches has a negative effect on their prices and it does not allow for optimal utilisation of the
resource from the socio-economic aspect. To this end, additional effort control measures shall
contribute to lower competition on the fishing grounds which would result with the possibility to
search for a more economically valuable catch. The increase of the cost benefit ratio of the vessel
could provide for possibility to implement the additional measures for conservation of stocks without
jeopardising the survival of the activity. The pelagic fishery targeting small pelagic resources has a
prominent socio-economic significance and is therefore very important for the sustainability of rural
areas and delicate island communities
Measure: Temporary cessation of fishing activities
The EU acquis provides mechanisms of temporary cessation of fishing activities in situations where
such measures are necessary due to sudden fluctuations in the state of stocks. These situations can be
caused by environmental factors, which are not directly dependent on fishing activities, and can occur
relatively rapidly. Temporary suspension of fishing is not considered a regular closed season on
permanent basis. Management plans for specific fishing fleet segments, foresee triggering of
temporary cessation mechanism in case of evident overcapacity or need for decrease of fishing
activities due to bad conditions of stocks.
4.1.2 OBJECTIVE: Increase of Production and Strengthening the Competitiveness of Aquaculture
The main objective of investing in the development of the aquaculture sector is the modernisation of
the existing aquaculture facilities in both segments – mariculture and freshwater aquaculture so as to
achieve the increase of production capacity.
Croatia will provide support for the development of the aquaculture sector within the short-term
objective, and it is expected that the development of aquaculture shall form an important element of
the programming in the period from 2014 to 2020.
Increase of production and strengthening of competitiveness is planned in segments of marine fin fish
production, shellfish farming and freshwater fish farming. All mentioned segments have potential for
further development, including the availability of suitable locations, market, knowledge and
experience.
Measure: Productive investments in aquaculture
Fish farming is a constantly growing activity. In order to continue the trend and achieve the level of
competitiveness in aquaculture, it is necessary to secure modernization of existing farms and
hatcheries.
Bearing in mind that aquaculture production at national level accounts for only 20% of the total
fisheries production, as well as the need for further restrictions of fisheries for the purpose of
conservation of living marine resources, the development of aquaculture is extremely important to
meet market demand for fish and other fishery products.
Croatia recognises potential of domestic market for aquaculture products, which is still unexplored
and unutilised. In addition, the fact that farming ensures continuous control over quantity, quality and
continuity of production provides the possibility of sustainable development of fish processing based
on aquaculture. By implementing this measure, Croatia plans to take advantages such as availability of
adequate locations, favourable geographic and climatic conditions, as well as high-quality and long
tradition of marine and freshwater farming, and encourage further development of aquaculture
activities.

NATIONAL STRATEGIC PLAN
39
One of the preoconditions necessary for achieving the strategic objective is to improve the
diversification of production. Croatia recognizes the need to expand the product range by developing
new species and new products originating from aquaculture.existence of a wider spectrum of products
may create better marketing possibilities, primarily on the level of the single EU market. The
introduction of new species hereby implies farming of species that are not represented in significant
quantities or have not been introduced in the farming practices at the moment. In terms of production
capacities, the potential of domestic market is recognized, as well as the possibilities of linking with
the processing sector. In order to make the link with the processing sector truly viable, it is important
to increase the production quantities. Systematic investment in diversification and modernization of
enterprises should provide for reduction of business risk due to possible further decline in fish prices
of the most common aquaculture products in the European market (the situation as was recorded in
2009). Due attention will be paid to increase the capacity of hatcheries in order to develop the
genetically autochtonous and pure lines, as well as to reduce the need for imports which will result in
a significant reduction of risk of diseases and better control over the entire farming process.
Shellfish farming in Croatia has stagnated and even recorded a decline in production. It is mainly a
result of EU import restrictions prior to accession, as well as of the specific traditional farming
technology. Increase of production and enhancing competitiveness in this segment could be obtained
by modernisation of farms through applying modern technology for intensive farming, while also
maintaining the traditional way of farming on small farms in certain areas. The traditional way of
shellfish farming implies fragmented production, which hampers the competitiveness on the market,
and it requires public aid for maintaining viability. Additional preconditions for reaching the goals set
imply establishing shellfish hatcheries in order to provide a permanent source of good quality fry of a
controlled origin.
After a period of stagnation, production of freshwater species has recorded a slight positive trend over
the recent years. One of the basic conditions for achieving further increase of production is investment
in equipment and modernization of existing farms, and the development of additional capacity of
hatcheries. This measure also provides possibility for the equipping of existing facilities and existing
infrastructure, which would enable the intensification of production and the creation of high-quality
and competitive products on the market, at the same time meeting the requirements related to the
protection of the environment and nature.
An important element of this measure is the investment in the segment of research, development and
innovation, which will focus on all aspects of this activity that include sustainable production,
environmental protection, disease control, product quality and animal welfare.
By implementation of this measure, Croatia will seek to provide support primarily to micro, small and
medium enterprises in those initiatives that they cannot carry out themselves.
Measure: Measures of investment in environmental protection
Achieving compliance with the high standards of protection of the environment and nature is a
challenge but also an opportunity. To that end, Croatia will support activities focused on the adoption
and implementation of those practices that take into consideration the criteria of environmental and
nature protection and sustainable development, especially those activities that have a positive
environmental impact as waste reduction, efficient use of resources, restocking, introduction of
environmental certification audit (ISO 14001, EMAS), etc. The measure's content also includes the
provision of compensation for damage done by predators in cases where this is impossible to avoid
due to strict regulations on the protection of nature. This particular measure concerning compensation
for damage done by predators, Croatia will continue to implement as an existing state aid.

NATIONAL STRATEGIC PLAN
40
4.1.3 OBJECTIVE: Improvement of Administration capacities and stakeholder´s awareness
Croatia has recognized the importance of establishing a system for management and control of the
Operational programme in fisheries, as well as the possible difficulties that need to be identified in a
timely manner in order to enable the entire Programme to be implemented appropriately.
On the other hand, the readiness of beneficiaries to respond to calls for proposals and qualify for the
investment support under the Operational Programme in fisheries for 2013 is also extremely
important.
In the framework of the technical assistance measures, Croatia plans to use funds from the EFF to
support the management and control of the implementation of the OP in fisheries. This shall be done
mainly by supporting training of employees who work within the system, evaluation of programmes,
dissemination of information and networking, maintenance and development of computer systems
supporting the implementation of EFF. Technical assistance will also be used for the preparatory
activities aiming at preparation for the implementation of the EMFF, including activities related to
establishment of the concept of local action groups in fisheries by supporting the networking and
exchange of knowledge and experience at interregional and international level.
Croatia recognises the need to implement a campaign aiming at informing the stakeholders on
possible measures, as well as on the rules of their implementation, which is considered an important
element in successful implementation of the OP Croatia plans to implement promotion activities
directed to wider public in order to raise awareness on the Union contribution to the fisheries sector.
4.1.4 OBJECTIVE: Strengthening the Processing and Market Capacities
Strengthening the processing capacities results in adding value to the primary product and in better
economic performance of the entire sector. In addition, available data indicate that the market is
saturated with certain species and products. Therefore it is necessary to diversify the production
Measure: Investing in productive capacity
In order to provide for a competitive sector of processing and marketing of fishery products,
significant structural changes are necessary, starting with ensuring adequate cooling and storage
facilities as well as the construction and equipping of processing facilities that will demonstrate high
environmental standards. The objective of this measure is to facilitate the development of processing
industries in a way to recognize the long-term sustainable production processes associated with
sustainable primary production, and those products that will ensure the best possible market value. At
the same time, the implementation of this measure should contribute to stable employment within the
sector. This measure is planned to be implemented in the short-term period under the IPARD
Programme. Investments in processing industry shall be supported from 2014 to 2020 as well,
according to the relevant acquis.
4.2 Long-term Objectives (Projection)
By joining the EU, Croatia became a part of a large single market for fishery products, where it yet
has to take up its position. This is an extraordinary opportunity for Croatia, but also a great challenge.
In the context of positioning on the European common market, Croatia will be guided by the general
strategic guidelines defined by a comprehensive Europe 2020 Strategy and in accordance with the
provisions of the new CFP reform package.

NATIONAL STRATEGIC PLAN
41
In this sense, Croatia plans the interventions in the form of structural aid to all segments of fisheries in
line with the acquis concerning the structural support in fisheries within the period 2014-20206.
In addition to the structural support to the sector itself, Croatia shall take into account the needs for
funding of the future framework for co-financing of measures related to the implementation of the
CFP, such as data collection and inspection and control, in accordance with the relevant annual
programs of the EU. The new element in the reform package and in the new programing period is the
Integrated maritime policy, which shall be co-financed from the EMFF.
The key elements of the CFP reform include the discard ban and reaching of the MSY. The reform
underlines the new role of aquaculture, and provides for new elements in common organization of the
markets. Although at the time of drafting of this document the final agreement on the measures to be
funded by the EMFF has not yet been reached, Croatia – as a strategic goal – plans usage of future
measures with the aim of implementation and reaching the goals of the CFP.
The most important element in the reform is the discard ban. In the Mediterranean this issue is not the
same as the one in other seas where EU fleets operate, particularly since the Mediterranean fisheries
are not regulated by the quota system. The discard ban shall be implemented gradually, and in the
Mediterranean only on species with minimum sizes. Currently available data indicate that the
discarding is negligible in the small pelagic fishery, while the demersal fisheries are not sufficiently
covered by relevant information and no clear indications are available as of yet. Croatia plans to use
the funds, within different measures, in order to direct the sector towards reaching maximum
selectivity while retaining economical viability (storage capacities, selective gears, less harmful
techniques, inspection and control). The goal of these measures is to achieve the gradual
implementation of the discard ban in accordance with the acquis, aiming at reaching the level foreseen
by CFP (2019. for species for which minimum sizes are set).
Through implementation of fleet measures, whereby Croatia considers that retaining temporary and
permanent cessation is one of the key elements, and implementation of measures aimed at achieving
higher selectivity as well as measures of designation of specially regulated areas, Croatia intends to
reach the goals of the CFP in the forthcoming period. Through these measures, it is envisaged that the
MSY shall be achieved for key stocks and for those that are considered critical. However, reaching of
this goal needs to be seen through the particularities of Adriatic and the Mediterranean, which are
characterized by multi-gear and multi-species fisheries. Under such conditions, measures to be
implemented in the forthcoming period shall need to be adjusted in accordance with the scientific
advice and management mechanisms, and particular attention shall have to be given to the models of
determination of the MSY in the mixed fisheries conditions, which – for the time being – do not exist
and are not applied at the level of the EU.
As far as aquaculture goes, Croatia plans to fully follow the guidelines prepared by the EC, which are
contained in the Communication and the CFP itself. Financing measures shall be directed towards
strengthening of the capacities and offer in production, and aquaculture shall be included in the
relevant segments of the IMP:
4.2.1 Commercial Fisheries
The main objective will be to continue activities aimed at improving competitiveness and economic
efficiency of the sector keeping in mind as a primary goal the sustainable resource management.
Furthermore, the goal shall be to reach the MSY (in accordance with the scientific advice) and
implementation of the discard ban.
6 Currently in adoption - Regulation of the European Parliament and of the Council on the European Maritime and Fisheries
Fund, and repealing the Council Regulation (EC) No 1198/2006 on the European Fisheries Fund and the Council
Regulation (EC) No 861/2006 and Council Regulation No XXX/2011 on integrated maritime policy

NATIONAL STRATEGIC PLAN
42
In addition to the above, Croatia aims to increase competitiveness and improve economic efficiency of
fishing activities, also by way of promotion of innovation and entrepreneurship.
During the analysis of the current state of fisheries sector one of the weak points was proved to be the
weak administrative capacity of adequate advisory services which is where Croatia will invest efforts
as well as to connections with the scientific community. An important element in the conservation of
human resources in the sector is to facilitate diversification of activities linked to the basic activity -
fishing so as to provide for modernisation of fishing vessels, and appropriate training programmes for
diversification of activities and providing extra income. In addition to the above mentioned, where a
need for withdrawal from the fishing fleet occurs, Croatia will direct due attention to provide for
complete diversification of activities outside fishing which finally will have as a goal protection of the
very resource.
One of the basic prerequisites for the development and the achievement of competitiveness of the
national fisheries sector at regional and European level is the sufficiently developed port infrastructure
that provides the sufficient capacity for fishing vessels and equipped landing sites with different
facilities. Croatia recognizes the need for investments in port infrastructure as one of the key elements
for positioning the national sector in relation to other EU countries, and in order to secure full
implementation of the CFP.
4.2.2 Aquaculture
In 2014-2020 a multiannual national strategic plan for the development of aquaculture will represent a
fundamental document for the development of this activity.
Croatia sees the opportunity for further growth and development of its aquaculture in the growing
market demand for high quality fish and other fisheries products as well as in excellent prerequisites
in terms of spatial and climatic conditions. The same applies to freshwater and marine aquaculture.
Croatia has many quality sites for fish farming, both at sea and on land, particularly in terms of
environmental standards, which creates a good foundation for the development of the entire industry.
Basic challenge for further development of this industry in Croatia is the placement of this activity
within the coastal area, and the fact that national production is not competitive. One of the priorities
will be, inter alia, improving the system of spatial planning especially in terms of integrated coastal
zone management in the context of which the aquaculture will be appropriately positioned in an area
where there is great competition between different activities, taking into account not only the locations
of the maritime area, but also the provision of sufficient space on land so as to accommodate the
necessary infrastructure.
The importance of investing in this activity is recognised, as well as the need to ensure the conditions
for increasing of competitiveness of this activity on the domestic market, on the European market as
well as on the markets of third countries. Consequently, it is planned to establish new as well as to
develop the existing aquaculture farms. With regards to the investments in existing farms, there is a
need to introduce the innovative technologies and development of new products as well as innovative
approaches in management and production-related processes. An important component of the planned
development of aquaculture will be introduction of new species, diversification of product range, but
also the diversification of revenue and adding value to primary products which is particularly
interesting from the aspect of linking aquaculture as a primary production to processing.
Investing in human capital is also recognized as vital for raising the level of competitiveness and
economic efficiency of aquaculture as well as related implementation of life-long learning
programmes and networking, thus stimulating the exchange of knowledge and the development of
advisory services aimed at improving the overall efficiency and competitiveness of entrepreneurs.
NATIONAL STRATEGIC PLAN
43
The public support shall be used to promote environmentally sustainable aquaculture and support
activities that take into account the requirements of environmental protection and preservation,
business orientation towards eco-management and commitment to organic aquaculture.
4.2.3 Fisheries areas
Although the fisheries sector accounts for a small share of the national economy, individual local
communities depend largely on this sector. Consequently, Croatia will seek to concentrate resources
(financial and human) in these areas in order to preserve the existing economic activities and potential
multiple economic effects.
Fisheries sector is recognised as a significant source of income in the coastal areas and on islands. A
synergy with other important economic sectors such as tourism and agriculture can easily be
established and maintained by way of creating FLAGs which would ensure a diversification of
activities and contribution to maintenance or even increase of employment. This could
correspondingly contribute to maintaining the local population on islands which are considered to be
particularly vulnerable. Another aspect of such an approach represents a contribution to preservation
of traditional and cultural heritage of the local communities. Adding value to primary products
through development of the local brands is also one of the interesting features which could be
implemented through FLAGs which could surely facilitate strengthening of the position of the
fisheries sector on the local, national and even international market. In addition, FLAGS are
considered as a good platform for cooperation and communication in the fisheries sector both, within
the borders and outside. To that end Croatia finds important to focus on the following priorities in the
next programming period:
maintenance or increase of employment through creation of synergy with other economic
sectors (tourism) and diversification of activities;
adding value to local primary products and development of marketing through creating local
brands;
facilitating co-operation and communication within the fisheries sector;
improvement of quality of life in coastal areas.
Given that no FLAGs were established thus far, Croatia will face the challenge of setting them up in
the new programming period.
Croatia plans to connect the local development initiatives in fisheries planning with local development
initiatives in rural development, thus utilizing their previous experience in the LEADER approach and
creating the core in the form of existing local action groups recognized according to criteria used in
the recognition of LAGs.
4.2.4 Marketing and Processing
With the aim of increasing the consumption of fish and other fishery products, incentives aiming at
better information are planned by strengthening of various distribution channels, supporting the
marketing of products, especially from local fishing and aquaculture. Croatia will aim to improve the
transparency of the market and its functioning, production and sales of new products, conducting
promotional campaigns in order to increase the consumption of fisheries and aquaculture products at
the national, regional and transnational levels, promotion of products that have a low impact on the
environment, promotion of products bearing geographical indications and designations of origin,
conducting market studies, improving the transparency of production and marketing, improving
market supply and the development and promotion of new markets.
One of the strategic priorities is related to the modernisation of the processing of fish and fishery
products in Croatia. This will contribute to producers, consumers, employment and income from

NATIONAL STRATEGIC PLAN
44
export. Measures will be taken to promote the health and hygienic conditions throughout the
distribution chain and the emphasis will be put on the accreditation schemes for the implementation of
quality standards.
The objective is to enable the development of processing industries in a way to recognize the long-
term sustainable production processes, associated with sustainable primary production, and those
products that will bring the best possible market value.
Croatia shall support the setup and functioning of POs, allowing for the implementation of relevant
measures as foreseen under the CFP.
4.2.5 System for Control and Implementation of the Common Fisheries Policy
The reform of the CFP places a new emphasis on the importance of inspection and control measures,
as well as data collection. Croatia has already established the key and necessary mechanisms and
structures, and in the area of inspection and control and data collection, it has already benefited from
the positive assessment by the EC on co-financing of its national programmes in 2013. The OP for the
new programing period shall include data collection as well as inspection and control measures, in
accordance with the decisions on priorities to be adopted at the level of the EU. Given the importance
of these measures in support and implementation of the CFP, Croatia shall secure an adequate
framework which shall guarantee continuity and possibility of funding of relevant activities. Key
priorities in terms of data collection are linked with socio-economic data as well as with the
cooperation of Croatia with other MS bodies and the EC in preparation of adequate scientific models
for mixed socks and fisheries, In terms of inspection and control, specific attention shall be given to
the issues related to the implementation of the discard ban, as well as the control of IUU issues in
general. Measures to be financed shall depend on the annual priorities adopted at the level of the EU.
4.2.6 Technical assistance
In order to adapt to the new requirements of the EMFF, there is a need for further reinforcement of
administrative capacity. Activities shall include inter alia training of staff involved in the management
of future fund, conducting studies and evaluations on the implementation of EMFF, all aimed at
facilitating the implementation of the OP for the EMFF. Particular attention shall be paid to further
development of IT support. These activities, as well as those linked with the preparation, management,
monitoring, evaluation, promotion, control and revision of the OP shall be implemented through the
technical assistance
Furthermore, in order to increase accessibility and transparency of information on the implementation
of the OP and in order to secure that potential beneficiaries have all the relevant information on
contribution and possibilities offered by the EMFF, Croatia plans to include activities of information
and advertising in the technical assistance as well.
Croatia recognizes the need to include the measure and use the funds for formation of the national
network in order to disseminate the information, strengthen the capacities, exchange the best practices
and provide support to the FLAGs.
Implementation of the technical assistance shall result in overall increase in administrative capacities
and shall strive to contribute to simplicity and efficiency of the management and control system of the
OP.

NATIONAL STRATEGIC PLAN
45
5 FUNDS REQUIRED FOR REALISATION
The financial means required for the implementation include the funds from the Budget of the
Republic of Croatia and the EU funds.
5.1 Financial resources for implementation of the Strategy for 2013 (EURO)
Priority Share
(%)
Total public
(EUR)
EFF
Contribution
(EUR)
National
Contribution
(EUR)
EFF
co-financing rate
(%)
a = b + c b c d = (b/a) x 100
Axis 1 51.81 6,010,000 4,507,500 1,502,500 75
Axis 2 43.19 5,010,000 3,757,500 1,252,500 75
Axis 5 5.00 580,000 435,000 145,000 75
TOTAL 100 11,600,000 8,700,000 2,900,000 75

NATIONAL STRATEGIC PLAN
46
6 DEVELOPMENT, IMPLEMENTATION AND MONITORING OF THE NSP
6.1 Development of the NSP
The NSP has been prepared in line with the requirements of the EFF Regulation and the overall
provisions and goals of the EU Common Fisheries Policy. Its preparation and definition of priorities
and objectives follow the completion of a fisheries and aquaculture sector study undertaken during
2008, as well as results of other studies undertaken over the period 2005-2008.
The preparation of the NSP began in October 2008. In 2009 and 2010, surveys were prepared and,
opinion of stakeholders on priorities and objectives, as well as on necessary resources were gathered.
In process of defining the priorities and goals, sector stakeholder were represented by chambers (CCE
and CCTC), fishermen guild, fisheries cooperatives and associations, while other participants included
representatives of relevant state authorities in charge of maritime affairs and infrastructure,
environmental and nature protection, construction and spatial planning, regional development,
economy and finances, as well as representatives of advisory service in charge for fisheries, scientific
institutions and fisheries administration. Taking into account inputs provided by different participants
gathered throughout the described process, fisheries administration has made a draft proposal of the
priorities and goals as well as the proposal of the NSP. In addition, guidelines on the management in
the fisheries were provided in the course of preparation of the legal framework and the consultation
process on the final draft of the document was initiated.
Counselling and evaluation were conducted in the form of workshops attended by the sector
stakeholders and their representatives, as well as representatives of institutions involved in the
fisheries and the related sectors and organizations of the civil society. Upon finalisation of the draft
NSP, another round of consultations with the sector stakeholders was initiated. During this phase the
participants have expressed their comments and proposals which were duly taken into account during
the development of the final draft of the NSP. The mentioned workshops were held in Pula, Rijeka,
Zadar and Split, while the draft NSP was also presented and discussed within the framework of the
Annual meeting of fishermen organised by CCTC as well as within the Council of the fisheries
association at the CCE.
6.2 Implementation and monitoring of the NSP
The adequate implementation and monitoring of the NSP and Operational Programme shall be
ensured by designation of responsible bodies, defining their tasks and development of indicators for
the monitoring.
6.2.1 Competent Bodies
The Government of the Republic of Croatia designated authorities in charge of the implementation of
the NSP and OP by its Decision adopted at a session held on 18 March 2010.
Managing Authority
In accordance with Article 58 of the EFF Regulation, Croatia has designated the DoF as MA.
The MA will carry out all the functions listed in Article 59 (a) to (j) of the EFF Regulation. The MA is
also responsible for project selection and implementation, recording and evaluation (Ex ante, Interim
and Ex post), and will ensure the implementation of the OP in accordance with the principle of sound
financial management.
Intermediate Body

NATIONAL STRATEGIC PLAN
47
To ensure the optimal use of the existing administrative structure and to capitalise the knowledge and
experience gained though pre-accession period, the MA will delegate certain duties to the
Intermediary body – the PAAFRD.
Certifying Authority
In terms of Article 60 (a) to (f) of the EFF Regulation, Croatia has established the Independent Service
for accreditation of the Paying Agency for payments in agriculture, fisheries and rural development
and certifying of support programmes in fisheries of the MINAGRI as the Certifying Authority
(hereinafter: CA). Within the general organizational structure of the MINAGRI, the Independent
Service answers directly to the Minister, thus ensuring that the principle of segregation of functions is
applied as regards the DoF which is part of the same Ministry
Audit Authority
In keeping with the obligation to establish the auditing, as foreseen by Article 58 of the EFF
Regulation and in accordance with the functions determined and prescribed in Article 61 (a) to (c) of
the same Regulation, Croatia has designated the Agency for the Audit of EU Programmes
Implementation System (ARPA) as a body responsible for auditing the implementation of the EFF.
ARPA was established in June 2008 by the Ordinance of the Republic of Croatia on establishment of
the Agency for the Audit of European Union Programmes Implementation System (OG No 73/08).
Legal status, representation, scope of competences, organizational structure and bodies of ARPA are
defined in its Statute adopted at a session of the Management Council of the Agency, held on 25
February 2009.
Monitoring Committee of implementation of the Operational Programme in the Fisheries
In addition to the designation of the mentioned authorities, and pursuant to the provisions of Articles
62-66 of the EFF Regulation the MA will set up a Monitoring Committee (hereinafter: MC) for the
monitoring of implementation of the Operational Programme in the Fisheries in line with the
dynamics of the development of the overall process after consultations with the EC but not later than
three months following the Commission decision approving the OP.
6.2.2 Monitoring procedure of the Strategic Plan
General monitoring of the NSP will be carried out by the MINAGRI, DoF.
Monitoring of the NSP in relation to the measures, which are financed by the EFF, will be carried out
by the Monitoring Committee of the EFF. The Committee shall be setup taking into account the
partnership and shall consists of the representatives of relevant public bodies, representatives of the
fisheries sector, as well as the representatives of scientific community and third sector.
The main task of the Monitoring Committee is to ensure the quality and effectiveness of
implementation of EFF. With that regard it shall lay down the criteria for project selection, review the
progress of implementation of measures, review possible problems arising and steps taken to solve
them.
6.2.3 Indicators
To characterise the implementation of the strategy objectives, some indicators have been chosen as to
follow the changes, which will take place in the time period from July 2013 up to December 2015, and
to assess the achievement of the set objectives.
A number of steps have been taken to select indicators that would ensure efficient evaluation. The
selection of indicators is based on the following criteria:
Indicators can be measured and evaluated through a time line analysis

NATIONAL STRATEGIC PLAN
48
Indicators must reflect the development in real time and enable correction and prevention of
problems.
The number of indicators must be limited and easy to understand to a large number of
stakeholders.
Indicators must be directly linked with the respective objectives, providing grounds for the
assignment of responsibilities to the stakeholders in charge of organization and implementation of
activities
Indicators must be simple to obtain and their collecting should not require too many sources.
The monitoring will be carried out on an annual basis by the MA and examined by the MC.
It should be noted that, according to ex ante evaluation of the OP 2007-2013 which is to deliver the
short term strategic priorities and goals as defined by this document, due to the limited time and
financial scale of the Program, it cannot deliver significant progress in addressing all needs identified
by the NSP and have significant measurable impact in the Croatian fisheries sector as far as its main
characteristics in terms of economic performance, technological composition, employment, or
sustainability of exploitation of resources.
Moreover, due to the earlier explained situation concerning the lack of socio economic data, as well
due to the short implementation period, the socio economic indicators are not considered appropriate
for monitoring of the NSP implementation.
On the level of the Operational Programme(s), indicators for each of the goals, specific goals and
measures shall be duly elaborated and quantified to the extent possible.
► Indicators to monitor the implementation of the NSP are:
Decrease of fishing capacity
Quantification of the indicator:
Decrease of tonnage and power of purse seine and trawl fleet
Reference value (date) Target value (date)
181,808.99 kW (1 September 2013) 172,718.54 kW (31 December 2015)
36,394.82 GT (1 September 2013) 34,575.08 GT (31 December 2015)
Increase of production capacity in aquaculture
Quantification of the indicator:
Increase of production of fish and shellfish
Reference value (date) Target value (date)
Freshwater fish production 6,283 t
(31 December 2011)
Marine fish and shellfish production (excluding
Atlantic bluefin tuna) 4,932 t (31 December 2011)
Freshwater fish production 6,597.15 t
(31 December 2015)
Marine fish and shellfish production (excluding
Atlantic bluefin tuna) 5,178 t (31 December 2015)
Increase of production of juveniles in marine fish farming
Reference value (date) Target value (date)
Marine fish juveniles production 14,824,990 pcs
(31 December 2011)
Marine fish juveniles production 15,566,240 pcs
(31 December 2015)

NATIONAL STRATEGIC PLAN
49
7 APPENDICES
APPENDIX I: Administrative structure
Figure 1-1. Organisational scheme of DoF
Directorate of Fisheries
Sector for management, planning and
development of fisheries
Service for aquaculture
Unit for freshwater aquaculture
Unit for mariculture
Service for management of capture fisheries
Unit for marine capture fisheries
Unit for freshwater
capture fisheries
Unit for fleet register,
statistics and economics in
fisheries
Service for cooperation, state aid and market
organization in fisheries
Unit for international, institutional
and economic cooperation
Unit for state aid and
organization of market in fisheries
Sector for monitoring and control of
fisheries
Service for fisheries inspection
Unit Zagreb
Unit Pula
Unit Zadar
Unit Split
Service for monitoring and geo information system in fisheries
Unit for monitoring
centre
Unit for geo information
system in fisheries and information
Service for Management of EU
Funds
Service for Legal Affairs

NATIONAL STRATEGIC PLAN
50
APPENDIX II: Fisheries products import and export
Table 2-1. Fisheries products balance from 2000 to 2011
Year IMPORT EXPORT BALANCE
Tons USD Tons USD Tons USD
2000 25.545 33.098.275 18.247 43.977.357 -7.298 10.879.082
2001 42.631 56.569.965 21.686 64.080.711 -20.945 7.510.746
2002 56.284 75.898.070 22.370 79.869.814 -33.914 3.971.744
2003 57.316 82.741.215 22.687 114.881.084 -34.629 32.139.869
2004 38.579 70.777.929 23.429 104.010.263 -15.150 33.232.334
2005 53.687 98.416.794 24.424 97.361.226 -29.263 -1.055.568
2006 51.974 105.372.955 29.496 159.847.033 -22.478 54.474.078
2007 47.847 120.613.368 30.603 152.428.359 -17.244 31.814.991
2008 54.055 138.990.532 29.444 149.577.014 -24.611 10.586.482
2009 44.385 102.228.762 32.721 164.115.420 -11.664 61.886.658
2010 41.211 102.400.654 33.950 135.395.280 -7.261 32.994.626
2011 38.417 123.676.657 38.493 178.503.695 -76 54.827.038
Source: Ministry of Finance - Customs administration
Analysis: MINAGRI-DoF
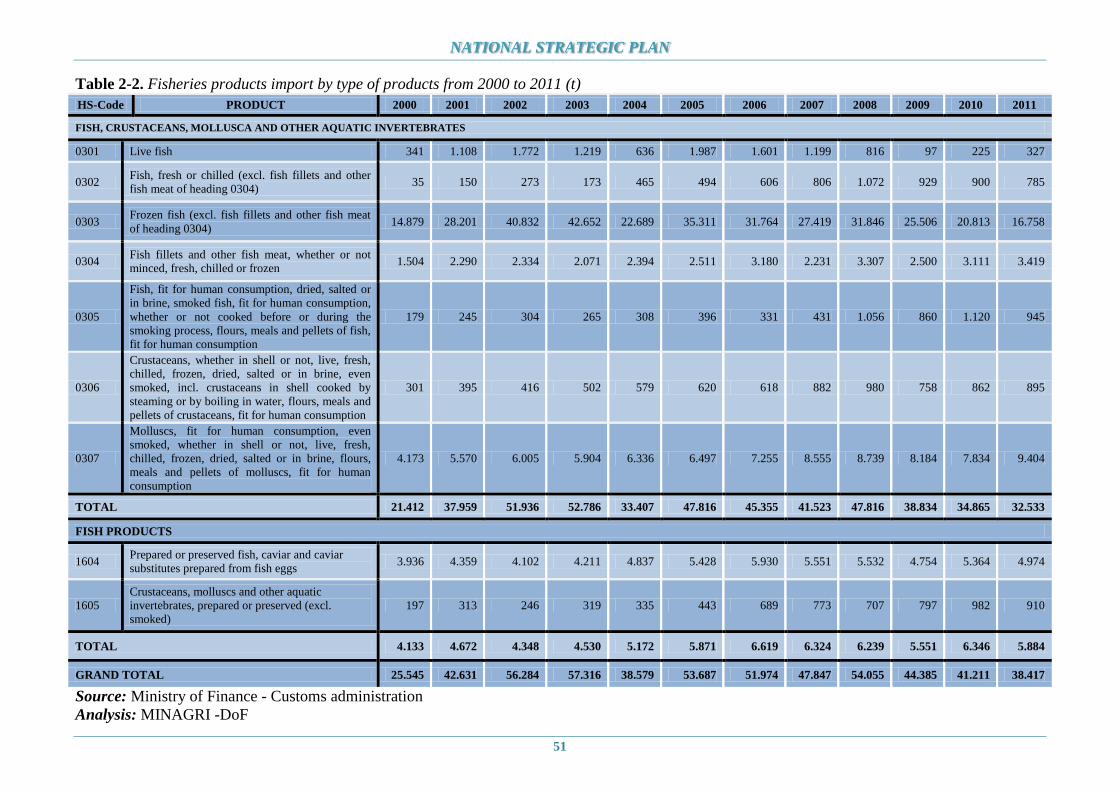
NATIONAL STRATEGIC PLAN
51
Table 2-2. Fisheries products import by type of products from 2000 to 2011 (t)
HS-Code PRODUCT 2000 2001 2002 2003 2004 2005 2006 2007 2008 2009 2010 2011
FISH, CRUSTACEANS, MOLLUSCA AND OTHER AQUATIC INVERTEBRATES
0301 Live fish 341 1.108 1.772 1.219 636 1.987 1.601 1.199 816 97 225 327
0302 Fish, fresh or chilled (excl. fish fillets and other
fish meat of heading 0304) 35 150 273 173 465 494 606 806 1.072 929 900 785
0303 Frozen fish (excl. fish fillets and other fish meat
of heading 0304) 14.879 28.201 40.832 42.652 22.689 35.311 31.764 27.419 31.846 25.506 20.813 16.758
0304 Fish fillets and other fish meat, whether or not
minced, fresh, chilled or frozen 1.504 2.290 2.334 2.071 2.394 2.511 3.180 2.231 3.307 2.500 3.111 3.419
0305
Fish, fit for human consumption, dried, salted or
in brine, smoked fish, fit for human consumption,
whether or not cooked before or during the
smoking process, flours, meals and pellets of fish,
fit for human consumption
179 245 304 265 308 396 331 431 1.056 860 1.120 945
0306
Crustaceans, whether in shell or not, live, fresh,
chilled, frozen, dried, salted or in brine, even
smoked, incl. crustaceans in shell cooked by
steaming or by boiling in water, flours, meals and
pellets of crustaceans, fit for human consumption
301 395 416 502 579 620 618 882 980 758 862 895
0307
Molluscs, fit for human consumption, even
smoked, whether in shell or not, live, fresh,
chilled, frozen, dried, salted or in brine, flours,
meals and pellets of molluscs, fit for human
consumption
4.173 5.570 6.005 5.904 6.336 6.497 7.255 8.555 8.739 8.184 7.834 9.404
TOTAL 21.412 37.959 51.936 52.786 33.407 47.816 45.355 41.523 47.816 38.834 34.865 32.533
FISH PRODUCTS
1604 Prepared or preserved fish, caviar and caviar
substitutes prepared from fish eggs 3.936 4.359 4.102 4.211 4.837 5.428 5.930 5.551 5.532 4.754 5.364 4.974
1605
Crustaceans, molluscs and other aquatic
invertebrates, prepared or preserved (excl.
smoked)
197 313 246 319 335 443 689 773 707 797 982 910
TOTAL 4.133 4.672 4.348 4.530 5.172 5.871 6.619 6.324 6.239 5.551 6.346 5.884
GRAND TOTAL 25.545 42.631 56.284 57.316 38.579 53.687 51.974 47.847 54.055 44.385 41.211 38.417
Source: Ministry of Finance - Customs administration
Analysis: MINAGRI -DoF
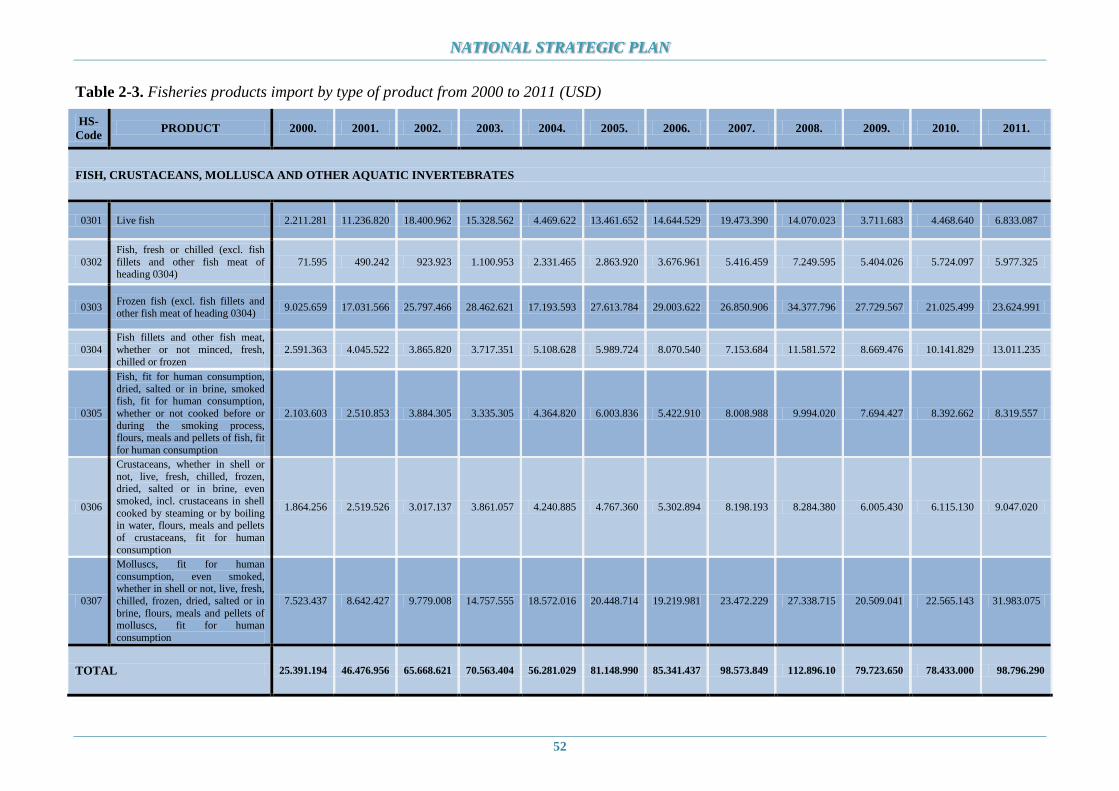
NATIONAL STRATEGIC PLAN
52
Table 2-3. Fisheries products import by type of product from 2000 to 2011 (USD)
HS-
Code PRODUCT 2000. 2001. 2002. 2003. 2004. 2005. 2006. 2007. 2008. 2009. 2010. 2011.
FISH, CRUSTACEANS, MOLLUSCA AND OTHER AQUATIC INVERTEBRATES
0301 Live fish 2.211.281 11.236.820 18.400.962 15.328.562 4.469.622 13.461.652 14.644.529 19.473.390 14.070.023 3.711.683 4.468.640 6.833.087
0302
Fish, fresh or chilled (excl. fish
fillets and other fish meat of heading 0304)
71.595 490.242 923.923 1.100.953 2.331.465 2.863.920 3.676.961 5.416.459 7.249.595 5.404.026 5.724.097 5.977.325
0303 Frozen fish (excl. fish fillets and other fish meat of heading 0304)
9.025.659 17.031.566 25.797.466 28.462.621 17.193.593 27.613.784 29.003.622 26.850.906 34.377.796 27.729.567 21.025.499 23.624.991
0304
Fish fillets and other fish meat,
whether or not minced, fresh,
chilled or frozen
2.591.363 4.045.522 3.865.820 3.717.351 5.108.628 5.989.724 8.070.540 7.153.684 11.581.572 8.669.476 10.141.829 13.011.235
0305
Fish, fit for human consumption,
dried, salted or in brine, smoked fish, fit for human consumption,
whether or not cooked before or
during the smoking process, flours, meals and pellets of fish, fit
for human consumption
2.103.603 2.510.853 3.884.305 3.335.305 4.364.820 6.003.836 5.422.910 8.008.988 9.994.020 7.694.427 8.392.662 8.319.557
0306
Crustaceans, whether in shell or
not, live, fresh, chilled, frozen, dried, salted or in brine, even
smoked, incl. crustaceans in shell
cooked by steaming or by boiling in water, flours, meals and pellets
of crustaceans, fit for human
consumption
1.864.256 2.519.526 3.017.137 3.861.057 4.240.885 4.767.360 5.302.894 8.198.193 8.284.380 6.005.430 6.115.130 9.047.020
0307
Molluscs, fit for human
consumption, even smoked, whether in shell or not, live, fresh,
chilled, frozen, dried, salted or in
brine, flours, meals and pellets of molluscs, fit for human
consumption
7.523.437 8.642.427 9.779.008 14.757.555 18.572.016 20.448.714 19.219.981 23.472.229 27.338.715 20.509.041 22.565.143 31.983.075
TOTAL 25.391.194 46.476.956 65.668.621 70.563.404 56.281.029 81.148.990 85.341.437 98.573.849 112.896.10 79.723.650 78.433.000 98.796.290
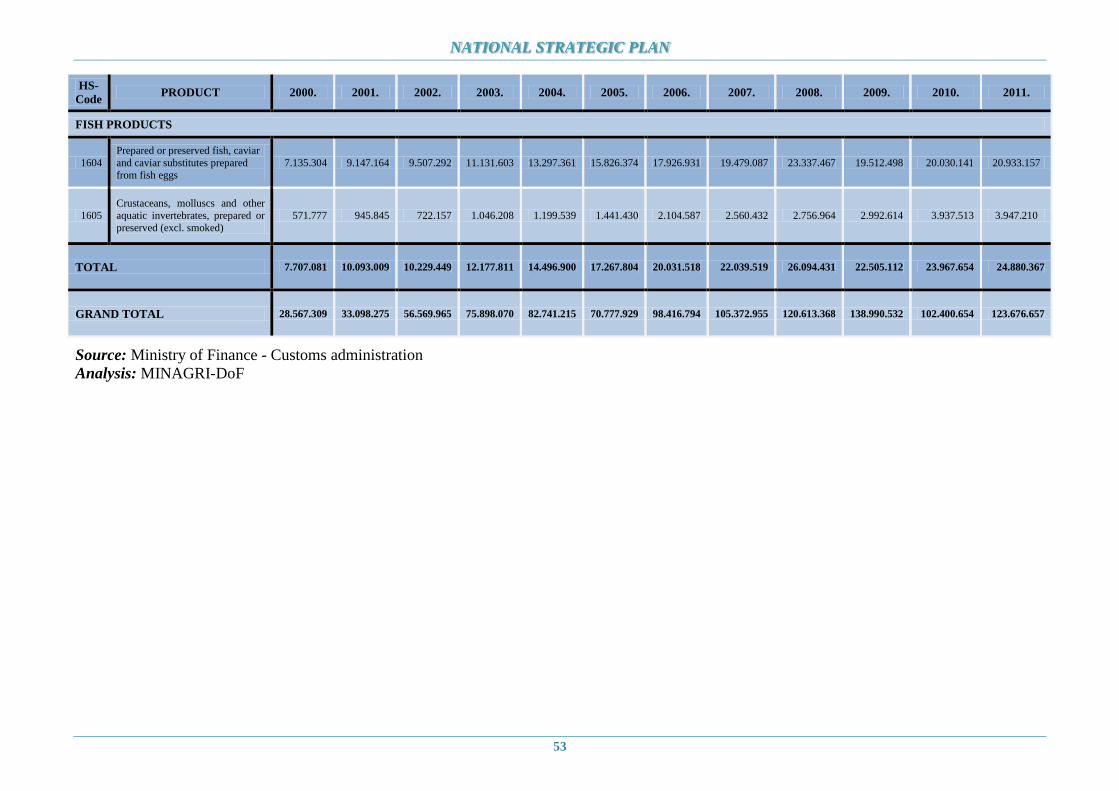
NATIONAL STRATEGIC PLAN
53
HS-
Code PRODUCT 2000. 2001. 2002. 2003. 2004. 2005. 2006. 2007. 2008. 2009. 2010. 2011.
FISH PRODUCTS
1604
Prepared or preserved fish, caviar
and caviar substitutes prepared
from fish eggs
7.135.304 9.147.164 9.507.292 11.131.603 13.297.361 15.826.374 17.926.931 19.479.087 23.337.467 19.512.498 20.030.141 20.933.157
1605
Crustaceans, molluscs and other
aquatic invertebrates, prepared or
preserved (excl. smoked)
571.777 945.845 722.157 1.046.208 1.199.539 1.441.430 2.104.587 2.560.432 2.756.964 2.992.614 3.937.513 3.947.210
TOTAL 7.707.081 10.093.009 10.229.449 12.177.811 14.496.900 17.267.804 20.031.518 22.039.519 26.094.431 22.505.112 23.967.654 24.880.367
GRAND TOTAL 28.567.309 33.098.275 56.569.965 75.898.070 82.741.215 70.777.929 98.416.794 105.372.955 120.613.368 138.990.532 102.400.654 123.676.657
Source: Ministry of Finance - Customs administration
Analysis: MINAGRI-DoF

NATIONAL STRATEGIC PLAN
54
Table 2-4. Fisheries products export by type of product from 2000 to 2011 (t)
HS-
Code PRODUCT 2000. 2001. 2002. 2003. 2004. 2005. 2006. 2007. 2008. 2009. 2010. 2011.
FISH, CRUSTACEANS, MOLLUSCA AND OTHER AQUATIC INVERTEBRATES
0301 Live fish 456 1.361 785 985 748 636 1.218 1.102 439 719 711 1.679
0302 Fish, fresh or chilled (excl. fish fillets and
other fish meat of heading 0304) 6.076 6.020 6.740 9.613 9.592 9.538 13.181 12.545 12.657 13.040 14.736 16.658
0303 Frozen fish (excl. fish fillets and other fish
meat of heading 0304) 611 720 858 1.138 1.898 1.215 1.880 2.606 2.362 3.216 4.008 5.778
0304 Fish fillets and other fish meat, whether or
not minced, fresh, chilled or frozen 6 71 44 35 172 41 41 43 80 105 124 167
0305
Fish, fit for human consumption, dried,
salted or in brine, smoked fish, fit for human
consumption, whether or not cooked before
or during the smoking process, flours, meals
and pellets of fish, fit for human
consumption
1.401 611 1.776 2.368 4.259 6.105 7.297 7.387 6.726 8.336 8.307 7.771
0306
Crustaceans, whether in shell or not, live,
fresh, chilled, frozen, dried, salted or in
brine, even smoked, incl. crustaceans in
shell cooked by steaming or by boiling in
water, flours, meals and pellets of
crustaceans, fit for human consumption
138 122 146 147 163 160 171 150 150 123 117 91
0307
Molluscs, fit for human consumption, even
smoked, whether in shell or not, live, fresh,
chilled, frozen, dried, salted or in brine,
flours, meals and pellets of molluscs, fit for
human consumption
988 1.416 1.283 998 1.275 1.508 1.485 1.433 1.633 1.626 1.372 1.348
TOTAL 9.676 10.321 11.632 15.284 18.107 19.203 25.273 25.266 24.047 27.165 29.375 33.492

NATIONAL STRATEGIC PLAN
55
HS-
Code PRODUCT 2000. 2001. 2002. 2003. 2004. 2005. 2006. 2007. 2008. 2009. 2010. 2011.
FISH PRODUCTS
1604 Prepared or preserved fish, caviar and caviar
substitutes prepared from fish eggs 8.565 11.358 10.728 7.386 5.304 5.187 4.179 5.288 5.300 5.485 4.520 4.916
1605
Crustaceans, molluscs and other aquatic
invertebrates, prepared or preserved (excl.
smoked)
6 7 10 17 18 34 44 49 97 71 55 85
TOTAL 8.571 11.365 10.738 7.403 5.322 5.221 4.223 5.337 5.397 5.556 4.575 5.001
GRAND TOTAL 18.247 21.686 22.370 22.687 23.429 24.424 29.496 30.603 29.444 32.721 33.950 38.493
Source: Ministry of Finance - Customs administration
Analysis: MINAGRI-DoF
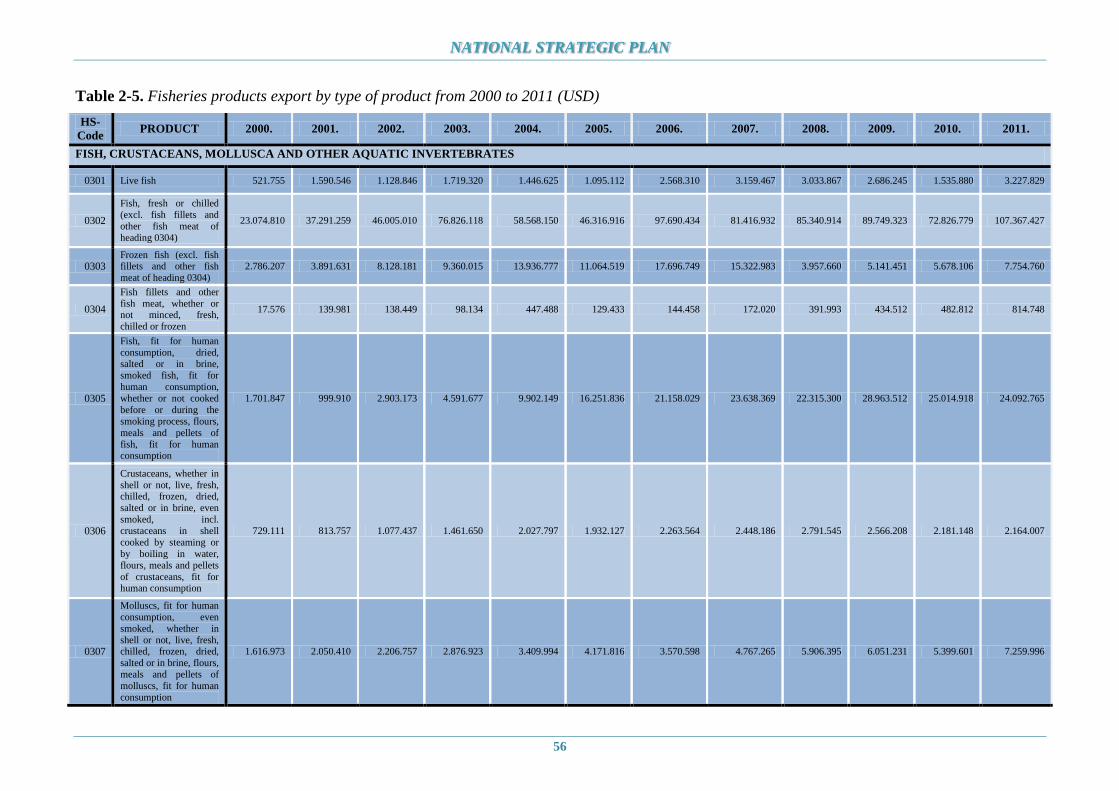
NATIONAL STRATEGIC PLAN
56
Table 2-5. Fisheries products export by type of product from 2000 to 2011 (USD)
HS-
Code PRODUCT 2000. 2001. 2002. 2003. 2004. 2005. 2006. 2007. 2008. 2009. 2010. 2011.
FISH, CRUSTACEANS, MOLLUSCA AND OTHER AQUATIC INVERTEBRATES
0301 Live fish 521.755 1.590.546 1.128.846 1.719.320 1.446.625 1.095.112 2.568.310 3.159.467 3.033.867 2.686.245 1.535.880 3.227.829
0302
Fish, fresh or chilled
(excl. fish fillets and
other fish meat of
heading 0304)
23.074.810 37.291.259 46.005.010 76.826.118 58.568.150 46.316.916 97.690.434 81.416.932 85.340.914 89.749.323 72.826.779 107.367.427
0303 Frozen fish (excl. fish fillets and other fish
meat of heading 0304)
2.786.207 3.891.631 8.128.181 9.360.015 13.936.777 11.064.519 17.696.749 15.322.983 3.957.660 5.141.451 5.678.106 7.754.760
0304
Fish fillets and other
fish meat, whether or not minced, fresh,
chilled or frozen
17.576 139.981 138.449 98.134 447.488 129.433 144.458 172.020 391.993 434.512 482.812 814.748
0305
Fish, fit for human
consumption, dried, salted or in brine,
smoked fish, fit for
human consumption,
whether or not cooked
before or during the
smoking process, flours,
meals and pellets of
fish, fit for human consumption
1.701.847 999.910 2.903.173 4.591.677 9.902.149 16.251.836 21.158.029 23.638.369 22.315.300 28.963.512 25.014.918 24.092.765
0306
Crustaceans, whether in
shell or not, live, fresh, chilled, frozen, dried,
salted or in brine, even
smoked, incl.
crustaceans in shell
cooked by steaming or
by boiling in water,
flours, meals and pellets
of crustaceans, fit for human consumption
729.111 813.757 1.077.437 1.461.650 2.027.797 1.932.127 2.263.564 2.448.186 2.791.545 2.566.208 2.181.148 2.164.007
0307
Molluscs, fit for human
consumption, even
smoked, whether in
shell or not, live, fresh, chilled, frozen, dried,
salted or in brine, flours,
meals and pellets of
molluscs, fit for human
consumption
1.616.973 2.050.410 2.206.757 2.876.923 3.409.994 4.171.816 3.570.598 4.767.265 5.906.395 6.051.231 5.399.601 7.259.996

NATIONAL STRATEGIC PLAN
57
TOTAL 30.448.279 46.777.494 61.587.853 96.933.837 89.738.980 80.961.759 145.092.142 130.925.222 123.737.674 135.592.482 113.119.244 152.681.532
HS-
Code PRODUCT 2000. 2001. 2002. 2003. 2004. 2005. 2006. 2007. 2008. 2009. 2010. 2011.
FISH PRODUCTS
1604
Prepared or preserved
fish, caviar and caviar
substitutes prepared
from fish eggs
13.506.581 17.277.340 18.241.610 17.854.163 14.159.556 16.195.250 14.484.820 21.182.724 25.221.136 28.084.521 21.924.142 25.313.763
1605
Crustaceans, molluscs
and other aquatic
invertebrates, prepared
or preserved (excl.
smoked)
22.497 25.877 40.351 93.084 111.727 204.217 270.071 320.413 618.204 438.417 351.894 508. 400
TOTAL 13.529.078 17.303.217 18.281.961 17.947.247 14.271.283 16.399.467 14.754.891 21.503.137 25.839.340 28.522.938 22.276.036 25.822.163
GRAND TOTAL 43.977.357 64.080.711 79.869.814 114.881.084 104.010.263 97.361.226 159.847.033 152.428.359 149.577.014 164.115.420 135.395.280 178.503.695
Source: Ministry of Finance - Customs administration
Analysis: MINAGRI-DoF

NATIONAL STRATEGIC PLAN
58
Figure 2-1. Most significant countries by the quantity of fisheries products import in 2011
Source: Ministry of Finance - Customs administration
Analysis: MINAGRI-DoF
Figure 2-2. Most significant countries by the value of fisheries products export in 2011
Source: Ministry of Finance - Customs administration
Analysis: MINAGRI-DoF
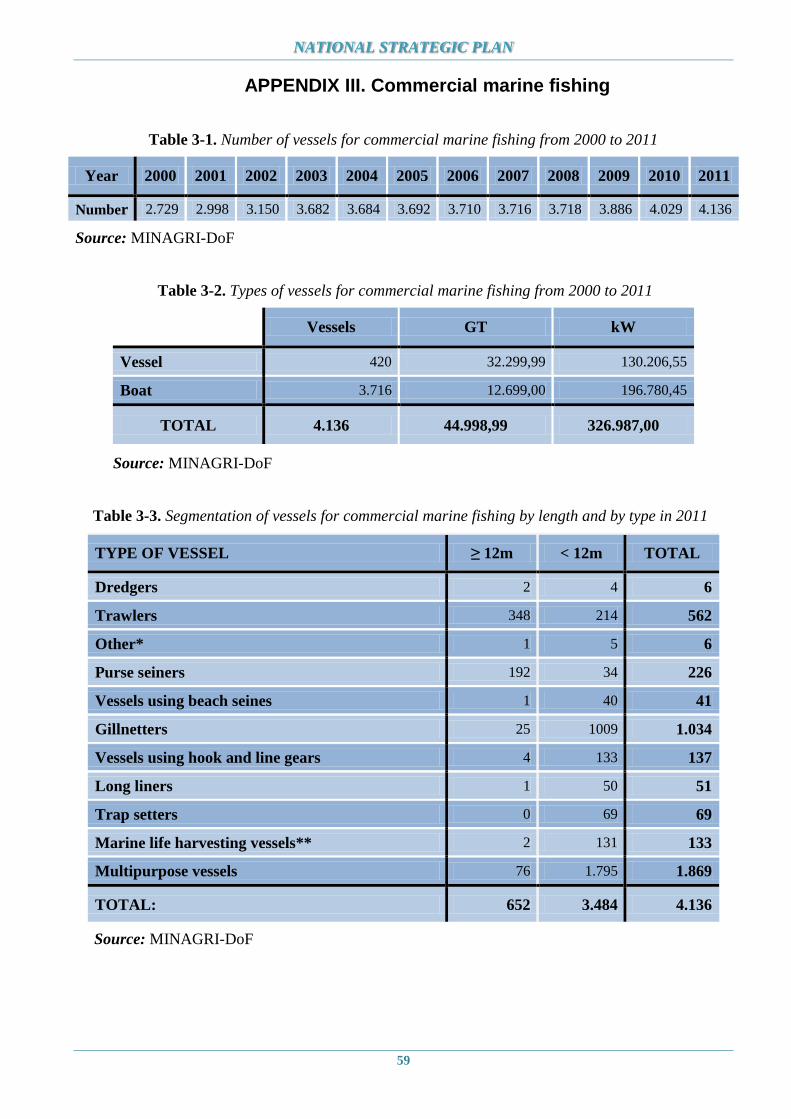
NATIONAL STRATEGIC PLAN
59
APPENDIX III. Commercial marine fishing
Table 3-1. Number of vessels for commercial marine fishing from 2000 to 2011
Year 2000 2001 2002 2003 2004 2005 2006 2007 2008 2009 2010 2011
Number 2.729 2.998 3.150 3.682 3.684 3.692 3.710 3.716 3.718 3.886 4.029 4.136
Source: MINAGRI-DoF
Table 3-2. Types of vessels for commercial marine fishing from 2000 to 2011
Vessels GT kW
Vessel 420 32.299,99 130.206,55
Boat 3.716 12.699,00 196.780,45
TOTAL 4.136 44.998,99 326.987,00
Source: MINAGRI-DoF
Table 3-3. Segmentation of vessels for commercial marine fishing by length and by type in 2011
TYPE OF VESSEL ≥ 12m < 12m TOTAL
Dredgers 2 4 6
Trawlers 348 214 562
Other* 1 5 6
Purse seiners 192 34 226
Vessels using beach seines 1 40 41
Gillnetters 25 1009 1.034
Vessels using hook and line gears 4 133 137
Long liners 1 50 51
Trap setters 0 69 69
Marine life harvesting vessels** 2 131 133
Multipurpose vessels 76 1.795 1.869
TOTAL: 652 3.484 4.136
Source: MINAGRI-DoF

NATIONAL STRATEGIC PLAN
60
Figure 3-1. Total engine power and tonnage of purse seiners from 2004 to 2011
Source: MINAGRI-DoF
Figure 3-2. Total engine power and tonnage of trawlers from 2008 to 2011
Source: MINAGRI-DoF

NATIONAL STRATEGIC PLAN
61
Table 3-4. Segmentation of vessels for commercial marine fishing by counties in 2011
Type of vessel
County
Istarska Primorsko-
goranska
Ličko-
senjska Zadarska
Šibensko-
kninska
Splitsko-
dalmatinska
Dubrovačko-
neretvanska
Dredge 5 1 0 0 0 0 0
Trawler 149 108 10 105 57 120 13
Purse seiner 23 27 0 96 16 53 11
Vessels using beach seines 1 0 2 6 10 22 0
Gillnetters 532 65 33 9 108 260 27
Vessels using hook and line
gears 55 24 6 0 32 20 0
Long liners 2 3 2 0 6 38 0
Trap setter 7 30 17 1 2 12 0
Marine life harvesting vessels 34 0 0 0 56 41 2
Multipurpose vessels 182 520 43 424 103 260 339
Other 5 0 0 0 1 0 0
TOTAL 995 778 113 641 391 826 392
Source: MINAGRI-DoF
Figure 3-3. Segmentation of vessels for commercial marine fishing by age
Source: MINAGRI-DoF

NATIONAL STRATEGIC PLAN
62
Table 3-5. Fish and other marine organisms catch from 2000 to 2011 (t)
Year Pelagic fish Demersal
species Other TOTAL
2000 17.082 2.365 1.524 20.971
2001 13.372 2.149 1.448 16.969
2002 18.733 1.624 847 21.204
2003 24.369 3.556 1.166 29.091
2004 26.381 4.325 1.231 31.937
2005 28.621 4.573 1.467 34.661
2006 31.646 4.857 1.353 37.856
2007 33.041 4.893 2.228 40.162
2008 42.688 4.831 1.492 49.011
2009 49.433 4.307 1.788 55.547
2010 46.703 4.098 1.594 52.395
2011 64.306 4.493 1.736 70.535
Source: MINAGRI-DoF

NATIONAL STRATEGIC PLAN
63
Table 3-6. Fish and other marine organisms catch by species in 2011 (t)
No Fish and other marine organisms species Catch
1
Pelagic fish
Sardine 46.051
2 European sprat 62
3 European anchovy 14.382
4 Atlantic mackerel 19
5 Mediterranean horse mackerel 368
6 Atlantic bluefin tuna 372
7 Atlantic bonito 41
8 Chub mackerel 486
9 Mixed small pelagic fish 2.333
10 Greater amberjack 53
11 Other 139
TOTAL 64.306
12
Other fish
European hake 777
13 Red/Striped mullet 1.143
14 Mullet 208
15 European conger 47
16 European sea bass 10
17 Gilthead sea bream 74
18 Picarel 215
19 Angler 111
20 Bogue 122
21 Saddled sea bream 57
22 Adriatic sole 318
23 Shark and Catshark 98
24 Ray 64
25 Other 1.249
TOTAL 4.493
26
Crustaceans
European spiny lobster 15
27 Norway lobster 284
28 Prawn 152
29 Other 54
TOTAL 505
30
Bivalves
Common oysters 12
31 Pilgrim's scallops 30
32 Noah's archs 13
33 Clam 27
34 Mediterranean mussels 32
35 Other 53
TOTAL 167
36
Molluscs
Squid 150
37 European flying squid 139
38 Common octopus 149
39 Common cuttlefish a 105
40 Musky octopus 452
41 Other 28
TOTAL 1.023
42 Other marine organisms (corals, stony sponges ...) 41
GRAND TOTAL 70.535
Source: MINAGRI-DoF

NATIONAL STRATEGIC PLAN
64
Table 3-7. Fish and other marine organisms catch by fishing
zones in 2011 (t)
Fishing zone Catch
A 8.391
B 28.025
C 5.359
D 1.477
E 14.785
F 4.224
G 7.706
H 26
I 424
J 112
K 6
TOTAL 70.535
Source: MINAGRI-DoF
Table 3-8. Some significant fish and marine organisms catch by fishing zones in 2011 (t)
Zone Sardine European
anchovy
Mixed
small
pelagic
species
Striped
mullet
European
hake
Musky
octopus
Norway
lobster
Adriatic
sole Other TOTAL
A 6.134 489 213 91 5 229 1 244 985 8.391
B 20.780 4.993 1.126 384 56 62 4 9 611 28.025
C 1.823 1.611 141 283 265 74 213 22 927 5.359
D 154 865 44 45 55 5 14 8 287 1.477
E 8.006 4.973 517 38 259 40 45 16 891 14.785
F 3.202 410 110 50 21 10 1 2 418 4.224
G 5.847 759 181 208 103 29 2 3 574 7.706
H 0 0 1 2 0 2 0 14 7 26
I 0 282 0 1 0 1 0 0 140 424
J 0 0 0 0 12 0 3 0 97 112
K 0 0 0 0 1 0 1 0 4 6
TOTAL 45.946 14.382 2.333 1.102 777 452 284 318 4.941 70.535
Source: MINAGRI-DoF

NATIONAL STRATEGIC PLAN
65
Table 3-9. Fish and other marine organisms catch by fishing gear in 2011 (t)
Fishing gear Catch
Purse seine 64.389
Set gillnets 486
Beach seine net 357
Towed gears 4.275
Triple gillnets 446
Pots and other traps 67
Spears, hooks and lines 352
Gears for collection of marine organisms 128
Other gear 35
TOTAL 70.535
Source: MINAGRI-DoF
Figure 3-4. Purse seiners movements in November 2011 according to VMS*
Source: MINAGRI-DoF
* in November 2011 the highest monthly catch was recorded

NATIONAL STRATEGIC PLAN
66
Figure 3-5. Purse seiners catch by hour in 2011 (kg/h)
Source: MINAGRI-DoF
Figure 3-6. Trawlers catch by hour in 2011 (kg/h)
Source: MINAGRI-DoF

NATIONAL STRATEGIC PLAN
67
Figure 3-7. Purse seiners catch by vessel from 2004 to 2011 (kg)
Source: MINAGRI-DoF
Figure 3-8. Trawlers catch by vessel from 2008 to 2011 (kg)
Source: MINAGRI-DoF
10.192
9.070
6.549 7.315
0
2.000
4.000
6.000
8.000
10.000
12.000
2008 2009 2010 2011

NATIONAL STRATEGIC PLAN
68
Table 3-10. Fish and other marine organisms landing by main species in
2011 (t)
Species Landing
Sardine 45.805
European anchovy 14.335
Red/Striped mullet 1.090
European hake 776
Musky octopus 450
Norway lobster 283
Adriatic sole 315
Other 6.651
TOTAL 69.705
Source: MINAGRI-DoF
Table 3-11. Fish and other marine organisms landing by fishing gear in
2011 (t)
Fishing gear Landing
Towed gears 4.186
Purse seiner 63.681
Beach seine net 339
Set gillnets 470
Other 1.029
TOTAL 69.705
Source: MINAGRI-DoF

NATIONAL STRATEGIC PLAN
69
Table 3-12. Fish and other marine organisms catch by 20 most significant landing sites in 2011 (t)
Pelagic fish Demersal species Molluscs Cephalopods Crustaceans Bivalves
Landing site t Landing site t Landing site t Landing site t Landing site t Landing site t
Kali - Vela
Lamjana 9.391,74 Tribunj 326,73 Komiža 9,52 Poreč 56,71 Dubrovnik - Gruž 57,27 Umag 29,37
Unknown 3.867,50 Hvar - Vira 133,42 Pula – Rib. Koliba 8,89 Pula – Bunarina 40,62 Primošten 56,85 Rovinj** 7
Zadar - Foša 3.258,96 Poreč 126,18 Banjole-Monte Kope 7,68 Banjole-Monte Kope 40,33 Vis - Rukavac 53,02 Poreč 6,2
Novalja 3.024,19 Komiža 120,97 Dubrovnik – Gruž 5,63 Vrsar 39,95 Vela Luka* 42,47 Vrsar 1,64
Biograd – Gl.
mul 2.863,99 Mali Lošinj *** 112,12 Zadar - Foša 5,51 Mali Lošinj*** 31,6 Tribunj 35,72 Pula - Bunarina 0,48
Milna 2.860,41 Primošten 109,21 Unknown 5,09 Primošten 30,66 Komiža 33,28 Pula – Rib.
koliba 0,32
Tribunj 2.320,04 Dubrovnik - Gruž 102,14 Mali Lošinj*** 5,04 Tribunj 28,01 Rogoznica 26,65 Medulin 0,29
Vela Luka* 2.316,89 Rogoznica 94,36 Vela Stiniva 4,59 Umag 27,94 Unknown 6,38 Komiža 0,22
Zadar -
Gaženica 2.263,96 Hramina 88,88 Vela Luka* 4,37 Rogoznica 19,73 Hramina 5,1
Banjole-Monte
Kope 0,2
Pula - Ribarska
koliba 1.813,48 Vela Luka* 85,27 Umag 4,18 Pula – Rib. koliba 18,13 Biograd – Gl. mul 4,11 Novalja 0,08
Plomin 1.688,08 Zadar - Foša 81,88 Tribunj 3,84 Vis - Rukavac 17,57 Slano 3,59 Primošten 0,06
Mrtvaška 1.532,59 Umag 78,91 Medulin 3,49 Dubrovnik - Gruž 17,05 Medulin 3,45 Unknown 0,06
Rovinj** 1.515,86 Vela Stiniva 75,25 Hvar – Vira 3,38 Unknown 16,37 Orebić ****** 3,44 Pula - obala
Uljanik 0,04
Mali Lošinj*** 1.313,69 Mrtvaška 70,49 Mrtvaška 3,2 Vela Luka* 14,62 Vinišće******* 2,98 Hramina 0,03
Outside of
landing site 1.378,23 Unknown 69,06 Rogoznica 3,09 Medulin 14,54 Hvar - Vira 2,41 Mali Lošinj *** 0,03
Zadar - Adria 1.359,22 Vrsar 67,23 Vrsar 2,31 Komiža 14,31 Rijeka 2,13 Vis - Rukavac 0,02
Rijeka **** 1.296,23 Vis - Rukavac 64,09 Poreč 2,18 Hramina 12,9 Cres 1,79 Tribunj 0,01
Pula - obala
Uljanik 1.274,54 Banjole-Monte Kope 60,12 Orebić****** 1,77 Hvar – Vira 12,69 Pula – Rib. 1,77 Krk***** 0,01
Krk ***** 1.186,28 Pula - Ribarska koliba 45,88 Zadar – Adria 1,76 Zadar - Foša 11,02 Umag 1,75 Rogoznica 0
Rovinj - gat
Mirna 1.179,18 Makarska****** 40,4 Makarska ****** 1,7 Zadar - Adria 9,35 Zadar - Foša 1,73 Rijeka 0
Source: MINAGRI-DoF
* Southwest side of the ferry pier ** Communal part of the port at the berth place
*** Part by the ferry ramp
**** Part of passenger port in agreement with a control centre ***** Part of operational bank San Bernandin (pump station) and head of fishing pier
****** Operative banks with a ramp for ferry traffic
******* Operative banks on the pier
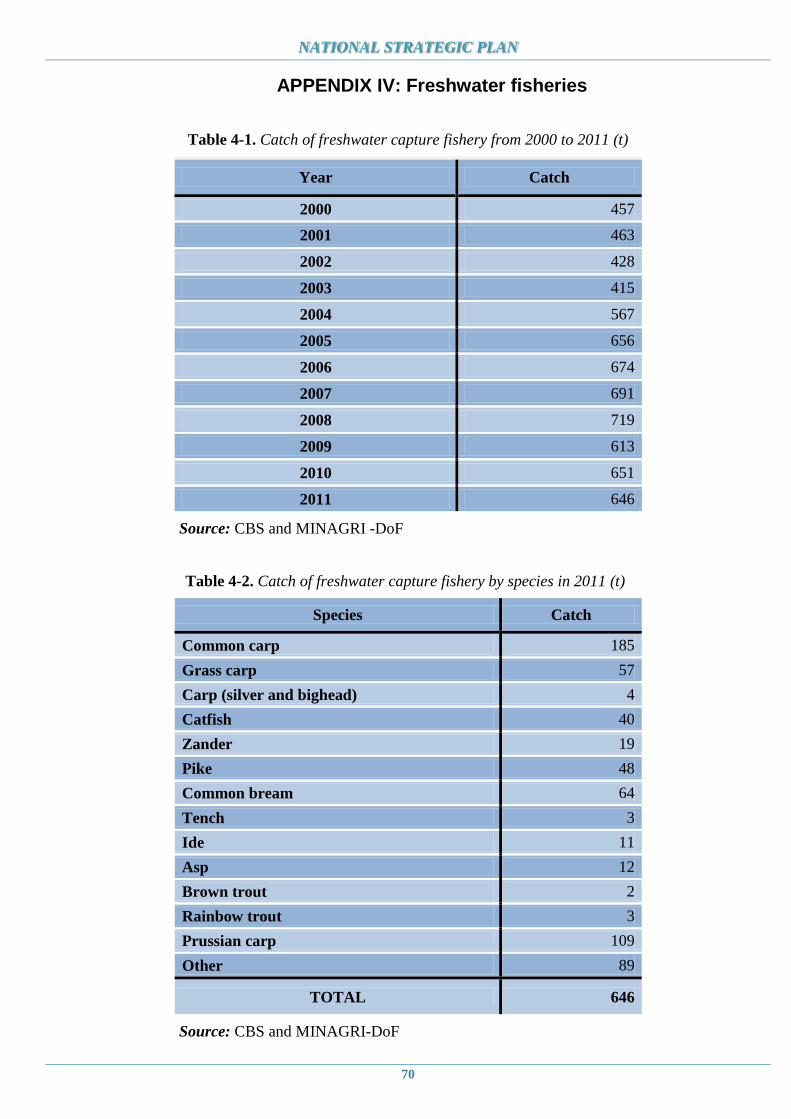
NATIONAL STRATEGIC PLAN
70
APPENDIX IV: Freshwater fisheries
Table 4-1. Catch of freshwater capture fishery from 2000 to 2011 (t)
Year Catch
2000 457
2001 463
2002 428
2003 415
2004 567
2005 656
2006 674
2007 691
2008 719
2009 613
2010 651
2011 646
Source: CBS and MINAGRI -DoF
Table 4-2. Catch of freshwater capture fishery by species in 2011 (t)
Species Catch
Common carp 185
Grass carp 57
Carp (silver and bighead) 4
Catfish 40
Zander 19
Pike 48
Common bream 64
Tench 3
Ide 11
Asp 12
Brown trout 2
Rainbow trout 3
Prussian carp 109
Other 89
TOTAL 646
Source: CBS and MINAGRI-DoF
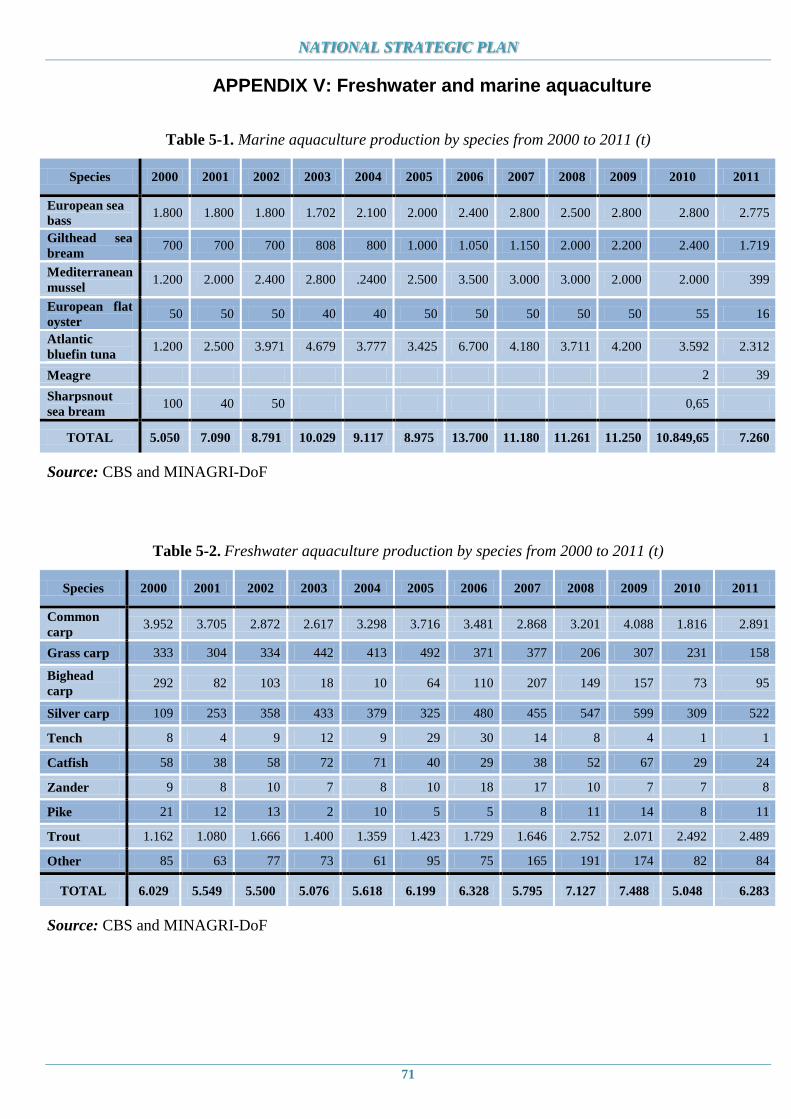
NATIONAL STRATEGIC PLAN
71
APPENDIX V: Freshwater and marine aquaculture
Table 5-1. Marine aquaculture production by species from 2000 to 2011 (t)
Species 2000 2001 2002 2003 2004 2005 2006 2007 2008 2009 2010 2011
European sea
bass 1.800 1.800 1.800 1.702 2.100 2.000 2.400 2.800 2.500 2.800 2.800 2.775
Gilthead sea
bream 700 700 700 808 800 1.000 1.050 1.150 2.000 2.200 2.400 1.719
Mediterranean
mussel 1.200 2.000 2.400 2.800 .2400 2.500 3.500 3.000 3.000 2.000 2.000 399
European flat
oyster 50 50 50 40 40 50 50 50 50 50 55 16
Atlantic
bluefin tuna 1.200 2.500 3.971 4.679 3.777 3.425 6.700 4.180 3.711 4.200 3.592 2.312
Meagre 2 39
Sharpsnout
sea bream 100 40 50 0,65
TOTAL 5.050 7.090 8.791 10.029 9.117 8.975 13.700 11.180 11.261 11.250 10.849,65 7.260
Source: CBS and MINAGRI-DoF
Table 5-2. Freshwater aquaculture production by species from 2000 to 2011 (t)
Species 2000 2001 2002 2003 2004 2005 2006 2007 2008 2009 2010 2011
Common
carp 3.952 3.705 2.872 2.617 3.298 3.716 3.481 2.868 3.201 4.088 1.816 2.891
Grass carp 333 304 334 442 413 492 371 377 206 307 231 158
Bighead
carp 292 82 103 18 10 64 110 207 149 157 73 95
Silver carp 109 253 358 433 379 325 480 455 547 599 309 522
Tench 8 4 9 12 9 29 30 14 8 4 1 1
Catfish 58 38 58 72 71 40 29 38 52 67 29 24
Zander 9 8 10 7 8 10 18 17 10 7 7 8
Pike 21 12 13 2 10 5 5 8 11 14 8 11
Trout 1.162 1.080 1.666 1.400 1.359 1.423 1.729 1.646 2.752 2.071 2.492 2.489
Other 85 63 77 73 61 95 75 165 191 174 82 84
TOTAL 6.029 5.549 5.500 5.076 5.618 6.199 6.328 5.795 7.127 7.488 5.048 6.283
Source: CBS and MINAGRI-DoF

NATIONAL STRATEGIC PLAN
72
Table 5-3. Total aquaculture production from 2000 to 2011 (t)
2000 2001 2002 2003 2004 2005 2006 2007 2008 2009 2010 2011
Marine 5.050 7.090 8.791 10.029 9.117 8.975 13.700 11.180 11.261 11.250 10.849,65 7.260
Freshwater 6.029 5.549 5.500 5.076 5.618 6.199 6.328 5.795 7.127 7.488 5.048 6.283
TOTAL 11.079 12.639 14.291 15.105 14.735 15.174 20.028 16.975 18.388 18.738 15.897,65 13.543
Source: CBS and MINAGRI-DoF
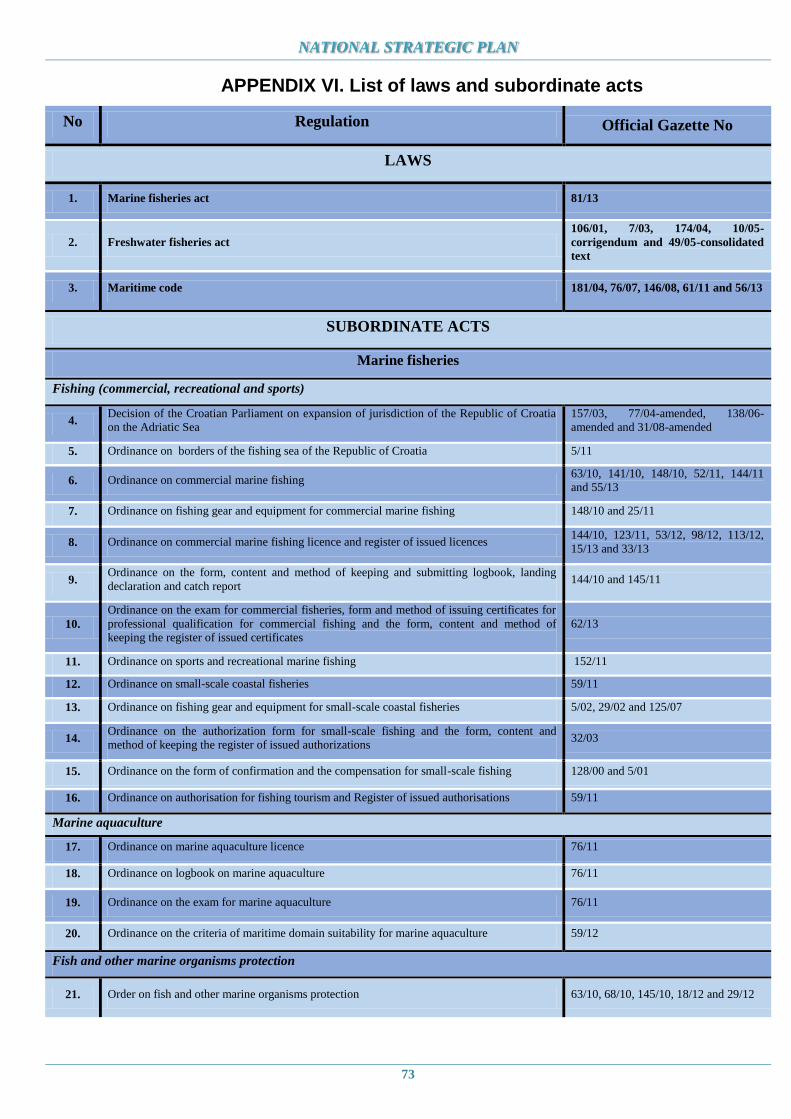
NATIONAL STRATEGIC PLAN
73
APPENDIX VI. List of laws and subordinate acts
No Regulation Official Gazette No
LAWS
1. Marine fisheries act 81/13
2. Freshwater fisheries act
106/01, 7/03, 174/04, 10/05-
corrigendum and 49/05-consolidated
text
3. Maritime code 181/04, 76/07, 146/08, 61/11 and 56/13
SUBORDINATE ACTS
Marine fisheries
Fishing (commercial, recreational and sports)
4. Decision of the Croatian Parliament on expansion of jurisdiction of the Republic of Croatia
on the Adriatic Sea
157/03, 77/04-amended, 138/06-
amended and 31/08-amended
5. Ordinance on borders of the fishing sea of the Republic of Croatia 5/11
6. Ordinance on commercial marine fishing 63/10, 141/10, 148/10, 52/11, 144/11
and 55/13
7. Ordinance on fishing gear and equipment for commercial marine fishing 148/10 and 25/11
8. Ordinance on commercial marine fishing licence and register of issued licences 144/10, 123/11, 53/12, 98/12, 113/12,
15/13 and 33/13
9. Ordinance on the form, content and method of keeping and submitting logbook, landing
declaration and catch report 144/10 and 145/11
10.
Ordinance on the exam for commercial fisheries, form and method of issuing certificates for
professional qualification for commercial fishing and the form, content and method of
keeping the register of issued certificates
62/13
11. Ordinance on sports and recreational marine fishing 152/11
12. Ordinance on small-scale coastal fisheries 59/11
13. Ordinance on fishing gear and equipment for small-scale coastal fisheries 5/02, 29/02 and 125/07
14. Ordinance on the authorization form for small-scale fishing and the form, content and
method of keeping the register of issued authorizations 32/03
15. Ordinance on the form of confirmation and the compensation for small-scale fishing 128/00 and 5/01
16. Ordinance on authorisation for fishing tourism and Register of issued authorisations 59/11
Marine aquaculture
17. Ordinance on marine aquaculture licence 76/11
18. Ordinance on logbook on marine aquaculture 76/11
19. Ordinance on the exam for marine aquaculture 76/11
20. Ordinance on the criteria of maritime domain suitability for marine aquaculture 59/12
Fish and other marine organisms protection
21. Order on fish and other marine organisms protection 63/10, 68/10, 145/10, 18/12 and 29/12

NATIONAL STRATEGIC PLAN
74
22. Ordinance on the criteria for determining the compensation of damage committed to fish and
other marine organisms 101/02, 96/05, 30/07 and 131/09
23. Ordinance on special habitats of fish and other marine organisms, and regulation of fishing in
Velebit Channel, Novigrad and Karin Sea , Prokljan Lake, Marina Bay and Neretva Channel
148/04, 152/04, 55/05, 96/06, 123/09
and 130/09
24. Decision on fishing method in certain special habitats, with certain fishing gear and at a
specific time 125/07
25. Ordinance on the use of funds generated from compensation for marine fishing 119/09 and 52/10
Tunas
26. Decision on the criteria for registration of fishing vessels in ICCAT register (ICCAT record
of BFT catching vessels) for 2013 29/13
27.
Decision on the implementation of the national observers programme and ICCAT regional
observers programme on fishing vessels engaged in tuna fishing (Thunnus thynnus) and
vessels for tugging tuna cages in tuna transfer for 2013
64/13
28. Decision on the implementation of the ICCAT regional observers programme on tuna farms
(Thunnus thynnus) 76/09
29. Decision on the implementation of ICCAT draft for joint international inspection 38/09
30. Decision on the criteria for distribution of State quotas and permanent individual quotas for
tuna fishing (Thunnus thynnus) in 2013 24/13
31. Decision on the maximum allowable input of wild tunas (Thunnus thynnus) on tuna farms for
2013 74/13
32. Decision on establishing a program of assessment of number and individual masses of live
tuna (Thunnus thynnus) while placing into rearing cages 65/13
33. Ordinance on catch, rearing and trade of tuna (Thunnus thynnus), swordfish (Xiphias
gladius) and Mediterranean spearfish (Tetrapturus belone) 15/13 and 20/13
Monitoring and control
34. Ordinance on monitoring and control system of fishing vessels and fisheries monitoring
centre 63/10
35. Ordinance on official identity card, badge and uniform for fisheries inspector 142/12
Placement on the market
36. Ordinance on the conditions and methods for placement of fish and other marine organisms
on the market 154/08
37. Ordinance on catch certificate for fishery products export 20/10
38. Decision on the list of landing places for commercial sea fishing vessels 64/09 and 66/09
Freshwater fisheries
Fishing (commercial and sport)
39. Order on borders of fishing areas and zones for sports and commercial fishing 82/05
40. Ordinance on commercial freshwater fishing 82/05
41. Order on the number of licences, quantity and type of the catch and the amount of
compensation for commercial fishing 91/03, 1/06 and 50/10
42. Ordinance on sports fishing in freshwater fisheries 82/05, 1/06, 139/06 and 52/10
43. List of institutions performing in freshwater fisheries sector 107/05 and 107/07
Fish protection
44. Order on fish protection in freshwater fisheries 82/05 and 139/06
Freshwater aquaculture
45. Ordinance on aquaculture 82/05, 59/09, 156/09, 53/10, 3/11 and
149/11

NATIONAL STRATEGIC PLAN
75
Support and market organisation in fisheries
46. Ordinance on producers organisations in fisheries sector 41/10
47. Ordinance on fishing cooperatives 48/10
48. Ordinance on method of collecting and reporting on prices of fishery products 118/10
49. Ordinance on aid in fisheries sector granted by local and regional authorities 145/10
50. Ordinance on specific recognition to producers' organisations in the fisheries sector in order
to improve the quality of their products 65/12
51. Ordinance on rules for calculating aid granted to producer organisations in the fisheries
sector 65/12
52. Ordinance on conditions for the recognition of interbranch organisations in the fisheries and
aquaculture sector
114/12
53. Ordinance on collecting and reporting on prices of imported fishery products 124/12
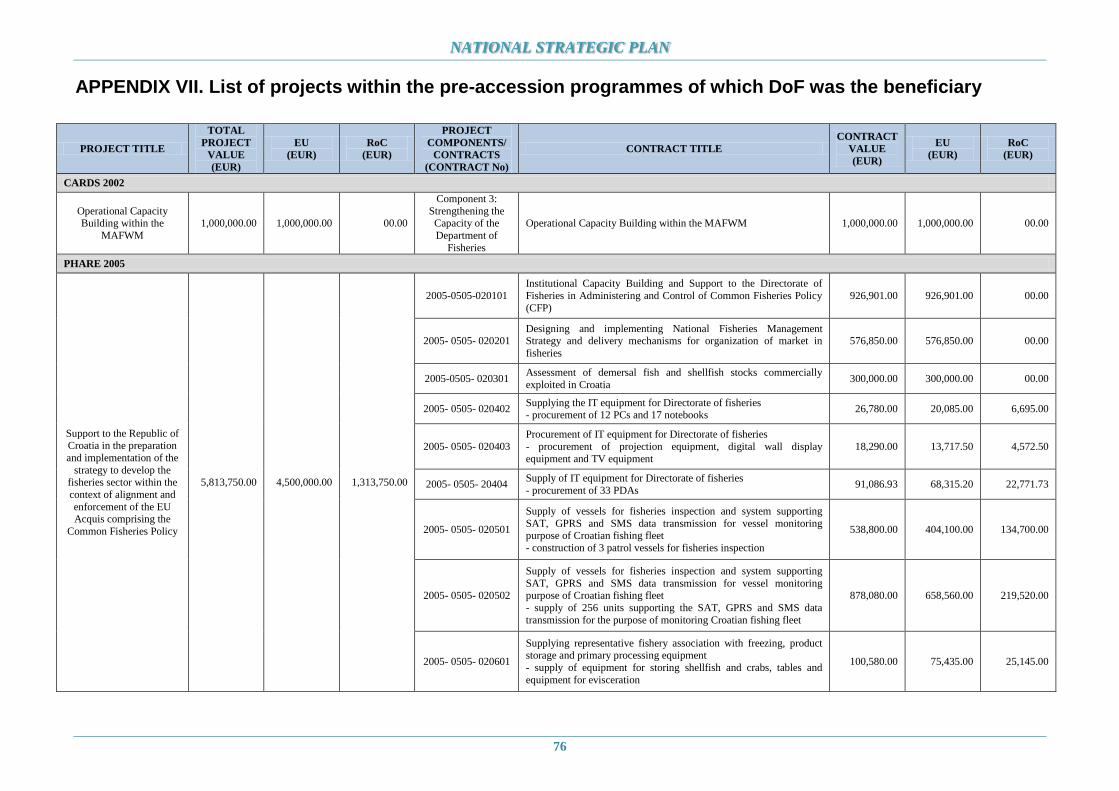
NATIONAL STRATEGIC PLAN
76
APPENDIX VII. List of projects within the pre-accession programmes of which DoF was the beneficiary
PROJECT TITLE
TOTAL
PROJECT
VALUE
(EUR)
EU
(EUR)
RoC
(EUR)
PROJECT
COMPONENTS/
CONTRACTS
(CONTRACT No)
CONTRACT TITLE
CONTRACT
VALUE
(EUR)
EU
(EUR)
RoC
(EUR)
CARDS 2002
Operational Capacity Building within the
MAFWM
1,000,000.00 1,000,000.00 00.00
Component 3:
Strengthening the Capacity of the
Department of
Fisheries
Operational Capacity Building within the MAFWM 1,000,000.00 1,000,000.00 00.00
PHARE 2005
Support to the Republic of Croatia in the preparation
and implementation of the
strategy to develop the fisheries sector within the
context of alignment and
enforcement of the EU Acquis comprising the
Common Fisheries Policy
5,813,750.00 4,500,000.00 1,313,750.00
2005-0505-020101
Institutional Capacity Building and Support to the Directorate of
Fisheries in Administering and Control of Common Fisheries Policy
(CFP)
926,901.00 926,901.00 00.00
2005- 0505- 020201 Designing and implementing National Fisheries Management Strategy and delivery mechanisms for organization of market in
fisheries
576,850.00 576,850.00 00.00
2005-0505- 020301 Assessment of demersal fish and shellfish stocks commercially
exploited in Croatia 300,000.00 300,000.00 00.00
2005- 0505- 020402 Supplying the IT equipment for Directorate of fisheries
- procurement of 12 PCs and 17 notebooks 26,780.00 20,085.00 6,695.00
2005- 0505- 020403
Procurement of IT equipment for Directorate of fisheries
- procurement of projection equipment, digital wall display
equipment and TV equipment
18,290.00 13,717.50 4,572.50
2005- 0505- 20404 Supply of IT equipment for Directorate of fisheries
- procurement of 33 PDAs 91,086.93 68,315.20 22,771.73
2005- 0505- 020501
Supply of vessels for fisheries inspection and system supporting
SAT, GPRS and SMS data transmission for vessel monitoring purpose of Croatian fishing fleet
- construction of 3 patrol vessels for fisheries inspection
538,800.00 404,100.00 134,700.00
2005- 0505- 020502
Supply of vessels for fisheries inspection and system supporting
SAT, GPRS and SMS data transmission for vessel monitoring purpose of Croatian fishing fleet
- supply of 256 units supporting the SAT, GPRS and SMS data
transmission for the purpose of monitoring Croatian fishing fleet
878,080.00 658,560.00 219,520.00
2005- 0505- 020601
Supplying representative fishery association with freezing, product storage and primary processing equipment
- supply of equipment for storing shellfish and crabs, tables and
equipment for evisceration
100,580.00 75,435.00 25,145.00

NATIONAL STRATEGIC PLAN
77
PROJECT TITLE
TOTAL
PROJECT
VALUE
(EUR)
EU
(EUR)
RoC
(EUR)
PROJECT
COMPONENTS/
CONTRACTS
(CONTRACT No)
CONTRACT TITLE
CONTRACT
VALUE
(EUR)
EU
(EUR)
RoC
(EUR)
2005- 0505- 020602
Supplying representative fishery association with freezing, product
storage and primary processing equipment - supply of freezing tunnel
48,600.00 36,450.00 12,150.00
2005- 0505- 020603
Supplying representative fishery association with freezing, product
storage and primary processing equipment
- supply of scaling machine, vacuum packing machine and curling washing machine
63,842.15 47,881.61 15,960.54
2005- 0505- 020604
Supplying representative fishery association with freezing, product
storage and primary processing equipment
- supply of filleting equipment
185,390.00 139,042.50 46,347.50
2005 – 0505-020701 Establishment fishing port in Umag 1,399,706.35 1,049,779.76 349,926.59
IPA 2008
Strengthening the Market Component of the Croatian
Fisheries Sector”
2,155,600.00 1,616,700.00 538,900.00
2008-0303-020501 Setting up of a metier-base data analysis and collection system in
fisheries 145,590.00 131,031.00 14,559.00
2008-0303-020401 Supply of IT equipment to the Directorate of Fisheries 239,540.00 179,655.00 59,885.00
2008-0303-020201 Supply of equipment for the fisheries market Tribunj – lot 1 - supply of auction equipment
236,915.00
177,686.25 59,228.75
2008-0303-020202 Supply of equipment for the fisheries market Tribunj – lots 2 and 4
- supply of forklift truck, manually operated stackers and scales 34,100.00 25,575.00 8,525.00
2008-0303-020203 Supply of equipment for the fisheries market Tribunj – lot 3
- supply of 2 trucks 136,000.00 102,000.00 34,000.00
2008-0303-020601
Supply of the equipment for supporting the implementation of the
multi-annual national programme for the collection, management and use of data in fisheries
336,119.00 252,089.25 84,029.75
2008-0303-0201 Construction of the fisheries market in Tribunj 700,304.00 525,228.00 175,076.00
Assistance to Croatian
fisheries administration in
development of Operational Programme
and related Publicity
Strategy”
199,680.00 179,712.00 19,968.00 2008-0404-011101 Assistance to Croatian fisheries administration in development of Operational Programme and related Publicity Strategy
185,470.00 166,923.00 18,547.00
IPA 2009
Strengthening of Croatian administration in charge
for structural policy and
state aid in fisheries
650,000.00 585,000.00 65,000.00 2009-0404-0110 Strengthening of Croatian Administration in charge for Structural
policy and State Aid in Fisheries 650,000.00 585,000.00 65,000.00
TOTAL 9,819,030,00 7,881,412.00 1,937,618.00 8,818,944.43 7,462,305.07 1,356,639.36