National Interagency Coordination Center · 2011-05-07 · 4 NATIONAL INTERAGENCY COORDINATION...
46
National Interagency Coordination Center 2000 Statistics and Summary
Transcript of National Interagency Coordination Center · 2011-05-07 · 4 NATIONAL INTERAGENCY COORDINATION...

1
National Interagency Coordination Center
2000 Statistics and
Summary

2
N A T I O N A L I N T E R A G E N C Y C O O R D I N A T I O N C E N T E R
2000
Table of Contents
IDENTIFIER LEGEND………………………………………………..3 INTELLIGENCE……………………………………………………….4 2000 Annual Fire Narrative………………………..5 Fires and Acres…………………………………….8 Preparedness Level………………………………..15 INCIDENT SUPPORT………………………………………………...16 Type 1 Team Mobilization………………….……..17 Military Battalion Mobilization……………...……22 Resource Mobilizations……………………………23-37 AVIATION SUPPORT...……………………………………………….38 Helicopter Mobilization…………………………...40 Air Tanker Mobilization…………………………...42 MAFFS (Mobile Airborne Fire Fighting System)...43 Large Jet Transport………………………………...44

3
Coordination Centers AK= Alaska EA= Eastern Area EB= Eastern Great Basin NO= Northern California NR= Northern Rockies NW= Northwest RM= Rocky Mountains SA= Southern Area SO= Southern California SW= Southwest WB= Western Great Basin CIFC= Canadian Interagency Forest Fire Center
Identifier Legend
Agencies/ Other BIA= Bureau of Indian Affairs BLM= Bureau of Land Management BRL= Bureau of Reclamation CN= Canada DDQ= Department of Defense FEMA= Federal Emergency Management Agency FC= National Interagency Fire Center FWS= U.S. Fish & Wildlife Service NIK= National Interagency Radio Support Cache NPS= National Park Service OAS= Office of Air Services OFDA= Office of Foreign Disaster Assistance PRI= Private ST= State USFS= U.S. Forest Service WO= Washington Office, USFS WXW= National Weather Service

4
N A T I O N A L I N T E R A G E N C Y C O O R D I N A T I O N C E N T E R
2000
Intelligence
The principle mission of the Intelligence Section of the National Interagency Coor-dination Center is to collect, consolidate and disseminate fire and other natural dis-aster information to the Washington Office, field units of the wildland fire agencies and the public. This information is gathered from the Geographical Coordination Centers from all governmental agencies both state and federal. The information gathered is used for decision support and planning purposes, which is especially critical during Preparedness Levels 3 through 4 when resource availability becomes limited.

5
2000 WILDLAND FIRE SEASON OVERVIEW NARRATIVE Fire season 2000 was unusually active with above average numbers of fires and acres occurring. Mobilization of firefighters and equipment started early in late April in the Southwest and escalated through the rest of the summer with re-cord fire activity occurring in the Northern Rockies and in the Eastern Great Basin. A predominant weather feature, La Nina had a strong influence on the weather patterns in the United States resulting in a wet winter in the Pacific Northwest and dry conditions in the southern tier states ranging from California to Florida. The combination of dry fuel conditions, active dry lightning storms and persistent hot weather in July and August culminated in a very busy fire season. January began with a ridge of high pressure dominating the eastern third of the country and a low-level trough in the west. Dominant high pressure over the southwestern part of the country provided warmer than normal temperatures from the central plains westward. Near normal temperatures were observed in the eastern portions of the country. A preva-lent onshore flow brought ample precipitation for the Northwest while the Southwest, central Plains and South were drier than normal. The rest of the country received normal precipitation. January 2000 was the tenth warmest on record while precipitation ranked near the long-term mean. Fire activity was moderate in the South, Southern California and the South-west. February saw an upper-level ridge in the central portions of the country with warmer than normal temperatures coast to coast. The prevalent onshore flow in the Northwest provided above normal precipitation while the most of the east-ern portion was drier than normal. Weather data for February indicated that the mean temperature across the United States was the third warmest ever recorded and precipitation was above normal in the Northern Rockies, Great Basin, California, north central Texas and the northern Plains. Drier than normal conditions persisted from the Southwest to Southeast and the Great Lakes region. Fire activity was reported in the South, Southern California, Eastern Area and Southwest. Large grass fires were reported in New Mexico during the middle of the month with an increase in initial attack activity. High pressure over the eastern half of the country provided warmer than normal temperatures from coast to coast in March, with much warmer temperatures noted from the Northern Rockies to the mid-Atlantic. The dominant eastern high pressure provided for drier than normal conditions in central Texas northeastward through the Mississippi and Ohio Valleys. Less than average surface wetness was seen in the northern Plains due to an absence of snowmelt. March was the fourth warmest month on record and precipitation ranked near the long-term mean. An increase in fire activity occurred during the first week of the month in the Southern and Eastern Areas with continued activity reported in the Southwest. A Type I Incident Management Team was assigned to the Kisatchie Wilderness fire in Louisiana and large fires were reported in Missouri as well. Most large fires were contained by the third and fourth weeks of the month.
April saw several deep storm-producing troughs cross the country from west to east. An upper level ridge domi-nated the western half of the country with warmer than normal temperatures reported in the Northern Rockies, Western High Plains to the Pacific Coast. Temperatures were cooler than normal in the Southeast and near normal from the central Plains through the Northeast. Recorded precipitation amounts remained near the long-term mean. At the start of the month, another Type I Incident Management Team was committed to a large fire in Northern California and a second Type I Incident Management Team was mobilized for a large fire in Arizona during the last week of April. Large fire activity was reported in Missouri, Minnesota, Wisconsin, Mississippi, New Mexico, Kentucky, Florida, North Carolina, North Da-kota and Colorado. May saw an upper-level ridge over most of the country that provided much warmer than normal temperatures with drier than normal conditions from the Southwest through the Carolinas and in the interior of Alaska. May ranked as the second warmest on record and was the 29th driest for the last 100 years. Significant fire activity continued as a prescribed fire in northern New Mexico escaped due to strong and erratic winds. The fire at Los Alamos destroyed 235 homes and 47,650 acres of land. Florida also reported a large fire during the first week of the month. By mid-month an Area Com-mand Team had been ordered to help manage the fires in the Southwest and four Type I Incidents were burning, while the Eastern Area began to report some large fire activity. During the last half of May, fire activity increased in the Southern Area, Rocky Mountains, Great Basin and Southern California. In the Southwest, Cerro Grande was contained while north-ern Arizona reported an increase in large fire activity. June weather patterns continued with warmer than normal conditions in the west and the Atlantic coast with cooler conditions in the central part of the country. A weak preview of the southwest monsoon provided wetter than normal condi-tions throughout the Southwest and significant rainfall in the Ohio Valley, mid-Mississippi Valley and mid-Atlantic regions.

6
June was only the 33rd warmest on record and the 14th driest in the last 100 years. Long-term drought (Palmer) area cover-age decreased slightly from May. At the time, the drought area coverage was the worst since the late 1980’s with extreme drought conditions persisting in much of the country. Seasonal thunderstorm activity began in the west and fires were re-ported in Nevada, Idaho, Colorado, Wyoming and Montana. A dominant high-pressure ridge over the western United States brought warmer than normal conditions for the Rocky Mountain and the Southern states during July. Cooler than normal temperatures existed in the Ohio Valley north-eastward to the Appalachians and Mid-Atlantic States. Drier than normal conditions continued in the inter-mountain West and portions of the South and Southwest. Temperatures averaged throughout the United States were near the long-term mean and precipitation was below normal in the West and Southern states. July started out very busy with large fires being reported in Northwest, Great Basin, Alaska, Southern California, and as a precursor of activity to follow: large fires in the Eastern Great Basin and one on the Clearwater in the Northern Rockies. Accompanying gusty winds associated with the thunderstorms contributed to large fire growth and by July 15th the National Preparedness Level was raised to three. One week later, the National MAC Coordinator changed the National Preparedness Level to four and in the last week of the month, it was raised to the highest-level possible, Preparedness Level five. Multi-Agency Coordinating Groups were estab-lished to set priorities for suppression and protection activities at the National Level, in the West and East Great Basin and in the Northern Rockies. By the end of the month, approximately 48 large fires were reported as burning in the United States and the first Military Battalion had been mobilized to the Burgdorf Incident in Idaho. August began with dominant high pressure established over the West, bring above normal temperatures for most of the region. A trough over the Eastern third of the country allowed for much cooler temperatures, especially for the central Appalachians and the mid-Atlantic regions. August 2000 mean monthly temperature averaged across the contiguous United States was the fifth warmest in 100 years. Precipitation was wetter than normal throughout the Great Basin, near normal in the Eastern United States, and drier in the inter-mountain West, extreme Southwest and California. August was the 3rd dri-est month since recording began in 1895. This was the first August since 1976 with much below normal precipitation re-ceived. The Northern Rockies saw a dry lightning storm go through the Bitterroot Valley and 70 to 100 new fires a day were being reported. By the end of the month, four Area Command Teams were established in Montana, a total of 6 Mili-tary Battalions, firefighters and equipment from Canada, Australia, and New Zealand and aerial suppression support from the National Guard Mobile Airborne Fire Fighting aircraft. At this time, an estimated 30,000 firefighters and support per-sonnel were deployed to suppress the fires in the western United States. On August 21, a total of 98 large fires were reported burning to the National Interagency Coordination Center in Boise, Idaho.
During September, the upper-level ridge in the west continued to bring record warm temperatures while much of the east remained cooler than normal. Above normal precipitation was observed in the Great Lake states through the Ohio Valley and into the Mid-Atlantic States. Due to tropical storms, Florida and the Carolinas were also wetter than normal. A mid-continent ridge provided dry conditions to the northern Great Plains, Texas and into the Great Basin. Portions of north-ern California, Oregon and Washington saw wetter than normal conditions. The significant event during September was the cold frontal passage during the first week that brought much needed relief to the Northern Rockies, Northwest, and the Great Basin Areas. Firefighters daily continued to gain an upper hand on the fires as cooler nights and high relative humid-ity diminished fire behavior and activity. By the end of September all of the military battalions and the international fire-fighters had been demobilized. October began with continuing rehabilitation on two of the largest wildfires complexes from the 2000 fire season, the Val-ley Complex and Clear Creek Complex. Warm and dry conditions continued in the Southern Area and fire were being re-ported in Texas and Oklahoma and by mid-month the Eastern Area mobilized resources to Minnesota to help fire efforts there. November saw continued high fire danger and numerous large fires occurring in South Carolina, Virginia, Tennessee and Kentucky. By the second week of the month, a cold front passed through much of the area, bringing some precipitation and higher relative humidity, which aided firefighters towards containment of many of the large fires there. By the end of the month, large fire activity was being reported in the California, Eastern and Southern Areas with no significant problems meeting containment objectives. Much below normal temperatures dominated the country from the central Plains to the Pacific coast while below normal temperatures dominated the rest of the country. In general, the country was cooler than normal except for areas around the central and western Great Lakes and portions of northern New England. Based on pre-liminary precipitation data, November of 2000 was the 26th wettest such month since records began in 1985.

7
Above normal precipitation occurred over portions of central and western Alaska, while Hawaii was drier than normal in much of islands. December saw extreme cold temperatures recorded throughout the southern region of the United States and with an aver-age temperature of 28.9F degrees, the U.S. experienced the seventh coldest December since 1895. Drought conditions were offset in Texas and the much of the Gulf States with above normal rainfall recorded and cold temperatures continuing in the south. While precipitation amounts were normal to above normal throughout the central and eastern U.S., the West and Northwest regions recorded the fourth driest November – December since records began. December began with initial attack activity being reported in the Eastern and Southern Areas. During the last week of December, minimal large fire activity was reported with fires occurring in the Southern and Southern California areas.

8
Fires Reported to NICC
Acres Reported to NICC
0100002000030000400005000060000700008000090000
100000
1990 1991 1992 1993 1994 1995 1996 1997 1998 1999 2000
0
1000000
2000000
3000000
4000000
5000000
6000000
7000000
8000000
1990 1991 1992 1993 1994 1995 1996 1997 1998 1999 2000

9
Fires and Acres reported to the National Coordination Center by the Geographical Area Coordination Centers
ACRES
10% 2%
21%
1%15%10%7%
15%
2%
8% 9%
AKEAEBNONRNWRMSASOSWWB
FIRES
13%3%
4%
4%
3%
4%57%
4% 7% 1%.0038%
AKEAEBNONRNWRMSASOSWWB

10
AKFairbanks
Lakewood
Salt Lake
NICCBoise
RM
EBWBReno
Albuquerque
Missoula
Portland
NW NR EA
SW SAAtlanta
* Ft. Snelling
NO
SO
Redding
Riverside
*

11
Wildfire occurrence and acres as reported to NICC by agency for 2000 Fires and acres are reported to the National Coordination Center by the local units through the Geo-graphical Area Coordination Centers via a internet based program. This is not the final fire and acreage totals that are entered into the fire statistic databases for each agency.
77%
4%5%13%1%
.004%BIA
BLM
FWS
NPS
ST/OTUSFS
34%
32%
4%
23%
5%
2%
BIA
BLM
FWS
NPS
ST/OTUSFS
Fires Acres
AGENCY FIRES ACRES
Bureau of Indian Affairs 4549 321907
Bureau of Land Management 3485 1694407
U.S. Fish and Wildlife Service 309 396760
National Park Service 522 136145
States 71716 2510602
U.S. Forest Service 11669 2333672
Total 92250 7393493
FEDERAL ALL AGENCIES FIRES ACRES FIRES ACRES
2000 20534 4882891 92250 7393493 1999 16657 3755791 83885 5289190 1998 15832 738457 81043 2329704 1997 13760 1982822 66196 2856959 1996 20121 3836799 96363 6065998 1995 16876 987178 82234 1840546 1994 22910 2768018 79107 4073579 1993 14278 1010284 58810 1797574 1992 18679 1319871 87394 2069929 1991 16159 1625734 75754 2953578
Ten year average
17580.6 2290785 80303.6 3667055
Fires and Acres for the last ten years

12
Prescribed fire projects reported to the National Coordination Center by agency
3% 7%
15%
2%
11%62%
BIA
BLM
FWS
NPS
ST/OT
USFS
Prescribed fire acres accomplished as reported to the National Coordination Center by agency
3% 3%
14%
4%
14%62%
BIA
BLM
FWS
NPS
ST/OT
USFS
Prescribed fire is a tool utilized by the government agencies to accomplish re-source management objectives such as reducing fuel loading on the ground to reduce fire hazard and potential for catastrophic fire events. Prescribed fire also improves forest health by releasing nutrients into the soil. A total of 4,697 prescribed fire projects and 1,192,220 treated acres were accomplished in the year 2000.

13
A map of one of the large fire days during Fire Season 2000. Below is a chart of large fires as they occurred during Preparedness Levels 4 and 5. The highest number of large fires reported to the National Coordination Center nationwide was 98, which occurred on August 21, 2000. A large fire is defined as 100 acres in timber fuel types and 300 acres in the grass and brush fuels.
0102030405060708090
100
7/28 7/31 8/3 8/6 8/9 8/1
28/1
58/18 8/21
8/24
8/27
8/30 9/2 9/5
Number of large Fires Reported

14
Burning Index and Energy Release Component Charts showing fire danger indices for some of the weather stations located near this season’s large fire events.
Cerro Grande, Bandelier National Park, New Mexico
Burgdorf Junction, Payette National Forest, Idaho
Kootenai Complex, Kootenai National Forest, Montana

15
12
05
0
50
0
29
0
6 8
53
0
10
20
30
40
50
60
Number of days
1990 1991 1992 1993 1994 1995 1996 1997 1998 1999 2000
Preparedness Levels Days at level 4 and 5
Satellite imagery of large fires in eastern Idaho and western Montana on August 22, 2000. Some of the visible fires in Idaho include Trail Creek, Rankin, Morse, Clear Creek, Burgdorf Junction and Wilderness Complex. Visible in western Montana is Valley Complex, Middle Fork Complex and Maudlow/Toston.

16
N A T I O N A L I N T E R A G E N C Y C O O R D I N A T I O N C E N T E R
2000
Incident Support
The principle mission of the National Interagency Coordination Center is the cost effective and timely coordination of land management agency response to support wildland fires and other natural disasters. This is accomplished through planning, situation monitoring and expediting resource orders between federal agencies and other cooperating agencies.
0
10000
20000
30000
40000
TOTAL REQUESTS TO NICC
Requests 4080 3804 2814 3185 32362
UTF 713 365 82 251 2389
AIRCRAFT CREWS ENGINES MISC EQUIP OVERHD

17
Type 1 Incident Management Team Mobilization
Trail Creek Fire, August 2000 Boise National Forest
28
14
32
9
69
12
54
7
26
38
76
0
10
20
30
40
50
60
70
80
Number of assignments
1990 1991 1992 1993 1994 1995 1996 1997 1998 1999 2000

18
Ordering GACC
BIA BLM ST USFS Total Ordering
Office
EB 0 1 0 21 22 NR 1 0 7 33 41 NW 0 0 0 1 1 RM 2 0 1 2 5 SA 0 0 0 7 7 SW 0 0 0 6 6 WB 0 3 1 0 4
Total 3 4 9 70 86
TYPE 1 INCIDENT MANAGEMENT TEAMS REQUESTED
Sending GACC
AK CN EB NO NR NW OC RM SA SO SW Total Total 6 4 3 5 5 9 7 3 4 14 7 67
TYPE 1 INCIDENT MANAGEMENT TEAMS MOBILIZED
Ordering Agency
BIA BLM NPS ST USFS Total Ordering
Office
EA 0 0 0 1 1 2 EB 0 3 1 1 7 12 FC 0 0 0 0 1 1 NR 1 0 1 12 25 39 NW 0 2 0 0 0 2 RM 3 5 0 1 4 13 SA 1 0 0 4 1 6 SW 0 0 2 0 14 16 WB 0 5 0 0 0 5
Total 5 15 4 19 53 96
TYPE 2 INCIDENT MANAGEMENT TEAMS REQUESTED
Sending GACC
CN EA EB NO NR NW RM SA SO SW Total Total 1 3 4 7 4 17 3 6 7 6 58
TYPE 2 INCIDENT MANAGEMENT TEAMS MOBILIZED
Ordering Agency
BLM NPS ST USFS Total Ordering
Office
EB 2 1 1 3 7 FC 0 0 0 1 1 NR 0 1 3 15 19 RM 3 0 1 1 5 SA 0 0 1 0 1 SW 0 0 0 2 2 WB 1 0 0 0 1
Total 6 2 6 22 36
TYPE 2 INCIDENT MANAGEMENT TEAMS CANCELLED Two Type 2 Incident Management Teams requests were unable-to-fill.
The numbers in the tables reflect the requests through the National Interagency Coordination Center. These tables do not include any local mobilization of teams.

19
TEAM HOME AREA INCIDENT NAME GEOGRAPHICAL AREA
UNIT ACRES FROM TO
Melton Southern Area Kisatchie Wilderness Southern Area Kistchie NF 1,000 8-Mar 13-Mar Vail California Cabbage California Mendocino NF 1,540 1-Apr 6-Apr Bateman Southwest Coon Creek Southwest Tonto NF N/A 27-Apr 10-May Melton Southern Area Cliff Lake Southern Area NF in Florida 2,238 28-Apr 4-May Melton Southern Area Long Bay Southern Area NF in Florida 6,679 4-May 10-May Humphrey Southwest Cerro Grande Southwest Sante Fe NF 47,650 7-May 20-May Hart Rocky Basin Cree Southwest Lincoln NF 8,265 7-May 17-May Frye Northern Rockies May Large Fire Support Southwest Southwest Area Coor-
dination Center N/A 10-May 23-May
Bateman Southwest Cerro Grande Southwest Sante Fe NF 47,650 11-May 17-May Studebaker California Scott Able Southwest Lincoln NF 16,034 12-May 24-May Gage California Cerro Grande Southwest Sante Fe NF 47,650 17-May 24-May Melton Southern Area Kinsey #2 Southern Area Francis Marion &
Sumter NF 393 25-May 31-May
Bateman Southwest Viveash Southwest Sante Fe NF 28,283 30-May 8-Jun Hart Rocky Basin High Meadow Rocky Mountain Colorado State-Pueblo
Dispatch Center Counties
10,800 12-Jun 22-Jun
Carvelho Rocky Basin Bobcat Rocky Mountain Arapaho-Roosevelt NF
10,599 12-Jun 21-Jun
Bateman Southwest Saliz Southwest Gila NF 1,001 26-Jun 4-Jul Carvelho Rocky Basin Reno Complex Western Great Basin Sierra Front Inter-
agency Dispatch Cen-ter
18,080 26-Jun 4-Jul
Waterbury Northwest Two Fork Northwest Wenatchee NF N/A 29-Jun 2-Jul Melton Southern Area Longleaf Vista Southern Area Kisatchie NF 2,500 10-Jul 17-Jul Frye Northern Rockies Little Blue Northern Rockies Bitterroot NF 5,800 14-Jul 27-Jul Hefner Rocky Basin Burgdorf Eastern Great Basin Payette NF 64,348 14-Jul 27-Jul Carvelho Rocky Basin Clear Creek Eastern Great Basin Salmon/Challis NF 200,155 14-Jul 30-Jul Bennett Northern Rockies Fenster Creek Eastern Great Basin Salmon/Challis NF 3,245 16-Jul 22-Jul Hutchinson California Bilk Creek Complex Western Great Basin Winnemucca Field
Office 87,888 17-Jul 21-Jul
Bennett Northern Rockies Horn Creek Eastern Great Basin Boise NF 1,035 22-Jul 28-Jul Dague California Wasatch Complex Eastern Great Basin Wasatch-Cache NF 2,650 23-Jul 14-Aug Lohrey Northwest Bircher Rocky Mountain Colorado State-
Durango Dispatch Center Counties
23,607 23-Jul 31-Jul
Studebaker California Manter Southern California Sequoia NF 74,439 23-Jul 13-Aug Gage California Plaskett 2 Southern California Los Padres NF 5,830 23-Jul 4-Aug Stam Alaska Twin Creek Eastern Great Basin Salmon/Challis NF 458 24-Jul 6-Aug Vail California Burgdorf Junction Eastern Great Basin Payette NF 64,348 24-Jul 14-Aug Waterbury Northwest NR Misc ABC Northern Rockies Northern Rockies Co-
ordination Center N/A 24-Jul 27-Jul
Hart Rocky Basin Clear Creek Eastern Great Basin Salmon/Challis NF 200,155 27-Jul 15-Aug Waterbury Northwest Canyon Ferry Complex Northern Rockies Helena NF 43,947 27-Jul 8-Aug Hutchinson California Old Royd Eastern Great Basin Richfield Field Office 59,528 28-Jul 10-Aug

20
TEAM HOME AREA INCIDENT NAME GEOGRAPHICAL AREA
UNIT ACRES FROM TO
Humphrey Southwest Coffee Point North Eastern Great Basin Upper Snake River District, Eastern ID Area
40,000 28-Jul 7-Aug
Bateman Southwest Clear Creek Eastern Great Basin Salmon/Challis NF 200,155 28-Jul 15-Aug Frye Northern Rockies Fort Howes Complex Northern Rockies Missoula Interagency
Dispatch Center 60,600 30-Jul 1-Aug
Bennett Northern Rockies Spread Ridge Northern Rockies Lincoln NF 27,500 31-Jul 11-Aug Hefner Rocky Basin Bismark Eastern Great Basin Utah State- Northwest
State 2,500 1-Aug 5-Aug
Melton Southern Area Arrow Creek Western Great Basin Utah State- Northwest State
2,800 1-Aug 8-Aug
Carvello Rocky Basin Middle Fork Cx./Fall Creek Northern Rockies Beaverhead/ Deer-lodge NF
17,535 4-Aug 27-Aug
Lohrey Northwest Pony Rocky Mountain Ute Mountain Agency 5,250 5-Aug 13-Aug
Gage California Blodgett Trailhead Com-plex
Northern Rockies Bitterroot NF 11,276 5-Aug 23-Aug
Hefner Rocky Basin Crooked Northern Rockies Clearwater NF 4,892 5-Aug 20-Aug Humphrey Southwest Boulder Complex Northern Rockies Montana State- Cen-
tral Land Office 12,604 10-Aug 19-Aug
Stam Alaska Rankin Eastern Great Basin Salmon/Challis NF 6,710 13-Aug 29-Aug Lohrey Northwest Kates Basin Complex Rocky Mountain Wind River Agency 137,600 13-Aug 24-Aug Dague California Burgdorf Junction Eastern Great Basin Payette NF 64,348 10-Aug 30-Aug Frye Northern Rockies Valley Complex Northern Rockies Bitterroot NF 292,070 1-Aug 22-Aug Melton Southern Area Ryan Gulch Northern Rockies Montana State-
Southwestern Land Office
17,118 7-Aug 24-Aug
Bennett Northern Rockies Upper Nine Mile Complex Northern Rockies Lolo NF 24,535 9-Aug 23-Aug Waterbury Northwest Monture/Spread Ridge Northern Rockies Lolo NF 27,500 11-Aug 23-Aug Hutchinson California Clear Creek Eastern Great Basin Salmon/Challis NF 200,155 15-Aug 3-Sep Vail California Storrie Northern California Plumas NF 46,280 18-Aug 6-Sep Bateman Southwest Upper Nine Mile Complex Northern Rockies Lolo NF 24,535 18-Aug 8-Sep Humphrey Southwest Mussigbrod Northern Rockies Beaverhead/ Deer-
lodge NF 84,939 19-Aug 7-Sep
Studebaker California Thompson Flat Complex Northern Rockies Lolo NF 14,936 15-Aug 6-Sep Gage California Valley Complex Northern Rockies Bitterroot NF 292,070 22-Aug 26-Aug Hart Rocky Basin Middle Fork Complex Northern Rockies Beaverhead/ Deer-
lodge NF 17,535 23-Aug 8-Sep
Hefner Rocky Basin Marlin Springs Eastern Great Basin Salmon/Challis NF 6,249 24-Aug 3-Sep Stutler Northwest Valley Complex Northern Rockies Bitterroot NF 292,070 26-Aug 13-Sep Waterbury Northwest Jasper Rocky Mountain Black Hills NF 83,500 26-Aug 5-Sep Frye Northern Rockies Willie Northern Rockies Custer NF 1,500 27-Aug 6-Sep Bennett Northern Rockies Mussigbrod Northern Rockies Beaverhead/ Deer-
lodge NF 84,939 27-Aug 7-Sep
Melton Southern Yellowpine Complex Eastern Great Basin Payette NF 17,260 30-Aug 9-Sep Carvelho Rocky Basin Thompson Flat Complex Northern Rockies Lolo NF 14,936 3-Sep 16-Sep Hefner Rocky Basin Clear Creek Complex Eastern Great Basin Salmon/Challis NF 216,961 4-Sep 11-Sep
21
TEAM HOME AREA INCIDENT NAME GEOGRAPHICAL AREA
UNIT ACRES FROM TO
Stam Alaska Clear Creek Complex Eastern Great Basin Salmon/Challis NF 216,961 9-Sep 27-Sep Bennett Northern Rockies Bunyan Pt./Ear Mountain Northern Rockies Lewis & Clark NF 3,164 17-Sep 21-Sep Melton Southern Area Brushy Ridge Complex Southern Area NF in North Carolina 10,081 29-Oct 10-Nov Stutler Northwest Shenandoah Complex Southern Area Shenandoah NP 24,197 29-Oct 15-Nov Studebaker California Big Fork Complex Southern Area Big South Fork NRA 6,555 1-Nov 8-Nov Frye Northern Rockies Southeast District Complex Southern Area Kentucky Division of
Forestry 35,000 1-Nov 15-Nov
Stam Alaska Waterville Complex Southern Area NF in North Carolina 1,345 1-Nov 6-Nov Gage California ABC Misc Southern Area Southern Area Coor-
dination Center various 3-Nov 12-Nov

22
3
0 0 0
7
0
2
0 0 0
6
0
1
2
3
4
5
6
7
Number of Battalions
1990 1992 1994 1996 1998 2000
Military Battalions Deployed

23
Crew Mobilization
Cancelled UTF AK 0 0 EA 3 0 EB 580 67 NO 0 0 NR 802 255 NW 28 0 RM 187 8 SA 8 0 SO 27 0 SW 88 22 WB 208 6 Total 1936 365
The National Interagency Coordination Center processed a total of 3804 requests for all types of crews, of which 1503 were mobilized, 1936 were cancelled and 365 were unable to fill. The total requests for Type 1 crews were 1132 with 638 being cancelled and 159 unable-to-fill. Total Type 2 requests were 2672 of which 1296 were can-celled and 206 were unable-to-fill.
Crews Cancelled/UTF
0200400600800
1000
AK EA EB NO NR NW RM SA SO SW WB
CancelledUTF
753
335
764
275
1648
311
1345
102
521
13961503
0200400600800
10001200140016001800
1990 1991 1992 1993 1994 1995 1996 1997 1998 1999 2000

24
Engine Mobilization
379
27
28895
638
172
687
20
785656
1715
0200400600800
10001200140016001800
1990 1991 1992 1993 1994 1995 1996 1997 1998 1999 2000
Engines Cancelled/UTF
0
100
200
300
400
AK EA EB NO NR
NW RM SA SO SW WB FC
CancelledUTF
Cancelled UTF AK 0 0 EA 0 0 EB 219 24 NO 0 0 NR 361 28 NW 52 0 RM 122 1 SA 41 0 SO 1 9 SW 55 4 WB 151 16 Total 1002 82
The National Interagency Coordination Center processed a total of 2,799 requests for engines, of which 1,715 were mobilized, 1,002 were cancelled and 82 were unable-to-fill.

25
Overhead Mobilization
Cancelled UTF AK 34 5 EA 39 14 EB 2646 473 NO 100 4 NR 4892 1028 NW 543 48 RM 1558 138 SA 644 196 SO 216 93 SW 1057 460 WB 974 105 FC 140 4
The National Interagency Coordination Center processed a total of 33,310 requests for Overhead, of which 17,899 were filled, 12,843 were cancelled and 2,568 were unable-to-fill.
4900
22003400
800
10400
2100
9600
1200
74008400
17899
02000400060008000
1000012000140001600018000
1990 1991 1992 1993 1994 1995 1996 1997 1998 1999 2000
Overhead Cancelled/UTF
0100020003000400050006000
AK EA EB NO NRNW RM SA SO SW WB FC
CancelledUTF

26
Ordering GACC
Ordering Agency
Functions
Command Coor/Supp Finance Logistics Operation Planning RX Fire Tech Spec Other Total AK BLM 9 1 0 0 114 2 0 1 0 127
ST 6 6 1 6 36 7 0 0 0 62 USFS 0 0 0 0 1 0 0 0 0 1 Total 15 7 1 6 151 9 0 1 0 190
EA FWS 0 0 0 0 0 0 0 5 0 5 NPS 2 0 0 25 4 0 0 41 0 72 ST 7 8 5 10 40 6 0 1 3 80 USDA 0 0 0 0 0 0 0 44 0 44 USFS 17 7 13 11 73 10 1 6 0 138 Total 26 15 18 46 117 16 1 97 3 339
EB BIA 1 1 1 1 11 1 0 0 0 16 BLM 57 169 41 111 403 75 0 48 0 904 NPS 18 1 8 15 82 13 0 9 0 146 ST 7 17 11 35 67 17 0 7 0 161 USFS 394 236 475 1204 1752 573 2 230 15 4881 Total 477 424 536 1366 2315 679 2 294 15 6108
FC BLM 207 117 5 19 139 23 0 213 2 725 FWS 0 0 0 0 0 0 0 6 0 6 NPS 2 0 6 0 0 12 0 29 1 50 USFS 19 151 15 28 18 8 0 31 0 270 Total 228 268 26 47 157 43 0 279 3 1051
NO BLM 0 0 0 0 1 0 0 2 0 3 FWS 0 0 0 0 1 0 0 0 0 1 NPS 0 0 0 0 1 0 0 0 0 1 USFS 4 5 26 26 85 16 0 15 0 177 Total 4 5 26 26 88 16 0 17 0 182
NR BIA 19 17 61 100 140 30 0 40 0 407 BLM 13 40 28 66 141 23 6 6 0 323 FWS 0 0 0 0 1 0 0 5 0 6 NPS 6 0 4 7 29 5 0 6 1 58 ST 156 74 185 382 820 211 0 78 2 1908 USFS 763 257 705 1812 3531 991 6 587 65 8717 Total 957 388 983 2367 4662 1260 12 722 68 11419
NW BIA 8 0 0 5 57 9 0 0 0 79 BLM 6 11 3 17 72 9 24 2 0 144 FWS 0 0 0 0 17 0 5 8 0 30 NPS 0 0 0 0 3 0 0 6 0 9 ST 0 0 4 10 79 3 0 1 0 97 USFS 18 31 27 60 340 29 0 16 0 521 Total 32 42 34 92 568 50 29 33 0 880
RM BIA 79 15 47 138 291 66 0 75 2 713 BLM 46 95 58 187 317 74 0 46 0 823 FWS 0 0 0 0 0 0 0 6 0 6 NPS 7 4 21 25 39 11 0 40 0 147 ST 43 35 42 110 167 44 0 34 0 475 USFS 76 139 86 249 446 118 2 51 0 1167 Total 251 288 254 709 1260 313 2 252 2 3331
OVERHEAD REQUESTED

27
Ordering GACC
Ordering Agency
Functions
Command Coor/Supp Finance Logistics Operation Planning RX Fire Tech Spec Other Total
SA BIA 3 0 1 0 8 4 0 0 0 16 DDO 0 0 0 0 3 0 0 0 0 3 DOD 0 0 0 0 1 0 0 0 0 1 FEMA 0 0 0 0 0 0 0 2 0 2 FWS 0 4 1 1 17 0 1 0 0 24 NPS 7 0 5 43 55 17 0 19 0 146 ST 97 53 49 59 343 66 0 35 0 702 USFS 137 341 90 125 795 126 0 116 2 1732 Total 244 398 146 228 1222 213 1 172 2 2626
SO BLM 0 6 2 1 21 0 0 1 0 31 NPS 0 3 0 0 1 0 0 0 0 4 ST 0 0 1 2 4 2 0 1 3 13 USFS 11 54 28 80 132 33 0 67 2 407 Total 11 63 31 83 158 35 0 69 5 455
SW BIA 0 6 0 2 31 0 0 1 0 40 BLM 14 15 8 14 50 17 13 16 0 147 FEMA 29 8 6 1 29 3 0 10 0 86 FWS 1 0 0 0 21 0 0 4 0 26 NPS 124 19 96 182 297 96 6 99 8 927 ST 3 5 1 2 14 0 0 1 0 26 USFS 315 280 319 569 1196 340 1 442 18 3480 Total 486 333 430 770 1638 456 20 573 26 4732
WB BLM 108 205 136 305 667 155 0 87 2 1665 ST 6 0 17 21 18 14 0 3 0 79 USFS 17 27 29 37 85 23 0 33 0 251 Total 131 232 182 363 770 192 0 123 2 1995 Grand Total
2862 2463 2667 6103 13106 3282 67 2632 127 33308
OVERHEAD REQUESTED
OVERHEAD MOBILIZED Ordering GACC
Ordering Agency
Functions
Command Coor/Supp Finance Logistics Operation Planning RX Fire Tech Spec Other Total
AK BLM 9 1 0 0 83 0 0 0 0 93 ST 6 4 0 6 35 6 0 0 0 57 USFS 0 0 0 0 1 0 0 0 0 1 Total 15 5 0 6 119 6 0 0 0 151
EA NPS 2 0 0 24 3 0 0 33 0 62 ST 6 7 2 10 36 6 0 1 0 68 USDA 0 0 0 0 0 0 0 43 0 43 USFS 10 3 11 10 63 9 1 6 0 113 Total 18 10 13 44 102 15 1 83 0 286

28
OVERHEAD MOBILIZED
Command Coor/Supp Finance Logistics Operation Planning RX Fire Tech Spec Other Total EB BIA 1 0 0 0 5 0 0 0 0 6
BLM 20 82 20 45 145 38 0 35 0 385 NPS 2 1 2 7 34 5 0 5 0 56 ST 2 11 4 5 8 5 0 0 0 35 USFS 214 138 308 616 794 296 0 131 10 2507 Total 239 232 334 673 986 344 0 171 10 2989
FC BLM 191 109 3 19 122 22 0 195 2 663 FWS 0 0 0 0 0 0 0 5 0 5 NPS 1 0 5 0 0 7 0 20 1 34 USFS 13 135 8 17 3 1 0 28 0 205 Total 205 244 16 36 125 30 0 248 3 907
NO BLM 0 0 0 0 0 0 0 2 0 2 FWS 0 0 0 0 1 0 0 0 0 1 NPS 0 0 0 0 1 0 0 0 0 1 USFS 0 1 19 16 20 6 0 12 0 74 Total 0 1 19 16 22 6 0 14 0 78
NR BIA 9 3 35 42 43 17 0 25 0 174 BLM 8 12 12 18 39 4 6 5 0 104 FWS 0 0 0 0 1 0 0 5 0 6 NPS 2 0 0 1 9 0 0 6 1 19 ST 97 51 95 210 261 114 0 34 2 864 USFS 382 174 406 950 1458 511 2 394 55 4332 Total 498 240 548 1221 1811 646 8 469 58 5499
NW BIA 1 0 0 0 3 0 0 0 0 4 BLM 3 5 0 11 25 7 14 2 0 67 FWS 0 0 0 0 16 0 5 7 0 28 NPS 0 0 0 0 3 0 0 6 0 9 ST 0 0 0 6 9 1 0 0 0 16 USFS 9 9 9 23 87 16 0 12 0 165 Total 13 14 9 40 143 24 19 27 0 289
RM BIA 44 11 32 70 168 44 0 39 2 410 BLM 19 42 28 64 136 30 0 11 0 330 FWS 0 0 0 0 0 0 0 5 0 5 NPS 3 1 10 14 21 2 0 29 0 80 ST 22 14 29 64 107 26 0 21 0 283 USFS 34 94 38 123 152 59 1 26 0 527 Total 122 162 137 335 584 161 1 131 2 1635
SA BIA 3 0 1 0 8 3 0 0 0 15 DDO 0 0 0 0 3 0 0 0 0 3 DOD 0 0 0 0 1 0 0 0 0 1 FEMA 0 0 0 0 0 0 0 2 0 2 FWS 0 2 0 0 13 0 0 0 0 15 NPS 5 0 3 31 51 12 0 18 0 120 ST 62 42 23 41 247 47 0 18 0 480 USFS 98 219 48 96 525 83 0 81 1 1151 Total 168 263 75 168 848 145 0 119 1 1787

29
OVERHEAD MOBILIZED
OVERHEAD CANCELLED Ordering GACC
Ordering Agency
Functions
Command Coor/Supp Finance Logistics Operation Planning RX Fire Tech Spec Other Total
AK BLM 0 0 0 0 29 2 0 0 0 31 ST 0 1 0 0 1 1 0 0 0 3 Total 0 1 0 0 30 3 0 0 0 34
EA FWS 0 0 0 0 0 0 0 5 0 5 NPS 0 0 0 0 1 0 0 3 0 4
ST 1 1 2 0 4 0 0 0 3 11 USFS 2 3 2 1 10 1 0 0 0 19 Total 3 4 4 1 15 1 0 8 3 39
EB BIA 0 1 1 1 6 1 0 0 0 10 BLM 37 71 20 60 210 36 0 10 0 444 NPS 5 0 6 6 43 7 0 4 0 71 ST 5 6 7 30 56 12 0 7 0 123 USFS 155 69 156 514 781 241 1 78 3 1998 Total 202 147 190 611 1096 297 1 99 3 2646
FC BLM 15 7 2 0 17 1 0 17 0 59 NPS 1 0 1 0 0 5 0 9 0 16 USFS 6 16 7 11 15 7 0 3 0 65 Total 22 23 10 11 32 13 0 29 0 140
NO USFS 4 4 7 9 63 10 0 3 0 100 Total 4 4 7 9 63 10 0 3 0 100
Command Coor/Supp Finance Logistics Operation Planning RX Fire Tech Spec Other Total SO BLM 0 4 2 0 0 0 0 0 0 6
NPS 0 2 0 0 0 0 0 0 0 2 ST 0 0 1 0 0 1 0 0 0 2 USFS 1 26 7 20 45 5 0 32 0 136 Total 1 32 10 20 45 6 0 32 0 146
SW BIA 0 3 0 2 13 0 0 0 0 18 BLM 6 7 3 5 32 8 13 14 0 88 FEMA 22 6 5 0 20 3 0 7 0 63 FWS 0 0 0 0 19 0 0 4 0 23 NPS 66 15 53 121 219 71 5 58 4 612 ST 2 3 1 2 6 0 0 1 0 15 USFS 200 196 197 385 894 225 0 282 17 2396 Total 296 230 259 515 1203 307 18 366 21 3215
WB BLM 55 125 69 153 255 81 0 47 1 786 ST 4 0 11 11 12 10 0 2 0 50 USFS 4 8 8 13 27 9 0 11 0 80 Total 63 133 88 177 294 100 0 60 1 916 Grand Total
1638 1566 1508 3251 6282 1790 47 1720 96 17898

30
OVERHEAD CANCELLED
Command Coor/Supp Finance Logistics Operation Planning RX Fire Tech Spec Other Total NR BIA 5 14 24 52 88 11 0 15 0 209
BLM 5 23 13 37 82 17 0 1 0 178 NPS 4 0 4 6 11 5 0 0 0 30 ST 55 20 85 150 467 84 0 44 0 905 USFS 288 65 269 763 1624 394 2 156 9 3570 Total 357 122 395 1008 2272 511 2 216 9 4892
NW BIA 7 0 0 5 54 9 0 0 0 75 BLM 3 5 2 5 39 1 10 0 0 65 FWS 0 0 0 0 1 0 0 1 0 2 ST 0 0 4 3 63 2 0 0 0 72 USFS 9 20 17 37 231 13 0 2 0 329 Total 19 25 23 50 388 25 10 3 0 543
RM BIA 32 4 11 67 103 17 0 23 0 257 BLM 26 45 25 120 159 44 0 32 0 451 NPS 4 3 11 11 12 9 0 8 0 58 ST 15 19 13 45 59 16 0 13 0 180 USFS 41 39 45 115 289 58 1 24 0 612 Total 118 110 105 358 622 144 1 100 0 1558
SA FWS 0 2 1 1 3 0 1 0 0 8 NPS 2 0 2 12 4 5 0 1 0 26 ST 33 9 18 18 92 19 0 17 0 206 USFS 31 80 29 25 179 38 0 21 1 404 Total 66 91 50 56 278 62 1 39 1 644
SO BLM 0 2 0 1 1 0 0 1 0 5 NPS 0 1 0 0 1 0 0 0 0 2 ST 0 0 0 2 4 1 0 1 3 11 USFS 5 16 21 49 63 24 0 18 2 198 Total 5 19 21 52 69 25 0 20 5 216
SW BIA 0 3 0 0 15 0 0 1 0 19 BLM 7 2 5 9 17 9 0 0 0 49 FEMA 2 1 0 1 5 0 0 0 0 9 FWS 1 0 0 0 0 0 0 0 0 1 NPS 31 1 23 39 61 14 1 33 1 204 ST 0 0 0 0 3 0 0 0 0 3 USFS 83 42 82 148 231 70 1 115 0 772 Total 124 49 110 197 332 93 2 149 1 1057
WB BLM 49 45 65 145 389 71 0 35 1 800 ST 1 0 5 5 5 4 0 1 0 21 USFS 11 13 19 24 55 13 0 18 0 153 Total 61 58 89 174 449 88 0 54 1 974 Grand Total
981 653 1004 2527 5646 1272 17 720 23 12843

31
Ordering GACC
Ordering Agency
Functions
Command Coor/Supp Finance Logistics Operation Planning RX Fire Tech Spec Other Total
AK BLM 0 0 0 0 2 0 0 1 0 3 ST 0 1 1 0 0 0 0 0 0 2 Total 0 1 1 0 2 0 0 1 0 5
EA NPS 0 0 0 1 0 0 0 5 0 6 ST 0 0 1 0 0 0 0 0 0 1
USDA 0 0 0 0 0 0 0 1 0 1 USFS 5 1 0 0 0 0 0 0 0 6 Total 5 1 1 1 0 0 0 6 0 14
EB BLM 0 16 1 6 48 1 0 3 0 75 NPS 11 0 0 2 5 1 0 0 0 19 ST 0 0 0 0 3 0 0 0 0 3 USFS 25 29 11 74 177 36 1 21 2 376 Total 36 45 12 82 233 38 1 24 2 473
FC BLM 1 1 0 0 0 0 0 1 0 3 FWS 0 0 0 0 0 0 0 1 0 1 Total 1 1 0 0 0 0 0 2 0 4
NO BLM 0 0 0 0 1 0 0 0 0 1 USFS 0 0 0 1 2 0 0 0 0 3 Total 0 0 0 1 3 0 0 0 0 1
NR BIA 5 0 2 6 9 2 0 0 0 24 BLM 0 5 3 11 20 2 0 0 0 41 NPS 0 0 0 0 9 0 0 0 0 9 ST 4 3 5 22 92 13 0 0 0 139 USFS 93 18 30 99 449 86 2 37 1 815 Total 102 26 40 138 579 103 2 37 1 1028
NW BLM 0 1 1 1 8 1 0 0 0 12 ST 0 0 0 1 7 0 0 1 0 9 USFS 0 2 1 0 22 0 0 2 0 27 Total 0 3 2 2 37 1 0 3 0 48
RM BIA 3 0 4 1 20 5 0 13 0 46 BLM 1 8 5 3 22 0 0 3 0 42 FWS 0 0 0 0 0 0 0 1 0 1 NPS 0 0 0 0 6 0 0 3 0 9 ST 6 2 0 1 1 2 0 0 0 12 USFS 1 6 3 11 5 1 0 1 0 28 Total 11 16 12 16 54 8 0 21 0 138
SA BIA 0 0 0 0 0 1 0 0 0 1 FWS 0 0 0 0 1 0 0 0 0 1 ST 2 2 8 0 4 0 0 0 0 16 USFS 8 43 13 4 91 5 0 14 0 178 Total 10 45 21 4 96 6 0 14 0 196
SO BLM 0 0 0 0 20 0 0 0 0 20 USFS 5 12 0 11 24 4 0 17 0 73 Total 5 12 0 11 44 4 0 17 0 93
OVERHEAD UNABLE-TO-FILL

32
OVERHEAD UNABLE-TO-FILL
Command Coor/Supp Finance Logistics Operation Planning RX Fire Tech Spec Other Total SW BIA 0 0 0 0 3 0 0 0 3
BLM 1 6 0 0 1 0 0 2 0 10 FEMA 5 1 1 0 4 0 0 3 0 14 FWS 0 0 0 0 2 0 0 0 0 2 NPS 27 3 20 22 17 11 0 8 3 111 ST 1 2 0 0 5 0 0 0 0 8 USFS 32 42 40 36 71 45 0 45 1 312 Total 66 54 61 58 103 56 0 58 4 460
WB BLM 4 35 2 7 23 3 0 5 0 79 ST 1 0 1 5 1 0 0 0 0 8 USFS 2 6 2 0 3 1 0 4 0 18 Total 7 41 5 12 27 4 0 9 0 105 Grand Total
243 245 155 325 1178 220 3 192 7 12843

33
114
63
94
47
195
53
159
30
69
121
155
020406080
100120140160180200
1990 1991 1992 1993 1994 1995 1996 1997 1998 1999 2000
Mobile Food Service Mobilization
Cancelled UTF AK 5 0 EA 2 0 EB 0 2 NO 1 4 NR 7 4 NW 2 11 RM 9 3 SA 0 0 SO 1 5 SW 4 2 WB 1 6 FC 1 0
The National Interagency Coordination Center processed a total of 223 requests for mobile food services, of which 155 were mo-bilized, 31 were cancelled and 37 were unable-to-fill. The Coor-dination Center carries contracts with 10 vendors who provide 19 Mobile Food Service Units for incident support nationwide.
Mobile Food Requests Cancelled/UTF
02468
1012
AK EA EB NO NR
NW RM SA SO SW WB FC
CancelledUTF

34
118
71
113
39
256
55
167
3266
131
187
0
50
100
150
200
250
300
1990 1991 1992 1993 1994 1995 1996 1997 1998 1999 2000
Shower Mobilization
Cancelled UTF AK 0 0 EA 0 0 EB 7 4 NO 1 1 NR 11 2 NW 5 7 RM 11 1 SA 0 0 SO 0 2 SW 1 1 WB 3 0 FC 2 0
The National Interagency Coordination Center maintains 13 vendors who provide 23 Mobile Shower Facilities for incident support. The National Interagency Coordination Center proc-essed a total of 246 requests for shower units, of which 187 were filled, 41 were cancelled and 18 were unable-to-fill.
Show ers Cancelled/UTF
02468
1012
AK EA EB NO NR
NW RM SA SO SW WB FC
CancelledUTF

35
BIA BLM NPS ST USFS Total EB 0 0 0 0 4 4 NO 0 0 0 0 1 1 NR 1 1 0 4 17 23 NW 1 0 0 0 0 1 RM 0 0 0 0 1 1 SO 0 0 0 0 1 1 SW 0 0 2 0 2 4
Total 2 1 2 4 26 35
BIA BLM NPS ST USFS Total EB 0 0 0 0 4 4 NO 0 0 0 0 1 1 NR 1 1 0 4 18 24 NW 1 0 0 0 1 2 RM 0 0 0 0 1 1 SO 0 0 0 0 1 1 SW 0 0 2 0 3 5
Total 2 1 2 4 29 38
The National Interagency Fire Center maintains national contracts with seven vendors who provide 21 commissary units for incident support. The National Interagency Coordination Center processed a total of 38 requests of which 35 were mobilized and three were can-celled.
National Contract Commissary

36
RADIO SYSTEMS/ATMU REQUESTED 1836 = ATMU, 4312 = Tactical Repeater Kits, 4381 = Tactical Radio Kits, 4390 = Radio Stystems
Ordering GACC
Resource Ordering Agency
BIA BLM FEMA FWS NPS ST USFS TOTAL
AK 4312 0 15 0 0 0 0 0 15 4381 0 17 0 0 0 2 0 19 4390 0 4 0 0 0 1 0 5 Total 0 36 0 0 0 3 0 39
EA 4312 0 0 0 0 2 6 3 11 4381 0 0 0 0 10 3 8 21
4390 0 0 0 0 0 3 7 10 Total 0 0 0 0 12 12 18 42
EB 1836 0 2 0 0 1 1 14 18 4312 0 4 0 0 3 0 34 41 4381 0 4 0 0 1 0 53 58 4390 0 5 0 0 1 1 19 26 Total 0 15 0 0 6 2 120 143
FC 4312 0 0 0 0 0 0 3 3 4381 0 1 0 0 0 0 25 26 Total 0 1 0 0 0 0 28 29
NO 4312 0 0 0 0 0 0 6 6 4381 0 0 0 0 0 0 9 9 Total 0 0 0 0 0 0 15 15
NR 1836 1 1 0 0 0 4 16 22 4312 2 1 0 0 2 9 58 72 4381 4 3 0 0 2 27 111 147 4390 2 2 0 0 0 10 36 50 Total 9 7 0 0 4 50 221 291
NW 1836 0 0 0 0 0 0 2 2 4312 1 2 0 0 0 2 17 22 4381 3 6 0 1 0 1 23 34 4390 1 6 0 0 0 4 22 33 Total 5 14 0 1 0 7 64 91
RM 1836 1 3 0 0 0 1 4 9 4312 5 11 0 0 4 3 9 32 4381 3 8 0 0 2 14 19 46 4390 5 9 0 0 3 4 16 37 Total 14 31 0 0 9 22 48 124
SA 1836 0 0 0 0 2 1 11 14 4312 0 0 0 1 6 5 10 22 4381 0 0 0 2 12 17 12 43 4390 0 0 0 0 2 4 30 36 Total 0 0 0 3 22 27 63 115

37
RADIO SYSTEMS/ATMU REQUESTED 1836 = ATMU, 4312 = Tactical Repeater Kits, 4381 = Tactical Radio Kits, 4390 = Radio Stystems
Ordering GACC
Resource Ordering Agency
BIA BLM FEMA FWS NPS ST USFS TOTAL
SO 1836 0 0 0 0 0 0 1 1 4312 0 4 0 0 0 4 4 12 4381 0 2 0 0 0 4 13 19 4390 0 0 0 0 0 1 10 11 Total 0 6 0 0 0 9 28 43
SW 1836 0 0 0 0 3 0 11 14 4312 0 0 0 2 6 0 19 27 4381 0 0 1 1 17 0 32 51 4390 2 1 0 0 5 2 29 39 Total 2 1 1 3 31 2 91 131
WB 1836 0 5 0 0 0 0 1 6 4312 0 13 0 0 0 1 0 14 4381 0 16 0 0 0 0 0 16 4390 0 17 0 0 0 2 6 25 Total 0 51 0 0 0 3 7 Grand Total
30 162 1 7 84 137 703 1124

38
N A T I O N A L I N T E R A G E N C Y C O O R D I N A T I O N C E N T E R
2000
Aviation

39
AIR ATTACK AIRCRAFT
Ordering GACC Requests Mobilized Cancelled UTF Ordering
Agency Requests Mobilized Cancelled UTF
AK BIA 6 2 4 EA 3 3 BLM 36 17 17 2 EB 46 19 20 7 FWS NO NPS 7 4 3 NR 43 23 16 4 ST 31 26 4 1 NW 3 1 2 USFS 122 65 37 20 RM 40 22 17 1 Total 202 114 65 23 SA 24 22 2 SO SW 28 13 7 8 WB 13 9 3 1 FC 2 2
Total 202 114 65 23
INFRARED AIRCRAFT
Ordering GACC Requests Mobilized Cancelled UTF Ordering
Agency Requests Mobilized Cancelled UTF
AK 1 1 BIA 11 7 4 EA 4 3 1 BLM 76 55 4 17 EB 536 346 9 181 FWS NO 36 24 1 11 NPS 22 13 9 NR 677 366 3 308 ST 100 60 2 38 NW 53 35 2 16 USFS 1273 759 20 494 RM 77 48 4 25 NIC 1 1 SA 5 3 1 1 Total 1483 895 26 562 SO 17 8 9 SW 47 40 3 4 WB 30 21 2 7
Total 1483 895 26 562
LEAD PLANES
Ordering GACC Requests Mobilized Cancelled UTF Ordering
Agency Requests Mobilized Cancelled UTF
AK BIA 6 1 5 EA 2 2 BLM 34 21 8 5 EB 23 12 8 3 FWS NO 3 1 2 NPS 5 5 NR 19 15 2 2 ST 10 7 NW 4 3 1 USFS 138 90 2 1 RM 43 24 16 3 NIC 1 1 33 15 SA 34 22 4 8 Total 194 125 48 21 SO 2 2 SW 32 21 9 2 WB 25 18 5 2 FC 7 7
Total 194 125 48 21

40
5132
76
26
142
30
115
51
101115
148
0
20
40
60
80
100
120
140
160
1990 1991 1992 1993 1994 1995 1996 1997 1998 1999 2000
Type 1 Helicopter Mobilization
Cancelled UTF AK 0 0 EA 0 0 EB 44 3 NO 2 3 NR 45 0 NW 21 0 RM 11 0 SA 2 0 SO 5 0 SW 4 0 WB 4 0 FC 0 0
The National Interagency Coordination Center processed a total of 292 requests for Type 1 Helicopters, of which 148 were mo-bilized, 138 were cancelled and 6 requests were unable-to-fill.
Type 1 Helicopter Cancelled/UTF
01020304050
AK EA EB NO NR NW RM SA SO SW WB FC
CancelledUTF

41
Type 2 Helicopter Mobilization
147113
182
84
202
77
312
74
185
274 282
0
50
100
150
200
250
300
350
1990 1991 1992 1993 1994 1995 1996 1997 1998 1999 2000
Cancelled UTF AK 0 0 EA 0 0 EB 65 6 NO 1 0 NR 57 16 NW 20 1 RM 24 1 SA 7 0 SO 7 1 SW 13 8 WB 14 6 FC 0 0
The National Interagency Coordination Center processed a total of 520 requests for Type 2 Helicopters, of which 282 were successfully filled, 211 were cancelled and 27 were unable-to fill.
Type 2 Helicopter Cancelled/UTF
0
20
40
60
80
AK EA EB NO NR NW RM SA SO SW WB FC
CancelledUTF

42
180
83
147110
349
147
319
69
135171
387
0
50
100
150
200
250
300
350
400
1990 1991 1992 1993 1994 1995 1996 1997 1998 1999 2000
Air Tanker Mobilization
Cancelled UTF AK 0 0 EA 2 1 EB 25 8 NO 4 0 NR 10 3 RM 5 4 SA 1 0 SO 11 9 SW 10 8 WB 15 6 FC 0 0
The National Interagency Coordination Center processed a total of 548 requests for Air Tankers, of which 387 were mobilized, 122 were cancelled and 39 were unable-to fill.
A ir T a n k e r C a n c e lle d /U T F
0
1 0
2 0
3 0
4 0
AK EA EB NO NR
NW RM SA SO SW WB
C a n c e lle dU T F

43
0.528
0
0.447 0.465
5.037
0.011
1.068
0 00.073
2.1
0
1
2
3
4
5
6
1990 1991 1992 1993 1994 1995 1996 1997 1998 1999 2000
MAFFS Air Tanker Gallons Delivered (Millions)
C-130 MAFFS
Blodgett/Trailhead, August 2000
44
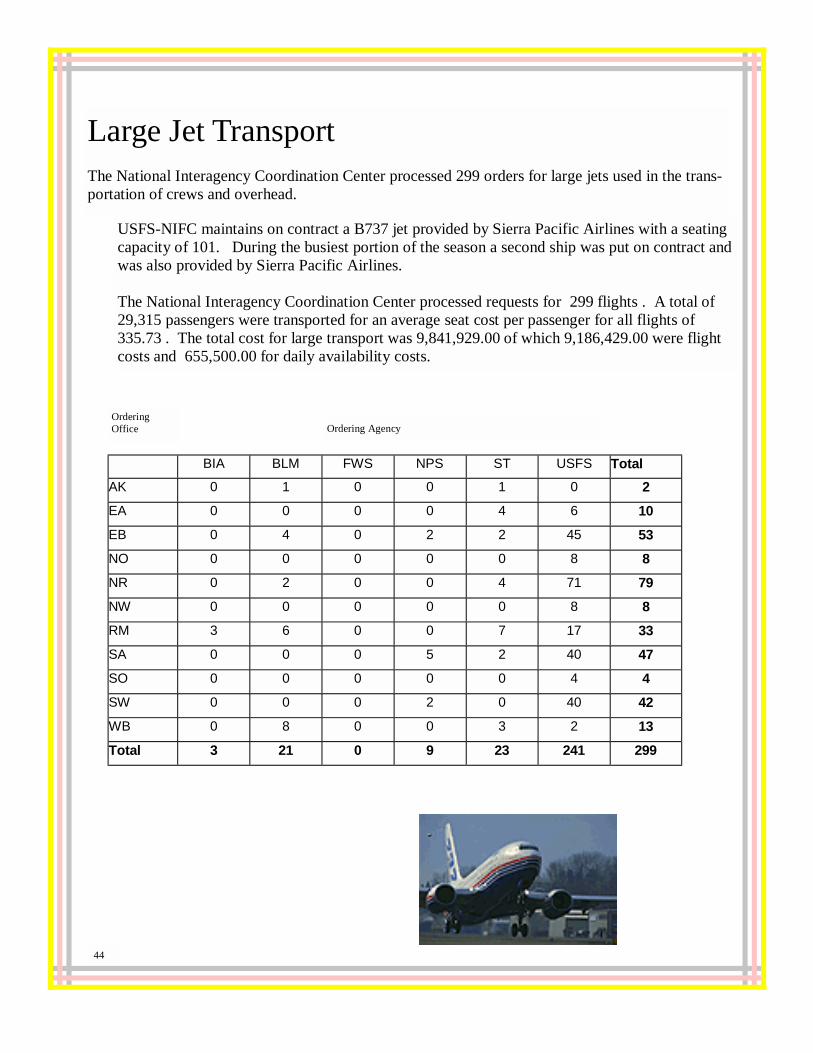
Large Jet Transport The National Interagency Coordination Center processed 299 orders for large jets used in the trans-portation of crews and overhead.
BIA BLM FWS NPS ST USFS Total AK 0 1 0 0 1 0 2 EA 0 0 0 0 4 6 10 EB 0 4 0 2 2 45 53 NO 0 0 0 0 0 8 8 NR 0 2 0 0 4 71 79 NW 0 0 0 0 0 8 8 RM 3 6 0 0 7 17 33 SA 0 0 0 5 2 40 47 SO 0 0 0 0 0 4 4 SW 0 0 0 2 0 40 42 WB 0 8 0 0 3 2 13 Total 3 21 0 9 23 241 299
USFS-NIFC maintains on contract a B737 jet provided by Sierra Pacific Airlines with a seating capacity of 101. During the busiest portion of the season a second ship was put on contract and was also provided by Sierra Pacific Airlines. The National Interagency Coordination Center processed requests for 299 flights . A total of 29,315 passengers were transported for an average seat cost per passenger for all flights of 335.73 . The total cost for large transport was 9,841,929.00 of which 9,186,429.00 were flight costs and 655,500.00 for daily availability costs.
Ordering Office Ordering Agency

45
The following table reflects number of flights, number of personnel and total cost for the large trans-port aircraft that the National Interagency Fire Center carried on exclusive use contract.
BIA BLM FWS NPS ST USFS Total AK 0 1 0 0 1 0 2
0 94 0 0 81 0 175 $0.00 $33,320.00 $0.00 $0.00 $31,144.00 $0.00 $64,464.00
EA 0 0 0 0 2 3 5 0 0 0 0 120 260 380 $0.00 $0.00 $0.00 $0.00 $43,078.00 $82,443.00 $125,521.00
EB 0 2 0 0 0 28 30 0 180 0 0 0 2591 2771 $0.00 $44,302.00 $0.00 $0.00 $0.00 $597,155.00 $641,457.00
NO 0 0 0 0 0 0 0 0 0 0 0 0 0 0 $0.00 $0.00 $0.00 $0.00 $0.00 $0.00 $0.00
NR 1 2 0 0 2 38 43 100 200 0 0 201 3641 4142 $19,992.00 $48,926.00 $0.00 $0.00 $27,030.00 $772,252.00 $868,200.00
NW 0 0 0 0 0 4 4 0 0 0 0 0 400 400 $0.00 $0.00 $0.00 $0.00 $0.00 $63,614.00 $63,614.00
RM 2 6 0 0 6 10 24 200 580 0 0 600 881 2261 $83,878.00 $72,556.00 $0.00 $0.00 $118,615.00 $190,782.00 $465,831.00
SA 0 0 0 1 0 19 20 0 0 0 100 0 1743 1843 $0.00 $0.00 $0.00 $35,150.00 $0.00 $538,265.00 $573,415.00
SO 0 0 0 0 0 2 2 0 0 0 0 0 200 200 $0.00 $0.00 $0.00 $0.00 $0.00 $53,550.00 $53,550.00
SW 0 0 0 2 0 18 20 0 0 0 178 0 1612 1790 $0.00 $0.00 $0.00 $35,768.00 $0.00 $324,720.00 $360,488.00
WB 0 6 0 0 1 1 8 0 580 0 0 100 100 780 $0.00 $111,418.00 $0.00 $0.00 $32,266.00 $13,940.00 $157,624.00
FC 0 0 0 0 0 6 0 0 0 0 0 236 236 $0.00 $0.00 $0.00 $0.00 $0.00 $132,940.00 $132,940.00
Total 3 17 0 3 12 129 164 300 1634 0 278 1102 11664 14978 $103,870.00 $310,522.00 $0.00 $70,918.00 $252,133.00 $2,769,661.00 $3,507,104.00
Ordering Office
Ordering Agency

46
This table shows the total number of flights, personnel and costs for each ordering geographical area office and ordering agency that was provided by call-when-needed large transport aircraft.
BIA BLM FWS NPS ST USFS Total AK 0 0 0 0 0 0 0
0 0 0 0 0 0 0 $0.00 $0.00 $0.00 $0.00 $0.00 $0.00 $0.00
EA 0 0 0 0 2 3 5 0 0 0 0 160 260 420 $0.00 $0.00 $0.00 $0.00 $47,195.00 $127,360.00 $174,555.00
EB 0 2 0 2 2 18 24 0 180 0 200 200 1740 2320 $0.00 $47,056.00 $0.00 $40,250.00 $113,460.00 $650,488.00 $851,254.00
NO 0 0 0 0 0 0 0 0 0 0 0 0 0 0 $0.00 $0.00 $0.00 $0.00 $0.00 $0.00 $0.00
NR 1 0 0 0 2 33 36 80 0 0 0 200 3556 3836 $31,970.00 $0.00 $0.00 $0.00 $65,987.00 $1,445,623.00 $1,543,580.00
NW 0 0 0 0 0 4 4 0 0 0 0 0 420 420 $0.00 $0.00 $0.00 $0.00 $0.00 $164,710.00 $164,710.00
RM 1 0 0 0 2 33 36 100 0 0 0 180 782 1062 $25,000.00 $0.00 $0.00 $0.00 $40,491.00 $218,233.00 $283,724.00
SA 0 0 0 4 2 21 27 0 0 0 440 380 2285 3105 $0.00 $0.00 $0.00 $222,145.00 $168,766.00 $1,100,896.00 $1,491,807.00
SO 0 0 0 0 0 2 2 0 0 0 0 0 220 220 $0.00 $0.00 $0.00 $0.00 $0.00 $82,645.00 $82,645.00
SW 0 0 0 0 0 22 22 0 0 0 0 0 2334 2334 $0.00 $0.00 $0.00 $0.00 $0.00 $837,419.00 $837,419.00
WB 0 3 0 0 2 1 6 0 200 0 0 100 100 400 $0.00 $87,395.00 $0.00 $0.00 $59,810.00 $18,744.00 $165,949.00
FC 0 0 0 0 0 2 2 0 0 0 0 0 200 200 $0.00 $0.00 $0.00 $0.00 $0.00 $83,682.00 $83,682.00
Total 2 5 0 6 12 139 164 180 380 0 640 1220 11897 14317 $56,970.00 $134,451.00 $0.00 $262,395.00 $495,709.00 $4,729,800.00 $5,679,325.00
Ordering Office
Ordering Agency