National Drought Management Authority Tana River County ...
17
National Drought Management Authority Tana River County Drought Early Warning Bulletin for June 2021 JUNE EW PHASE Early Warning Phase Classification LIVELIHOOD ZONE EW PHASE TRENDS Drought Situation & EW Phase Classification Drought Phase: ALERT-WORSENING Biophysical Indicators Biophysical indicators are showing negative trends away from expected seasonal ranges. Below average amount of rainfall were received in the month of June 2021. The June Vegetation Condition Index values for Tana North-Bura,Galole and Tana river sub- county are below normal and indicating moderate drought for the county. The Water levels in most water pans were below normal at 3(10%-40%) in Pastoral and Marginal mixed livelihood zones. Socio Economic Indicators (Impact Indicators) Production indicators: The forage condition is poor in pastoral and marginal mixed but fair in mixed farming livelihoods in both quality and quantity. Livestock body condition is fair to good in mixed and fair to poor in marginal mixed and pastoral livelihood zones. Milk production is below average in Pastoral and marginal mixed livelihood zones. This is attributed to poor forage and pasture conditions. Early Livestock migrations were reported towards the traditional grazing fields. Access indicators Terms of trade still above normal range but on a decreasing trend due in decreasing prices of maize and increasing goat prices. Distances to water sources for households currently above averages compared to normal. Utilization indicators: The number of under-fives at risk of malnutrition currently on the increase compared to normal. Copping strategy index for households is on an increasing trend due to below average milk production. Indicating more households are currently food insecure. PASTORAL ALERT WORSENING MARGINAL MIXED ALERT WORSENING MIXED FARMING ALERT WORSENING COUNTY ALERT WORSENING Biophysical Indicators Value for the month Tana River LTA-Monthly Tana River Normal ranges Kenya % Average rainfall MM (%) 2.00 mm 77 mm 80-120 VCI-3month 27.48 35-50 % Of water in the water pan 3(10-40%) 5-6 Production indicators Value Normal ranges Livestock Migration Pattern Not normal Normal Livestock Body Condition 3-4 4-5 Milk Production (Ltr /HH/Month) 4.2 3.77 Livestock deaths (for drought) No death No death Access Indicators Value Normal ranges Terms of Trade (ToT) 100.6 >=64 Milk Consumption (Ltr) 1.7 >=2.40 Water for Households-trekking distance (km) 5.0 <=4.5 Distances to grazing for livestock (km) 11.6 <=12.2 km Seasons production (90 kg bags)(by January 2021) 6,618(maize) 3,598(green grams) LTA (27,687(bags) LTA (10,810(bags) Utilization indicators Value Normal ranges At Risk (%) 18.0% <13.10% CSI 14.89% <=15.0 Short rains harvests Short dry spell Reduced milk yields Increased HH Food Stocks Land preparation Planting/Weeding Long rains High Calving Rate Milk Yields Increase Long rains harvests A long dry spell Land preparation Increased HH Food Stocks Kidding (Sept) Short rains Planting/weeding Jan Feb Mar Apr May Jun Jul Aug Sept Oct Nov Dec
Transcript of National Drought Management Authority Tana River County ...

National Drought Management Authority Tana River County
Drought Early Warning Bulletin for June 2021 JUNE EW PHASE Early Warning Phase Classification
LIVELIHOOD ZONE EW PHASE TRENDS
Drought Situation & EW Phase Classification
Drought Phase: ALERT-WORSENING
Biophysical Indicators
Biophysical indicators are showing negative
trends away from expected seasonal ranges.
Below average amount of rainfall were received
in the month of June 2021.
The June Vegetation Condition Index values for
Tana North-Bura,Galole and Tana river sub-
county are below normal and indicating moderate
drought for the county.
The Water levels in most water pans were below
normal at 3(10%-40%) in Pastoral and Marginal
mixed livelihood zones.
Socio Economic Indicators (Impact Indicators)
Production indicators:
The forage condition is poor in pastoral and
marginal mixed but fair in mixed farming
livelihoods in both quality and quantity.
Livestock body condition is fair to good in mixed
and fair to poor in marginal mixed and pastoral
livelihood zones.
Milk production is below average in Pastoral and
marginal mixed livelihood zones. This is
attributed to poor forage and pasture conditions.
Early Livestock migrations were reported
towards the traditional grazing fields.
Access indicators
Terms of trade still above normal range but on a
decreasing trend due in decreasing prices of
maize and increasing goat prices.
Distances to water sources for households
currently above averages compared to normal.
Utilization indicators:
The number of under-fives at risk of malnutrition
currently on the increase compared to normal.
Copping strategy index for households is on an
increasing trend due to below average milk
production. Indicating more households are
currently food insecure.
PASTORAL ALERT WORSENING
MARGINAL MIXED ALERT WORSENING
MIXED FARMING ALERT WORSENING
COUNTY ALERT WORSENING
Biophysical
Indicators
Value for
the month
Tana River
LTA-Monthly
Tana River
Normal ranges
Kenya %
Average rainfall
MM (%)
2.00 mm 77 mm 80-120
VCI-3month 27.48 35-50
% Of water in the
water pan
3(10-40%) 5-6
Production indicators Value Normal ranges
Livestock Migration Pattern Not normal Normal
Livestock Body Condition 3-4 4-5
Milk Production (Ltr /HH/Month) 4.2 3.77
Livestock deaths (for drought) No death No death
Access Indicators Value Normal ranges
Terms of Trade (ToT) 100.6 >=64
Milk Consumption (Ltr) 1.7 >=2.40
Water for Households-trekking
distance (km)
5.0 <=4.5
Distances to grazing for livestock
(km)
11.6 <=12.2 km
Seasons production (90 kg
bags)(by January 2021)
6,618(maize)
3,598(green
grams)
LTA (27,687(bags)
LTA (10,810(bags)
Utilization indicators Value Normal ranges
At Risk (%) 18.0% <13.10%
CSI 14.89% <=15.0
Short rains harvests
Short dry spell Reduced milk
yields Increased HH Food Stocks
Land preparation
Planting/Weeding Long rains High Calving Rate Milk Yields Increase
Long rains harvests A long dry spell Land preparation Increased HH Food Stocks Kidding (Sept)
Short rains Planting/weeding
Jan Feb Mar Apr May Jun Jul Aug Sept Oct Nov Dec

Fig.2.source: Continental Africa Dekadal
RFE.
Fig.3.source: LST-C6
1. CLIMATIC CONDITIONS
1.1 RAINFALL PERFORMANCE
Rainfall station data (GROUND DATA:)
Fig .1.source: VAM-WFP
An average of 2.00 mm rainfall was recorded in June coupled with decreasing temperatures. This is below
the LTA of 77 mm.Most wards did not receive any substantial amount of rainfall during the month. But
during the long rains season,ward that received poor distributions of rains were:Sala ward,Madogo
ward,Hirimani ward,Chewele ward,Wayu ward,Chewani ward,Kinakomba ward,Garsen west and Garsen
south wards.
1.2.RAINFALL TEMPORAL AND SPATIAL DISTRIBUTION
In the month of June, on average 0.01 mm of rainfall was received in Tana
North(Bura), 2.80 mm received in Galole sub-county and 3.40 mm received in
Tana Delta(Garsen) respectively. Most wards received between 0.00 mm to 2.00
mm across the county. The amounts received were below normal at this time of
the year. Spatial and temporal distribution was poor.
The rainfalls were unevenly distributed across all the three sub-counties. Most
wards had not received any substantial amount of rainfall by 20th June 2021.
1.3. TEMPERATURES 1.3.1. LAND SURFACE TEMPERATURE (LST)
The June 2021 land surface temperature (LST) values for Tana River County decreased to 39.610C by the
2nd dekad of June, which is above normal (38.040C) at this time of the year.
Jan Feb Mar Apr May Jun Jul Aug Sep Oct Nov Dec
LTA 65 11 74 171 113 77 23 28 20 196 276 140
2021 1.8 2.2 0.4 18.7 6.75 2
0
50
100
150
200
250
300
Rain
fall
amou
nts(
mm
)Ground Rainfall Distribution

Fig.5.Source: NDVI-C6
2.1. IMPACTS ON VEGETATION AND WATER 2.1.1. VEGETATION CONDITION INDEX (VCI)
The June vegetation cover for Tana River County shows moderate vegetation deficit for the county across
all the three sub-counties. The current trend continue to worsen in the three sub-counties compared to the
month of May 2021.Tana North,Galole and Tana Delta are currently experiencing moderate drought.
COUNTY Sub
County
VCI as at 31st May 2021 VCI as at 30th June 2021
TANA
RIVER
County 29.94 27.48 Decreasing trends in vegetation
conditions experienced in the
county, all sub counties
recorded a decrease in
vegetation cover.Tana
North,Tana Delta and Tana
River sub counties currently in
Moderate drought
Bura 28.89 27.71 Galole 24.34 20.74 Garsen 34.33 31.49
Fig.4. Source BOKU
The information provided above reflects Tana River County is currently experiencing moderate drought,
decreasing trend is observed across all the three sub-counties compared to the previous month.
Fig.5.Source BOKU
In June 2021 the vegetation cover for Tana River County was at 27.48, which indicates moderate drought condition.
In comparison to the previous month the current vegetation cover has decreased in quantity and quality.
The NDVI for Tana River County is currently showing decreasing trend in June 2021(0.29) which is stable
compared to the LTA (0.29). This is attributed to decrease to amount of rains during the month.

Figure 6:Tana River pasture conditions
Figure 7: Tana River browse
conditionscccoconditions
Figure 8:Tana River water sources
.Pasture
The pasture condition is fair to poor in quantity and quality in Pastoral and
marginal mixed livelihood zones but the pasture conditions are fair in mixed
livelihood zones due to light showers received in the month of May 2021.
The current pasture is expected to last for less than one month in Pastoral
and marginal mixed and two months in the Mixed farming livelihood zones.
2.1.3.Browse
The browse condition is fair to poor in quantity and quality across all
livelihood zones which is normal at this time of the year.
The available browse is expected to last for less than one month in Pastoral
and Marginal mixed livelihood Zones and two month in mixed farming
livelihood zone.
2.2 WATER RESOURCE 2.2.1 Sources
The main water sources for both livestock and human consumption across
all livelihoods were shallow wells (26.5%) ,Rivers and bore holes 23.5%,
Lakes(17.6%) and Pans and dams at (8.8%).Most water pans and dams were
at 10-40% of their full capacity. Most households are currently using
Shallow wells,Bore holes and rivers. Bangale water pan at recharge level of
about 40% of its full capacity. Currently water levels is decreasing due to
high concentrations of livestock and humans. Water born diseases are on
the increase in pastoral livelihood zones.
The current water sources are expected to last for less than two months in
pastoral and Marginal mixed livelihood zones but three months in Mixed
livelihood zones.
Bore holes with high concentrations during the month are:Mororo-15000,,Boka-3000,Katumba/Kuriti-3500,bore
hole,Kamuthe/Chardende-8000. Galole:Wayu duka,Matagala,Haroresa,Chifiri,Lakole,Hakoa,Kesi,
Boji,Koticha,Wayu,Waldena,Titila.
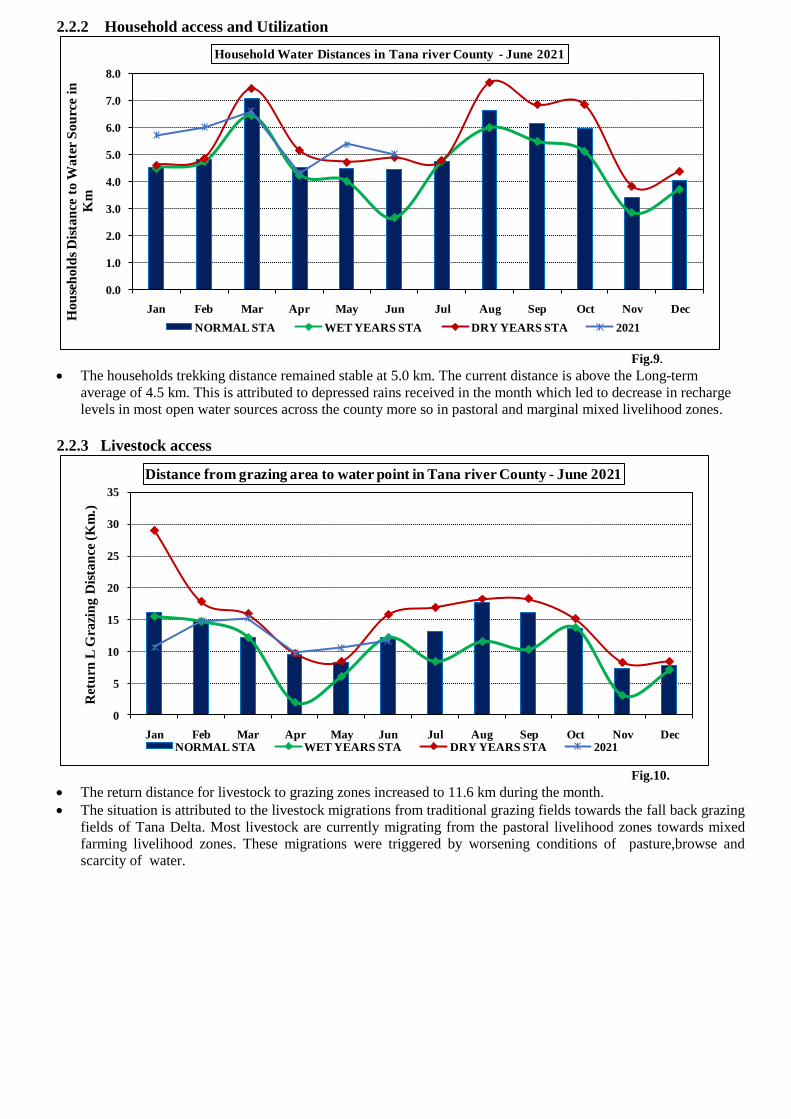
2.2.2 Household access and Utilization
Fig.9. The households trekking distance remained stable at 5.0 km. The current distance is above the Long-term
average of 4.5 km. This is attributed to depressed rains received in the month which led to decrease in recharge
levels in most open water sources across the county more so in pastoral and marginal mixed livelihood zones.
2.2.3 Livestock access
Fig.10.
The return distance for livestock to grazing zones increased to 11.6 km during the month.
The situation is attributed to the livestock migrations from traditional grazing fields towards the fall back grazing
fields of Tana Delta. Most livestock are currently migrating from the pastoral livelihood zones towards mixed
farming livelihood zones. These migrations were triggered by worsening conditions of pasture,browse and
scarcity of water.
0.0
1.0
2.0
3.0
4.0
5.0
6.0
7.0
8.0
Jan Feb Mar Apr May Jun Jul Aug Sep Oct Nov Dec
Ho
use
ho
lds
Dis
tan
ce t
o W
ate
r S
ou
rce
in
Km
Household Water Distances in Tana river County - June 2021
NORMAL STA WET YEARS STA DRY YEARS STA 2021
0
5
10
15
20
25
30
35
Jan Feb Mar Apr May Jun Jul Aug Sep Oct Nov Dec
Ret
urn
L G
razi
ng D
ista
nce
(K
m.)
Distance from grazing area to water point in Tana river County - June 2021
NORMAL STA WET YEARS STA DRY YEARS STA 2021
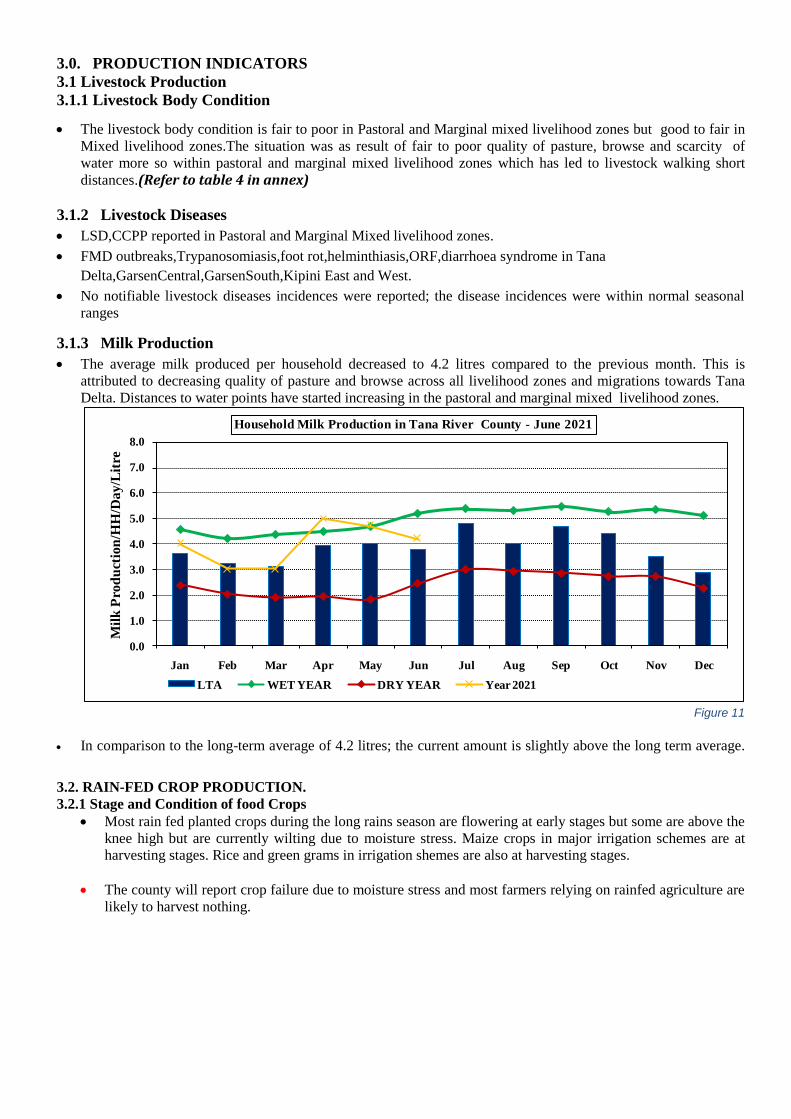
Figure 11
3.0. PRODUCTION INDICATORS
3.1 Livestock Production
3.1.1 Livestock Body Condition
The livestock body condition is fair to poor in Pastoral and Marginal mixed livelihood zones but good to fair in
Mixed livelihood zones.The situation was as result of fair to poor quality of pasture, browse and scarcity of
water more so within pastoral and marginal mixed livelihood zones which has led to livestock walking short
distances.(Refer to table 4 in annex)
3.1.2 Livestock Diseases
LSD,CCPP reported in Pastoral and Marginal Mixed livelihood zones.
FMD outbreaks,Trypanosomiasis,foot rot,helminthiasis,ORF,diarrhoea syndrome in Tana
Delta,GarsenCentral,GarsenSouth,Kipini East and West.
No notifiable livestock diseases incidences were reported; the disease incidences were within normal seasonal
ranges
3.1.3 Milk Production
The average milk produced per household decreased to 4.2 litres compared to the previous month. This is
attributed to decreasing quality of pasture and browse across all livelihood zones and migrations towards Tana
Delta. Distances to water points have started increasing in the pastoral and marginal mixed livelihood zones.
In comparison to the long-term average of 4.2 litres; the current amount is slightly above the long term average.
3.2. RAIN-FED CROP PRODUCTION.
3.2.1 Stage and Condition of food Crops
Most rain fed planted crops during the long rains season are flowering at early stages but some are above the
knee high but are currently wilting due to moisture stress. Maize crops in major irrigation schemes are at
harvesting stages. Rice and green grams in irrigation shemes are also at harvesting stages.
The county will report crop failure due to moisture stress and most farmers relying on rainfed agriculture are
likely to harvest nothing.
0.0
1.0
2.0
3.0
4.0
5.0
6.0
7.0
8.0
Jan Feb Mar Apr May Jun Jul Aug Sep Oct Nov Dec
Mil
k P
rod
uct
ion
/HH
/Da
y/L
itre
Household Milk Production in Tana River County - June 2021
LTA WET YEAR DRY YEAR Year 2021

4. MARKET PERFORMANCE
4.1. LIVESTOCK MARKETING
4.1.1 Cattle Prices
Fig.12.
The average price for the medium sized cattle increased by 15% to Ksh.29, 200 in the reporting month
as compared to Ksh.25, 200 of the previous month. This is attributed to the market dynamics in the current
month but this might change for the worse triggered by early migrations of livestock towards the fall back
grazing fields in search of good quality of pasture and browse.
4.1.2 Goat Prices
Fig.13.
The average price of a goat increased by 7% to Ksh.4,583 as compared to previous month. This was
attributed to market dynamics where market supply for goats reduced substantively thereby pushing the
prices upwards.
The average Goat prices were lowest in marginal mixed livelihood zones at Ksh. 3,833 and highest in
marginal mixed farming livelihood zones at Ksh.4,944.
5000.00
10000.00
15000.00
20000.00
25000.00
30000.00
35000.00
Jan Feb Mar Apr May Jun Jul Aug Sep Oct Nov Dec
Catt
le p
rice
(Ksh
s.)
Cattle Prices in Tana river County -June 2021
NORMAL STA WET YEARS STA DRY YEARS STA 2021
2000
2500
3000
3500
4000
4500
5000
5500
Jan Feb Mar Apr May Jun Jul Aug Sep Oct Nov Dec
Goats
pri
ce(K
shs.
)
Goats Prices in Tana River County -June 2021
Usual LTA Good Seasons Bad Seasons 2021

4.2. CROP PRICES
4.2.1 Maize
Fig.14.
The average price for kilogram maize increased by 2% to Ksh.45.60 during the month compared to the
previous month. This was attributed to scarcity of maize in the market due to below average seasonal
harvests and supply from Kilifi and Lamu counties which pushed the prices upwards. The prices were below
compared to the long-term average. The prices were higher in Pastoral livelihood zones at Ksh.50 per
kilogram.
4.3. Livestock Price Ratio/Terms of Trade
Fig .15.
The terms of trade increased from 95.4 in May 2021 to 100.6 during the month of June 2021.
The current term of trade is above the long-term average. This is attributed to increasing prices of goats
compared to maize in the market. Terms of trade is still favourable for the pastoralists in the current month.
15
20
25
30
35
40
45
50
55
60
Jan Feb Mar Apr May Jun Jul Aug Sep Oct Nov Dec
Ma
ize
pri
ce (
Ksh
s.)
Maize Prices in Tana River County -June 2021
NORMAL STA WET YEARS STA 2021

Figure 17:Tana River food consumption
5.1. FOOD CONSUMPTION AND NUTRITION STATUS
5.1.1. Milk Consumption
The average milk consumption per household decreased to 1.7 litres compared to the previous month. The
amount consumed is below the long term average at this time of the year.
Fig. 16.
5.1.2. Food Consumption Score
There was higher proportion of households with poor food consumption gaps in Pastoral and Mixed Livelihood
zones ,(41.7%) and (45.0%).Attributed to high food prices, lower purchasing power, crop failure, below average
milk and crop production.
The proportion of households with borderline food consumption score were high in Marginal Mixed livelihood
zones at 50.6%, lower in Mixed farming livelihood zones at 31.7%.
A proportion of 50.6% of households in marginal mixed livelihood zones have acceptable food consumption score
while 18.3% in Pastoral livelihood zones have acceptable food consumption score respectively.

Fig.19:Tana River Coping Strategy Index
5.1.3 Health and Nutrition Status
Fig.18.
The proportion of sampled children under five years of age at risk of malnutrition increased to 18.0%
compared to the previous month at 17.5%.This is attributed to decrease in milk production and consumption
at household levels more so within Pastoral and Marginal Mixed livelihood Zones.
5.2. Health
During the reporting month the commonly reported illnesses were skin diseases, diarrhoeas URTI, Malaria,
outbreak of water born diseases and skin diseases in all livelihood Zones.
5.3. COPING STRATEGIES
Coping Strategy Index
The average coping strategy index increased to 14.89 in June 2021 compared to last month. Meaning more
households experienced stress to access food given the prevailing conditions. This might have been due to biting
drought effects since February.
Households in Pastoral livelihood zones employed most coping strategies at 23.2 followed by Marginal mixed at
13.4.The mixed farming livelihood zones employed least coping mechanisms at 8.8.
0.0
5.0
10.0
15.0
20.0
25.0
30.0
Jan Feb Mar Apr May Jun Jul Aug Sep Oct Nov Dec
Pro
po
rtio
n o
f ch
ild
ren
at
risk
of
Ma
lnu
trio
tio
n i
n %
Tana River County Chldren at risk of malnutrition in - June 2021
NORMAL LTA DRY YEARS LTA WET YEARS LTA 2021

6. CURRENT INTERVENTION MEASURES.
6.1 Non-food interventions
Support of livestock farmers through registration of livestock farmers through indexed based livestock
insurance by CISP.
Land reclamation for fodder production and distribution of pasture seeds in Garsen central and Garsen South
by CISP and Nature Kenya
Rehabilitation of water structures(bore hole in Hurara)by CISP/WVK
Support of modern agriculture through home and school kitchen garden technology by CISP
Distributions of farm inputs to farmers in Tana North-by CWW
Distribution of dignity kits to floods affected households(325hhs) in Tana North by Aldef
Peace initiatives in marginal mixed and mixed livelihood zones by CISP/TPRD
WASH and covid 19 awareness supported by MOH/WVK/WC/GAA/PGI/KRCS/SAMARITAN and
Partners.
support on irrigation infrastructure for minor irrigation schemes prioritised by the county through
WFP/WVK
Support of extention services by departmental technical officers to boost food production by
WFP/Aldef/KRCS.
Integrated outreaches in hard to reach areas and provision of medical supplies to MOH supported by
CWW/UNICEF/WVK/WC/KRCS.
Capacity building of health workers on maternal ,infant and young children nutrition-WVK
Covid cushioning cash transfer targeting 10,000 household and 15 CHVs by GoK/Aldef(1000 shillings
weekly)
Vaccination of livestock in Matanya,bula salama,rhoka and kumbi villages-by GAA
Construction of class rooms and installation of water harvesting structures-by GAA
Distribution of farm inputs to farmers in Tana Delta by Nature Kenya.
6.2 Food Aid
Distribution of pulses, cereals and vegetable oil to 5,833 beneficiaries in all sub counties across
Tana River by WFP/KRCS(sfsp)
Normally, total number of schools benefiting from SMP are 178 out of which 22,768 are boys while
21,574 are girls.School meals programmes(SMP )still not available to primary schools after re-
opening.
7.0 .EMERGING ISSUES
7.0.1.Insecurity/Conflict/Human Displacement
Due to early migration of livestock to fall back grazing areas, resource based conflicts has been reported in
Tana Delta areas of Mnazini where 28 herds of cattle were chopped off and one person killed.
Human wild life conflicts reported in Sala,Nanighi,Saka,Kipini,Chara and Kilelengwani.
Hot spot areas with water stress are: Tana North; Walgaa,Kbc,Mombasa
Junction,Yakirit,Bisangersa,Tula,Bultobanta,Elrar,Kamagur,Abakik,Kaabso,Diid,Hamares,Balle Neka,Miti
Boma,Biole,Dukanotu,Kotidimu,Shilil village,Sukelekona village,Wayamaoro,Gelmad Village,Dolola Garse
village, komora dukub village,Labiyarow village,Woles Kambi in Bangale ward,Sala Ward and Chewele.
Tana Delta-Assa,Hurara,IDI,Chirfa, Onjila,Dase,Odoganda
7.0.2. Migration - limited to migrations of persons.
Livestock migrations towards the fall back grazing fields of mixed farming are on the increase and this is
attributed to poor conditions of pasture and browse in Pastoral and marginal mixed livelihood zones. Herds
of livestock have been spotted migrating towards Tana Delta. This is NOT normal during this time of the
year. Given the fair to poor conditions of pastures and browse and scarcity of water resources in Pastoral
livelihood zones, livestock are forced to move towards the Delta regions.

7.0.3. Food Security Prognosis
Based on the below average long rains performance and under production during the short rains of 2020 and
long rains of 2021, food commodity prices in general and specifically cereal prices in the county are likely to
increase above the long term average prices in the next two months.
Livestock prices driven by below-average forage and water resources are expected to remain below-average
due to unfavourable body conditions in the next three months,
According to the Desert Locust Global Forecast by FAO, the second-generation desert locust swarms are
migrating northwards facilitated by the prevailing winds into Ethiopia and South Sudan reducing the
prevalence in Kenya thus causing minor damage to crop and rangeland resources.
Forage and water resources are expected to be below normal through September due to the below-average
March to May long rains and current below-normal vegetative conditions. However, the forecast of near-
average, March to May long rains will result in only short-lived improvements of forage and water resources
which will likely remain below average from June through September. Early migrations towards the fall
back grazing fields expected in the next few months.
Based on available information from the Ministry of Health and leading local and international health
experts including the WHO, the number of confirmed COVID-19 cases is likely to rise between January and
March due to both the spread of the virus and increased testing thereby reinstating Covid-19 related
restrictions such as ban on travel and curfews are likely to impact on household livelihoods.
7.0.4. Phase Classification According to recently conducted rapid assessment report, Pastoral,Marginal mixed and Mixed livelihood zones
are classified under stressed Phase (IPC Phase 2). During the month most wards in Tana North received hardly
any amount of rains in the month of June, This has since triggered negative impacts on biophysical indicators
hence affecting most livelihoods but this is expected to change for the worse with the cessation of the long rains.
Approximately Over 5,000 are in urgent need of food assistance based on the recently conducted rapid food
security assessment. According to the short rains food security assessment report, Approximately 47,391 people
were in urgent need of food assistance, this number might triple based on the fact that the long rains season has
failed.
8.0 RECOMMENDATIONS
8.1.1. General Recommendations:
a) Implementation of Covid-19 response plans by Ministry of Health and partners .
b) Provision of pesticides to help in control of fall army worms and desert locusts.
c) Provision of clean water to areas with water stress more so Pastoral and Marginal mixed Livelihood
zones.
d) Enhance security surveillance and peace Barazas in hot spot areas of Tana Delta and Tana North.
e) Enhance integrated outreaches in hard to reach areas across all the sub-counties more so in flood affected
areas.
f) Upscaling of food aid to the population in need in Tana North,Tana River and Tana Delta sub-counties.
g) Installation of hand washing kits to existing schools in preparation for re-opening of schools.
h) Provision of storage facilities to help farmers store their long rains harvests to control destruction by
pests.
i) Mass vaccination of migrating herds to control the spread of livestock diseases.
j) Provision of storage facilities to farmers in preparation of short rains harvests.

8.1.2.PROPOSED RECOMMENDATIONS(SRA-2020)
Sub
Count
y
Interventio
n
Ward No. of
beneficiaries
Implementers Impacts in
terms of
food
security
Cost Time
Frame
Crops
All 3
Sub-
Count
ies
Trainings
on
Sustainable
food
production
Systems
All Wards All Profiled
farm Groups
(40 Grps )
Approx.1200
Members
Ministry of Agriculture,
WFP, KCSAP,WHH
Capacity
building of
farmers on
sustainable
food
production
systems to
improve
security
20 M 2018-
2023
All 3
Sub-
Count
ies
Provision
of timely
extension
services
All Wards All profiled
farm groups in
the sub-county
(112 Grps)
Ministry of Agriculture,
WFP, KCSAP,PGI,
Concern
worldwide,WHH
Technical
backstoppin
g, enhanced
adoption of
relevant
technology
and
innovation
40M 2020
Short
rains
All 3
Sub-
Count
ies
Subsidized
mechanizati
on and
provision
of inputs
All Wards 9000 HH Department of
Agriculture & Bura
farmers’ cooperative,
WHH
Enhanced
increase in
acreage
21.7M 2020
Short
rains
All 3
Sub-
Count
ies
Provision
of
Agroforestr
y seedlings-
Mikinduni,
Chewani,
Madogo,
Hirimani,
Kipini West
6 Profiled
Groups
Department of
agriculture, PGI, Kenya
Red Cross, WHH
Reduce soil
degradation
, Green
House Gas
Emission,
Environme
ntal
Conservatio
n, Improve
availability
of high
Quality
Germplasm
.
7M 2020
Short
rains
Tana
North,
Tana
River
Provision
of
subsidized
fertilizer
Bura and Hola
Scheme
Bura -6000
Bags,
Hola- 4000
Bags
Department of
agriculture & NIB,
YARA,FAO,WHH
Improved
production
and food
security
20 M 2020
Short
rains
All 3
Sub-
Count
ies
Provision
of Hermatic
Silos
Garsen North,
Kipini West,
Chewani,
Chewele,
Hirimani
11 Groups WFP, Department of
Agriculture
Reduction
of Losses
due to Post
Harvest
Handling
2M Short
Rains
Specific COVID-19 Interventions
Sub
Count
y
Intervention Ward No. of
beneficiaries
Implementers Impacts in
terms of
food
security
Cost Time
Frame
All 3
Sub-
Cash transfer
to farmers to
Chewele,
Madogo, Sala,
All Registered
Members
Department of
agriculture, ALDEF,
Improved
Farmer
8M Ongoin
g

Count
ies
build
resilience
against
drought,
locust
invasion and
flooding
Hirimani,
Chewani,
Wayu, Kipini
West
FAO, World Vision,
WHH
resilience
Livestock
Immediate interventions
All Distribution
of bee hives
and honey
harvesting
equipment
All wards 1000 County government and
WFP
Increase in
alternative
source of
income
12 M Jan –
March 2020
All Beef
fattening
All wards 500 KCSAP Increase
production
92M Jan 2020-
Jan 2022
All Improveme
nt of
livestock
markets
and sale
yards
All wards 1000 County government Increase
productivity
40M Jan 2020-
Jan 2022
All
Support
extension
services
All wards 1000 WFP Increase
productivity
50M Jan 2019-
jan 2022
All Promote
poultry
production
All wards 1000 WFP Increase
productivity
Jan 2019-
jan 2022
All Disease
surveillance
,
vaccination
s and
treatment
All wards 10,000 County governments and
partners
Increased
productivity
20M July 2020-
July 2022
Medium and long term interventions
All Livestock
insurance
Madogo,
Hirimani,
Chewele, Garsen
south, Kipini
West and Garsen
North, Garsen
south
2500 National Gov’t
Takaful insurance
Helps
maintain
the body
condition of
livestock
during feed
scarcity
31M From
2017 to
date
Health and nutrition
On- going interventions
Sub
Count
y
Intervention Ward No. of
beneficiari
es
Implementers Impacts in
terms of
food
security
Cost Time
Frame
All Vitamin A
Supplementation
All health
facilities
MOH/UNICEF/KRCS 0.5M On-Going
All Zinc
Supplementation
All health
facilities
MOH/UNICEF On-Going
All Management of
Acute
Malnutrition
(IMAM)
All health
facilities
MOH/KRCS/
UNICEF/WVK
On-Going

All IYCN
Interventions
(EBF and Timely
Intro of
complementary
Foods)
All health
facilities
MOH/KRCS/
UNICEF/WVK
On-Going
All Iron Folate
Supplementation
among Pregnant
Women
All health
facilities
MOH/KRCS/
UNICEF/ On-Going
All Deworming All
facilities
MOH/WORLDWIDE
CONCERN
/MOE
On Going
All Family MUAC All
sentinel
sites
TRCG/UNICEF/KRCS/N
DMA
0.5M Ongoing
All Food Fortification
Other public health interventions
All Screening
and sample
collection
of COVID-
19
All
facilities/border
points
MOH/TRCG 1.5M On
Going
All Sensitizatio
n on
COVID-19
COUNTY MOH/TRCG 0.5M Ongoin
g
All Handwashi
ng and
hygiene
promotion
County MOH/TRCG 0.3M Ongoin
g
All Training of
frontline
health care
workers on
COVID-19
case
managemen
t
All frontline
health care
workers
MOH/TRCG Ongoin
g
Education
On-going interventions
All RSMP County 178(49895
)
MOE/WFP Access,
retention,
participation
continuous ALL
ALL ESP desks
and lockers
3sub-counties 3470 MOE Ensure social
distance
Ongoing 991000
0
Water
Immediate On-going Interventions (Including Interventions in response to COVID-19 pandemic)
Sub
County/
Ward
Intervention Location No. of
beneficiari
es
Implementers Cost Time
Frame
Implementa
tion Status
(% of
completion)
Tana
River
1.Water trucking Boji mango 500 CGTR 0.3M 2 months

Tana
Delta
1.Distribution of
collapsible water
tanks and water
trucking in the
following water
points
Hurara Vibao
viwili Gamba
Wachu-oda
Salama
1000
800
CGTR 1.4M 2 months N/A
2.Rehabilitation
and solarisation of
boreholes and
large diameter
wells
Salama
Ngao
2000
1000
Unicef/Agro-German 3.7M 2020 100%
Medium and Long Term On-going Interventions(Including Interventions in response to COVID-19 pandemic)
Tana
North
1.Rehabilitation of
Bura w/s
Bura 5000 CWWDA 100M 1YR 95%
2.Construction of
50,000m3 Water Pan
Hirimani 2,500 TRCG 20M 4
months
50%
Tana
River
1.Installation of
transformer for
boosting of Emaus-
Kalakcha- Galole
Model pipeline
Emaus 2000 TRCG 4M 2
months
80%
Tana
Delta
1.Public participation
and reconnaissance on
the LAPSET project
(construction of a
water treatment plant
to supply water to
Lamu, through areas in
Tana Delta)
Shirikisho
Kipini East
Kipini
West
1000 CWWDA N/A 2020-
2021
N/A
2.Drilling of borehole
and construction of
water tank and
pipeline extension in
Oda, Darga Garge,
Kilelengwani, Onido
Wachu-oda
kilelengwa
ni
1000
800
CWWDA 60 M 2020-
2021
N/A
REFERENCE TABLES
Table 1: Drought Phase Classification
Normal Alert Alarm Emergency
All environmental
Agricultural and
pastoral indicators are
within the seasonal
ranges
Meteorological drought
indicators move outside
seasonal ranges
Environmental and at
least two production
indicators are outside
Long term seasonal
ranges
All Environmental,
Metrological and
Production indicators
are outside normal
ranges.
Recovery: The drought phase must have reached at least Alarm stage. Recovery starts after the end of
drought as signaled by the environmental indicators returning to seasonal norms; local economies
starting to recover
Table 2: Standardized Precipitation Index (SPI)
Color SPI Values Metrological Drought Category
> +1.5or more Wet Conditions
0 to +1.5 No drought
-0.1 to -0.99 Mild drought
-1 to -1.99 Severe drought
<-2 and less Extreme drought

Table 3: Vegetation Condition Index Values (VCI)
Color VCI values Agricultural Drought Category
3-monthly average
≥50 Wet
35 to 50 No agricultural drought
21 to 34 Moderate agricultural drought
10 to 20 Severe agricultural drought
<10 Extreme agricultural drought
Table 4: Livestock Body Condition
Level Classification Characteristics (this describes majority of the herd and not
individual isolated Stock)
1
Normal
Very Fat Tail buried and in fat
Fat, Blocky. Bone over back not visible
Very Good Smooth with fat over back and tail head
Good smooth appearance
2 Moderate Moderate. Neither fat nor thin
3 Stressed Borderline fore-ribs not visible. 12th & 13th ribs visible
4 Critical Thin fore ribs visible
5 Emerciated Very thin no fat, bones visible
Emaciated, little muscle left
Definition of Early Warning Phases
The EW phases are defined as follow:
NORMAL: The normal phase occurs whenbiophysicaldrought indicators (VCI and SPI) show no
unusual fluctuations hence remain within the expected ranges for the time of the year in a given
livelihood zone, division or county
ALERT: The alert phase is when either the vegetation condition index or the standard precipitation
index (biophysical indicators) show unusual fluctuations below expected seasonal ranges within the
whole county/sub-county or livelihood zones.
ALARM: The alarm phase occurs when both biophysicaland at least three production indicators
fluctuate outside expected seasonal ranges affecting the local economy. The production indicators to be
considered are livestock body condition, crop condition, milk production, and livestock migration and
livestock mortality rate.
If access indicators (impact on market, access to food and water) move outside the normal range, the
status remains at “alarm” but with a worsening trend. Proposed access indicators include ToT, price of
cereals, availability of cereals and legumes, and milk consumption. The trend will be further worsening
when also welfare indicators (MUAC and CSI) start moving outside the normal ranges.
EMERGENCY: In the emergency phase, all indicators are outside of normal ranges; local production
systems have collapsed within the dominant economy. The emergency phase affects asset status and
purchasing power to extent that seriously threatens food security. As a result, coping strategy index,
malnutrition (MUAC) and livestock mortality rates move above emergency thresholds
RECOVERY: Environmental indicators returning to seasonal norms. The drought phase must have
reached at least Alarm stage. Recovery starts after the end of drought as signaled by the environmental
indicators returning to seasonal norms while production indicators are still outside the normal seasonal
range but local economies start to recover. The status changes to normal once the bio physical and
production indicators are back to normal range.