National Drought Management Authority -...
13
National Drought Management Authority KILIFI COUNTY DROUGHT MONITORING EARLY WARNING BULLETIN – JANUARY 2014 Current Drought Risk Low Medium High ▲ JANUARY EW PHASE Early Warning Phase Classification Livelihood Zone Stage Trend Mixed farming Normal Stable Livestock/Ranching Alert Deteriorating Cash Cropping/Dairy Alert Stable Food Cropping Normal Stable COUNTY Alert Stable Biophysical Indicators Value Normal ranges % of Average Rainfall (Oct-Dec) 12.5% 80-120 SPI-3month 0.29 -1 to 1 VCI-3month 51.68 35-50 State of Water Sources 4 5-6 Production indicators Value Normal ranges Livestock Migration Pattern Normal Normal Livestock Body Conditions 4-5 7-8 Milk Production ltr/hh/day 1.57 2-3 Livestock deaths (for drought) No death No death Crops area planted (%) Nil <20 % of LTA Access Indicators Value Normal ranges Terms of Trade (ToT) 0.45 0.26 - 0.76 Milk Consumption 38% 35-50% Water for Households (Km) 3.1 Km <2.3 Grazing-Water point Distance for livestock (Km) 4.5 Km <4.5 Utilization indicators Value Normal ranges MUAC 4.3 %MUAC<9.1 Coping Strategy Index (CSI) 2.1 Index < 2.50 Drought Situation & EW Phase Classification Biophysical Indicators 3-month VCI was 51.68 therefore classifying the county vegetation across all livelihood zones as very good and fell within the normal ranges an indication that the situation was on average normal. 3-month SPI for the county was 0.29 classifying the county generally as wet. Water situation was declining as this time of the year after the county recorded poor rains across all livelihood zones. Water sources EW phase score was 4 in January. Socio Economic Indicators (Impact Indicators) No unusual migration was reported in the county as pasture and browse condition was fair to good. But normal in-migration was observed in ranching zone Livestock body condition was good due to availability of water at closer distance, no major diseases were reported and pasture and browse quality and quantity was fair to good. Average return distance to water points by households and from grazing area by livestock increased significantly following minimal rains received. Main water sources for the period under review were water pans/dams, pipeline and natural rivers, ponds and shallow wells at 59%, 24% and 10%, and 3% respectively. Average milk production and consumption in the county decreased slightly to 1.57 litres per household whereby 38% of the total amount produced was consumed at households. Cattle prices slightly increased while that of goats remained stably high in comparison to previous month and long term average thus the purchasing power for livestock keepers remained better though lower as compared to December. Average percentage of children at risk of malnutrition increased significantly from 2.1% in December to 4.3% in the month of January but remained lowere than the long term mean. Coping Strategy Index (CSI) was below normal but slightly increased from 1.4 previous month to 2.1 in January, an indication that household food security deteriorated during the month. Current drought risk has transitioned to high due to poor harvests coupled with lower household incomes and reduced animal productivity. The situation is expected to deteriorate further in the next month since less rain is expected. Household food availability and diversity is likely to decline and malnutrition rates may rise.
Transcript of National Drought Management Authority -...

Page 1 of 13
National Drought Management Authority
KILIFI COUNTY
DROUGHT MONITORING EARLY WARNING BULLETIN – JANUARY 2014
Current
Drought Risk
Low Medium High
▲
JANUARY EW PHASE
Early Warning Phase Classification
Livelihood Zone Stage Trend
Mixed farming Normal Stable
Livestock/Ranching Alert Deteriorating
Cash Cropping/Dairy Alert Stable
Food Cropping Normal Stable
COUNTY Alert Stable
Biophysical Indicators Value Normal ranges
% of Average Rainfall (Oct-Dec) 12.5% 80-120
SPI-3month 0.29 -1 to 1
VCI-3month 51.68 35-50
State of Water Sources 4 5-6
Production indicators Value Normal ranges
Livestock Migration Pattern Normal Normal
Livestock Body Conditions 4-5 7-8
Milk Production ltr/hh/day 1.57 2-3
Livestock deaths (for drought) No death No death
Crops area planted (%) Nil <20 % of LTA
Access Indicators Value Normal ranges
Terms of Trade (ToT) 0.45 0.26 - 0.76
Milk Consumption 38% 35-50%
Water for Households (Km) 3.1 Km <2.3
Grazing-Water point Distance for
livestock (Km)
4.5 Km <4.5
Utilization indicators Value Normal ranges
MUAC 4.3 %MUAC<9.1
Coping Strategy Index (CSI) 2.1 Index < 2.50
Drought Situation & EW Phase Classification Biophysical Indicators
3-month VCI was 51.68 therefore classifying the county vegetation across all livelihood zones as very good and fell within the normal ranges an indication that the situation was on average normal.
3-month SPI for the county was 0.29 classifying the county generally as wet.
Water situation was declining as this time of the year after the county recorded poor rains across all livelihood zones. Water sources EW phase score was 4 in January.
Socio Economic Indicators (Impact Indicators)
No unusual migration was reported in the county as pasture and browse condition was fair to good. But normal in-migration was observed in ranching zone
Livestock body condition was good due to availability of water at closer distance, no major diseases were reported and pasture and browse quality and quantity was fair to good.
Average return distance to water points by households and from grazing area by livestock increased significantly following minimal rains received. Main water sources for the period under review were water pans/dams, pipeline and natural rivers, ponds and shallow wells at 59%, 24% and 10%, and 3% respectively.
Average milk production and consumption in the county decreased slightly to 1.57 litres per household whereby 38% of the total amount produced was consumed at households.
Cattle prices slightly increased while that of goats remained stably high in comparison to previous month and long term average thus the purchasing power for livestock keepers remained better though lower as compared to December.
Average percentage of children at risk of malnutrition increased significantly from 2.1% in December to 4.3% in the month of January but remained lowere than the long term mean.
Coping Strategy Index (CSI) was below normal but slightly increased from 1.4 previous month to 2.1 in January, an indication that household food security deteriorated during the month.
Current drought risk has transitioned to high due to poor harvests coupled with lower household incomes and reduced animal productivity. The situation is expected to deteriorate further in the next month since less rain is expected. Household food availability and diversity is likely to decline and malnutrition rates may rise.

Page 2 of 13
BIO-PHYSICAL INDICATORS
1. MEASURING DROUGHT HAZARD
1.1 METEOROLOGICAL DROUGHT 1.1.1 Amount of rainfall and spatial distribution
The line graph below compares the amount received in the current year across all livelihood zones with the long term mean.
Source: 11 rain gauges at NDMA sample sites.
The average amount of rainfall received across the county significantly decreased by 70%
from 115.9 mm in December to 34.6 mm recorded in January Spatial distribution of the received rainfall was poor across the livelihood zones with food
cropping zone recording highest average of 43.8 mm followed by mixed farming zone with 38.8 mm, the ranching zone recorded an average of 28.4 mm while cash cropping/dairy zone recorded least average of 20.6 mm in the month under review.
The average amount of rainfall received was 18% lower than the long term mean and 12.5% of the average rainfall received in the period October to December which way below the normal range.
1.1.2 Temporal distribution
There were on average 5 rainy days in January as compared to 12 days in December
The short rain season ended in the month of December and the rainfall received during the month is considered to be out of season and is insignificant for agricultural activity.
1.1.3 Standardized Precipitation Index [SPI]
The three month SPI is standardized anomaly, equivalent to the statistical Z-score, representing the precipitation deficit over 3 months, relative to climatology. Below is a representation for the county in the month of January

Page 3 of 13
Graph: Three- monthly Standard Precipitation Index for Kilifi County
Source: Satellite images
The SPI index for the county in the month of January was 0.29 which indicated a normal rainfall condition as per the SPI classification. Ganze and Magarini Sub Counties were classified poor in terms of precipitation with SPI values of 0.17 and 0.27 respectively for the month of January while Rabai, Malindi and Kilifi South recorded higher values of 0.56, 0.55 and 0.52 respectively.
1.2 Agricultural Drought 1.2.1 Vegetation Condition Index (VCI)
This indicator is suitable to measure the status of pasture and therefore can be used to assess grazing resources available to livestock.
Graph: Three- monthly Vegetation Condition Index for Kilifi County
Source: Satellite images
In the month of January, Kilifi County recorded a 3-monthly VCI of 51.68 indicating that the vegetation condition was very good and this is supported by field observation due to significant amount of rainfall received in the month of December which had good impact on both pasture and browse across all livelihood zones. Malindi and Magarini Sub Counties recorded the lowest 3-month VCI of 49.62 and 49.19 respectively but still were classified under no drought classification category.

Page 4 of 13
1.2.2 Pasture and Browse Condition-Field Observation. 1.2.2.1 Pasture
Pasture condition was good in the mixed farming zone, food cropping and ranching zones while it remained fair in cash cropping/dairy due to minimal amounts or rainfall received in the current and previous month of December.
The available pasture is expected to last for 2-3 months in the mixed and food cropping zones while in the ranching and cash cropping dairy it is estimated to last for 1-2 months.
1.2.2.2 Browse
Browse condition was good across all livelihood zones which is normal at this time of the year.
A deteriorating trend was observed as compared to the previous month in the cash cropping and ranching zones due to the minimal amounts of rainfall received in the last two months.
The available browse is expected to last 3-4 months but the period may be shorter in the ranching zone due to livestock in migration from the neighbouring county as it is normally observed at this time of the year
1.3 HYDROLOGICAL DROUGHT
1.3.1 Water Resource Pie chart showing the various water sources relied upon by households and livestock in Kilifi County in the month of January
Source: NDMA sample sites. Total number of households and livestock held in the county
The main water sources for domestic and livestock use across all livelihood zones in the
month of January were pans/dams (59%), pipeline (24%), natural rivers and shallow wells (10%) and natural ponds(3%).
The proportion of households using water pans and dams increased slightly while those using pipeline decreased significantly by 9% due to the increased water stress resulting into use of natural ponds and shallow wells
The EW phase classification index for the water sources in the county during the month under review was 4 indicating declining state.
DROUGHT IMPACT ON SOCIO-ECONOMIC INDICATORS 2.0 PRODUCTION INDICATORS 2.1. Livestock production 2.1.1. Livestock Ownership
On average, about 65 percent of all households sampled possess livestock Every household in the county on average keeps 1 cattle, 4 goats and 6 chicken with
livestock population concentrated in the ranching zone with 1 cattle, 4 goats 1 sheep and 4

Page 5 of 13
chicken while in the mixed farming zone average household livestock holding was 1 cattle 3 goats and 6 chicken.
2.1.2 Livestock Migration Patterns
The pastoralists from the neighbouring Tana River County had started to migrate their livestock into Chakama location in the ranching zone in search of pasture and browse.
The migration was normal at this time of the year due scarcity of water, pasture and browse occasioned by the dry spell within the first three months of the year.
This migration pattern is likely to remain unchanged until the next rainy season in May.
2.1.3 Livestock body condition
Livestock body condition remained good due to availability of pasture and browse occasioned by the significant rains received in the month of December.
The livestock in mixed farming and food cropping zones showed an improvement in body condition as compared to those in the ranching and cash cropping/dairy livelihood zone.
On average, Livestock body condition was good across the county with a score of 5 (Normal) in mixed farming and food cropping zones and 4 (alert) in the ranching and cash cropping zones
2.1.4 Livestock diseases
No major livestock disease(s) reported by livestock keepers.
2.1.5 Milk production.
Milk production significantly decreased by 35% in the month under review from 2.43 litres per household in the previous month to 1.57 litres per household recorded in the county households for the month of January
2.2 Rain fed crop production. 2.2.1. Stage and condition of crops.
There were no maturing crops in the farms as large proportion of farmers was engaged in
harvesting of the ready crops such as maize and green grams. Less than 5 percent of the farmers in the food cropping zone were engaged in bush/land
clearing and preparation in readiness for the anticipated long rain season. 2.2.2. Crop harvest
Harvesting of maize, cowpeas, green grams, cassava, chilies and pineapples in the food cropping and mixed farming zones and in parts of the ranching zone in the county though the harvest is poor due to failed short rain season.
ACCESS INDICATORS 3.0 Livestock marketing 3.1 Livestock terms of trade The livestock cereal ratio gives an indication of the purchasing power of pastoralists to purchase staple foods. A livestock producer may sell to the consumer directly or to a trader who then sells the animal products.

Page 6 of 13
Time series chart showing the terms of trade for the livestock keepers in Kilifi County
Source: NDMA sample sites. Total sample size (n) 330 households
The terms of trade for livestock keepers deteriorated in January from one goat exchanging for 62 kilograms of maize in December to only 53 kilograms in January
Ther terms of trade though remained above normal of 50.4 kilograms for every one live goat
The livestock cereal ration for the month under review was 0.45 3.1.1 Cattle prices The line graph below compares average cattle prices at household level with the long term mean price in the county.
Source: NDMA sample sites. Total sample size (n) 330 households
Average cattle price increased further by 3% from Kshs. 15,750 in the month of December to Kshs.16,750 in the month under review and this may be attributed to good livestock body condition and low supply in the market as livestock keepers preferred to sell goats to cattle.
Highest cattle prices were observed in the mixed farming zone with an average of Kshs. 21,000 while lowest prices were recorded in the livestock/ranching zone at Kshs. 11,330.
The current average price was 36% higher when compared to the long term mean price.
Page 7 of 13
3.1.2 Goat prices
The line graph below compares current average goats’ price at market level compared to the long term mean price in the county.
Source: NDMA EW sample sites. Sample size (n) 330 households
The average household price of a medium sized goat slightly decreased by 2 percent from
Kshs. 2,457 in December to Kshs. 2,408 in the month of January. The mixed farming zone recorded the highest average price of Kshs. 2,973 while the livestock
farming zone recorded the least price at Kshs. 2,502. The difference in price was occasioned market forces of demand and supply making livestock keepers benefit due to less supply in the market as opposed to the ranching zone where supply was more.
The average goat price for in the current month was 40% higher than the county long term mean price.
3.1.3 Milk prices
The average price of one litre of unprocessed milk in the month of January was Kshs. 33.15 Highest average price of unprocessed milk was observed in the livestock/ranching zone at
Kshs. 40 per liter while the lowest average price was recorded in the food cropping zone at kshs.30 per litre.
The high prices in the livestock keeping zone was due to the scarcity of vegetables leading to majority of households using it for tea and for taking with ugali
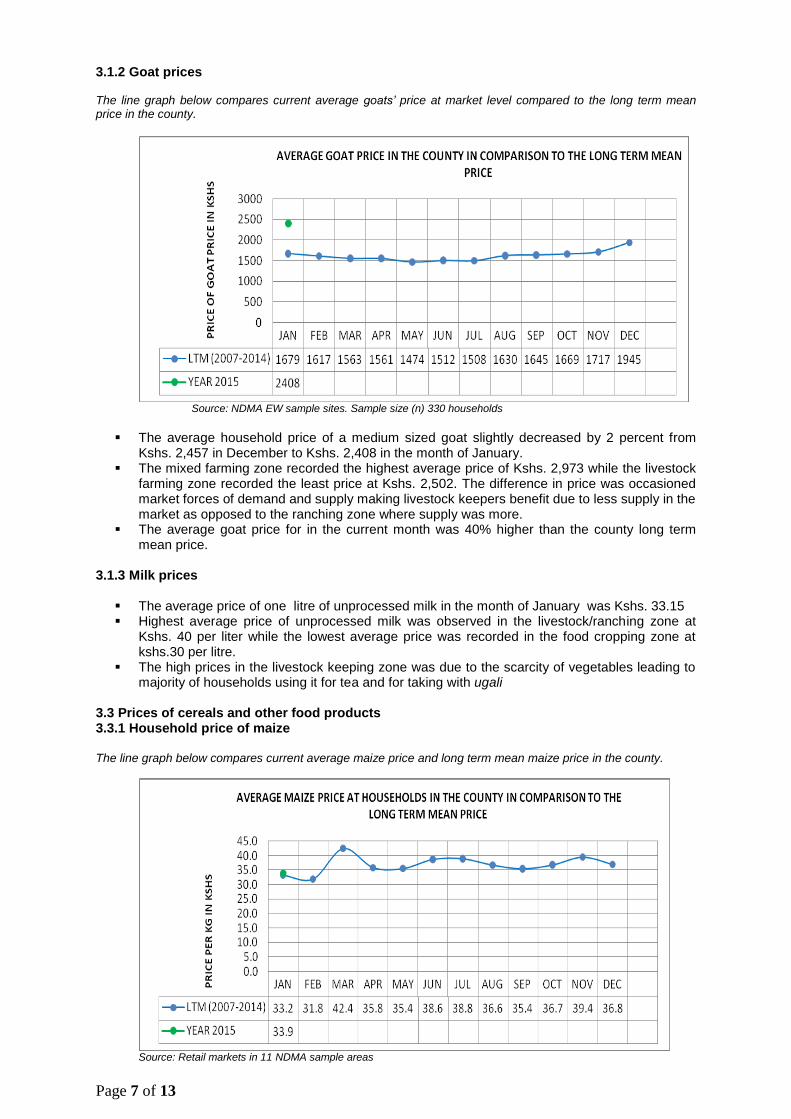
3.3 Prices of cereals and other food products 3.3.1 Household price of maize The line graph below compares current average maize price and long term mean maize price in the county.
Source: Retail markets in 11 NDMA sample areas

Page 8 of 13
Average maize price recorded a 14 percent decrease in the month of January to Kshs. 33.9 per kilogram as compared to the average price recorded in the previous month.
The decrease was occasioned by maize harvests in all livelihood zones across the county
Average maize prices varied across livelihood zones from Kshs. 50 per kilogram in the ranching/livestock farming zone to Kshs. 32 per kilogram in the mixed farming.
The observed average price was only 2 percent higher than the county long term mean price at this month of the year.
3.3.2. Market price of beans. The line graph below shows average beans price in the month of January in comparison with the long term average.
Source: Retail markets in 11 NDMA sample areas
Average beans prices slightly decreased from Kshs. 85 per kilogram in December to Ksh. 83
per kilogram in the month under review. The decrease was occasioned by harvest of cowpeas and green grams.
The mixed farming zone recorded the highest average price of Kshs. 88 per kilogram while the food cropping zone posted the lowest average price of Kshs. 78 per kilogram.
The average beans price is expected to remain stably high since it is normally never produced in plenty in the county and hence people mainly rely on the market for the supply.
The average price recorded in January was 3% higher than the county long term mean price at the same month of the year.

Page 9 of 13
54%
20%
9%
5%
9%2% 1%
Income Sources for households in Kilifi County
Casual labour
Sale of charcoal
Petty trading
Formal employment
Remittances
Sale of Livestock
Sale of livestock products
3.4. Access to food and water 3.4.1 Income. The pie chart below shows the percentage of households that engaged in various income generating activities in
the month of January
Source: 11 NDMA sample sites. Total sample size (n) 330 households
Main sources of income for the period under review were casual labour, sales of charcoal, petty trade, remittances, and formal employment.
Percentage of households who depended on casual labour slightly decreased by 4 percent as compared to month of December as agricultural activity declined with most farmers engaged in harvesting
The average daily wage remained slightly increased by 9 percent in comparison to month of December from Kshs. 173 to Kshs. 188 with the highest wage being recorded in food cropping zone with an average of Kshs. 228 while the lowest was recorded in livestock farming zone with an average of Kshs. 124.
The average daily wage rate increased due to increased harvesting activities in the mixed farming and food cropping zones leading to better remuneration for labour.
3.4.2 Availability of milk for household consumption
Availability of milk for consumption at households was normal since on average 38 percent of the total milk produced in the county was consumed at households while the rest was sold to supplement on household incomes.
The available amount for consumption deteriorated compared to the long term mean due to decrease in production and a higher preference to sell for income to purchase other food products.

Page 10 of 13
3.4.3 Availability and utilization of water 3.4.4 Household access and utilization The bar chart below compares the current average return distance with long term mean distance trekked by households in search of water in the county.
Source: 11 NDMA sample sites. Total sample size (n) 330 households
Average return distance by households to water sources increased significantly in the month of
January from 1.35 km recorded in December to 3.1 km in the month under review. The increase was due to reduced rainfall received in the month leading to stress of water in
pans & dams and natural rivers at closer distances. In addition there was prolonged rationing for pipeline water due to technical reasons.
The lowest average distance for households was recorded in the cash cropping/dairy zone at 2.7 km while the longest average distance was recorded in the food cropping zone with 3.5 km.
The average return distance by households to water sources is expected to increase for the next 3-4 months across all the livelihood zones before the onset of long rains season.
The average households return distance for the month was 35 percent higher than the long term mean at this time of the year.
Only about 10% of the households getting water from ground run off either boiled or treated with chemicals their water for drinking.
Water from the pipeline was retailing at Kshs. 5 per 20 litre container while from the water vendors it cost Kshs.10-15 with the price being higher in the ranching zone.
3.4.5 Livestock access to water
3.4.6 Distance from grazing area to Water Sources.
Livestock relied on water from dams and pans, natural rivers, natural ponds and shallow wells that were close to the grazing points.

Page 11 of 13
The bar chart below compares the current average return distance with the long term mean return distance to grazing areas.
Source: NDMA Early Warning sample sites. Total sample size (n) 330 households
The average return distance to grazing areas increased significantly in the month under review
from 3.7 km in December to 4.5 km recorded in the month of January. The increasing trend in average return distance was due to reduced rainfall received during
the month leading to livestock being driven to distant pan and rivers designated for livestock The longest average return grazing distance was recorded in the mixed farming zone with an
average of 5.0 km while the shortest distances were trekked in the cash cropping/dairy zone with 3.3 km. The average grazing distance in the county is expected to start maintain an upward trend as pasture and browse condition may deteriorate across all livelihood zones in the next 3-4 months occasioned by minimal rains.
The average return distance to grazing areas during the month was equivalent to the long term mean in the same month of the year.
UTILISATION INDICATORS 4.1 Health and Nutritional Status 4.1.1 MUAC The line graph below shows the proportion of children at risk of malnutrition (Mid-Upper Arm Circumference<
135mm) in Kilifi county in the month of January.
Source: Total number of children from all 330 households from11 NDMA Early Warning sample sites.

Page 12 of 13
Average percentage of children at risk of malnutrition doubled in January to stand at 4.5% The increase is attributed to the poor feeding habits and diseases Though the average percentage of children at risk of malnutrition in the month under review
was lower when compared to the long term average, some sentinel sites recorded higher percentages of children at risk of malnutrition.
Vitsapuni (Food cropping zone) and Jila (livestock farming zone) sentinel sites in Ganze Sub County and Kisiki Cha Mgiriama sentinel site in Magarini Sub County (Livestock farming zone ) recorded high percentage of children under five years with risk of malnutrition at 5.4%.close surveillance needed in the area by county department of health and other stakeholders.
4.1.2 Health
The livestock/ranching zone and parts of food cropping zone continue showing upward trend
in risk of malnutrition among the children under five.
Consumption of untreated water remains high among the households that rely mainly on
ground water and this may lead to disease incidences.
4.2 Coping Strategies 4.2.1 Coping Strategy Index The line graph below compares the coping strategy index in the county with the long term coping index following various coping mechanisms engaged by households to cope with food insecurity.
Source: 11 NDMA sample sites. Total sample size (n) 330 households
Coping Strategy Index (CSI) significantly increased in January from 1.4 recorded in the previous
to 2.1 in the month under review. The coping strategy index for the month was 16 percent below long term CSI mean thereby
indicating that the household food security deteriorated significantly in the month as compared to previous months
Common coping mechanisms employed by households during the month under review were; Food Consumption of seed stock. Begging or engaging in degrading jobs. Reduction in number and meal rations. Opting for less preferred or cheaper meals. Borrowing food from friends and relatives. Purchase of food on credit terms.
5.0 Current Intervention Measures.
5.1 Food- aid Supplementary feeding program in health facilities by County Department of Health/WFP and
Red Cross.

Page 13 of 13
5.2 Non-food aid Water trucking in 31 locations in Magarini Sub County, 31 in Ganze Sub County and 7
locations in Kaloleni Sub County all in the livestock farming zone. Growth monitoring at village level by community health workers. Water pan excavation and pipeline extension in Malindi by the department of water Cash for Asset by World Vision, WFP, GoK, Kenya Red Cross Society and NDMA in Ganze,
Kaloleni, Malindi and Magarini sub counties. Local poultry, cassava, beekeeping, dairy farming projects by ASDSP and KAPAP The aged received cash in parts of Ganze Sub County Cassava Revitalization and Commercialization by CAST in Ganze Sub County. Fish farming projects in Ganze sub county by department of Fisheries/AMREF. Dairy goat upgrading by Livestock department across Kilifi County
Promotion of rabbit keeping by Livestock department across Kilifi County
Promotion of apiculture by Livestock department Kilifi County
Promotion of cassava farming (construction of processing plant at Kilifi North Sub County).
Support for Irrigation projects by KRCS (Magarini), Jica and MoA in Jaribuni.
6.0 Emerging Issues 6.1 Insecurity/Conflict/Human Displacement
Cases of Hippos destroying maize crop along river Galana was reported in Kisiki sample site of the livestock farming zone in the month under review. These animals also pose a danger to women fetching water from the same river.
Insecurity cases were reported in Chakama shopping center in January leading to deaths of businessmen. The insecurity has reached alarming levels therefore disrupting normal operations of the market where villages access major food commodities.
6.2 Food security prognosis The reduced rainfall across the county is likely to impact negatively on pasture and browse for
livestock and the water sources leading to stress by households and livestock to access and in turn this will have a direct impact on the livestock body conditions, milk production, watering frequency for animals and number of litres per person per day for households.
The in-migration of pastoralists into the ranching zone of the county is likely to trigger resource based conflicts and increased commodity demand at the market, consequently leading to increased prices of cereals and other food products.
The household incomes will continue to decrease due to reduced agricultural activity occasioned by decreased rainfall and therefore many people are likely to engage in charcoal burning as a coping mechanism.
Stocks held by households currently in the ranching zone are estimated to last for a period less than 1 month while in the other zones it is projected to last less than 2months.
The wards with deteriorating trends of water, health and food include Magarini, Gongoni, Adu, Garashi wards in Magarini Sub County; Mwanamwinga and Kayafungo wards in Kaloleni Sub County;Ganze and Jaribuni wards in Ganze Sub County.
7.0 Recommendations to the SCSG/CSG/ KFSSG/ County Government Rapid Nutritional Survey in Vitsapuni, Kisiki and sample area in Ganze Sub County to
establish the reasons for persistent high proportion of children malnutrition risk. Action County department of Health.
Repair of Kadzuho Ka Mkondoni Bridge in Chakama location to enable passage of vehicles to and from Malindi to enable green vegetables business. Action County Government.
Community sensitization on proper post harvest handling during this time of harvest. Action County department of Agriculture.
Operationalize Chakama police post to lower cases of insecurity which affect normal operations of markets.
Community sensitization on early and proper techniques of land preparation in readiness for the long rain season. Action County department of Agriculture.
Pasture conservation in preparation for the dry season when some livestock keepers loose large herds of livestock. Action County Department of livestock.
Establishing measures to curb Human/Wildlife conflict especially in livestock livelihood zone-Kenya Wildlife Service
Promotion of irrigation agriculture along permanent rivers in the county by provision of small water pumps- Action: County Department of Agriculture and other stakeholders.