National Drought Management Authority KILIFI COUNTY
14
Page 1 of 14 National Drought Management Authority KILIFI COUNTY DROUGHT EARLY WARNING BULLETIN FOR NOVEMBER 2015 Short rains harvests Short dry spell Reduced milk yields Increased HH Food Stocks Land preparation Planting/Weeding Long rains High Calving Rate Milk Yields Increase Long rains harvests A long dry spell Land preparation Increased HH Food Stocks Kidding (Sept) Short rains Planting/weeding Jan Feb Mar Apr May Jun Jul Aug Sept Oct Nov Dec NOVEMBER EW PHASE Early Warning(EW) Phase Classification Livelihood Zone Stage Trend Mixed farming Normal Stable Livestock/Ranching Normal Improving Cash Cropping/Dairy Normal Stable Food Cropping Normal Stable COUNTY Normal Stable Biophysical Indicators Value Normal Average Rainfall (% of normal) 80-120 80-120 SPI-3month -0.25 - 0.25 VCI-3month 44.5 35-50 Production indicators Value Normal Livestock Migration Pattern Normal Normal Livestock Body Conditions 5 7-8 Milk Production ltr/hh/day 1.8 >1.8 Crop condition good good Access Indicators Value Normal Terms of Trade (ToT) 78 >78 Milk Consumption (% range) 48% >48% Average Water for Households (Km) 1.7 <1.7 Average Grazing-Water point Distance (Km) 3.1 <4.6 Utilization indicators Value Normal MUAC (%) 2.3 <6.4 Coping Strategy Index (CSI) 1.4 <1.6 Drought Situation & EW Phase Classification Biophysical Indicators (Environmental indicators) Rainfall onset in the county was recorded in late October with poor temporal distribution. Currently spatial distribution if even. On average an improvement in Vegetation Condition Index was recorded in November. The pasture and browse condition was good across all livelihood zones. The Vegetation condition index was normal Socio Economic Indicators (Impact Indicators) Production indicators Livestock body condition was good across all livelihood zones Milk production increased during the month Intra livestock migration was reported in the ranching zone to areas with pasture Maize crop was at the weeding stage Access indicators The average distance to water sources by both households and livestock reduced significantly The terms of trade were favourable for the livestock farmers during the month Half of the average milk produced was consumed at households Utilization indicators The proportion of children at risk of malnutrition increased in the month under review but remained much lower than the long term mean. The coping strategy index increased in the month under review.
Transcript of National Drought Management Authority KILIFI COUNTY

Page 1 of 14
National Drought Management Authority
KILIFI COUNTY DROUGHT EARLY WARNING BULLETIN FOR NOVEMBER 2015
Short rains harvests Short dry spell Reduced milk yields Increased HH Food Stocks Land preparation
Planting/Weeding Long rains High Calving Rate Milk Yields Increase
Long rains harvests A long dry spell Land preparation Increased HH Food Stocks Kidding (Sept)
Short rains Planting/weeding
Jan Feb Mar Apr May Jun Jul Aug Sept Oct Nov Dec
NOVEMBER EW PHASE
Early Warning(EW) Phase Classification
Livelihood Zone Stage Trend
Mixed farming Normal Stable
Livestock/Ranching Normal Improving
Cash
Cropping/Dairy
Normal Stable
Food Cropping Normal Stable
COUNTY Normal Stable
Biophysical Indicators Value Normal
Average Rainfall (% of
normal)
80-120 80-120
SPI-3month -0.25 - 0.25
VCI-3month 44.5 35-50
Production indicators Value Normal
Livestock Migration
Pattern
Normal Normal
Livestock Body Conditions 5 7-8
Milk Production ltr/hh/day 1.8 >1.8
Crop condition good good
Access Indicators Value Normal
Terms of Trade (ToT) 78 >78
Milk Consumption (%
range)
48% >48%
Average Water for
Households (Km)
1.7 <1.7
Average Grazing-Water
point Distance (Km)
3.1 <4.6
Utilization indicators Value Normal
MUAC (%) 2.3 <6.4
Coping Strategy Index
(CSI)
1.4 <1.6
Drought Situation & EW Phase Classification Biophysical Indicators (Environmental indicators)
Rainfall onset in the county was recorded in late October with poor temporal distribution. Currently spatial distribution if even.
On average an improvement in Vegetation Condition Index was recorded in November.
The pasture and browse condition was good across all livelihood zones. The Vegetation condition index was normal
Socio Economic Indicators (Impact Indicators)
Production indicators
Livestock body condition was good across all livelihood zones
Milk production increased during the month
Intra livestock migration was reported in the ranching zone to areas with pasture
Maize crop was at the weeding stage Access indicators
The average distance to water sources by both households and livestock reduced significantly
The terms of trade were favourable for the livestock farmers during the month
Half of the average milk produced was consumed at households
Utilization indicators
The proportion of children at risk of malnutrition increased in the month under review but remained much lower than the long term mean.
The coping strategy index increased in the month under review.

Page 2 of 14
1. CLIMATIC CONDITIONS 1.1 RAINFALL PERFORMANCE
The season started in the second dekad of October but temporal distribution was poor. On average the county recorded 8 rainy days during the month under review.
Spatial distribution in October dekad 2 and 3 is shown in figure 1a below;
Figure 1b: RFE Satellite images
Spatial distribution was uneven as most areas recorded 20-40 mm and some recorded 10-20mm while those which recorded highest amount it was between 40-80mm.
Figure 1b: Source: Msabaha Agrometeorological Station in Kilifi County
Total rainfall data from Meteorological station indicated some increase in November compared to October but the amount received was slightly below the long term mean.

Page 3 of 14
1.2 AMOUNT AND SPARTIAL DISTRIBUTION
JAN FEB MAR APR MAY JUN JUL AUG SEP OCT NOV DEC
LTM (2010-2014) 37.4 7.6 21.3 44.8 96.1 71.1 27.7 24.7 25.0 62.5 70.4 82.0
YEAR 2015 34.6 2.0 4.9 64.4 100.9 94.0 28.0 45.8 14.0 13.8 72.2
0.0
10.0
20.0
30.0
40.0
50.0
60.0
70.0
80.0
90.0
100.0
110.0
AM
OU
NT
IN M
ILLI
MET
RES
AVERAGE AMOUNT OF RAINFALL RECORDED IN KILIFI COUNTY
Figure 2 a: Average rainfall in mm recorded in 11 sentinel sites across Kilifi County
Average amount of rainfall recorded in November increased significantly from 14 mm recorded in previous month to 72.2 mm in the current month.
The spatial distribution was even since all livelihood zones received enhanced rainfall. The food cropping zone recorded the highest average rainfall amount of 105 mm, the cash cropping/dairy zone followed with 77.2 mm, mixed farming zone with 76.3 mm and the least average rainfall was recorded in ranching/livestock farming zone with 33.4mm during the month of November.
The average rainfall amount received in October was 3 percent higher than the long term mean in the same month of the year.
Figure 2 b: Rainfall spatial distribution for Kilifi county as per the satellite images (RFE): [Source: FEWS
NET]
The spatial distribution of rainfall as per figure 2b above was even. All areas in the county between October 10th and November 30th recorded some rains. Some areas of Chakama in Magarini sub county and Bamba in Ganze sub county recorded more than 250mm. Malindi and Magarini sub county recorded more areas which received 50-80% of normal for the mentioned period.
Page 4 of 14
2.0 IMPACT ON VEGETATION AND WATER 2.1 VEGETATION CONDITION 2.1.1 Vegetation Condition Index [VCI] The Vegetation Condition Index (VCI) compares the current NDVI to the range of values observed in the same period in previous years.
Figure 3a: three month Vegetation Condition Index [Source: Boku University -Austria]
The 3-month Vegetation Condition Index for the county for November was 44.5 indicating normal condition and an improvement compared to the previous month.
The good vegetation condition was occasioned by the increased amount or rainfall received across the county which led to regeneration of pasture and browse.
Though the vegetation condition was normal, it remained below the long term vegetation condition
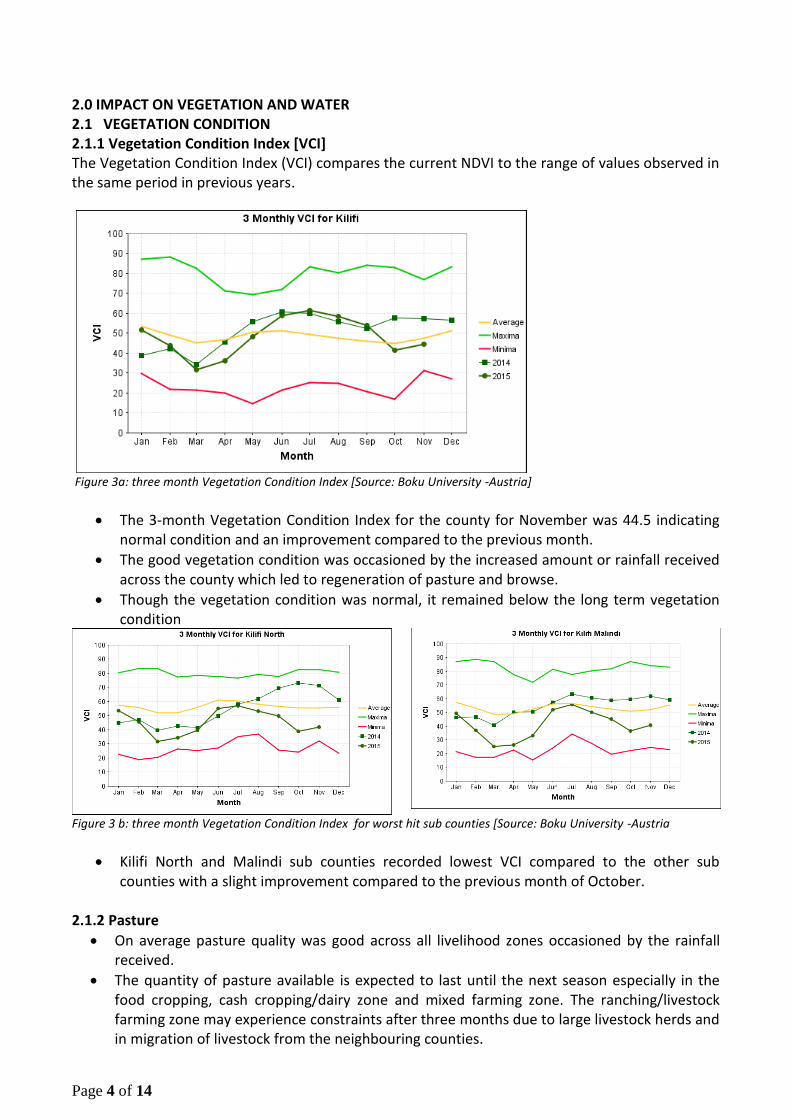
Figure 3 b: three month Vegetation Condition Index for worst hit sub counties [Source: Boku University -Austria
Kilifi North and Malindi sub counties recorded lowest VCI compared to the other sub counties with a slight improvement compared to the previous month of October.
2.1.2 Pasture
On average pasture quality was good across all livelihood zones occasioned by the rainfall received.
The quantity of pasture available is expected to last until the next season especially in the food cropping, cash cropping/dairy zone and mixed farming zone. The ranching/livestock farming zone may experience constraints after three months due to large livestock herds and in migration of livestock from the neighbouring counties.

Page 5 of 14
The good quality condition and increased quantity of pasture is normal at this time of the year
2.1.3 Browse
On average browse condition was good across all livelihood zones in the county occasioned by the rainfall being recorded in most areas in the county.
The browse condition is expected to remain good during this season and even after the short rain season.
The good browse quality condition and increased quantity is normal at this time of the year. 2.2 WATER RESOURCE 2.2.1 Sources
44%
9%9%
38%
Water sources for Households in Kilifi County
Pans & Dams
Boreholes
Natural Rivers/Ponds
Pipeline
Figure 4: Water sources for households in Kilifi County
The main water sources for both domestic and livestock use across all livelihood zones in the month of November remained as pans/dams 44%, pipeline (38%), boreholes 9% and natural rivers 9%.
The EW phase classification index for state of water sources in the county during the month under review was 5, indicating normalcy in water availability.

Page 6 of 14
2.2.2 Household access and Utilization
0.0 0.5 1.0 1.5 2.0 2.5 3.0 3.5 4.0
JAN
FEB
MAR
APR
MAY
JUN
JUL
AUG
SEP
OCT
NOV
DEC
JAN FEB MAR APR MAY JUN JUL AUG SEP OCT NOV DEC
YEAR 2015 3.1 2.5 2.9 2.0 1.7 1.6 1.7 2.1 3.1 3.5 1.7
LTM (2010-2014) 2.3 2.9 3.3 3.0 2.0 1.9 2.3 2.7 3.4 3.6 2.5 1.7
AVERAGE HOUSEHOLD RETURN DISTANCE TO WATER SOURCES IN KILIFI COUNTY
Figure 5: Household average return distance to water points
The average return distance to water sources for households decreased by 51 percent in the month of November to 1.7 km when compared to the previous month. The decrease was due to rains that were received during the month occasioning water pans recharge.
The longest average return distance was recorded in the ranching zone with an average of 2.9 km while the shortest average distance was recorded in the cash cropping/dairy zone with average distance of 0.6 km.
The increasing trend in average return distance was normal at this time of the season and is expected to decrease further in the coming month as the season continues.
Average return distance to water points for households during the month was 32 percent lower than the long term mean and remained similar when compared to same month last year.
2.2.3 Livestock access to water
0.0 1.0 2.0 3.0 4.0 5.0 6.0 7.0 8.0
JAN
FEB
MAR
APR
MAY
JUN
JUL
AUG
SEP
OCT
NOV
DEC
JAN FEB MAR APR MAY JUN JUL AUG SEP OCT NOV DEC
YEAR 2015 4.5 4.8 5.9 4.5 3.3 2.7 3.5 4.5 5.2 6.1 3.1
LTM (2010-2014) 4.5 4.9 5.8 5.1 3.7 3.8 4.6 5.6 6.7 6.5 4.6 3.2
AVERAGE LIVESTOCK RETURN DISTANCE TO WATER POINTS FROM GRAZING AREA IN KILIFI COUNTY
Figure 6: Average return distance to water point from grazing area for livestock.

Page 7 of 14
The average return distance to grazing areas decreased by 49 percent in the month under review from 6.1 km in October to 3.1km recorded in the month of November.
The decrease is attributable to improved pasture condition thus livestock trekking for shorter average distances in search for pasture.
The longest average return distance for livestock was recorded in the livestock farming zone with an average of 4.6 km while the shortest average distance was recorded in the cash cropping/dairy zone with 2.3 km.
The decreasing trend in average return distance was normal at this time of the year and is expected to decrease further in the next one month due to the ongoing rains.
The average return distance to grazing areas during the month was 33 percent lower than the long term mean and 54 percent lower than the distance recorded in the similar month last year.
3.0 PRODUCTION INDICATORS
3.1 Livestock production 3.1.1 Livestock body condition
The body condition of cattle and shoats was good across the livelihood zones occasioned by good quality of pasture and browse in the current month and availability of water at shorter distance
On average, livestock body condition across the county remained normal with a EW phase classification score of 5 (normal /alert: moderate neither fat nor thin).
3.1.2 Livestock diseases
No major livestock disease was recorded across the county.
Vaccination was carried out against Rift Valley Fever by the county department of veterinary to curb against any outbreaks during the expected short rain season
3.1.3 Milk production
Milk production increased by 20 percent in the current month compared to the previous month to 1.8 litres per household per day.
3.2 Rain fed crop production 3.2.1. Stage and condition of food crops
The three main crops grown in the county are maize, green grams and cowpeas
Farmers across all livelihood zones were engaged in planting and weeding activities.
The maize crop in the farms was at knee height stage of development.
3.2.2. Crop harvest
Green maize, paw paws and vegetables were harvested from farms along river Sabaki in the livestock farming zone.
Cassava harvesting continued in all livelihood zones across the county.
Coconut harvesting was ongoing across all livelihood zones in the county.

Page 8 of 14
4.0 MARKET PERFORMANCE 4.1 Livestock marketing 4.1.1 Cattle Prices
Figure7: Average cattle price at household level in Kilifi County.
Average cattle price increased by 10 percent to Ksh16, 500 in the month of November, the price increase was due to improved body condition of the bulls traded.
The trading of cattle was only reported by households in the livestock farming zone where farmers depend on livestock products for consumption and sale and raise income through sale of livestock.
The price was 11 percent higher than the average price recorded in same month last year and 35 percent higher than the long term mean price of cattle
4.1.2 Goat Prices
JAN FEB MAR APR MAY JUN JUL AUG SEP OCT NOV DEC
LTM (2010-2014) 1911 1837 1796 1776 1635 1745 1743 1888 1877 1883 1998 2197
YEAR 2015 2502 1400 2250 2690 2700 2300 2200 2400 2500 2700 2900
0
1000
2000
3000
4000
GO
AT
PR
ICE
IN
KS
HS
AVERAGE GOAT PRICE IN THE COUNTY IN COMPARISON TO THE LONG TERM MEAN PRICE
Figure 8: Average goat price at market level in Kilifi County.
Page 9 of 14
The average market price of a medium sized goat increased further by 7 percent from Ksh2,700 recorded in October to trade at Ksh2,900 in the current month.
The increase in average goat price was due to good body condition occasioned by the availability of browse.
The highest average goat prices were recorded in the cash cropping/dairy zone at Ksh3,500 while the least prices were recorded in the livestock farming /ranching zone at Ksh2,600
The average goat price in the current month was 18 percent higher than the average goat price for the for the same month last year and 45 percent higher than the county long term mean.
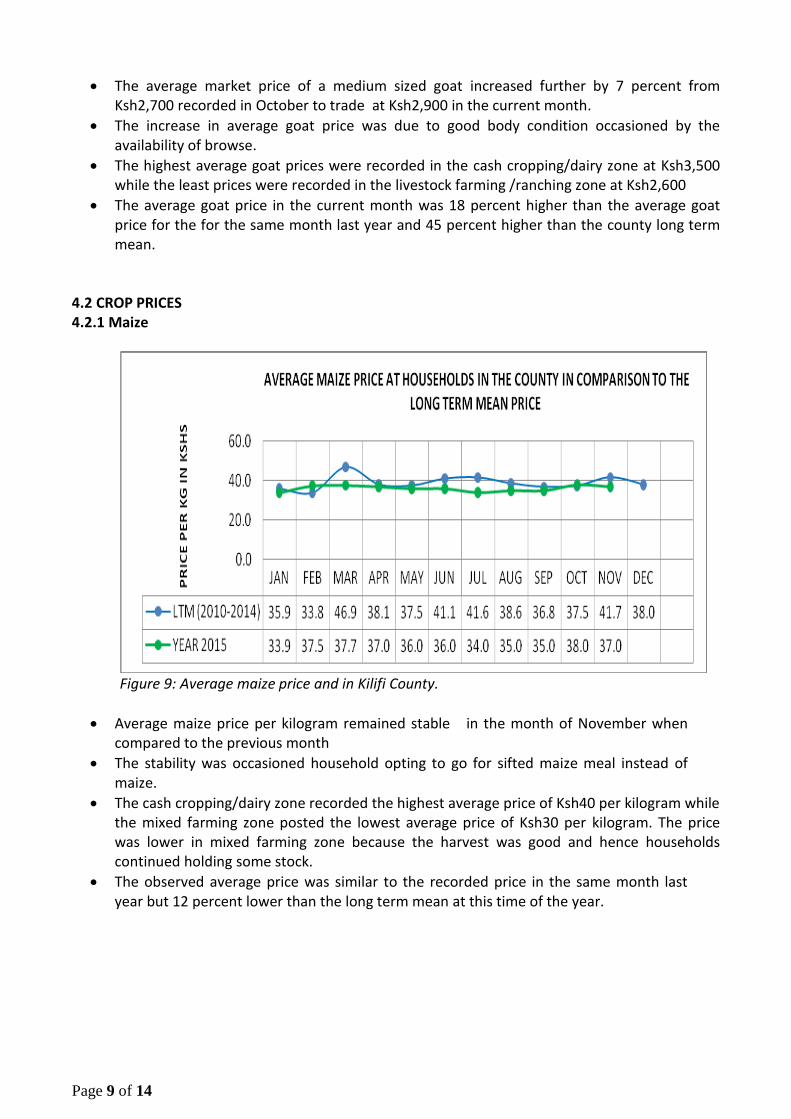
4.2 CROP PRICES 4.2.1 Maize
Figure 9: Average maize price and in Kilifi County.
Average maize price per kilogram remained stable in the month of November when compared to the previous month
The stability was occasioned household opting to go for sifted maize meal instead of maize.
The cash cropping/dairy zone recorded the highest average price of Ksh40 per kilogram while the mixed farming zone posted the lowest average price of Ksh30 per kilogram. The price was lower in mixed farming zone because the harvest was good and hence households continued holding some stock.
The observed average price was similar to the recorded price in the same month last year but 12 percent lower than the long term mean at this time of the year.

Page 10 of 14
4.2.2 Beans
Figure 10: Average beans price in Kilifi County.
Average beans price per kilogram remained stably high in the month under review at Ksh88, the high average price of beans is due to the market forces of demand and supply for the beans which are normally imported from other counties.
The food cropping zone recorded the highest average price of Ksh97 per kilogram while the cash cropping/dairy zone posted the lowest average price of Ksh77 per kilogram.
The average beans price is expected to remain stably high due to soon depletion of cowpeas and green grams and high transportation costs.
The average price recorded in November was similar to the county long term mean price at this time of the year.
4.3 TERMS OF TRADE
The terms of trade determines the purchasing power of livestock keepers.
Figure 11: Terms of Trade for the livestock keepers
The terms of trade were favourable for the livestock keepers in the month under review compared to the previous month. The livestock farmers were able to buy 78 kiliograms of maize by selling one goat.
The terms of trade was positively affected by slight decrease in average price of maize in the current month.

Page 11 of 14
The terms of trade during the month was 20 percent higher than the same month last year and 63 percent higher than the long term mean.
5.0 NUTRITIONAL STATUS
5.1 Milk Consumption
On average, 48 percent of the total milk produced in November was consumed at household level while the rest was sold to supplement households’ income.
Average milk price remained stable at Kshs42 per litre at the household 5.2 Health and Nutritional Status 5.2.1 Mid Upper Arm Circumference [MUAC]
Figure 12: Proportion of children at risk of malnutrition (MUAC< 135mm) [n=1,230]
Average percentage of children under five years at risk of malnutrition slightly increased to 2.3 percent in the month under review. This implies that household food security continued deteriorating.
The increase may be attributable to diminishing household stocks coupled with increase in family size as a result of school holidays.
Though the proportion of children under five years at risk of malnutrition recorded in the current month was lower than long term mean.
Some sites like Jila and Banda la Salama sentinel site from the livestock farming/ranching zone and the food cropping zone respectively recorded 7% and 6% of under-fives at risk of malnutrition.

Page 12 of 14
5.3 COPING STRATEGIES 5.3.1 Coping Strategy Index
Figure 13: Coping Strategy Index for Kilifi County
Coping Strategy Index (CSI) slightly increased to 1.4 in the month under review, implying decline in household food security.
Common coping mechanisms employed by food insecure households in November were; Reduction in number and meal rations. Opting for less preferred or cheaper meals. Consumption of seed stock Borrowing food from friends and relatives. Purchase of food on credit terms

Page 13 of 14
6.0 CURRENT INTERVENTION MEASURES.
6.1 Food- aid
Supplementary/ Therapeutic feeding program in health facilities by County Department of Health/WFP/UNICEF and Kenya Red Cross.
6.2 Non-food aid
Livestock vaccination against RVF by County and National government across the county.
Community awareness creation on El-NINO by all stakeholders in the county.
Vaccination against Elephantiasis by MoH
Adu Ward in the livestock farming zone community capacity building on Contingency planning by NDMA
Expansion of water pipeline, borehole drilling and equipping in Magarini sub county by World Vision
Improved extension services to fish, poultry and Goats farmers in Magarini sub county by World Vision
Promotion on local poultry projects by ASDSP, KALRO.
Promotion on African Bird Eye Chill (ABEC) projects by ASDSP and Equator Kenya Limited.
Promotion of fruit tree growing and agro forestry, promotion on meat goat in Ganze sub county by World Vision
Cash for Asset by GoK/ WFP, World Vision, Kenya Red Cross Society and NDMA in Ganze, Kaloleni, Malindi, Rabai and Magarini Sub Counties.
Cassava Revitalization and Commercialization by CAST/ASDSP/NDMA in Kilifi county
Children under five growth monitoring at village level by community health workers.
Support on Irrigation in Magarini and Ganze sub-counties by KRCS, World Vision, Plan
international, Jica and MoA.
Extension of water pipeline across the sub counties by county department of water
Community capacity building on appropriate infant and young child feeding practices
(mother-to-mother support groups) by county department of Health, Plan International and
World Vision.
7.0 FOOD SECURITY PROGNOSIS
Recharge of water sources expected to improve as the rains continued, vegetable availability expected to improve too due to the rains and Short rains crop condition expected to remain good thus better harvest.
On average, forage condition expected to recorded more improvement as the rains continues and supply to remain stable in the next three months.
The rainfall will impact positively on the development of pasture and browse which will in turn increase milk production and consequently consumption.
Minimal livestock migration expected thus increased milk production due less constraints due to pasture and water.
Kilifi North and Malindi sub counties continued recording lowest VCI and there is need for close monitoring of the situation.

Page 14 of 14
8.0 RECOMMENDATIONS
Extension of pipeline and rehabilitation of boreholes in Adu ward -Action: County department of Water.
Community sensitization on water harvesting technology for crop production and household use as the short rains season approach. Action: County Government through Agriculture department and other stakeholders.
Intensifying pest and disease management preparedness during the ongoing short rain season. Action: County department of Agriculture department and other stakeholders.
Community awareness creation on treatment of water for drinking as percentage of households using water pans is expected to rise when the short rains commence in October to curb cases of diarrhoea in children under five years- Action: County department of health.
Increase community sensitization on proper hygiene and sanitation during this short rains season –Action: County department of Health.
Close monitoring of malnutrition status in the county, mothers sensitization on diet diversification for the under-fives in areas of Chonyi in the food cropping zone. Action: County department of Health.
Scale-up screening and referral of malnutrition cases for rehabilitation-Action: County department of Health.
Scale-up of therapeutic feeding programs to cover all needy areas in the county-Action: County department of Health.
Community sensitization on proper human waste disposal to reduce cases of diarrhea as the rainy season approach - Action: County department of Health.
Ganze sub county (Jaribuni, Sokoke and Bamba) wards community capacity building on DRR-- Action: Plan International