Mutual of Omaha 401(k) Long-Term Savings Plan
90
Congratulations. You’re now eligible to participate in the Mutual of Omaha 401(k) Long- Term Savings Plan – a company-sponsored retirement savings plan designed to help you prepare for retirement. This plan provides many unique advantages not available through other types of savings plans. • It’s easy. Your contributions are automatically deducted from your paycheck, so you don’t have to write a check or make a deposit • It’s flexible. You decide how much to contribute and where to invest your money • It reduces your current income tax. The money you contribute to the plan is not subject to Federal income tax or most state income taxes until you use it. This means your current tax liability may be reduced • It helps you build financial security. Saving for retirement is always a good idea; starting early is an even better idea This enrollment booklet explains the plan and helps you determine how much to save, where to invest your money, and how to get started. We hope you’ll begin the journey to financial security and choose to participate in the plan. Sign up today to start saving for a comfortable retirement tomorrow. Sincerely, Mutual of Omaha
Transcript of Mutual of Omaha 401(k) Long-Term Savings Plan

Congratulations. You’re now eligible to participate in the Mutual of Omaha 401(k) Long-Term Savings Plan – a company-sponsored retirement savings plan designed to help you prepare for retirement. This plan provides many unique advantages not available through other types of savings plans.
• It’s easy. Your contributions are automatically deducted from your paycheck, so you don’t have to write a check or make a deposit
• It’s flexible. You decide how much to contribute and where to invest your money • It reduces your current income tax. The money you contribute to the plan is not
subject to Federal income tax or most state income taxes until you use it. This means your current tax liability may be reduced
• It helps you build financial security. Saving for retirement is always a good idea; starting early is an even better idea
This enrollment booklet explains the plan and helps you determine how much to save, where to invest your money, and how to get started. We hope you’ll begin the journey to financial security and choose to participate in the plan. Sign up today to start saving for a comfortable retirement tomorrow. Sincerely, Mutual of Omaha

table of contents
n why should i save for retirement? page 1
n what is a defined contribution plan? page 2
n how much do i need to save? page 4
n where should i invest my money? page 8
n how do i get started? page 14
n my plan information page 15
MUGC8723_0109


WHY sHoUlD I saVe foR RetIReMent?
Where do you see yourself in five years? How about in 10, 20 or 30
years? If your plans include retirement, you’ll have many options to
consider. For example, what kind of lifestyle do you want? Do you
dream of a quiet life at home, or of whirlwind travels around the
world? Maybe you want a little of both.
To turn your dreams into reality, it’s important to plan and save now. Unlike previous generations, today’s workers may not be able to rely on Social Security or employer pension plans to provide the majority of their retirement income. Today, you are responsible for saving enough money to meet your retirement income needs.
why you need to save nowExperts suggest that you’ll need between 70 and 90 percent of your current income – adjusted for inflation – to maintain the same lifestyle in retirement. But depending on when you retire, Social Security most likely will not cover your needs. The majority of your retirement income will have to come from other sources such as personal savings, an individual IRA or a company-sponsored retirement plan. With benefits such as tax-deferred savings and compounding growth, your company’s defined contribution plan can help you save enough money to enjoy a comfortable retirement.
mutual of omaha retirement services get retirement right®
HOW MUCH WILL SOCIAL SECURITY HELP?The estimated average monthly Social Security benefit is $1,080.
Source: Social Security
Administration, 2007
current income sources for today’s retirees
Source: Social Security Administration, Income of the Aged Chartbook, 2004
Social Security
Pensions
Asset Income
Other
38.6%
26.3%
19.7%
12.6%
2.7%
Earnings
1

mutual of omaha retirement services get retirement right®
WHat Is a DefIneD contRIbUtIon Plan?
A defined contribution plan – such as a 401(k) or 457 plan – is an affordable way to save for retirement.
It’s similar to a savings account, but with additional benefits.
adamInvests in a Savings Account
michaelInvests in a Defined Contribution Plan
Monthly Gross Pay $2,000.00 $2,000.00
Pretax Savings/Deduction $0 $100.00
Taxable Income $2,000.00 $1,900.00
Taxes $550.00 $522.50
After-Tax Savings $100.00 $0
Net Pay After Savings $1,350.00 $1,377.50
Total Amount Invested $100.00 $100.00
Total Cost of Investment $100 $72.50
For illustration purposes only. Adam and Michael are fictitious characters and are not intended to represent real investors.
Calculations assume a 27.5 percent tax bracket and include federal tax withholding only.
* Availability of a company match varies by plan.
employer contributionsWhen you contribute money to a defined contribution plan, your employer also may contribute to your account.* This contribution is called a company match. The amount is based on your salary and how much you contribute – so the more you save, the more money you may be able to receive (up to your plan’s matching limit).
convenience of automatic deductions A defined contribution plan helps you save regularly. Choose how much you’d like to contribute per
paycheck, and that amount is automatically deducted from your wages and deposited into your account. Contributions are flexible, so you can change the amount as needed.
tax advantages Your contributions are deducted from your paycheck before taxes, which means it costs you less to save more. In the following example, Michael’s $100 contribution to his company’s tax-deferred plan costs $27.50 less than Adam’s $100 deposit into his taxable savings account.
2

mutual of omaha retirement services get retirement right®
the power of tax-deferred investingAdditionally, you won’t have to pay income taxes on any of the money in your defined contribution plan until you use it. Meanwhile, it will grow tax free for years – allowing you to accumulate more than if you’d put your money in a taxable savings account.
In the illustration, Adam invests $100 a month in a taxable account such as his savings account. That means his earnings are taxed annually at a rate of 27.5 percent. In 20 years, his account will be worth $44,547.
Michael invests $100 a month in his company’s defined contribution plan. Since his account is tax deferred, his savings grow to $57,266. When he begins to withdraw his money in retirement, he potentially may be in a lower tax bracket of 15 percent and, if elected, would receive a lump-sum amount of $48,676.*
By taking advantage of the tax savings of your company’s plan, it costs less to save, and your savings may grow faster, helping you reach your retirement goals sooner.
access to your moneyAny contributions you make to your company’s plan, as well as the earnings on those contributions, belong to you. If you leave your employer, you can roll your vested balance into another employer’s plan or an individual IRA to maintain its tax-deferred status. You also can opt
to take a cash withdrawal, although the money will be taxed and penalties may apply if you are younger than age 59½.*
Sometimes, people need access to their long-term savings for unexpected health-care costs, or to purchase a home, or to pay for education. Should you need access to your account, be aware of the specific rules that govern early distributions. Check the Plan Highlights section of this booklet or contact your plan administrator for more information.
* Under current federal income-tax laws.
0
10,000
20,000
30,000
40,000
50,000
60,000
Adam Michael
$44,547
$57,266
Assumes an 8 percent annualized return on both accounts.
3

HoW MUcH Do I neeD to saVe?
The amount you need to invest to meet your retirement savings goals
depends on your individual situation. This section outlines some
factors to consider and provides some general guidelines.
how much will i need in retirement? Depending on your retirement plans, you likely will need 70 to 90 percent of your pre-retirement income to maintain a similar standard of living. If you plan to have your mortgage paid off and spend most of your time close to home, 70 percent may be enough. If you plan to travel or maintain vacation property, you may need 90 percent or more.
how will inflation affect my savings?Inflation will increase the cost of goods and services in the future. This means that $1 will not buy as much several years from now as it does today. Make sure to consider inflation when calculating your retirement income needs.
mutual of omaha retirement services get retirement right®
More than 4 in 10 workers who calculate their savings needs change their retirement planning as a result.
Source: EBRI Retirement
Income Research, 2004
take a look at how prices may change over time:
today in 15 years in 25 years
New Car $24,000 $43,100 $63,670
Week-long Vacation $2,500 $4,490 $6,630
Winter Coat $150 $269 $398
1 Lb. of Coffee $2.87 $5.15 $7.61
Source: InflationData.com, 2008
Current prices are estimates. Future prices based on an annual 3.98 percent rate of inflation.
why does my life expectancy matter?As life expectancies continue to increase, so do the number of years in retirement. This is good news, but it also means that your retirement savings need to last even longer.
education work retirement
18+ Years 40+ Years 18+ Years
4
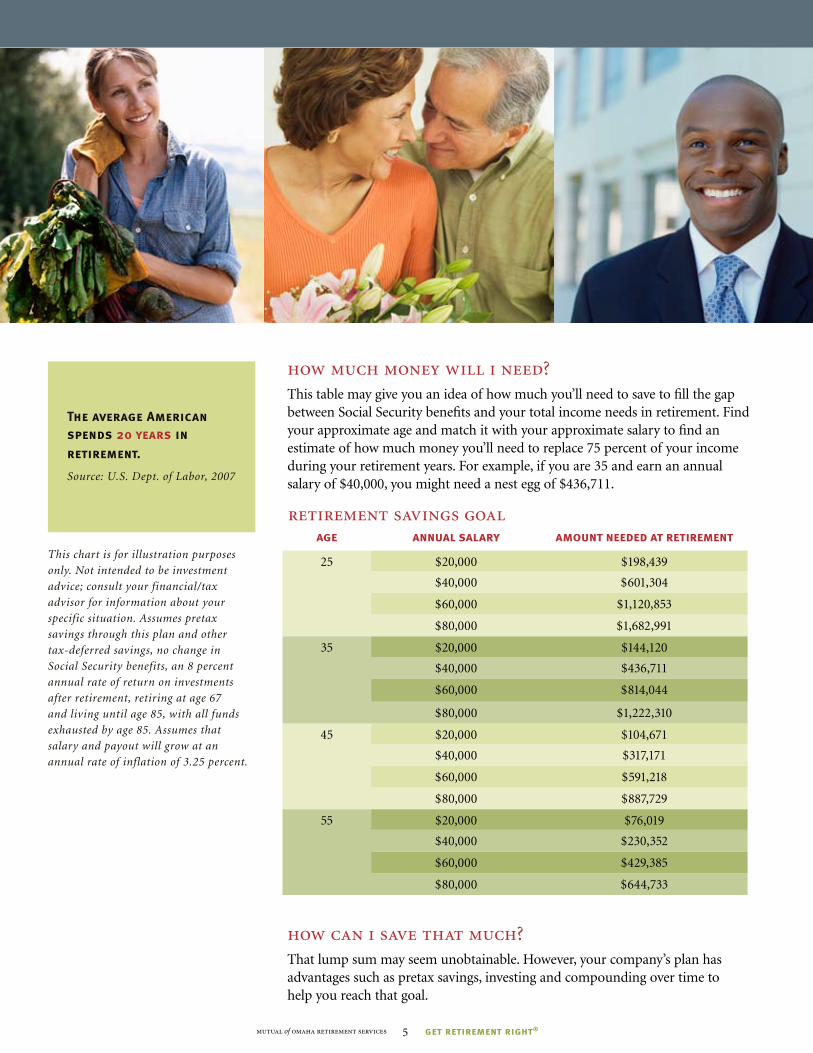
how much money will i need?This table may give you an idea of how much you’ll need to save to fill the gap between Social Security benefits and your total income needs in retirement. Find your approximate age and match it with your approximate salary to find an estimate of how much money you’ll need to replace 75 percent of your income during your retirement years. For example, if you are 35 and earn an annual salary of $40,000, you might need a nest egg of $436,711.
how can i save that much?That lump sum may seem unobtainable. However, your company’s plan has advantages such as pretax savings, investing and compounding over time to help you reach that goal.
mutual of omaha retirement services get retirement right®
The average American spends 20 years in retirement.
Source: U.S. Dept. of Labor, 2007
retirement savings goalage annual salary amount needed at retirement
25 $20,000 $198,439
$40,000 $601,304
$60,000 $1,120,853
$80,000 $1,682,991
35 $20,000 $144,120
$40,000 $436,711
$60,000 $814,044
$80,000 $1,222,310
45 $20,000 $104,671
$40,000 $317,171
$60,000 $591,218
$80,000 $887,729
55 $20,000 $76,019
$40,000 $230,352
$60,000 $429,385
$80,000 $644,733
This chart is for illustration purposes
only. Not intended to be investment
advice; consult your financial/tax
advisor for information about your
specific situation. Assumes pretax
savings through this plan and other
tax-deferred savings, no change in
Social Security benefits, an 8 percent
annual rate of return on investments
after retirement, retiring at age 67
and living until age 85, with all funds
exhausted by age 85. Assumes that
salary and payout will grow at an
annual rate of inflation of 3.25 percent.
5
mutual of omaha retirement services get retirement right®
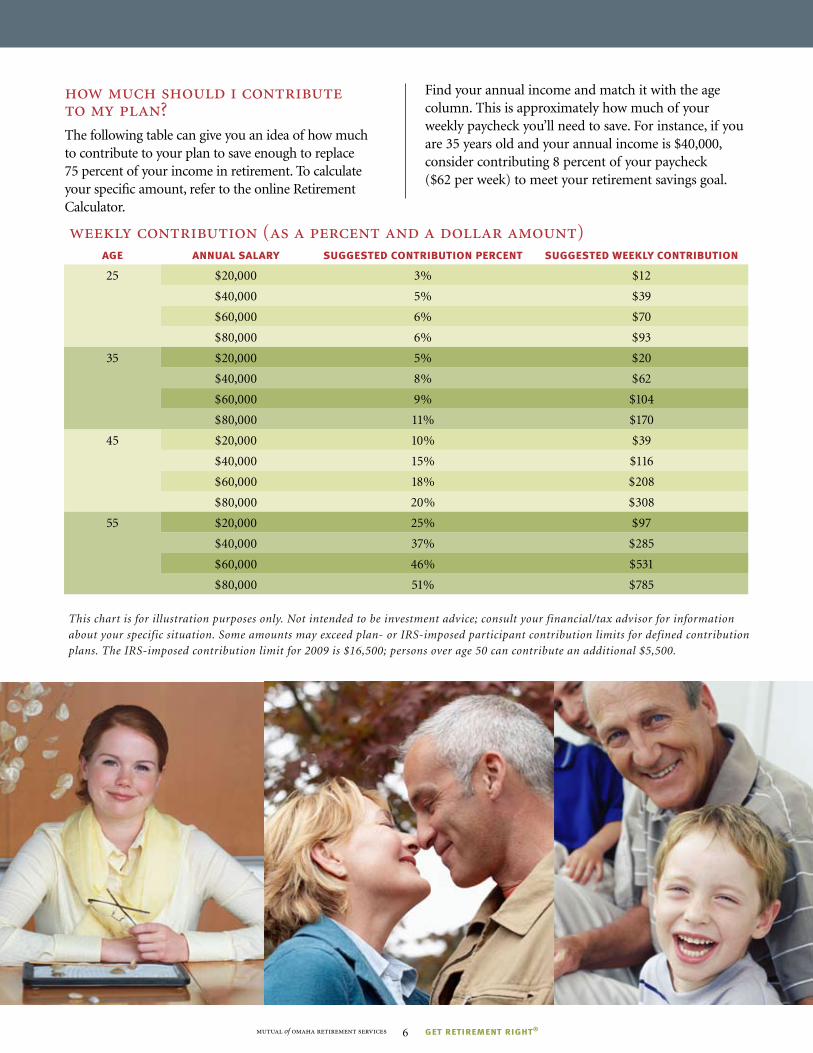
how much should i contribute to my plan?The following table can give you an idea of how much to contribute to your plan to save enough to replace 75 percent of your income in retirement. To calculate your specific amount, refer to the online Retirement Calculator.
Find your annual income and match it with the age column. This is approximately how much of your weekly paycheck you’ll need to save. For instance, if you are 35 years old and your annual income is $40,000, consider contributing 8 percent of your paycheck ($62 per week) to meet your retirement savings goal.
weekly contribution (as a percent and a dollar amount)age annual salary suggested contribution percent suggested weekly contribution
25 $20,000 3% $12
$40,000 5% $39
$60,000 6% $70
$80,000 6% $93
35 $20,000 5% $20
$40,000 8% $62
$60,000 9% $104
$80,000 11% $170
45 $20,000 10% $39
$40,000 15% $116
$60,000 18% $208
$80,000 20% $308
55 $20,000 25% $97
$40,000 37% $285
$60,000 46% $531
$80,000 51% $785
This chart is for illustration purposes only. Not intended to be investment advice; consult your financial/tax advisor for information
about your specific situation. Some amounts may exceed plan- or IRS-imposed participant contribution limits for defined contribution
plans. The IRS-imposed contribution limit for 2009 is $16,500; persons over age 50 can contribute an additional $5,500.
6

why does starting early make a difference?Starting early can make a big difference in the amount you need to save. If you’re in your 20s or 30s, you may be able to reach your retirement savings goals by saving 5-10 percent of your salary. If you’re in your 40s, you may need to invest 15 percent or more of your salary to reach the same goal.
why is time important?The earlier you start, the more time your money has to grow. When you invest in your company’s plan, you earn a return not only on the money you contribute but also on the earnings those contributions generate (and on the earnings those earnings generate). That’s the magic of compounding – but it takes time to work. The following chart illustrates the difference starting early can make.
mutual of omaha retirement services get retirement right® 7
The sooner you start saving, the less you may need to save overall to reach your retirement goal.
the benefits of starting earlyEven though Alana contributed more money to her retirement savings plan, Suzanne ended up with nearly twice as much at age 65. Why? Because Suzanne started early and took advantage of the power of time and compounding.
This illustration assumes an 8 percent nominal
growth per year with money deposited at the
beginning of the month. This rate is used for
illustration purposes only and doesn’t represent
the actual performance of any specific investment.
There’s no guarantee that any particular return
will be achieved, and past performance is no
guarantee of future results. Investment returns
will vary and principal values, when redeemed,
may be worth more or less than the original
investment. Where applicable, figures have been
reduced based on a tax rate of 27.5 percent.
Suzanne
AlanaTotal account value at 65 = $324,180
Total account value at 65 = $171,798
Total contributions: $48,000
Total contributions: $72,000
Suzanne starts at age 25 and contributes $100 a month
Alana starts at age 45 and contributes $300 a month

what’s my time horizon?Time horizon refers to the amount of time you have until you need to begin withdrawing your retirement savings. Typically, the longer your time horizon, the more risk you can take, because you have time to weather the ups and downs of the market.
what’s my risk tolerance?Risk tolerance refers to your comfort level with investment risk. How comfortable are you with the possibility of a short-term loss? Would you prefer investments that seek to preserve your capital but offer lower long-term growth potential? Or, are you willing to tolerate gains and losses in your portfolio with higher-risk investments that may provide higher long-term growth?
The risk and return relationship
Historically, investments with higher risk offer the potential for higher returns over the long term. Lower-risk investments are less volatile and historically generate lower returns over the long term. To reduce
your risk exposure, you may choose to create a diversified portfolio, which includes a mix of different types of investments.
It’s possible, however, to invest too conservatively. If your investments don’t keep up with inflation, your dollars won’t buy as much. When you use conservative investments, you may need to save more to meet your retirement goals.
mutual of omaha retirement services get retirement right®
WHeRe sHoUlD I InVest MY MoneY?
How you should invest your money depends on your retirement-income needs, comfort with taking risk
and length of time before retirement. This section will help you identify an appropriate investment strategy.
First, consider your time horizon and tolerance for risk.
<5 yearsshort-term
time horizon
5-15 yearsintermediate-
term time horizon
15 years or morelong-term
time horizon
length of time until retirementri
sk
8

diversification One way to lower the risk and volatility in your portfolio is through diversification. By spreading your money over a number of different investments (diversifying), no single investment makes up too great a part of the overall portfolio. If one investment declines
in value, the impact on your portfolio may be limited. Diversification can take several forms. You can diversify by investing in multiple asset classes – for example, stocks and bonds. You also can diversify by investing in different types of funds within a given asset class. For example, investing in growth stocks and value stocks, or U.S. stocks and international stocks.
mutual of omaha retirement services get retirement right®
This chart shows the highest, lowest and average return over the last 20 years of different types of investments.
(20-year period ending 12/31/2008.)
The following chart illustrates how risk and return affect different types of investments.
historical returns and volatility of different types of investments
legend: Stable Value = 90-day T-billsBonds = BarCap Aggregate Bond Index
U.S. Stocks = S&P 500 IndexInternational Stocks = MSCI EAFE
risk
Stable Value Bonds U.S. StocksInternational
Stocks
low high
9
High: 8.1%Avg: 4.2%Low: 1.0%
High: 18.5%
Avg: 7.6%
Low: -2.9%
High: 37.6%
Avg: 10.4%
Low: -37.0%
High: 38.6%
Avg: 5.4%
Low: -43.4%

mutual of omaha retirement services get retirement right® 10
major types of investmentsThe major types of investments (also called asset classes) include:
Stocks: Stocks represent ownership in a company. Historically, stock funds have provided higher long-term returns, but with a high degree of volatility. The stock asset class can be further divided into different types of stocks, such as growth or value stocks, different size companies, and U.S. and international stocks.
Bonds: A bond is a loan to the government or a corporation. The bond entitles you to repayment of the loan with interest after a certain period of time. Bond funds tend to be lower-risk investments than stocks, but with lower long-term returns.
Stable Value: Stable Value funds deliver safety and stability by preserving principal and accumulated earnings. They are similar to money market funds but offer potentially higher returns, thus making them comparable to intermediate bonds minus the volatility.
selecting your investmentsNow that you understand the relationship between risk and return, you’re ready to select your investments. You can approach this decision in two ways.
1. Hands-off Investing Through Professional Investment Portfolios*
With so many alternatives available today, choosing investments can be a full-time job. That’s why your plan includes professional investment portfolios, a convenient and tested way to benefit from expert asset allocation and investment selection.
You may select among the five risk-based portfolios called Mutual Directions®, or the nine time-based portfolios called Mutual GlidePathSM. Each portfolio was developed by a professional investment advisor and designed to meet specific investment objectives. The portfolios are automatically rebalanced to the pre-set allocation to keep your investment strategy on track. For more information on these portfolios, refer to the Investment Information section of this booklet.
Choose to invest in a professional investment portfolio if you:
n Like the convenience of a “one-stop shopping” investment option
n Want a professionally designed
and diversified portfolio
n Prefer a hands-off approach
n Don’t have the time to regularly
monitor your portfolio*Adherence to an asset allocation model like these professional
investment portfolios does not guarantee returns or insure
against loss in a declining market.
mutual of omaha retirement services get retirement right® 11
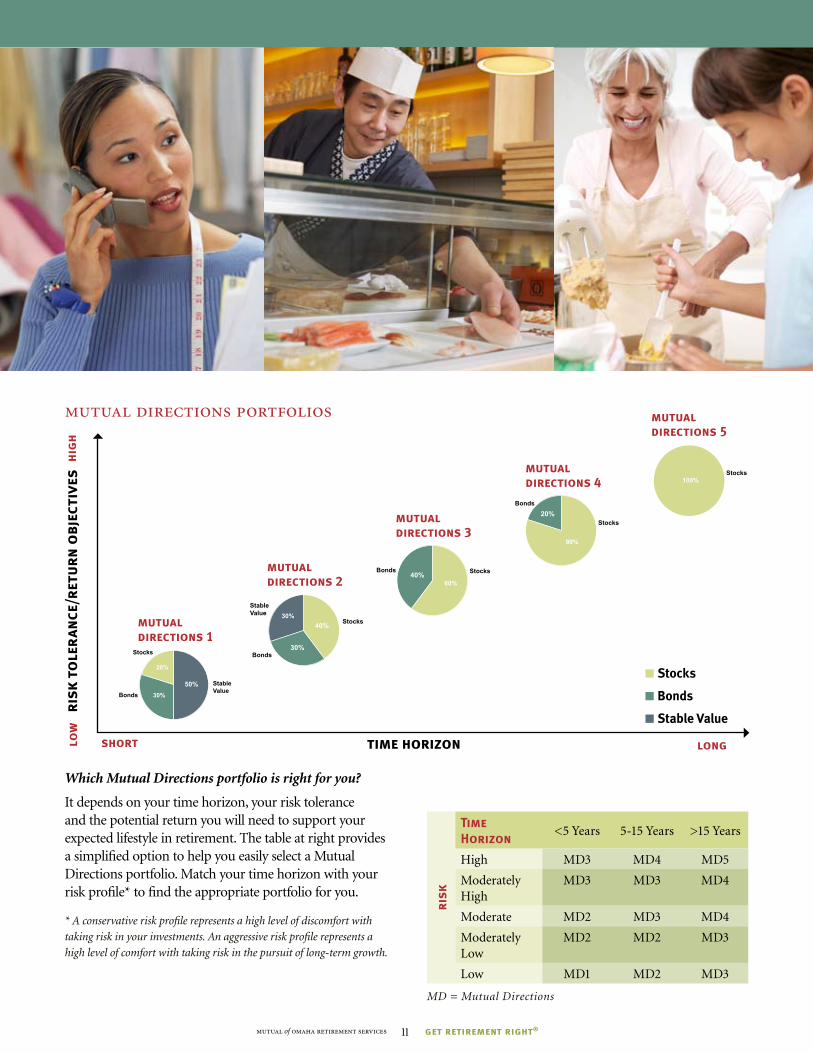
Which Mutual Directions portfolio is right for you?
It depends on your time horizon, your risk tolerance and the potential return you will need to support your expected lifestyle in retirement. The table at right provides a simplified option to help you easily select a Mutual Directions portfolio. Match your time horizon with your risk profile* to find the appropriate portfolio for you.
* A conservative risk profile represents a high level of discomfort with
taking risk in your investments. An aggressive risk profile represents a
high level of comfort with taking risk in the pursuit of long-term growth.
risk
Time Horizon
<5 Years 5-15 Years >15 Years
High MD3 MD4 MD5
Moderately High
MD3 MD3 MD4
Moderate MD2 MD3 MD4
Moderately Low
MD2 MD2 MD3
Low MD1 MD2 MD3
MD = Mutual Directions
Stocks
Bonds
Real Estate
Stable Value
26%
50%
20%
30%
Stocks
Bonds
Real Estate
Stable Value
26%
20%
40%
30%
30%
StocksBondsReal Estate
Fixed Income
26%
20%
40%60%
30% Stocks
Bonds
Real Estate
Fixed Income
26%
20%20%
80%
30% StocksReal Estate
Fixed Income
26%
20%
100%
30%
time horizon
risk
to
ler
ance
/ret
urn
obj
ecti
ves
hig
hlo
w
short long
mutual directions 1
mutual directions 2
mutual directions 3
mutual directions 4
mutual directions 5
n Stocks
n Bonds
n Stable Value
mutual directions portfolios
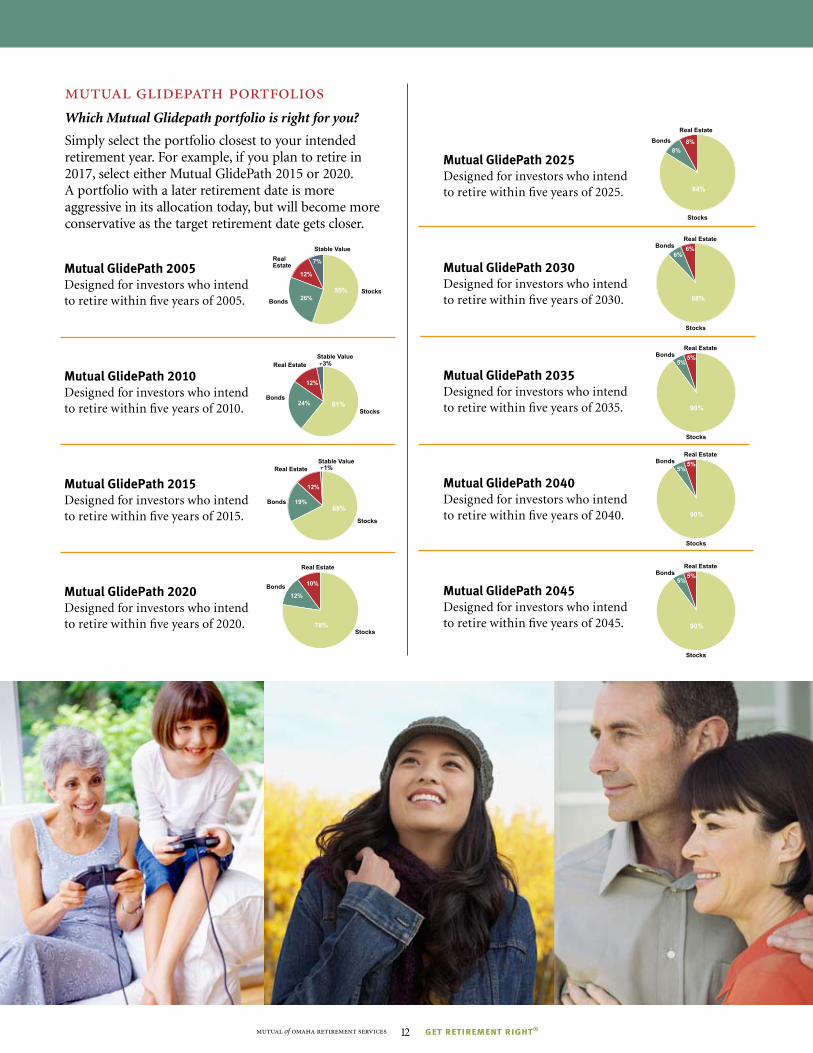
Mutual GlidePath 2005Designed for investors who intend to retire within five years of 2005.
Mutual GlidePath 2010Designed for investors who intend to retire within five years of 2010.
Mutual GlidePath 2015Designed for investors who intend to retire within five years of 2015.
Mutual GlidePath 2020Designed for investors who intend to retire within five years of 2020.
Stocks
Bonds
Real Estate
Stable Value
55%26%
12%
7%
Stocks
Bonds
Real Estate 3%Stable Value
61%24%
12%
Stocks
Bonds
Real Estate
68%19%
12%
1%Stable Value
Stocks
Bonds
Real Estate
78%
12%
10%
mutual of omaha retirement services get retirement right® 12
mutual glidepath portfoliosWhich Mutual Glidepath portfolio is right for you?
Simply select the portfolio closest to your intended retirement year. For example, if you plan to retire in 2017, select either Mutual GlidePath 2015 or 2020. A portfolio with a later retirement date is more aggressive in its allocation today, but will become more conservative as the target retirement date gets closer.
Stocks
Bonds
Real Estate
84%
8%
8%
Mutual GlidePath 2025Designed for investors who intend to retire within five years of 2025.
Mutual GlidePath 2030Designed for investors who intend to retire within five years of 2030.
Mutual GlidePath 2035Designed for investors who intend to retire within five years of 2035.
Mutual GlidePath 2040Designed for investors who intend to retire within five years of 2040.
Mutual GlidePath 2045Designed for investors who intend to retire within five years of 2045.
6%6%
Stocks
BondsReal Estate
88%
90%
5%5%
Stocks
BondsReal Estate
90%
5%5%
Stocks
BondsReal Estate
90%
5%5%
Stocks
BondsReal Estate

mutual of omaha retirement services get retirement right® 13
2. Hands-on Investing By Building Your Own Portfolio
You may want to build your own mix of investments by selecting from the options provided in your plan. With this option, you can customize your portfolio by picking a mix of stock, bond, and stable value options that works best for your needs and preferences. Refer to the Investment Information section for more information on the specific options available to you.
Choose to build your own portfolio if you:
n Feel comfortable making your own investment selections
n Have the time and knowledge to maintain your portfolio
n Would like a high level of involvement in your investment selection and monitoring
n Require an unusual asset mix, e.g., if you plan to coordinate with other personal investments
When selecting your investment mix, keep in mind the risk and potential return levels of the different asset classes available.
Stable Value
Bonds
Stocks
risk
pote
nti
al r
etu
rn
International Stocks
risk/return profiles of different types of investment options

HoW Do I Get staRteD?
Enrolling in your company’s defined contribution plan is easy and convenient. Before you begin, review
the Plan Highlights section of this booklet for specific information about your plan. Also review the
Investment Information section to learn more about the specific investments available to you.
To begin, follow these simple steps:
1. determine how much to contributeDecide how much you want to have deducted automatically from your paycheck and contributed to your plan. Use the weekly contribution chart in the How Much Do I Need to Save? section to help you determine how much to save. To calculate a more precise savings goal based on your personal situation, complete the Retirement Calculator.
2. choose how to invest your moneyFirst, determine what type of investor you are – hands on or hands off. For more information, refer to the chart in the Where Should I Invest My Money? section.
Next, select a professional investment portfolio or mix of investments from the available options. Determine
the percentage of your contribution you’d like directed to each investment. If you don’t choose to invest in one of the pre-mixed portfolios, remember to diversify.
3. enroll in the planYou’re ready to get started. Enrollment is where it all begins. Simply complete the enrollment and beneficiary forms in the back of this booklet, and return them to your company’s plan representative. If you have money in another qualified retirement plan that you’d like to transfer to this plan, refer to the rollover instructions in the back of this booklet.
Once you’ve enrolled and started making contributions, you easily can track your account. Refer to the Account Access section for details.
Congratulations! You’ve made the most important investment by investing in your own future.
mutual of omaha retirement services get retirement right® 14
Investment options are offered through a group variable annuity (Form 900-GAQC-97) issued by United of Omaha Life Insurance Company, which accepts full responsibility for all of United’s contractual obligations under the annuity but does not guarantee any contributions or investment returns except as provided in the annuity for the Guaranteed Account. Neither United of Omaha nor its representatives or affiliates offers investment advice in connection with the product. January 1, 2010
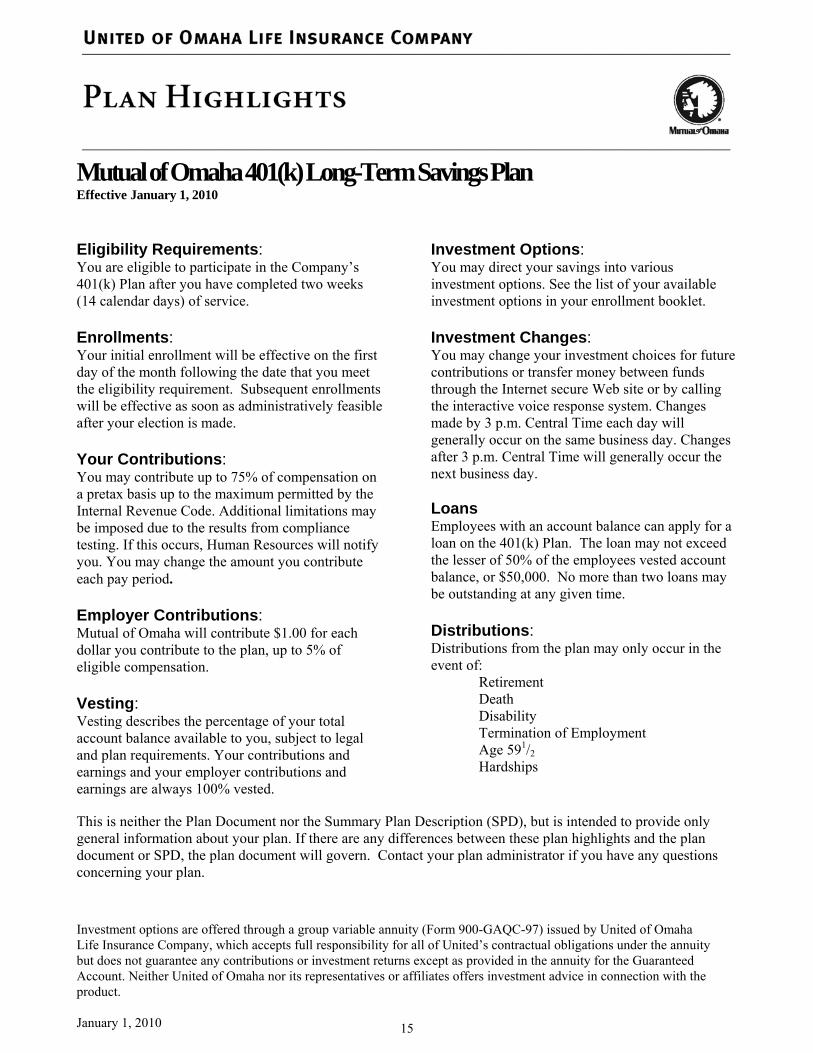
Mutual of Omaha 401(k) Long-Term Savings Plan Effective January 1, 2010
Eligibility Requirements: You are eligible to participate in the Company’s 401(k) Plan after you have completed two weeks (14 calendar days) of service. Enrollments: Your initial enrollment will be effective on the first day of the month following the date that you meet the eligibility requirement. Subsequent enrollments will be effective as soon as administratively feasible after your election is made. Your Contributions: You may contribute up to 75% of compensation on a pretax basis up to the maximum permitted by the Internal Revenue Code. Additional limitations may be imposed due to the results from compliance testing. If this occurs, Human Resources will notify you. You may change the amount you contribute each pay period. Employer Contributions: Mutual of Omaha will contribute $1.00 for each dollar you contribute to the plan, up to 5% of eligible compensation. Vesting: Vesting describes the percentage of your total account balance available to you, subject to legal and plan requirements. Your contributions and earnings and your employer contributions and earnings are always 100% vested.
Investment Options: You may direct your savings into various investment options. See the list of your available investment options in your enrollment booklet. Investment Changes: You may change your investment choices for future contributions or transfer money between funds through the Internet secure Web site or by calling the interactive voice response system. Changes made by 3 p.m. Central Time each day will generally occur on the same business day. Changes after 3 p.m. Central Time will generally occur the next business day. Loans Employees with an account balance can apply for a loan on the 401(k) Plan. The loan may not exceed the lesser of 50% of the employees vested account balance, or $50,000. No more than two loans may be outstanding at any given time. Distributions: Distributions from the plan may only occur in the event of:
Retirement Death Disability Termination of Employment Age 591/2 Hardships
This is neither the Plan Document nor the Summary Plan Description (SPD), but is intended to provide only general information about your plan. If there are any differences between these plan highlights and the plan document or SPD, the plan document will govern. Contact your plan administrator if you have any questions concerning your plan.
15

16
RPD301
The investment options available in your retirement plan are carefully screened by professional investment managers and cover a wide range of asset classes and styles. For more information, review the investment profiles. Professional Investment Portfolios Mutual Directions 1 Manager: Multiple managers Category: Conservative portfolio Seeks to provide stability of income, with some exposure to stocks for capital appreciation, while attempting to minimize overall risk over the long-term. Mutual Directions 2 Manager: Multiple managers Category: Moderately conservative portfolio Seeks to provide income, in combination with the potential for some growth of capital over the long-term. Mutual Directions 3 Manager: Multiple managers Category: Moderate portfolio Seeks to provide capital appreciation and income over the long-term, by investing in five stock funds and a bond fund. Mutual Directions 4 Manager: Multiple managers Category: Moderately aggressive portfolio Seeks to provide long-term capital appreciation with some opportunity for income. Mutual Directions 5 Manager: Multiple managers Category: Aggressive portfolio Seeks to provide maximum capital appreciation over the long-term.
Mutual Glidepath 2005 Manager: Multiple managers Category: Time-based portfolio Seeks to achieve long-term capital growth by investing in a diversified mix of asset classes and investment styles which becomes increasingly conservative over time. Designed for investors who intend to retire within 5 years of 2005. Mutual Glidepath 2010 Manager: Multiple managers Category: Time-based portfolio Seeks to achieve long-term capital growth by investing in a diversified mix of asset classes and investment styles which becomes increasingly conservative over time. Designed for investors who intend to retire within 5 years of 2010. Mutual Glidepath 2015 Manager: Multiple managers Category: Time-based portfolio Seeks to achieve long-term capital growth by investing in a diversified mix of asset classes and investment styles which becomes increasingly conservative over time. Designed for investors who intend to retire within 5 years of 2015. Mutual Glidepath 2020 Manager: Multiple managers Category: Time-based portfolio Seeks to achieve long-term capital growth by investing in a diversified mix of asset classes and investment styles which becomes increasingly conservative over time. Designed for investors who intend to retire within 5 years of 2020.
17
RPD301
Mutual Glidepath 2025 Manager: Multiple managers Category: Time-based portfolio Seeks to achieve long-term capital growth by investing in a diversified mix of asset classes and investment styles which becomes increasingly conservative over time. Designed for investors who intend to retire within 5 years of 2025. Mutual Glidepath 2030 Manager: Multiple managers Category: Time-based portfolio Seeks to achieve long-term capital growth by investing in a diversified mix of asset classes and investment styles which becomes increasingly conservative over time. Designed for investors who intend to retire within 5 years of 2030. Mutual Glidepath 2035 Manager: Multiple managers Category: Time-based portfolio Seeks to achieve long-term capital growth by investing in a diversified mix of asset classes and investment styles which becomes increasingly conservative over time. Designed for investors who intend to retire within 5 years of 2035. Mutual Glidepath 2040 Manager: Multiple managers Category: Time-based portfolio Seeks to achieve long-term capital growth by investing in a diversified mix of asset classes and investment styles which becomes increasingly conservative over time. Designed for investors who intend to retire within 5 years of 2040. Mutual Glidepath 2045 Manager: Multiple managers Category: Time-based portfolio Seeks to achieve long-term capital growth by investing in a diversified mix of asset classes and investment styles which becomes increasingly conservative over time. Designed for investors who intend to retire within 5 years of 2045.
Mutual Glidepath 2050 Manager: Multiple Managers Category: Time-based portfolio Seeks to achieve long-term capital growth by investing in a diversified mix of asset classes and investment styles which becomes increasingly conservative over time. Designed for investors who intend to retire within 5 years of 2050. Mutual Glidepath 2055 Manager: Multiple Managers Category: Time-based portfolio Seeks to achieve long-term capital growth by investing in a diversified mix of asset classes and investment styles which becomes increasingly conservative over time. Designed for investors who intend to retire within 5 years of 2055. Stable Value/Bonds Bond Index Fund Manager: State Street Global Advisors Category: Intermediate Term Bond Seeks to provide current income, by tracking the Lehman Brothers Government/Credit Index. Risk is expected to be low to moderate. Guaranteed Account Manager: United of Omaha Life Insurance Company Category: Short-Term Fixed Income Provides safety of principal and guaranteed daily compound rates of interest. Risk is considered low. Metropolitan West Total Return Bond Fund Manager: Metropolitan West Asset Management Category: Intermediate Term Bond Seeks to maximize long-term total return. International Stock Funds International Developed Countries Fund Manager: Causeway Capital Management, LLC and Julius Baer Investment Management, LLC Category: Foreign Large-Cap Blend Seeks to provide long-term capital appreciation. Invests in stocks from developed countries outside the U.S.
18
RPD301
International Emerging Markets Fund Manager: State Street Global Advisors Category: Diversified Emerging Markets Seeks to provide maximum total return, generally through capital appreciation, by investing in companies that do business primarily in developing countries. International Stock Index Fund Manager: State Street Global Advisors Category: Large-Cap Core International Tracks the performance of the MSCI® EAFE Index, which measures investment return of stocks from developed markets outside North America. Domestic Stock Funds Growth Fund Manager: RCM Capital Management, LLC Category: Large-Cap Growth Endeavors to provide long-term capital appreciation through investment in large-cap stocks (generally, at least $5 billion in outstanding market value). Growth Stock Index Fund Manager: State Street Global Advisors Category: Large-Cap Growth Tracks the performance of the Russell 1000® Growth Index, which measures investment return of large-capitalization growth stocks. Mid Cap Stock Index Fund Manager: State Street Global Advisors Category: Mid Cap Core Seeks to match as closely as possible, before expenses, the performance of the S&P MidCap 400 Index over the long term. Rainier Small/Mid Cap Equity Portfolio Manager: Rainier Investment Management Category: Small-/Mid-Cap Growth Focuses on companies with prospects of strong earnings growth and attractive overall business fundamentals.
Royce Total Return Fund Manager: Royce & Associates, LLC Category: Small-/Mid-Cap Value Strives for long-term growth of capital and current income. Small Company Fund Manager: Wellington Management Co., LLP Category: Small-Cap Core Strives to provide long-term capital growth through investment in small companies (generally, up to $1 billion in capital). Stock Market Index Fund Manager: State Street Global Advisors Category: Large-Cap Core Seeks to provide long-term growth of principal and income by matching the return of the S&P 500 Stock Index. Strategic Value Fund Manager: Goldman Sachs Asset Management Category: Large-Cap Value Pursues long-term growth of capital. T. Rowe Price Growth Stock Fund Manager: T. Rowe Price Associates Category: Large-Cap Growth Seeks long-term growth of capital and, secondarily, increasing dividend income by investing primarily in common stocks of well-established growth companies. Value Stock Index Fund Manager: State Street Global Advisors Category: Large-Cap Value Tracks the performance of the Russell 1000® Value Index, which measures investment return of large-capitalization value stocks. Vanguard Windsor II Fund Manager: The Vanguard Group Inc. Category: Large-Cap Value Aims to provide long-term growth of capital and, secondarily, some dividend income.
19
RPD301
Specialty Funds Stadion Actively Managed ETF Fund Manager: Stadion Money Management Category: Specialty Fund Stadion Actively Managed Fund employs a defensive strategy using technical market indicators to guide Stadion's decisions on where and when to best position fund assets among various market sectors to achieve the most appropriate balance of growth and safety, including investing some or all of the fund assets in cash. The Fund will invest in exchange traded funds, or ETF's.
20
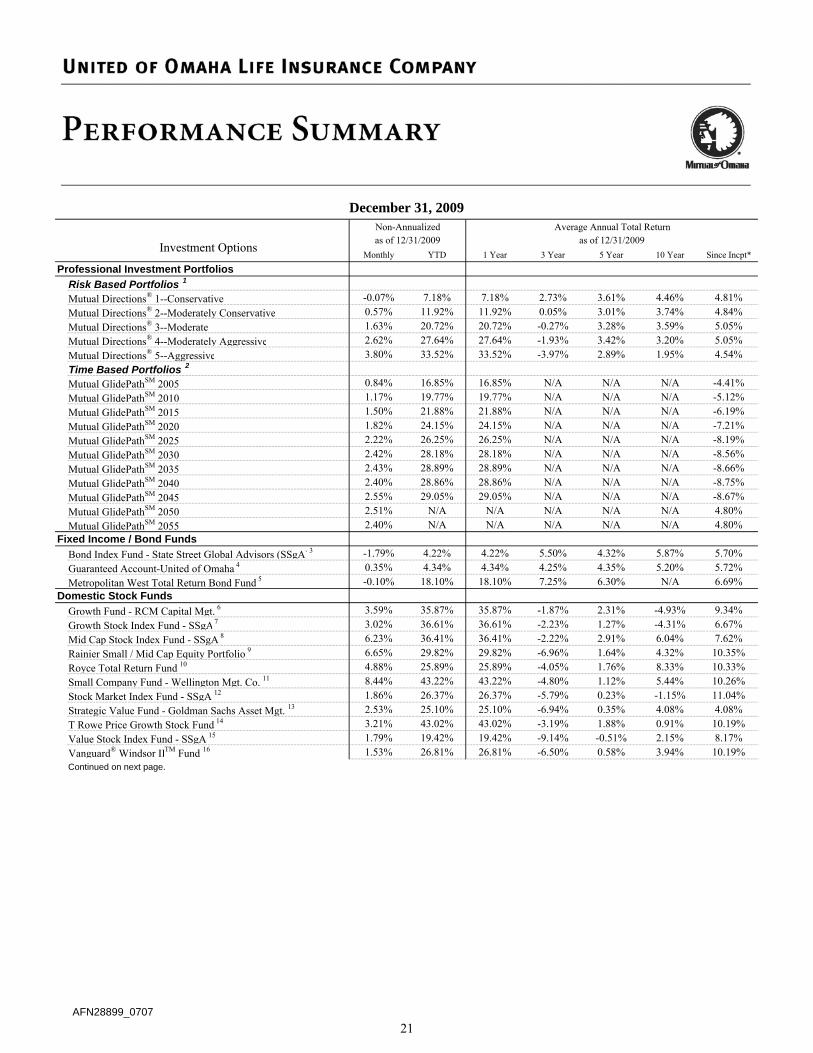
Monthly YTD 1 Year 3 Year 5 Year 10 Year Since Incpt*
Professional Investment Portfolios Risk Based Portfolios 1
Mutual Directions® 1--Conservative -0.07% 7.18% 7.18% 2.73% 3.61% 4.46% 4.81%Mutual Directions® 2--Moderately Conservative 0.57% 11.92% 11.92% 0.05% 3.01% 3.74% 4.84%Mutual Directions® 3--Moderate 1.63% 20.72% 20.72% -0.27% 3.28% 3.59% 5.05%Mutual Directions® 4--Moderately Aggressive 2.62% 27.64% 27.64% -1.93% 3.42% 3.20% 5.05%Mutual Directions® 5--Aggressive 3.80% 33.52% 33.52% -3.97% 2.89% 1.95% 4.54%Time Based Portfolios 2
Mutual GlidePathSM 2005 0.84% 16.85% 16.85% N/A N/A N/A -4.41%Mutual GlidePathSM 2010 1.17% 19.77% 19.77% N/A N/A N/A -5.12%Mutual GlidePathSM 2015 1.50% 21.88% 21.88% N/A N/A N/A -6.19%Mutual GlidePathSM 2020 1.82% 24.15% 24.15% N/A N/A N/A -7.21%Mutual GlidePathSM 2025 2.22% 26.25% 26.25% N/A N/A N/A -8.19%Mutual GlidePathSM 2030 2.42% 28.18% 28.18% N/A N/A N/A -8.56%Mutual GlidePathSM 2035 2.43% 28.89% 28.89% N/A N/A N/A -8.66%Mutual GlidePathSM 2040 2.40% 28.86% 28.86% N/A N/A N/A -8.75%Mutual GlidePathSM 2045 2.55% 29.05% 29.05% N/A N/A N/A -8.67%Mutual GlidePathSM 2050 2.51% N/A N/A N/A N/A N/A 4.80%Mutual GlidePathSM 2055 2.40% N/A N/A N/A N/A N/A 4.80%
Fixed Income / Bond FundsBond Index Fund - State Street Global Advisors (SSgA) 3 -1.79% 4.22% 4.22% 5.50% 4.32% 5.87% 5.70%Guaranteed Account-United of Omaha 4 0.35% 4.34% 4.34% 4.25% 4.35% 5.20% 5.72%Metropolitan West Total Return Bond Fund 5 -0.10% 18.10% 18.10% 7.25% 6.30% N/A 6.69%
Domestic Stock FundsGrowth Fund - RCM Capital Mgt. 6 3.59% 35.87% 35.87% -1.87% 2.31% -4.93% 9.34%Growth Stock Index Fund - SSgA 7 3.02% 36.61% 36.61% -2.23% 1.27% -4.31% 6.67%Mid Cap Stock Index Fund - SSgA 8 6.23% 36.41% 36.41% -2.22% 2.91% 6.04% 7.62%Rainier Small / Mid Cap Equity Portfolio 9 6.65% 29.82% 29.82% -6.96% 1.64% 4.32% 10.35%Royce Total Return Fund 10 4.88% 25.89% 25.89% -4.05% 1.76% 8.33% 10.33%Small Company Fund - Wellington Mgt. Co. 11 8.44% 43.22% 43.22% -4.80% 1.12% 5.44% 10.26%Stock Market Index Fund - SSgA 12 1.86% 26.37% 26.37% -5.79% 0.23% -1.15% 11.04%Strategic Value Fund - Goldman Sachs Asset Mgt. 13 2.53% 25.10% 25.10% -6.94% 0.35% 4.08% 4.08%T Rowe Price Growth Stock Fund 14 3.21% 43.02% 43.02% -3.19% 1.88% 0.91% 10.19%Value Stock Index Fund - SSgA 15 1.79% 19.42% 19.42% -9.14% -0.51% 2.15% 8.17%Vanguard® Windsor IITM Fund 16 1.53% 26.81% 26.81% -6.50% 0.58% 3.94% 10.19%Continued on next page.
as of 12/31/2009Investment Options as of 12/31/2009Non-Annualized Average Annual Total Return
December 31, 2009
AFN28899_070721
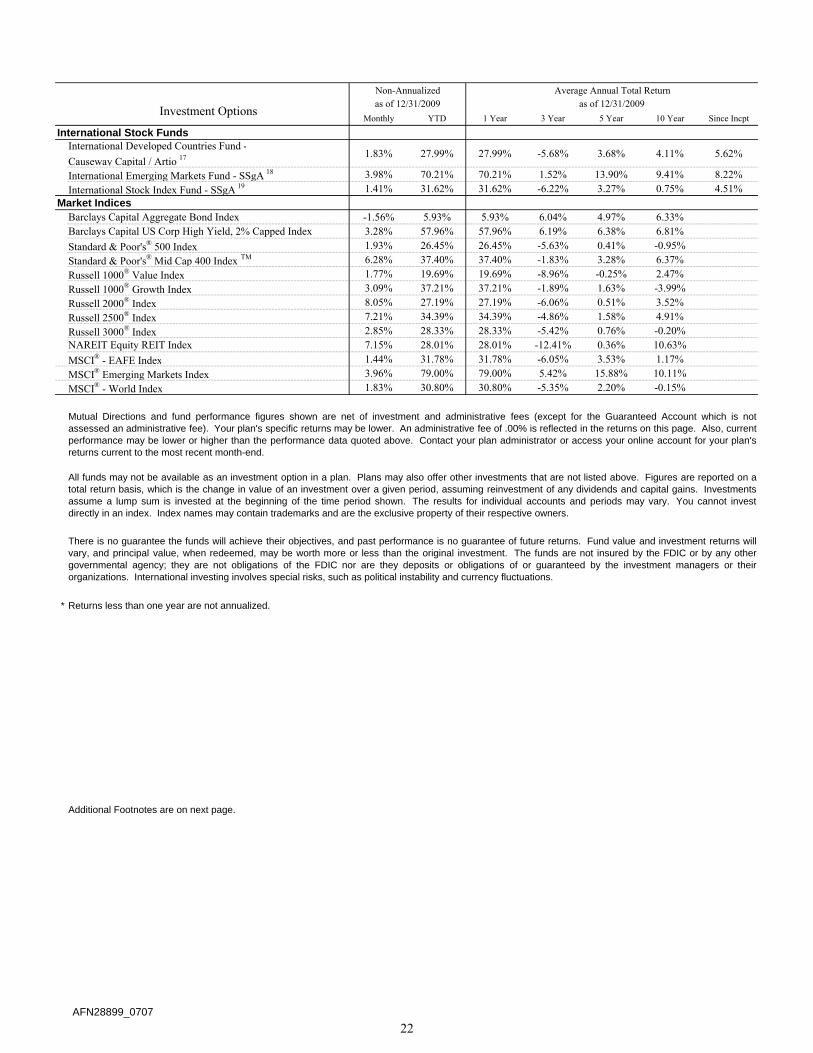
Monthly YTD 1 Year 3 Year 5 Year 10 Year Since Incpt
International Stock FundsInternational Developed Countries Fund -Causeway Capital / Artio 17 1.83% 27.99% 27.99% -5.68% 3.68% 4.11% 5.62%
International Emerging Markets Fund - SSgA 18 3.98% 70.21% 70.21% 1.52% 13.90% 9.41% 8.22%International Stock Index Fund - SSgA 19 1.41% 31.62% 31.62% -6.22% 3.27% 0.75% 4.51%
Market IndicesBarclays Capital Aggregate Bond Index -1.56% 5.93% 5.93% 6.04% 4.97% 6.33%Barclays Capital US Corp High Yield, 2% Capped Index 3.28% 57.96% 57.96% 6.19% 6.38% 6.81%Standard & Poor's® 500 Index 1.93% 26.45% 26.45% -5.63% 0.41% -0.95%Standard & Poor's® Mid Cap 400 Index TM 6.28% 37.40% 37.40% -1.83% 3.28% 6.37%Russell 1000® Value Index 1.77% 19.69% 19.69% -8.96% -0.25% 2.47%Russell 1000® Growth Index 3.09% 37.21% 37.21% -1.89% 1.63% -3.99%Russell 2000® Index 8.05% 27.19% 27.19% -6.06% 0.51% 3.52%Russell 2500® Index 7.21% 34.39% 34.39% -4.86% 1.58% 4.91%Russell 3000® Index 2.85% 28.33% 28.33% -5.42% 0.76% -0.20%NAREIT Equity REIT Index 7.15% 28.01% 28.01% -12.41% 0.36% 10.63%MSCI® - EAFE Index 1.44% 31.78% 31.78% -6.05% 3.53% 1.17%MSCI® Emerging Markets Index 3.96% 79.00% 79.00% 5.42% 15.88% 10.11%MSCI® - World Index 1.83% 30.80% 30.80% -5.35% 2.20% -0.15%
* Returns less than one year are not annualized.
Additional Footnotes are on next page.
Mutual Directions and fund performance figures shown are net of investment and administrative fees (except for the Guaranteed Account which is notassessed an administrative fee). Your plan's specific returns may be lower. An administrative fee of .00% is reflected in the returns on this page. Also, currentperformance may be lower or higher than the performance data quoted above. Contact your plan administrator or access your online account for your plan'sreturns current to the most recent month-end.
All funds may not be available as an investment option in a plan. Plans may also offer other investments that are not listed above. Figures are reported on atotal return basis, which is the change in value of an investment over a given period, assuming reinvestment of any dividends and capital gains. Investmentsassume a lump sum is invested at the beginning of the time period shown. The results for individual accounts and periods may vary. You cannot investdirectly in an index. Index names may contain trademarks and are the exclusive property of their respective owners.
There is no guarantee the funds will achieve their objectives, and past performance is no guarantee of future returns. Fund value and investment returns willvary, and principal value, when redeemed, may be worth more or less than the original investment. The funds are not insured by the FDIC or by any othergovernmental agency; they are not obligations of the FDIC nor are they deposits or obligations of or guaranteed by the investment managers or theirorganizations. International investing involves special risks, such as political instability and currency fluctuations.
Non-Annualized Average Annual Total Returnas of 12/31/2009as of 12/31/2009Investment Options
AFN28899_070722
1
2
3
4
5
6
7
8
9
10
11
12
13
14
15
16
17
18
19
•
•
••
•
•
•
•
•
•
•
•
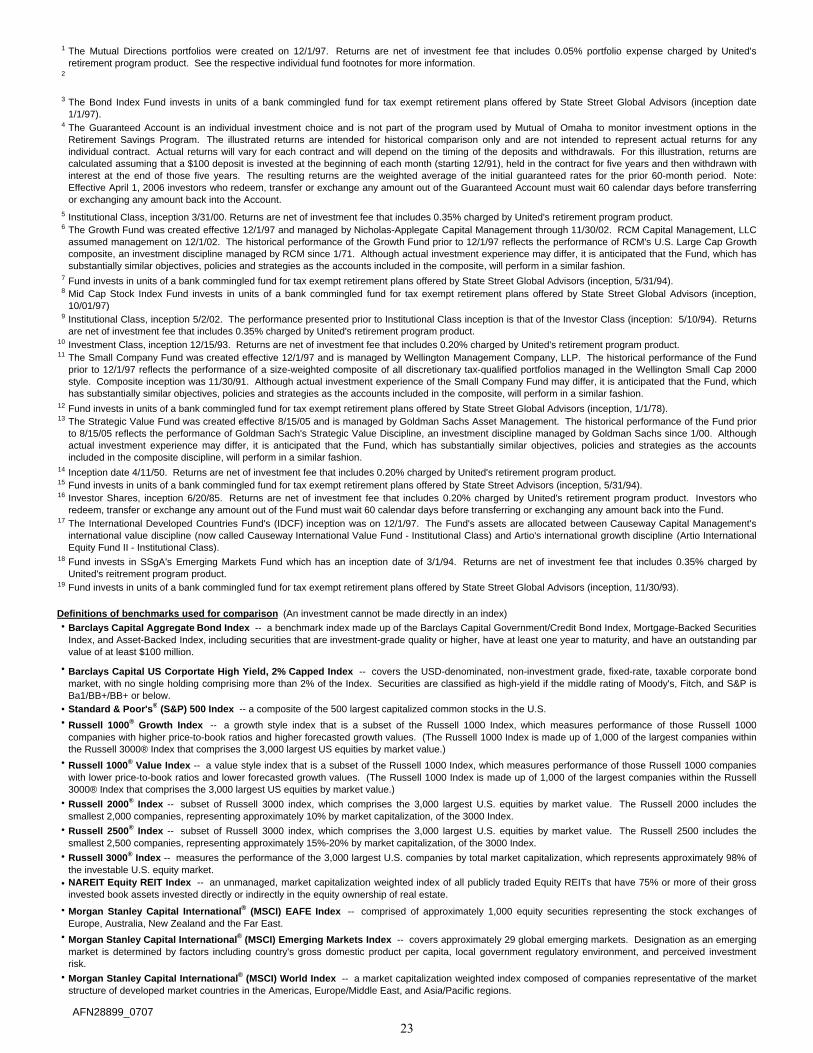
Fund invests in units of a bank commingled fund for tax exempt retirement plans offered by State Street Global Advisors (inception, 1/1/78).
Inception date 4/11/50. Returns are net of investment fee that includes 0.20% charged by United's retirement program product.
Investment Class, inception 12/15/93. Returns are net of investment fee that includes 0.20% charged by United's retirement program product.
Fund invests in units of a bank commingled fund for tax exempt retirement plans offered by State Street Advisors (inception, 5/31/94).
Barclays Capital US Corportate High Yield, 2% Capped Index -- covers the USD-denominated, non-investment grade, fixed-rate, taxable corporate bondmarket, with no single holding comprising more than 2% of the Index. Securities are classified as high-yield if the middle rating of Moody's, Fitch, and S&P isBa1/BB+/BB+ or below.
Definitions of benchmarks used for comparison (An investment cannot be made directly in an index)
Investor Shares, inception 6/20/85. Returns are net of investment fee that includes 0.20% charged by United's retirement program product. Investors whoredeem, transfer or exchange any amount out of the Fund must wait 60 calendar days before transferring or exchanging any amount back into the Fund.
Barclays Capital Aggregate Bond Index -- a benchmark index made up of the Barclays Capital Government/Credit Bond Index, Mortgage-Backed SecuritiesIndex, and Asset-Backed Index, including securities that are investment-grade quality or higher, have at least one year to maturity, and have an outstanding parvalue of at least $100 million.
Morgan Stanley Capital International® (MSCI) World Index -- a market capitalization weighted index composed of companies representative of the marketstructure of developed market countries in the Americas, Europe/Middle East, and Asia/Pacific regions.
Russell 1000® Growth Index -- a growth style index that is a subset of the Russell 1000 Index, which measures performance of those Russell 1000companies with higher price-to-book ratios and higher forecasted growth values. (The Russell 1000 Index is made up of 1,000 of the largest companies withinthe Russell 3000® Index that comprises the 3,000 largest US equities by market value.)Russell 1000® Value Index -- a value style index that is a subset of the Russell 1000 Index, which measures performance of those Russell 1000 companieswith lower price-to-book ratios and lower forecasted growth values. (The Russell 1000 Index is made up of 1,000 of the largest companies within the Russell3000® Index that comprises the 3,000 largest US equities by market value.) Russell 2000® Index -- subset of Russell 3000 index, which comprises the 3,000 largest U.S. equities by market value. The Russell 2000 includes thesmallest 2,000 companies, representing approximately 10% by market capitalization, of the 3000 Index.Russell 2500® Index -- subset of Russell 3000 index, which comprises the 3,000 largest U.S. equities by market value. The Russell 2500 includes thesmallest 2,500 companies, representing approximately 15%-20% by market capitalization, of the 3000 Index.Russell 3000® Index -- measures the performance of the 3,000 largest U.S. companies by total market capitalization, which represents approximately 98% ofthe investable U.S. equity market.
Morgan Stanley Capital International® (MSCI) Emerging Markets Index -- covers approximately 29 global emerging markets. Designation as an emergingmarket is determined by factors including country's gross domestic product per capita, local government regulatory environment, and perceived investmentrisk.
Morgan Stanley Capital International® (MSCI) EAFE Index -- comprised of approximately 1,000 equity securities representing the stock exchanges ofEurope, Australia, New Zealand and the Far East.
NAREIT Equity REIT Index -- an unmanaged, market capitalization weighted index of all publicly traded Equity REITs that have 75% or more of their grossinvested book assets invested directly or indirectly in the equity ownership of real estate.
Fund invests in units of a bank commingled fund for tax exempt retirement plans offered by State Street Global Advisors (inception, 11/30/93).
The International Developed Countries Fund's (IDCF) inception was on 12/1/97. The Fund's assets are allocated between Causeway Capital Management'sinternational value discipline (now called Causeway International Value Fund - Institutional Class) and Artio's international growth discipline (Artio InternationalEquity Fund II - Institutional Class).Fund invests in SSgA's Emerging Markets Fund which has an inception date of 3/1/94. Returns are net of investment fee that includes 0.35% charged byUnited's reitrement program product.
Standard & Poor's® (S&P) 500 Index -- a composite of the 500 largest capitalized common stocks in the U.S.
The Mutual Directions portfolios were created on 12/1/97. Returns are net of investment fee that includes 0.05% portfolio expense charged by United'sretirement program product. See the respective individual fund footnotes for more information.
The Bond Index Fund invests in units of a bank commingled fund for tax exempt retirement plans offered by State Street Global Advisors (inception date1/1/97).The Guaranteed Account is an individual investment choice and is not part of the program used by Mutual of Omaha to monitor investment options in theRetirement Savings Program. The illustrated returns are intended for historical comparison only and are not intended to represent actual returns for anyindividual contract. Actual returns will vary for each contract and will depend on the timing of the deposits and withdrawals. For this illustration, returns arecalculated assuming that a $100 deposit is invested at the beginning of each month (starting 12/91), held in the contract for five years and then withdrawn withinterest at the end of those five years. The resulting returns are the weighted average of the initial guaranteed rates for the prior 60-month period. Note:Effective April 1, 2006 investors who redeem, transfer or exchange any amount out of the Guaranteed Account must wait 60 calendar days before transferringor exchanging any amount back into the Account.
The Small Company Fund was created effective 12/1/97 and is managed by Wellington Management Company, LLP. The historical performance of the Fundprior to 12/1/97 reflects the performance of a size-weighted composite of all discretionary tax-qualified portfolios managed in the Wellington Small Cap 2000style. Composite inception was 11/30/91. Although actual investment experience of the Small Company Fund may differ, it is anticipated that the Fund, whichhas substantially similar objectives, policies and strategies as the accounts included in the composite, will perform in a similar fashion.
The Growth Fund was created effective 12/1/97 and managed by Nicholas-Applegate Capital Management through 11/30/02. RCM Capital Management, LLCassumed management on 12/1/02. The historical performance of the Growth Fund prior to 12/1/97 reflects the performance of RCM's U.S. Large Cap Growthcomposite, an investment discipline managed by RCM since 1/71. Although actual investment experience may differ, it is anticipated that the Fund, which hassubstantially similar objectives, policies and strategies as the accounts included in the composite, will perform in a similar fashion.
Institutional Class, inception 5/2/02. The performance presented prior to Institutional Class inception is that of the Investor Class (inception: 5/10/94). Returnsare net of investment fee that includes 0.35% charged by United's retirement program product.
The Strategic Value Fund was created effective 8/15/05 and is managed by Goldman Sachs Asset Management. The historical performance of the Fund priorto 8/15/05 reflects the performance of Goldman Sach's Strategic Value Discipline, an investment discipline managed by Goldman Sachs since 1/00. Althoughactual investment experience may differ, it is anticipated that the Fund, which has substantially similar objectives, policies and strategies as the accountsincluded in the composite discipline, will perform in a similar fashion.
Fund invests in units of a bank commingled fund for tax exempt retirement plans offered by State Street Global Advisors (inception, 5/31/94).
Institutional Class, inception 3/31/00. Returns are net of investment fee that includes 0.35% charged by United's retirement program product.
Mid Cap Stock Index Fund invests in units of a bank commingled fund for tax exempt retirement plans offered by State Street Global Advisors (inception,10/01/97)
AFN28899_070723

Investment options are offered through a group variable annuity (Form 901-GAQC-07 and Form 901-GAQC-07(OR)) issued by United of Omaha Life Insurance Company, which accepts full responsibility for all of United's contractual obligations under the annuity but does not guarantee any contributions or investment returns except as provided in the annuity for the Guaranteed Account. Neither United of Omaha nor its representatives or affiliates offers investment advice in connection with the product.
AFN28899_070724
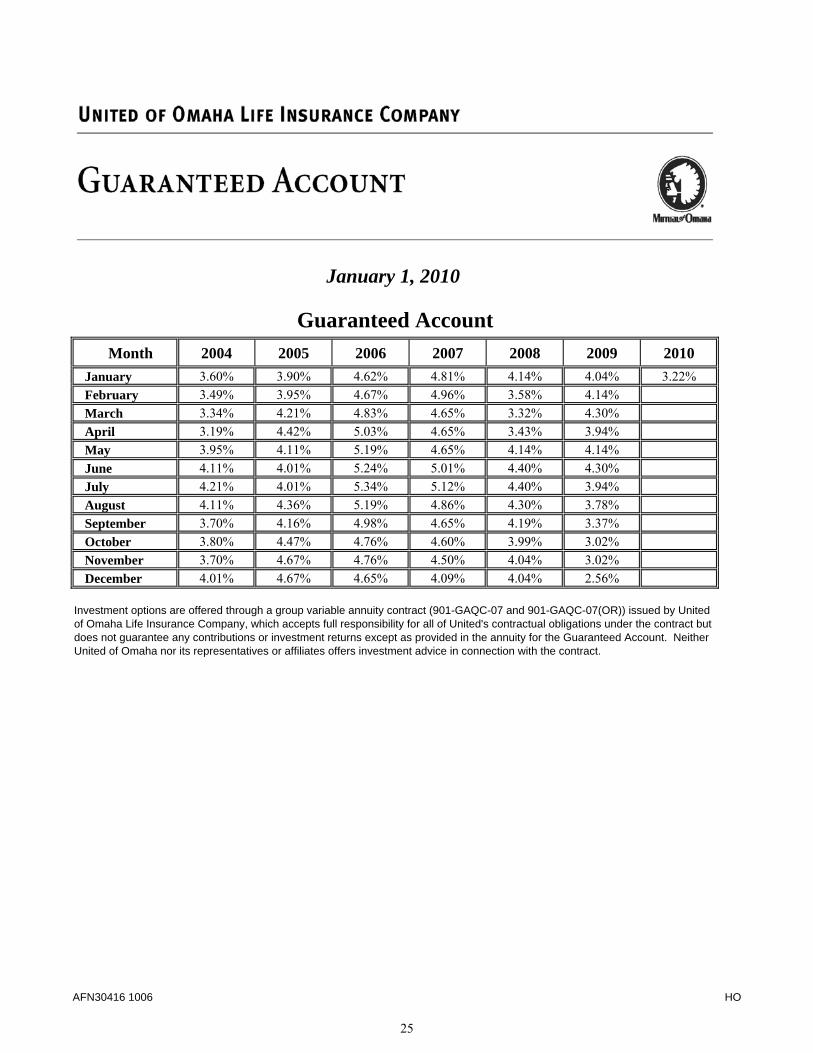
January 1, 2010
Guaranteed AccountMonth 2004 2005 2006 2007 2008 2009 2010
January 3.60% 3.90% 4.62% 4.81% 4.14% 4.04% 3.22%February 3.49% 3.95% 4.67% 4.96% 3.58% 4.14%March 3.34% 4.21% 4.83% 4.65% 3.32% 4.30%April 3.19% 4.42% 5.03% 4.65% 3.43% 3.94%May 3.95% 4.11% 5.19% 4.65% 4.14% 4.14%June 4.11% 4.01% 5.24% 5.01% 4.40% 4.30%July 4.21% 4.01% 5.34% 5.12% 4.40% 3.94%August 4.11% 4.36% 5.19% 4.86% 4.30% 3.78%September 3.70% 4.16% 4.98% 4.65% 4.19% 3.37%October 3.80% 4.47% 4.76% 4.60% 3.99% 3.02%November 3.70% 4.67% 4.76% 4.50% 4.04% 3.02%December 4.01% 4.67% 4.65% 4.09% 4.04% 2.56%
Investment options are offered through a group variable annuity contract (901-GAQC-07 and 901-GAQC-07(OR)) issued by United of Omaha Life Insurance Company, which accepts full responsibility for all of United's contractual obligations under the contract but does not guarantee any contributions or investment returns except as provided in the annuity for the Guaranteed Account. Neither United of Omaha nor its representatives or affiliates offers investment advice in connection with the contract.
AFN30416 1006 HO
25

26
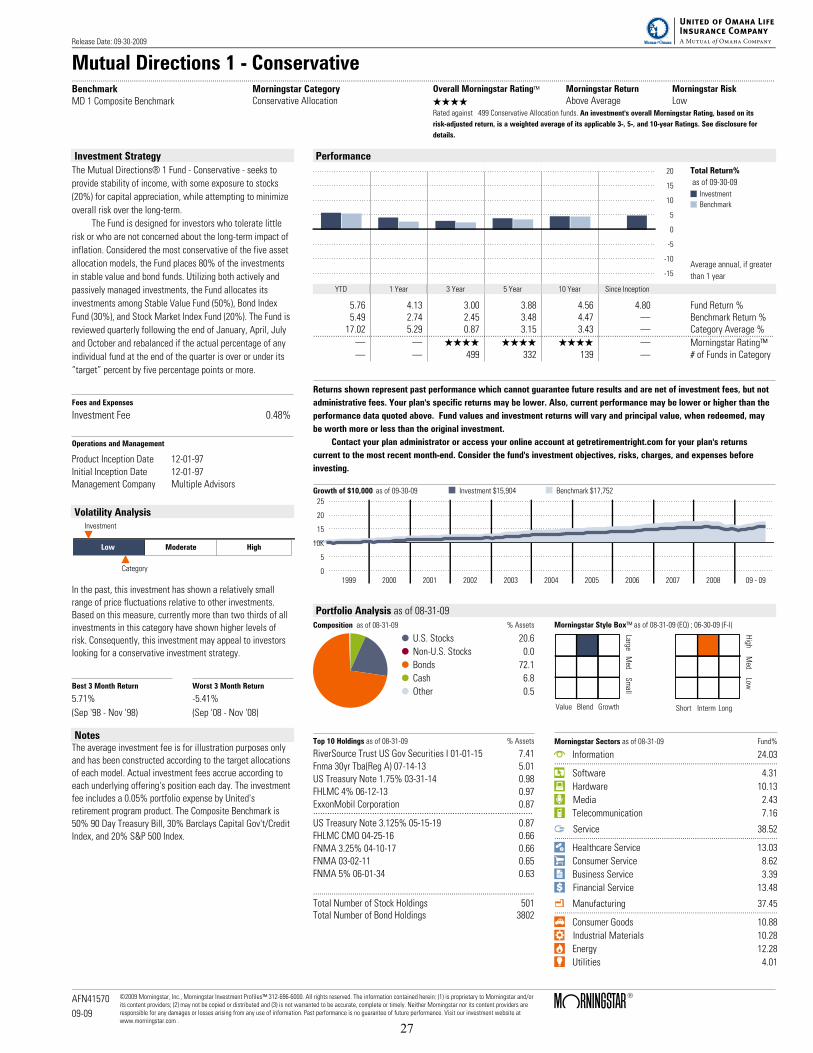
Mutual Directions 1 - Conservative....................................................................................................................................................................................................................................................................................................................................................Benchmark
MD 1 Composite Benchmark
Morningstar CategoryConservative Allocation
Overall Morningstar Rating™ Morningstar Return Morningstar Risk
QQQQ Above Average LowRated against 499 Conservative Allocation funds. An investment's overall Morningstar Rating, based on its
risk-adjusted return, is a weighted average of its applicable 3-, 5-, and 10-year Ratings. See disclosure for
details.
Investment Strategy
The Mutual Directions® 1 Fund - Conservative - seeks to
provide stability of income, with some exposure to stocks
(20%) for capital appreciation, while attempting to minimize
overall risk over the long-term.
The Fund is designed for investors who tolerate little
risk or who are not concerned about the long-term impact of
inflation. Considered the most conservative of the five asset
allocation models, the Fund places 80% of the investments
in stable value and bond funds. Utilizing both actively and
passively managed investments, the Fund allocates its
investments among Stable Value Fund (50%), Bond Index
Fund (30%), and Stock Market Index Fund (20%). The Fund is
reviewed quarterly following the end of January, April, July
and October and rebalanced if the actual percentage of any
individual fund at the end of the quarter is over or under its
“target” percent by five percentage points or more.
Fees and Expenses
Investment Fee 0.48%
Operations and Management
Product Inception Date 12-01-97
Initial Inception Date 12-01-97
Management Company Multiple Advisors
Volatility Analysis
Low Moderate High
Investment
Category
In the past, this investment has shown a relatively small
range of price fluctuations relative to other investments.
Based on this measure, currently more than two thirds of all
investments in this category have shown higher levels of
risk. Consequently, this investment may appeal to investors
looking for a conservative investment strategy.
Best 3 Month Return Worst 3 Month Return
5.71% -5.41%
(Sep '98 - Nov '98) (Sep '08 - Nov '08)
NotesThe average investment fee is for illustration purposes only
and has been constructed according to the target allocations
of each model. Actual investment fees accrue according to
each underlying offering's position each day. The investment
fee includes a 0.05% portfolio expense by United's
retirement program product. The Composite Benchmark is
50% 90 Day Treasury Bill, 30% Barclays Capital Gov't/Credit
Index, and 20% S&P 500 Index.
Performance
5
10
15
20
0
-5
-10
-15
Total Return%
as of 09-30-09
Investment
Benchmark
Average annual, if greater
than 1 year
YTD 1 Year 3 Year 5 Year 10 Year Since Inception
5.76 4.13 3.00 3.88 4.56 4.80 Fund Return %5.49 2.74 2.45 3.48 4.47 . Benchmark Return %
17.02 5.29 0.87 3.15 3.43 . Category Average %................................................................................................................................................................................................................. . QQQQ QQQQ QQQQ . Morningstar Rating™. . 499 332 139 . # of Funds in Category
Returns shown represent past performance which cannot guarantee future results and are net of investment fees, but not
administrative fees. Your plan's specific returns may be lower. Also, current performance may be lower or higher than the
performance data quoted above. Fund values and investment returns will vary and principal value, when redeemed, may
be worth more or less than the original investment.
Contact your plan administrator or access your online account at getretirementright.com for your plan's returns
current to the most recent month-end. Consider the fund's investment objectives, risks, charges, and expenses before
investing.
Growth of $10,000 as of 09-30-09 Investment $15,904 Benchmark $17,752
1999 2000 2001 2002 2003 2004 2005 2006 2007 2008 09 - 09
25
20
15
5
0
10K
Portfolio Analysis as of 08-31-09
Composition as of 08-31-09 % Assets
U.S. Stocks 20.6
Non-U.S. Stocks 0.0
Bonds 72.1
Cash 6.8
Other 0.5
Morningstar Style Box™ as of 08-31-09 (EQ) ; 06-30-09 (F-I)
LargeM
edS
mall
Value Blend Growth
High
Med
Low
Short Interm Long
Top 10 Holdings as of 08-31-09 % Assets
RiverSource Trust US Gov Securities I 01-01-15 7.41
Fnma 30yr Tba(Reg A) 07-14-13 5.01
US Treasury Note 1.75% 03-31-14 0.98
FHLMC 4% 06-12-13 0.97
ExxonMobil Corporation 0.87.............................................................................................US Treasury Note 3.125% 05-15-19 0.87
FHLMC CMO 04-25-16 0.66
FNMA 3.25% 04-10-17 0.66
FNMA 03-02-11 0.65
FNMA 5% 06-01-34 0.63
...........................................................................................................
Total Number of Stock Holdings 501Total Number of Bond Holdings 3802
Morningstar Sectors as of 08-31-09 Fund%
h Information 24.03............................................................................................................
r Software 4.31
t Hardware 10.13
y Media 2.43
u Telecommunication 7.16
j Service 38.52............................................................................................................
i Healthcare Service 13.03
o Consumer Service 8.62
p Business Service 3.39
a Financial Service 13.48
k Manufacturing 37.45............................................................................................................
s Consumer Goods 10.88
d Industrial Materials 10.28
f Energy 12.28
g Utilities 4.01
Release Date: 09-30-2009
AFN41570
09-09
©2009 Morningstar, Inc., Morningstar Investment Profiles™ 312-696-6000. All rights reserved. The information contained herein: (1) is proprietary to Morningstar and/orits content providers; (2) may not be copied or distributed and (3) is not warranted to be accurate, complete or timely. Neither Morningstar nor its content providers areresponsible for any damages or losses arising from any use of information. Past performance is no guarantee of future performance. Visit our investment website atwww.morningstar.com .
Page 1 of 2
27
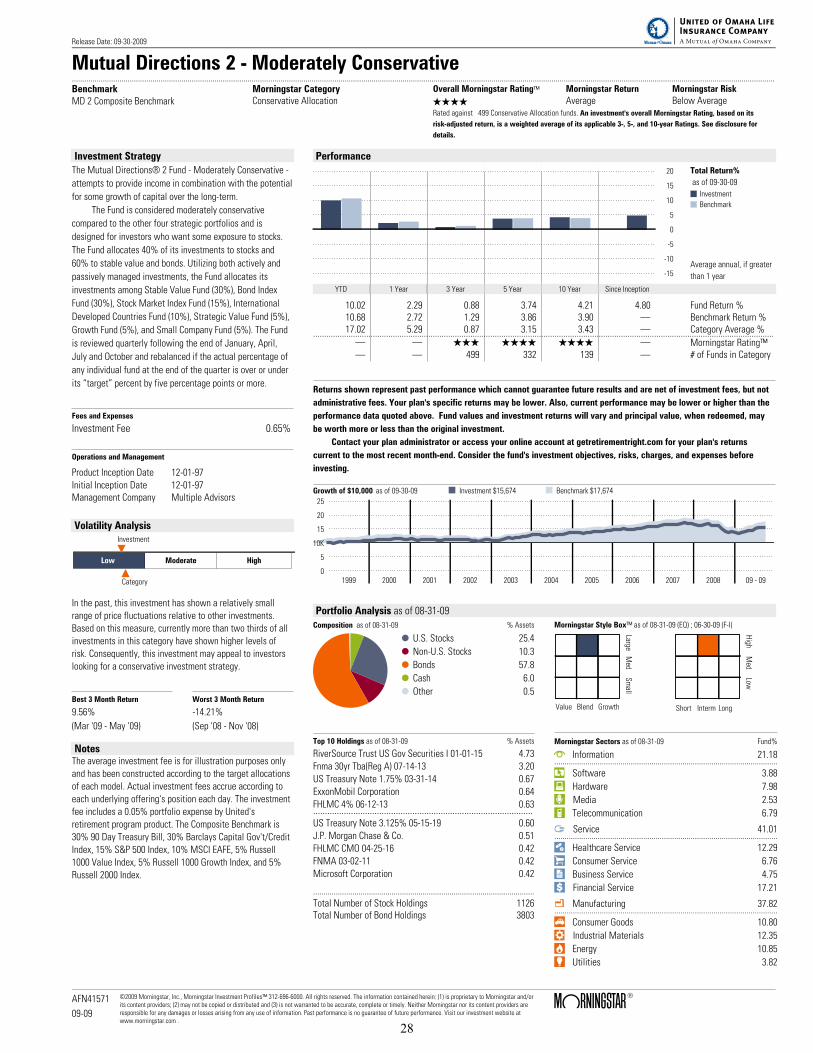
Mutual Directions 2 - Moderately Conservative....................................................................................................................................................................................................................................................................................................................................................Benchmark
MD 2 Composite Benchmark
Morningstar CategoryConservative Allocation
Overall Morningstar Rating™ Morningstar Return Morningstar Risk
QQQQ Average Below AverageRated against 499 Conservative Allocation funds. An investment's overall Morningstar Rating, based on its
risk-adjusted return, is a weighted average of its applicable 3-, 5-, and 10-year Ratings. See disclosure for
details.
Investment Strategy
The Mutual Directions® 2 Fund - Moderately Conservative -
attempts to provide income in combination with the potential
for some growth of capital over the long-term.
The Fund is considered moderately conservative
compared to the other four strategic portfolios and is
designed for investors who want some exposure to stocks.
The Fund allocates 40% of its investments to stocks and
60% to stable value and bonds. Utilizing both actively and
passively managed investments, the Fund allocates its
investments among Stable Value Fund (30%), Bond Index
Fund (30%), Stock Market Index Fund (15%), International
Developed Countries Fund (10%), Strategic Value Fund (5%),
Growth Fund (5%), and Small Company Fund (5%). The Fund
is reviewed quarterly following the end of January, April,
July and October and rebalanced if the actual percentage of
any individual fund at the end of the quarter is over or under
its “target” percent by five percentage points or more.
Fees and Expenses
Investment Fee 0.65%
Operations and Management
Product Inception Date 12-01-97
Initial Inception Date 12-01-97
Management Company Multiple Advisors
Volatility Analysis
Low Moderate High
Investment
Category
In the past, this investment has shown a relatively small
range of price fluctuations relative to other investments.
Based on this measure, currently more than two thirds of all
investments in this category have shown higher levels of
risk. Consequently, this investment may appeal to investors
looking for a conservative investment strategy.
Best 3 Month Return Worst 3 Month Return
9.56% -14.21%
(Mar '09 - May '09) (Sep '08 - Nov '08)
NotesThe average investment fee is for illustration purposes only
and has been constructed according to the target allocations
of each model. Actual investment fees accrue according to
each underlying offering's position each day. The investment
fee includes a 0.05% portfolio expense by United's
retirement program product. The Composite Benchmark is
30% 90 Day Treasury Bill, 30% Barclays Capital Gov't/Credit
Index, 15% S&P 500 Index, 10% MSCI EAFE, 5% Russell
1000 Value Index, 5% Russell 1000 Growth Index, and 5%
Russell 2000 Index.
Performance
5
10
15
20
0
-5
-10
-15
Total Return%
as of 09-30-09
Investment
Benchmark
Average annual, if greater
than 1 year
YTD 1 Year 3 Year 5 Year 10 Year Since Inception
10.02 2.29 0.88 3.74 4.21 4.80 Fund Return %10.68 2.72 1.29 3.86 3.90 . Benchmark Return %17.02 5.29 0.87 3.15 3.43 . Category Average %................................................................................................................................................................................................................. . QQQ QQQQ QQQQ . Morningstar Rating™. . 499 332 139 . # of Funds in Category
Returns shown represent past performance which cannot guarantee future results and are net of investment fees, but not
administrative fees. Your plan's specific returns may be lower. Also, current performance may be lower or higher than the
performance data quoted above. Fund values and investment returns will vary and principal value, when redeemed, may
be worth more or less than the original investment.
Contact your plan administrator or access your online account at getretirementright.com for your plan's returns
current to the most recent month-end. Consider the fund's investment objectives, risks, charges, and expenses before
investing.
Growth of $10,000 as of 09-30-09 Investment $15,674 Benchmark $17,674
1999 2000 2001 2002 2003 2004 2005 2006 2007 2008 09 - 09
25
20
15
5
0
10K
Portfolio Analysis as of 08-31-09
Composition as of 08-31-09 % Assets
U.S. Stocks 25.4
Non-U.S. Stocks 10.3
Bonds 57.8
Cash 6.0
Other 0.5
Morningstar Style Box™ as of 08-31-09 (EQ) ; 06-30-09 (F-I)
LargeM
edS
mall
Value Blend Growth
High
Med
Low
Short Interm Long
Top 10 Holdings as of 08-31-09 % Assets
RiverSource Trust US Gov Securities I 01-01-15 4.73
Fnma 30yr Tba(Reg A) 07-14-13 3.20
US Treasury Note 1.75% 03-31-14 0.67
ExxonMobil Corporation 0.64
FHLMC 4% 06-12-13 0.63.............................................................................................US Treasury Note 3.125% 05-15-19 0.60
J.P. Morgan Chase & Co. 0.51
FHLMC CMO 04-25-16 0.42
FNMA 03-02-11 0.42
Microsoft Corporation 0.42
...........................................................................................................
Total Number of Stock Holdings 1126Total Number of Bond Holdings 3803
Morningstar Sectors as of 08-31-09 Fund%
h Information 21.18............................................................................................................
r Software 3.88
t Hardware 7.98
y Media 2.53
u Telecommunication 6.79
j Service 41.01............................................................................................................
i Healthcare Service 12.29
o Consumer Service 6.76
p Business Service 4.75
a Financial Service 17.21
k Manufacturing 37.82............................................................................................................
s Consumer Goods 10.80
d Industrial Materials 12.35
f Energy 10.85
g Utilities 3.82
Release Date: 09-30-2009
AFN41571
09-09
©2009 Morningstar, Inc., Morningstar Investment Profiles™ 312-696-6000. All rights reserved. The information contained herein: (1) is proprietary to Morningstar and/orits content providers; (2) may not be copied or distributed and (3) is not warranted to be accurate, complete or timely. Neither Morningstar nor its content providers areresponsible for any damages or losses arising from any use of information. Past performance is no guarantee of future performance. Visit our investment website atwww.morningstar.com .
Page 1 of 2
28
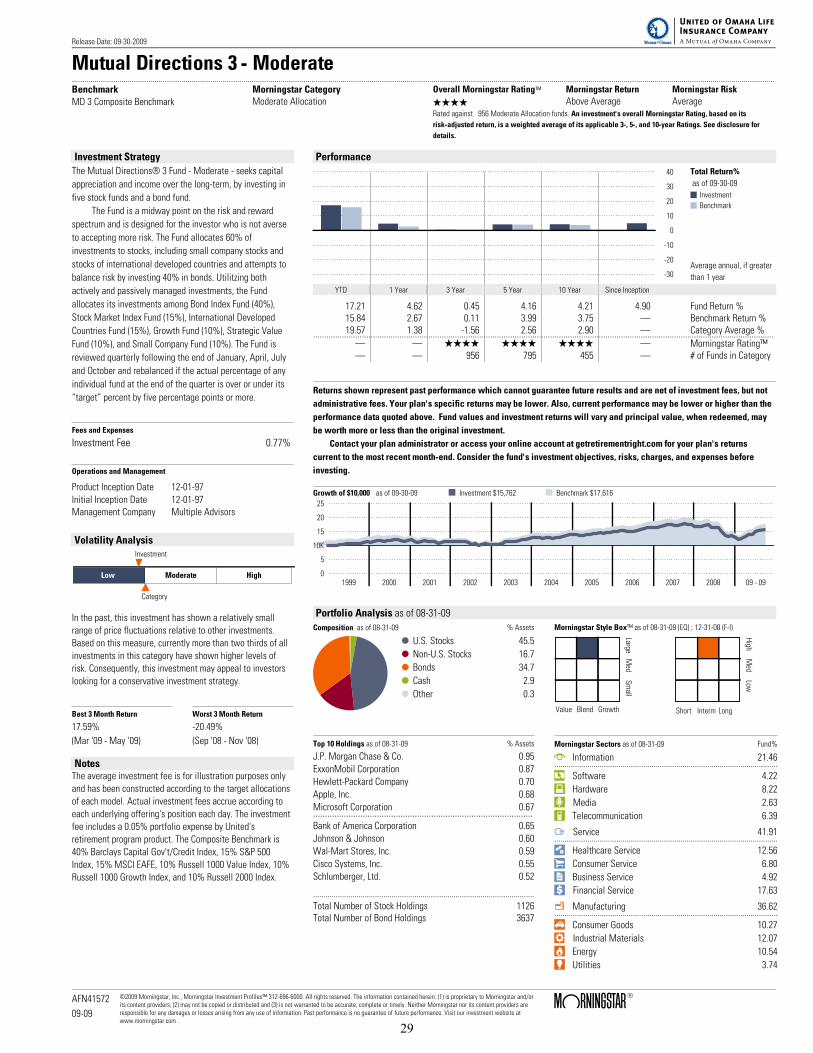
Mutual Directions 3 - Moderate....................................................................................................................................................................................................................................................................................................................................................Benchmark
MD 3 Composite Benchmark
Morningstar CategoryModerate Allocation
Overall Morningstar Rating™ Morningstar Return Morningstar Risk
QQQQ Above Average AverageRated against 956 Moderate Allocation funds. An investment's overall Morningstar Rating, based on its
risk-adjusted return, is a weighted average of its applicable 3-, 5-, and 10-year Ratings. See disclosure for
details.
Investment Strategy
The Mutual Directions® 3 Fund - Moderate - seeks capital
appreciation and income over the long-term, by investing in
five stock funds and a bond fund.
The Fund is a midway point on the risk and reward
spectrum and is designed for the investor who is not averse
to accepting more risk. The Fund allocates 60% of
investments to stocks, including small company stocks and
stocks of international developed countries and attempts to
balance risk by investing 40% in bonds. Utilitzing both
actively and passively managed investments, the Fund
allocates its investments among Bond Index Fund (40%),
Stock Market Index Fund (15%), International Developed
Countries Fund (15%), Growth Fund (10%), Strategic Value
Fund (10%), and Small Company Fund (10%). The Fund is
reviewed quarterly following the end of January, April, July
and October and rebalanced if the actual percentage of any
individual fund at the end of the quarter is over or under its
“target” percent by five percentage points or more.
Fees and Expenses
Investment Fee 0.77%
Operations and Management
Product Inception Date 12-01-97
Initial Inception Date 12-01-97
Management Company Multiple Advisors
Volatility Analysis
Low Moderate High
Investment
Category
In the past, this investment has shown a relatively small
range of price fluctuations relative to other investments.
Based on this measure, currently more than two thirds of all
investments in this category have shown higher levels of
risk. Consequently, this investment may appeal to investors
looking for a conservative investment strategy.
Best 3 Month Return Worst 3 Month Return
17.59% -20.49%
(Mar '09 - May '09) (Sep '08 - Nov '08)
NotesThe average investment fee is for illustration purposes only
and has been constructed according to the target allocations
of each model. Actual investment fees accrue according to
each underlying offering's position each day. The investment
fee includes a 0.05% portfolio expense by United's
retirement program product. The Composite Benchmark is
40% Barclays Capital Gov't/Credit Index, 15% S&P 500
Index, 15% MSCI EAFE, 10% Russell 1000 Value Index, 10%
Russell 1000 Growth Index, and 10% Russell 2000 Index.
Performance
10
20
30
40
0
-10
-20
-30
Total Return%
as of 09-30-09
Investment
Benchmark
Average annual, if greater
than 1 year
YTD 1 Year 3 Year 5 Year 10 Year Since Inception
17.21 4.62 0.45 4.16 4.21 4.90 Fund Return %15.84 2.67 0.11 3.99 3.75 . Benchmark Return %19.57 1.38 -1.56 2.56 2.90 . Category Average %................................................................................................................................................................................................................. . QQQQ QQQQ QQQQ . Morningstar Rating™. . 956 795 455 . # of Funds in Category
Returns shown represent past performance which cannot guarantee future results and are net of investment fees, but not
administrative fees. Your plan's specific returns may be lower. Also, current performance may be lower or higher than the
performance data quoted above. Fund values and investment returns will vary and principal value, when redeemed, may
be worth more or less than the original investment.
Contact your plan administrator or access your online account at getretirementright.com for your plan's returns
current to the most recent month-end. Consider the fund's investment objectives, risks, charges, and expenses before
investing.
Growth of $10,000 as of 09-30-09 Investment $15,762 Benchmark $17,616
1999 2000 2001 2002 2003 2004 2005 2006 2007 2008 09 - 09
25
20
15
5
0
10K
Portfolio Analysis as of 08-31-09
Composition as of 08-31-09 % Assets
U.S. Stocks 45.5
Non-U.S. Stocks 16.7
Bonds 34.7
Cash 2.9
Other 0.3
Morningstar Style Box™ as of 08-31-09 (EQ) ; 12-31-08 (F-I)
LargeM
edS
mall
Value Blend Growth
High
Med
Low
Short Interm Long
Top 10 Holdings as of 08-31-09 % Assets
J.P. Morgan Chase & Co. 0.95
ExxonMobil Corporation 0.87
Hewlett-Packard Company 0.70
Apple, Inc. 0.68
Microsoft Corporation 0.67.............................................................................................Bank of America Corporation 0.65
Johnson & Johnson 0.60
Wal-Mart Stores, Inc. 0.59
Cisco Systems, Inc. 0.55
Schlumberger, Ltd. 0.52
...........................................................................................................
Total Number of Stock Holdings 1126Total Number of Bond Holdings 3637
Morningstar Sectors as of 08-31-09 Fund%
h Information 21.46............................................................................................................
r Software 4.22
t Hardware 8.22
y Media 2.63
u Telecommunication 6.39
j Service 41.91............................................................................................................
i Healthcare Service 12.56
o Consumer Service 6.80
p Business Service 4.92
a Financial Service 17.63
k Manufacturing 36.62............................................................................................................
s Consumer Goods 10.27
d Industrial Materials 12.07
f Energy 10.54
g Utilities 3.74
Release Date: 09-30-2009
AFN41572
09-09
©2009 Morningstar, Inc., Morningstar Investment Profiles™ 312-696-6000. All rights reserved. The information contained herein: (1) is proprietary to Morningstar and/orits content providers; (2) may not be copied or distributed and (3) is not warranted to be accurate, complete or timely. Neither Morningstar nor its content providers areresponsible for any damages or losses arising from any use of information. Past performance is no guarantee of future performance. Visit our investment website atwww.morningstar.com .
Page 1 of 2
29
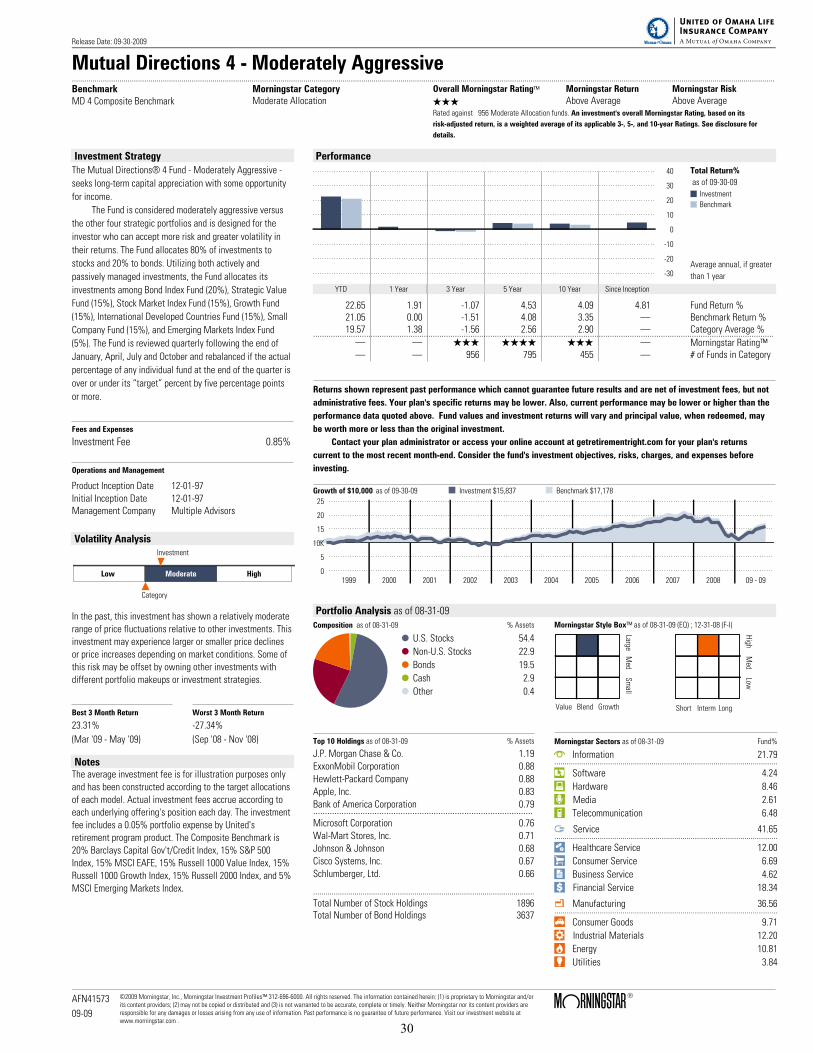
Mutual Directions 4 - Moderately Aggressive....................................................................................................................................................................................................................................................................................................................................................Benchmark
MD 4 Composite Benchmark
Morningstar CategoryModerate Allocation
Overall Morningstar Rating™ Morningstar Return Morningstar Risk
QQQ Above Average Above AverageRated against 956 Moderate Allocation funds. An investment's overall Morningstar Rating, based on its
risk-adjusted return, is a weighted average of its applicable 3-, 5-, and 10-year Ratings. See disclosure for
details.
Investment Strategy
The Mutual Directions® 4 Fund - Moderately Aggressive -
seeks long-term capital appreciation with some opportunity
for income.
The Fund is considered moderately aggressive versus
the other four strategic portfolios and is designed for the
investor who can accept more risk and greater volatility in
their returns. The Fund allocates 80% of investments to
stocks and 20% to bonds. Utilizing both actively and
passively managed investments, the Fund allocates its
investments among Bond Index Fund (20%), Strategic Value
Fund (15%), Stock Market Index Fund (15%), Growth Fund
(15%), International Developed Countries Fund (15%), Small
Company Fund (15%), and Emerging Markets Index Fund
(5%). The Fund is reviewed quarterly following the end of
January, April, July and October and rebalanced if the actual
percentage of any individual fund at the end of the quarter is
over or under its “target” percent by five percentage points
or more.
Fees and Expenses
Investment Fee 0.85%
Operations and Management
Product Inception Date 12-01-97
Initial Inception Date 12-01-97
Management Company Multiple Advisors
Volatility Analysis
Low Moderate High
Investment
Category
In the past, this investment has shown a relatively moderate
range of price fluctuations relative to other investments. This
investment may experience larger or smaller price declines
or price increases depending on market conditions. Some of
this risk may be offset by owning other investments with
different portfolio makeups or investment strategies.
Best 3 Month Return Worst 3 Month Return
23.31% -27.34%
(Mar '09 - May '09) (Sep '08 - Nov '08)
NotesThe average investment fee is for illustration purposes only
and has been constructed according to the target allocations
of each model. Actual investment fees accrue according to
each underlying offering's position each day. The investment
fee includes a 0.05% portfolio expense by United's
retirement program product. The Composite Benchmark is
20% Barclays Capital Gov't/Credit Index, 15% S&P 500
Index, 15% MSCI EAFE, 15% Russell 1000 Value Index, 15%
Russell 1000 Growth Index, 15% Russell 2000 Index, and 5%
MSCI Emerging Markets Index.
Performance
10
20
30
40
0
-10
-20
-30
Total Return%
as of 09-30-09
Investment
Benchmark
Average annual, if greater
than 1 year
YTD 1 Year 3 Year 5 Year 10 Year Since Inception
22.65 1.91 -1.07 4.53 4.09 4.81 Fund Return %21.05 0.00 -1.51 4.08 3.35 . Benchmark Return %19.57 1.38 -1.56 2.56 2.90 . Category Average %................................................................................................................................................................................................................. . QQQ QQQQ QQQ . Morningstar Rating™. . 956 795 455 . # of Funds in Category
Returns shown represent past performance which cannot guarantee future results and are net of investment fees, but not
administrative fees. Your plan's specific returns may be lower. Also, current performance may be lower or higher than the
performance data quoted above. Fund values and investment returns will vary and principal value, when redeemed, may
be worth more or less than the original investment.
Contact your plan administrator or access your online account at getretirementright.com for your plan's returns
current to the most recent month-end. Consider the fund's investment objectives, risks, charges, and expenses before
investing.
Growth of $10,000 as of 09-30-09 Investment $15,837 Benchmark $17,178
1999 2000 2001 2002 2003 2004 2005 2006 2007 2008 09 - 09
25
20
15
5
0
10K
Portfolio Analysis as of 08-31-09
Composition as of 08-31-09 % Assets
U.S. Stocks 54.4
Non-U.S. Stocks 22.9
Bonds 19.5
Cash 2.9
Other 0.4
Morningstar Style Box™ as of 08-31-09 (EQ) ; 12-31-08 (F-I)
LargeM
edS
mall
Value Blend Growth
High
Med
Low
Short Interm Long
Top 10 Holdings as of 08-31-09 % Assets
J.P. Morgan Chase & Co. 1.19
ExxonMobil Corporation 0.88
Hewlett-Packard Company 0.88
Apple, Inc. 0.83
Bank of America Corporation 0.79.............................................................................................Microsoft Corporation 0.76
Wal-Mart Stores, Inc. 0.71
Johnson & Johnson 0.68
Cisco Systems, Inc. 0.67
Schlumberger, Ltd. 0.66
...........................................................................................................
Total Number of Stock Holdings 1896Total Number of Bond Holdings 3637
Morningstar Sectors as of 08-31-09 Fund%
h Information 21.79............................................................................................................
r Software 4.24
t Hardware 8.46
y Media 2.61
u Telecommunication 6.48
j Service 41.65............................................................................................................
i Healthcare Service 12.00
o Consumer Service 6.69
p Business Service 4.62
a Financial Service 18.34
k Manufacturing 36.56............................................................................................................
s Consumer Goods 9.71
d Industrial Materials 12.20
f Energy 10.81
g Utilities 3.84
Release Date: 09-30-2009
AFN41573
09-09
©2009 Morningstar, Inc., Morningstar Investment Profiles™ 312-696-6000. All rights reserved. The information contained herein: (1) is proprietary to Morningstar and/orits content providers; (2) may not be copied or distributed and (3) is not warranted to be accurate, complete or timely. Neither Morningstar nor its content providers areresponsible for any damages or losses arising from any use of information. Past performance is no guarantee of future performance. Visit our investment website atwww.morningstar.com .
Page 1 of 2
30
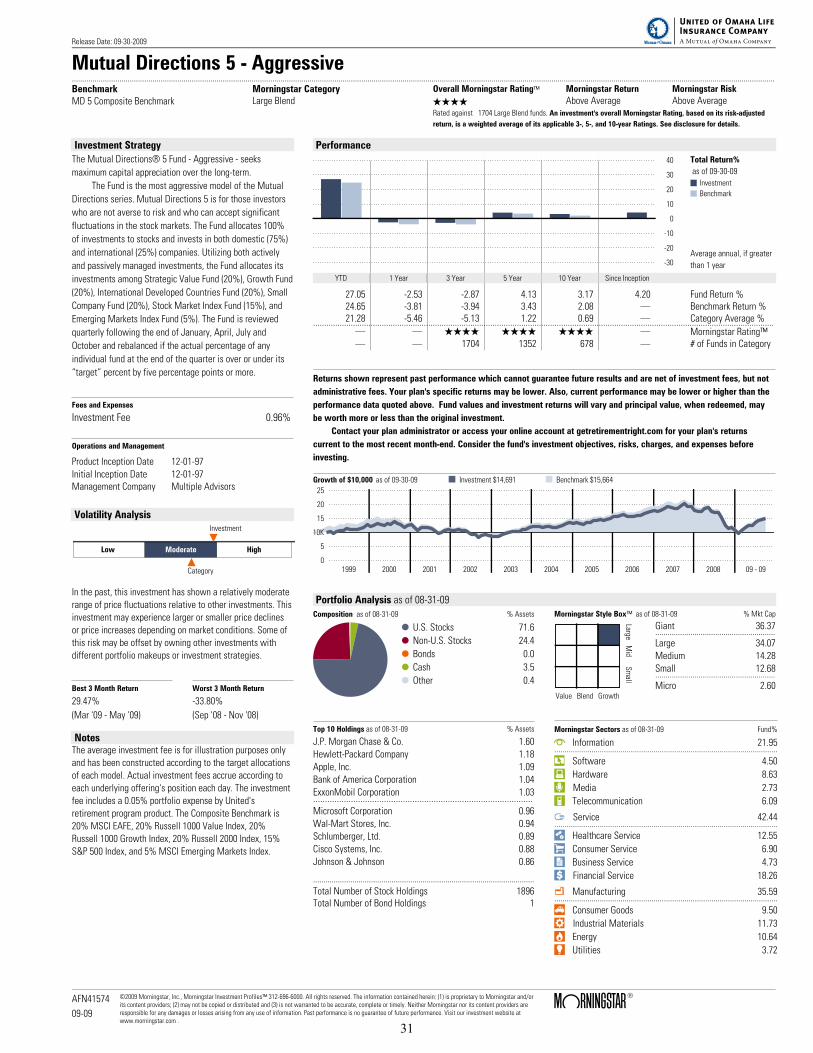
Mutual Directions 5 - Aggressive....................................................................................................................................................................................................................................................................................................................................................Benchmark
MD 5 Composite Benchmark
Morningstar CategoryLarge Blend
Overall Morningstar Rating™ Morningstar Return Morningstar Risk
QQQQ Above Average Above AverageRated against 1704 Large Blend funds. An investment's overall Morningstar Rating, based on its risk-adjusted
return, is a weighted average of its applicable 3-, 5-, and 10-year Ratings. See disclosure for details.
Investment Strategy
The Mutual Directions® 5 Fund - Aggressive - seeks
maximum capital appreciation over the long-term.
The Fund is the most aggressive model of the Mutual
Directions series. Mutual Directions 5 is for those investors
who are not averse to risk and who can accept significant
fluctuations in the stock markets. The Fund allocates 100%
of investments to stocks and invests in both domestic (75%)
and international (25%) companies. Utilizing both actively
and passively managed investments, the Fund allocates its
investments among Strategic Value Fund (20%), Growth Fund
(20%), International Developed Countries Fund (20%), Small
Company Fund (20%), Stock Market Index Fund (15%), and
Emerging Markets Index Fund (5%). The Fund is reviewed
quarterly following the end of January, April, July and
October and rebalanced if the actual percentage of any
individual fund at the end of the quarter is over or under its
“target” percent by five percentage points or more.
Fees and Expenses
Investment Fee 0.96%
Operations and Management
Product Inception Date 12-01-97
Initial Inception Date 12-01-97
Management Company Multiple Advisors
Volatility Analysis
Low Moderate High
Investment
Category
In the past, this investment has shown a relatively moderate
range of price fluctuations relative to other investments. This
investment may experience larger or smaller price declines
or price increases depending on market conditions. Some of
this risk may be offset by owning other investments with
different portfolio makeups or investment strategies.
Best 3 Month Return Worst 3 Month Return
29.47% -33.80%
(Mar '09 - May '09) (Sep '08 - Nov '08)
NotesThe average investment fee is for illustration purposes only
and has been constructed according to the target allocations
of each model. Actual investment fees accrue according to
each underlying offering's position each day. The investment
fee includes a 0.05% portfolio expense by United's
retirement program product. The Composite Benchmark is
20% MSCI EAFE, 20% Russell 1000 Value Index, 20%
Russell 1000 Growth Index, 20% Russell 2000 Index, 15%
S&P 500 Index, and 5% MSCI Emerging Markets Index.
Performance
10
20
30
40
0
-10
-20
-30
Total Return%
as of 09-30-09
Investment
Benchmark
Average annual, if greater
than 1 year
YTD 1 Year 3 Year 5 Year 10 Year Since Inception
27.05 -2.53 -2.87 4.13 3.17 4.20 Fund Return %24.65 -3.81 -3.94 3.43 2.08 . Benchmark Return %21.28 -5.46 -5.13 1.22 0.69 . Category Average %................................................................................................................................................................................................................. . QQQQ QQQQ QQQQ . Morningstar Rating™. . 1704 1352 678 . # of Funds in Category
Returns shown represent past performance which cannot guarantee future results and are net of investment fees, but not
administrative fees. Your plan's specific returns may be lower. Also, current performance may be lower or higher than the
performance data quoted above. Fund values and investment returns will vary and principal value, when redeemed, may
be worth more or less than the original investment.
Contact your plan administrator or access your online account at getretirementright.com for your plan's returns
current to the most recent month-end. Consider the fund's investment objectives, risks, charges, and expenses before
investing.
Growth of $10,000 as of 09-30-09 Investment $14,691 Benchmark $15,664
1999 2000 2001 2002 2003 2004 2005 2006 2007 2008 09 - 09
25
20
15
5
0
10K
Portfolio Analysis as of 08-31-09
Composition as of 08-31-09 % Assets
U.S. Stocks 71.6
Non-U.S. Stocks 24.4
Bonds 0.0
Cash 3.5
Other 0.4
Morningstar Style Box™ as of 08-31-09 % Mkt Cap
LargeM
idS
mall
Value Blend Growth
Giant 36.37..........................................................
Large 34.07
Medium 14.28
Small 12.68..........................................................
Micro 2.60
Top 10 Holdings as of 08-31-09 % Assets
J.P. Morgan Chase & Co. 1.60
Hewlett-Packard Company 1.18
Apple, Inc. 1.09
Bank of America Corporation 1.04
ExxonMobil Corporation 1.03.............................................................................................Microsoft Corporation 0.96
Wal-Mart Stores, Inc. 0.94
Schlumberger, Ltd. 0.89
Cisco Systems, Inc. 0.88
Johnson & Johnson 0.86
...........................................................................................................
Total Number of Stock Holdings 1896Total Number of Bond Holdings 1
Morningstar Sectors as of 08-31-09 Fund%
h Information 21.95............................................................................................................
r Software 4.50
t Hardware 8.63
y Media 2.73
u Telecommunication 6.09
j Service 42.44............................................................................................................
i Healthcare Service 12.55
o Consumer Service 6.90
p Business Service 4.73
a Financial Service 18.26
k Manufacturing 35.59............................................................................................................
s Consumer Goods 9.50
d Industrial Materials 11.73
f Energy 10.64
g Utilities 3.72
Release Date: 09-30-2009
AFN41574
09-09
©2009 Morningstar, Inc., Morningstar Investment Profiles™ 312-696-6000. All rights reserved. The information contained herein: (1) is proprietary to Morningstar and/orits content providers; (2) may not be copied or distributed and (3) is not warranted to be accurate, complete or timely. Neither Morningstar nor its content providers areresponsible for any damages or losses arising from any use of information. Past performance is no guarantee of future performance. Visit our investment website atwww.morningstar.com .
Page 1 of 2
31

Mutual GlidePath 2005....................................................................................................................................................................................................................................................................................................................................................Benchmark2005 Composite Benchmark
Morningstar CategoryTarget Date 2000-2010
Overall Morningstar Rating™ Morningstar Return Morningstar Risk
. . .
Investment Strategy
The Mutual GlidePathSM 2005 Fund seeks to achieve
long-term capital growth by investing in a diversified mix of
asset classes and investment styles, which becomes
increasingly conservative over time and through retirement.
The Fund is designed for investors who intend to retire
within 5 years of 2005 and seek a simple method to achieve
a broadly diversified portfolio that will gradually become
more conservative in its allocation over time. The Fund
invests in the corresponding target date fund of the Callan
GlidePath Series, which utilizes both actively and passively
managed investments and allocates its investments among
Mellon Capital Russell 1000 Index, Fidelity (Pyramis) Core
Plus Fixed Income, Mellon Capital US Aggregate Bond Index,
Dodge & Cox International Equity, Capital Guardian All
Country World (ex US), SSgA EAFE Index, Prudential PRREF,
Russell Small Cap, PIMCO Small Cap, SSgA TIPS Index,
Western Asset Management Active US TIPS, and Galliard
Stable Return.
Fees and Expenses
Investment Fee 0.88%
Operations and Management
Product Inception Date 06-29-07Initial Inception Date 07-01-07Management Company Callan Associates Inc
Volatility Analysis
Low Moderate High
Category
The volatility measure is not displayed for investments withfewer than three years of history. The category average,however, is shown above.
Best 3 Month Return Worst 3 Month Return
15.71% -19.78%
(Mar '09 - May '09) (Sep '08 - Nov '08)
NotesThe fund is designed to continue along the glidepath for anadditional 20 years beyond the target retirement date. Theaverage investment fee is for illustration purposes only andhas been constructed according to the target allocations ofeach model. Actual investment fees accrue according to eachunderlying offering's position each day. The investment feeincludes a 0.35% charge by United's retirement programproduct.
Allocation of Stocks and Bonds
Performance
5
10
15
20
0
-5
-10
-15
Total Return%
as of 09-30-09
Investment
Benchmark
Average annual, if greater
than 1 year
YTD 1 Year 3 Year 5 Year 10 Year Since Inception
14.29 -1.68 . . . -5.80 Fund Return %11.83 -1.85 . . . . Benchmark Return %18.63 2.99 . . . . Category Average %................................................................................................................................................................................................................. . . . . . Morningstar Rating™. . . . . . # of Funds in Category
Returns shown represent past performance which cannot guarantee future results and are net of investment fees, but not
administrative fees. Your plan's specific returns may be lower. Also, current performance may be lower or higher than the
performance data quoted above. Fund values and investment returns will vary and principal value, when redeemed, may
be worth more or less than the original investment.
Contact your plan administrator or access your online account at getretirementright.com for your plan's returns
current to the most recent month-end. Consider the fund's investment objectives, risks, charges, and expenses before
investing.
Portfolio Analysis as of 08-31-09Composition as of 08-31-09 Net%
U.S. Stocks 34.4
Non-U.S. Stocks 12.0
Bonds 41.9
Cash -2.8
Other 14.5.............................................................................................-100 -50 0 50 100 Total 100.0
Morningstar Style Box™ as of 08-31-09 (EQ) ; 06-30-09 (F-I)
LargeM
edSm
all
Value Blend Growth
High
Med
Low
Short Interm Long
Top 10 Holdings as of 08-31-09 % Assets
Mellon Cap Mgt Corp. EB DL LgCap Stk Idx 31.04Fidelity Pyramis Core Plus Co 13.71Mellon Cap Mgt Corp. Agg Bond Idx 13.42Wells Fargo Stable Value 8.94Western Asset Inflation Indexed Plus Bd 4.79...........................................................................................................SSgA TIPS Series A 4.77Dodge & Cox International Stock 4.21SSgA EAFE INDEX FUND 4.09Capital Guardian ACWI (ExUS) Equity 4.01PIMCO Small Cap StocksPLUS TR Inst 3.79
...........................................................................................................
Total Number of Holdings 12
Morningstar Sectors as of 08-31-09 Fund%
h Information 21.86............................................................................................................
r Software 3.78
t Hardware 7.97
y Media 2.76
u Telecommunication 7.35
j Service 39.71............................................................................................................
i Healthcare Service 11.60
o Consumer Service 7.36
p Business Service 4.43
a Financial Service 16.32
k Manufacturing 38.44............................................................................................................
s Consumer Goods 12.36
d Industrial Materials 11.63
f Energy 10.64
g Utilities 3.81
Release Date: 09-30-2009
AFN41575
09-09
©2009 Morningstar, Inc., Morningstar Investment Profiles™ 312-696-6000. All rights reserved. The information contained herein: (1) is proprietary to Morningstar and/orits content providers; (2) may not be copied or distributed and (3) is not warranted to be accurate, complete or timely. Neither Morningstar nor its content providers areresponsible for any damages or losses arising from any use of information. Past performance is no guarantee of future performance. Visit our investment website atwww.morningstar.com .
Page 1 of 2
32
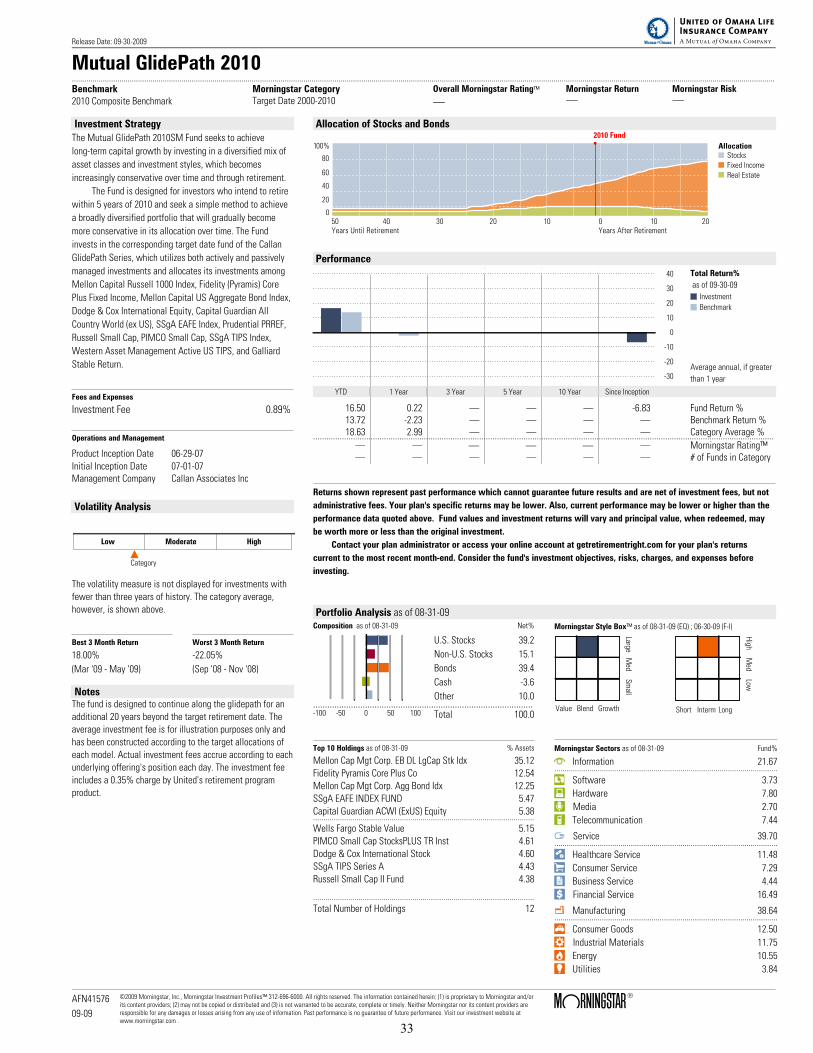
Mutual GlidePath 2010....................................................................................................................................................................................................................................................................................................................................................Benchmark2010 Composite Benchmark
Morningstar CategoryTarget Date 2000-2010
Overall Morningstar Rating™ Morningstar Return Morningstar Risk
. . .
Investment Strategy
The Mutual GlidePath 2010SM Fund seeks to achieve
long-term capital growth by investing in a diversified mix of
asset classes and investment styles, which becomes
increasingly conservative over time and through retirement.
The Fund is designed for investors who intend to retire
within 5 years of 2010 and seek a simple method to achieve
a broadly diversified portfolio that will gradually become
more conservative in its allocation over time. The Fund
invests in the corresponding target date fund of the Callan
GlidePath Series, which utilizes both actively and passively
managed investments and allocates its investments among
Mellon Capital Russell 1000 Index, Fidelity (Pyramis) Core
Plus Fixed Income, Mellon Capital US Aggregate Bond Index,
Dodge & Cox International Equity, Capital Guardian All
Country World (ex US), SSgA EAFE Index, Prudential PRREF,
Russell Small Cap, PIMCO Small Cap, SSgA TIPS Index,
Western Asset Management Active US TIPS, and Galliard
Stable Return.
Fees and Expenses
Investment Fee 0.89%
Operations and Management
Product Inception Date 06-29-07Initial Inception Date 07-01-07Management Company Callan Associates Inc
Volatility Analysis
Low Moderate High
Category
The volatility measure is not displayed for investments withfewer than three years of history. The category average,however, is shown above.
Best 3 Month Return Worst 3 Month Return
18.00% -22.05%
(Mar '09 - May '09) (Sep '08 - Nov '08)
NotesThe fund is designed to continue along the glidepath for anadditional 20 years beyond the target retirement date. Theaverage investment fee is for illustration purposes only andhas been constructed according to the target allocations ofeach model. Actual investment fees accrue according to eachunderlying offering's position each day. The investment feeincludes a 0.35% charge by United's retirement programproduct.
Allocation of Stocks and Bonds
Performance
10
20
30
40
0
-10
-20
-30
Total Return%
as of 09-30-09
Investment
Benchmark
Average annual, if greater
than 1 year
YTD 1 Year 3 Year 5 Year 10 Year Since Inception
16.50 0.22 . . . -6.83 Fund Return %13.72 -2.23 . . . . Benchmark Return %18.63 2.99 . . . . Category Average %................................................................................................................................................................................................................. . . . . . Morningstar Rating™. . . . . . # of Funds in Category
Returns shown represent past performance which cannot guarantee future results and are net of investment fees, but not
administrative fees. Your plan's specific returns may be lower. Also, current performance may be lower or higher than the
performance data quoted above. Fund values and investment returns will vary and principal value, when redeemed, may
be worth more or less than the original investment.
Contact your plan administrator or access your online account at getretirementright.com for your plan's returns
current to the most recent month-end. Consider the fund's investment objectives, risks, charges, and expenses before
investing.
Portfolio Analysis as of 08-31-09Composition as of 08-31-09 Net%
U.S. Stocks 39.2
Non-U.S. Stocks 15.1
Bonds 39.4
Cash -3.6
Other 10.0.............................................................................................-100 -50 0 50 100 Total 100.0
Morningstar Style Box™ as of 08-31-09 (EQ) ; 06-30-09 (F-I)
LargeM
edSm
all
Value Blend Growth
High
Med
Low
Short Interm Long
Top 10 Holdings as of 08-31-09 % Assets
Mellon Cap Mgt Corp. EB DL LgCap Stk Idx 35.12Fidelity Pyramis Core Plus Co 12.54Mellon Cap Mgt Corp. Agg Bond Idx 12.25SSgA EAFE INDEX FUND 5.47Capital Guardian ACWI (ExUS) Equity 5.38...........................................................................................................Wells Fargo Stable Value 5.15PIMCO Small Cap StocksPLUS TR Inst 4.61Dodge & Cox International Stock 4.60SSgA TIPS Series A 4.43Russell Small Cap II Fund 4.38
...........................................................................................................
Total Number of Holdings 12
Morningstar Sectors as of 08-31-09 Fund%
h Information 21.67............................................................................................................
r Software 3.73
t Hardware 7.80
y Media 2.70
u Telecommunication 7.44
j Service 39.70............................................................................................................
i Healthcare Service 11.48
o Consumer Service 7.29
p Business Service 4.44
a Financial Service 16.49
k Manufacturing 38.64............................................................................................................
s Consumer Goods 12.50
d Industrial Materials 11.75
f Energy 10.55
g Utilities 3.84
Release Date: 09-30-2009
AFN41576
09-09
©2009 Morningstar, Inc., Morningstar Investment Profiles™ 312-696-6000. All rights reserved. The information contained herein: (1) is proprietary to Morningstar and/orits content providers; (2) may not be copied or distributed and (3) is not warranted to be accurate, complete or timely. Neither Morningstar nor its content providers areresponsible for any damages or losses arising from any use of information. Past performance is no guarantee of future performance. Visit our investment website atwww.morningstar.com .
Page 1 of 2
33

Mutual GlidePath 2015....................................................................................................................................................................................................................................................................................................................................................Benchmark2015 Composite Benchmark
Morningstar CategoryTarget Date 2011-2015
Overall Morningstar Rating™ Morningstar Return Morningstar Risk
. . .
Investment Strategy
The Mutual GlidePath 2015SM Fund seeks to achieve
long-term capital growth by investing in a diversified mix of
asset classes and investment styles, which becomes
increasingly conservative over time and through retirement.
The Fund is designed for investors who intend to retire
within 5 years of 2015 and seek a simple method to achieve
a broadly diversified portfolio that will gradually become
more conservative in its allocation over time. The Fund
invests in the corresponding target date fund of the Callan
GlidePath Series, which utilizes both actively and passively
managed investments and allocates its investments among
Mellon Capital Russell 1000 Index, Dodge & Cox
International Equity, Capital Guardian All Country World (ex
US), SSgA EAFE Index, Fidelity (Pyramis) Core Plus Fixed
Income, Mellon Capital US Aggregate Bond Index, Prudential
PRREF, Russell Small Cap, PIMCO Small Cap, SSgA TIPS
Index, Western Asset Management Active US TIPS, and
Galliard Stable Return.
Fees and Expenses
Investment Fee 0.91%
Operations and Management
Product Inception Date 06-29-07Initial Inception Date 07-01-07Management Company Callan Associates Inc
Volatility Analysis
Low Moderate High
Category
The volatility measure is not displayed for investments withfewer than three years of history. The category average,however, is shown above.
Best 3 Month Return Worst 3 Month Return
20.36% -24.48%
(Mar '09 - May '09) (Sep '08 - Nov '08)
NotesThe fund is designed to continue along the glidepath for anadditional 20 years beyond the target retirement date. Theaverage investment fee is for illustration purposes only andhas been constructed according to the target allocations ofeach model. Actual investment fees accrue according to eachunderlying offering's position each day. The investment feeincludes a 0.35% charge by United's retirement programproduct.
Allocation of Stocks and Bonds
Performance
10
20
30
40
0
-10
-20
-30
Total Return%
as of 09-30-09
Investment
Benchmark
Average annual, if greater
than 1 year
YTD 1 Year 3 Year 5 Year 10 Year Since Inception
18.02 0.00 . . . -8.15 Fund Return %15.51 -2.84 . . . . Benchmark Return %19.45 0.88 . . . . Category Average %................................................................................................................................................................................................................. . . . . . Morningstar Rating™. . . . . . # of Funds in Category
Returns shown represent past performance which cannot guarantee future results and are net of investment fees, but not
administrative fees. Your plan's specific returns may be lower. Also, current performance may be lower or higher than the
performance data quoted above. Fund values and investment returns will vary and principal value, when redeemed, may
be worth more or less than the original investment.
Contact your plan administrator or access your online account at getretirementright.com for your plan's returns
current to the most recent month-end. Consider the fund's investment objectives, risks, charges, and expenses before
investing.
Portfolio Analysis as of 08-31-09Composition as of 08-31-09 Net%
U.S. Stocks 43.0
Non-U.S. Stocks 17.9
Bonds 36.6
Cash -4.3
Other 6.8.............................................................................................-100 -50 0 50 100 Total 100.0
Morningstar Style Box™ as of 08-31-09 (EQ) ; 06-30-09 (F-I)
LargeM
edSm
all
Value Blend Growth
High
Med
Low
Short Interm Long
Top 10 Holdings as of 08-31-09 % Assets
Mellon Cap Mgt Corp. EB DL LgCap Stk Idx 38.23Fidelity Pyramis Core Plus Co 12.00Mellon Cap Mgt Corp. Agg Bond Idx 11.73Dodge & Cox International Stock 6.38SSgA EAFE INDEX FUND 6.09...........................................................................................................Capital Guardian ACWI (ExUS) Equity 5.97PIMCO Small Cap StocksPLUS TR Inst 5.35Russell Small Cap II Fund 5.06PRUDENTIAL RETIREMENT REAL ESTATE FD 2.71Western Asset Inflation Indexed Plus Bd 2.39
...........................................................................................................
Total Number of Holdings 12
Morningstar Sectors as of 08-31-09 Fund%
h Information 21.65............................................................................................................
r Software 3.68
t Hardware 7.71
y Media 2.82
u Telecommunication 7.44
j Service 39.71............................................................................................................
i Healthcare Service 11.48
o Consumer Service 7.15
p Business Service 4.40
a Financial Service 16.68
k Manufacturing 38.64............................................................................................................
s Consumer Goods 12.61
d Industrial Materials 11.75
f Energy 10.53
g Utilities 3.75
Release Date: 09-30-2009
AFN41577
09-09
©2009 Morningstar, Inc., Morningstar Investment Profiles™ 312-696-6000. All rights reserved. The information contained herein: (1) is proprietary to Morningstar and/orits content providers; (2) may not be copied or distributed and (3) is not warranted to be accurate, complete or timely. Neither Morningstar nor its content providers areresponsible for any damages or losses arising from any use of information. Past performance is no guarantee of future performance. Visit our investment website atwww.morningstar.com .
Page 1 of 2
34
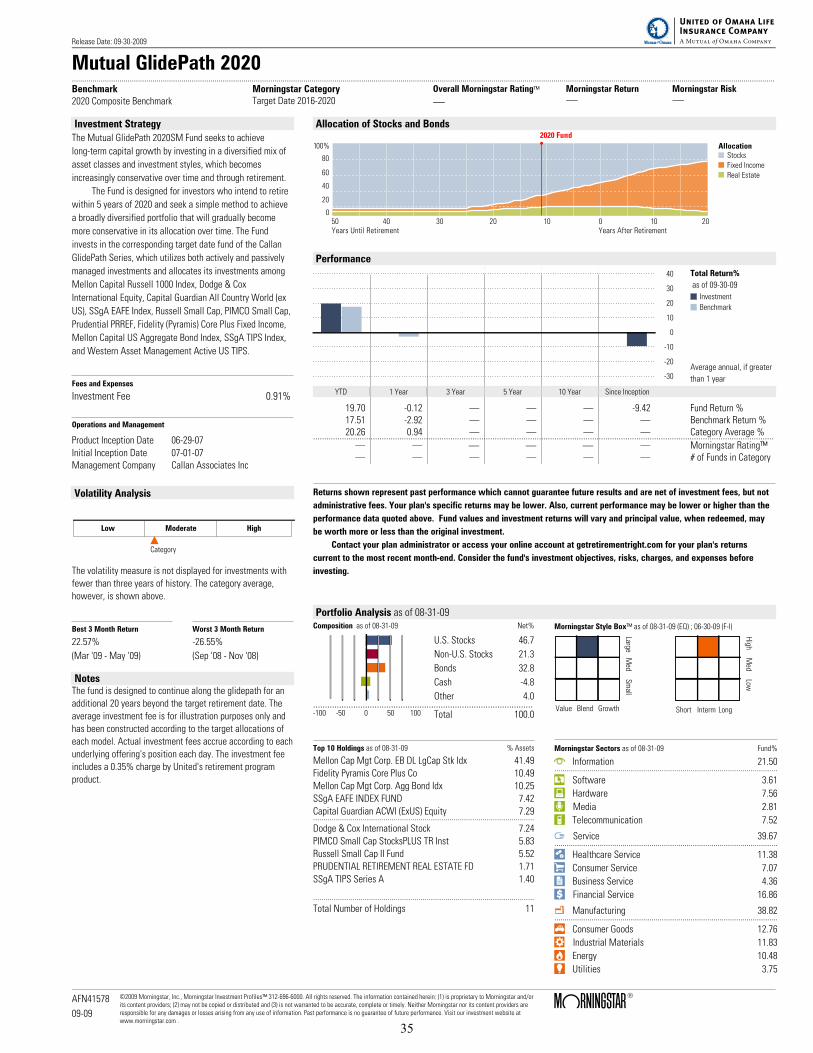
Mutual GlidePath 2020....................................................................................................................................................................................................................................................................................................................................................Benchmark2020 Composite Benchmark
Morningstar CategoryTarget Date 2016-2020
Overall Morningstar Rating™ Morningstar Return Morningstar Risk
. . .
Investment Strategy
The Mutual GlidePath 2020SM Fund seeks to achieve
long-term capital growth by investing in a diversified mix of
asset classes and investment styles, which becomes
increasingly conservative over time and through retirement.
The Fund is designed for investors who intend to retire
within 5 years of 2020 and seek a simple method to achieve
a broadly diversified portfolio that will gradually become
more conservative in its allocation over time. The Fund
invests in the corresponding target date fund of the Callan
GlidePath Series, which utilizes both actively and passively
managed investments and allocates its investments among
Mellon Capital Russell 1000 Index, Dodge & Cox
International Equity, Capital Guardian All Country World (ex
US), SSgA EAFE Index, Russell Small Cap, PIMCO Small Cap,
Prudential PRREF, Fidelity (Pyramis) Core Plus Fixed Income,
Mellon Capital US Aggregate Bond Index, SSgA TIPS Index,
and Western Asset Management Active US TIPS.
Fees and Expenses
Investment Fee 0.91%
Operations and Management
Product Inception Date 06-29-07Initial Inception Date 07-01-07Management Company Callan Associates Inc
Volatility Analysis
Low Moderate High
Category
The volatility measure is not displayed for investments withfewer than three years of history. The category average,however, is shown above.
Best 3 Month Return Worst 3 Month Return
22.57% -26.55%
(Mar '09 - May '09) (Sep '08 - Nov '08)
NotesThe fund is designed to continue along the glidepath for anadditional 20 years beyond the target retirement date. Theaverage investment fee is for illustration purposes only andhas been constructed according to the target allocations ofeach model. Actual investment fees accrue according to eachunderlying offering's position each day. The investment feeincludes a 0.35% charge by United's retirement programproduct.
Allocation of Stocks and Bonds
Performance
10
20
30
40
0
-10
-20
-30
Total Return%
as of 09-30-09
Investment
Benchmark
Average annual, if greater
than 1 year
YTD 1 Year 3 Year 5 Year 10 Year Since Inception
19.70 -0.12 . . . -9.42 Fund Return %17.51 -2.92 . . . . Benchmark Return %20.26 0.94 . . . . Category Average %................................................................................................................................................................................................................. . . . . . Morningstar Rating™. . . . . . # of Funds in Category
Returns shown represent past performance which cannot guarantee future results and are net of investment fees, but not
administrative fees. Your plan's specific returns may be lower. Also, current performance may be lower or higher than the
performance data quoted above. Fund values and investment returns will vary and principal value, when redeemed, may
be worth more or less than the original investment.
Contact your plan administrator or access your online account at getretirementright.com for your plan's returns
current to the most recent month-end. Consider the fund's investment objectives, risks, charges, and expenses before
investing.
Portfolio Analysis as of 08-31-09Composition as of 08-31-09 Net%
U.S. Stocks 46.7
Non-U.S. Stocks 21.3
Bonds 32.8
Cash -4.8
Other 4.0.............................................................................................-100 -50 0 50 100 Total 100.0
Morningstar Style Box™ as of 08-31-09 (EQ) ; 06-30-09 (F-I)
LargeM
edSm
all
Value Blend Growth
High
Med
Low
Short Interm Long
Top 10 Holdings as of 08-31-09 % Assets
Mellon Cap Mgt Corp. EB DL LgCap Stk Idx 41.49Fidelity Pyramis Core Plus Co 10.49Mellon Cap Mgt Corp. Agg Bond Idx 10.25SSgA EAFE INDEX FUND 7.42Capital Guardian ACWI (ExUS) Equity 7.29...........................................................................................................Dodge & Cox International Stock 7.24PIMCO Small Cap StocksPLUS TR Inst 5.83Russell Small Cap II Fund 5.52PRUDENTIAL RETIREMENT REAL ESTATE FD 1.71SSgA TIPS Series A 1.40
...........................................................................................................
Total Number of Holdings 11
Morningstar Sectors as of 08-31-09 Fund%
h Information 21.50............................................................................................................
r Software 3.61
t Hardware 7.56
y Media 2.81
u Telecommunication 7.52
j Service 39.67............................................................................................................
i Healthcare Service 11.38
o Consumer Service 7.07
p Business Service 4.36
a Financial Service 16.86
k Manufacturing 38.82............................................................................................................
s Consumer Goods 12.76
d Industrial Materials 11.83
f Energy 10.48
g Utilities 3.75
Release Date: 09-30-2009
AFN41578
09-09
©2009 Morningstar, Inc., Morningstar Investment Profiles™ 312-696-6000. All rights reserved. The information contained herein: (1) is proprietary to Morningstar and/orits content providers; (2) may not be copied or distributed and (3) is not warranted to be accurate, complete or timely. Neither Morningstar nor its content providers areresponsible for any damages or losses arising from any use of information. Past performance is no guarantee of future performance. Visit our investment website atwww.morningstar.com .
Page 1 of 2
35
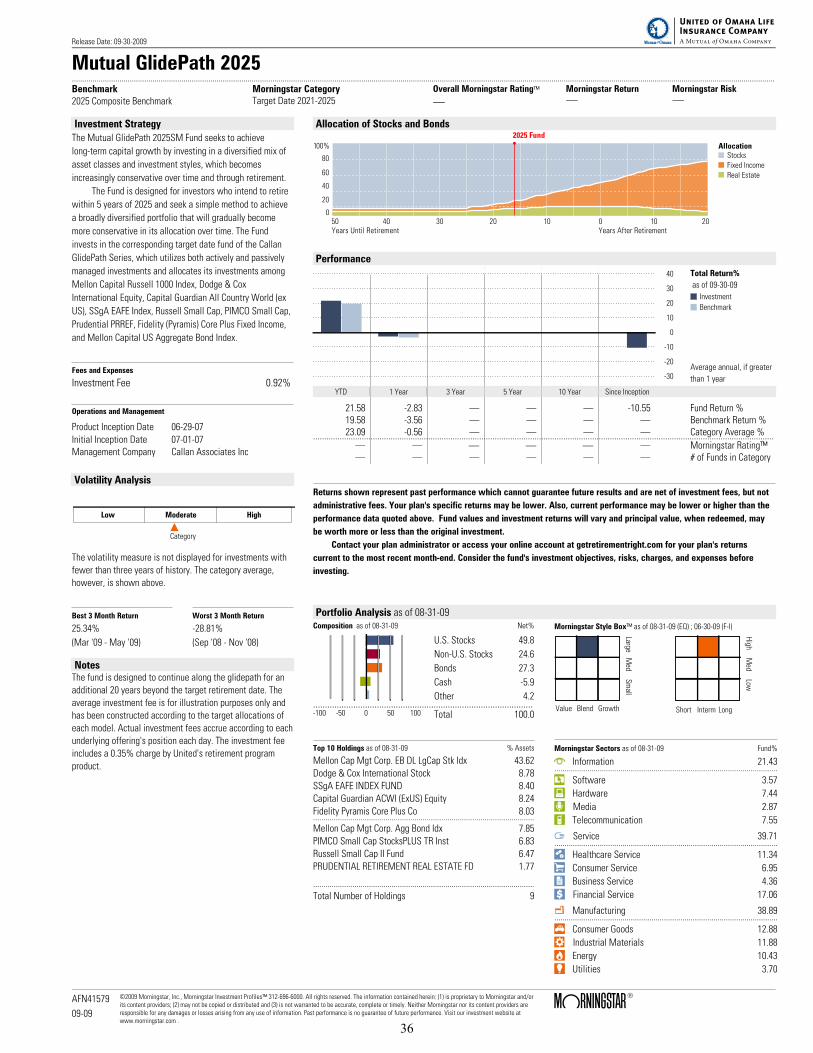
Mutual GlidePath 2025....................................................................................................................................................................................................................................................................................................................................................Benchmark2025 Composite Benchmark
Morningstar CategoryTarget Date 2021-2025
Overall Morningstar Rating™ Morningstar Return Morningstar Risk
. . .
Investment Strategy
The Mutual GlidePath 2025SM Fund seeks to achieve
long-term capital growth by investing in a diversified mix of
asset classes and investment styles, which becomes
increasingly conservative over time and through retirement.
The Fund is designed for investors who intend to retire
within 5 years of 2025 and seek a simple method to achieve
a broadly diversified portfolio that will gradually become
more conservative in its allocation over time. The Fund
invests in the corresponding target date fund of the Callan
GlidePath Series, which utilizes both actively and passively
managed investments and allocates its investments among
Mellon Capital Russell 1000 Index, Dodge & Cox
International Equity, Capital Guardian All Country World (ex
US), SSgA EAFE Index, Russell Small Cap, PIMCO Small Cap,
Prudential PRREF, Fidelity (Pyramis) Core Plus Fixed Income,
and Mellon Capital US Aggregate Bond Index.
Fees and Expenses
Investment Fee 0.92%
Operations and Management
Product Inception Date 06-29-07Initial Inception Date 07-01-07Management Company Callan Associates Inc
Volatility Analysis
Low Moderate High
Category
The volatility measure is not displayed for investments withfewer than three years of history. The category average,however, is shown above.
Best 3 Month Return Worst 3 Month Return
25.34% -28.81%
(Mar '09 - May '09) (Sep '08 - Nov '08)
NotesThe fund is designed to continue along the glidepath for anadditional 20 years beyond the target retirement date. Theaverage investment fee is for illustration purposes only andhas been constructed according to the target allocations ofeach model. Actual investment fees accrue according to eachunderlying offering's position each day. The investment feeincludes a 0.35% charge by United's retirement programproduct.
Allocation of Stocks and Bonds
Performance
10
20
30
40
0
-10
-20
-30
Total Return%
as of 09-30-09
Investment
Benchmark
Average annual, if greater
than 1 year
YTD 1 Year 3 Year 5 Year 10 Year Since Inception
21.58 -2.83 . . . -10.55 Fund Return %19.58 -3.56 . . . . Benchmark Return %23.09 -0.56 . . . . Category Average %................................................................................................................................................................................................................. . . . . . Morningstar Rating™. . . . . . # of Funds in Category
Returns shown represent past performance which cannot guarantee future results and are net of investment fees, but not
administrative fees. Your plan's specific returns may be lower. Also, current performance may be lower or higher than the
performance data quoted above. Fund values and investment returns will vary and principal value, when redeemed, may
be worth more or less than the original investment.
Contact your plan administrator or access your online account at getretirementright.com for your plan's returns
current to the most recent month-end. Consider the fund's investment objectives, risks, charges, and expenses before
investing.
Portfolio Analysis as of 08-31-09Composition as of 08-31-09 Net%
U.S. Stocks 49.8
Non-U.S. Stocks 24.6
Bonds 27.3
Cash -5.9
Other 4.2.............................................................................................-100 -50 0 50 100 Total 100.0
Morningstar Style Box™ as of 08-31-09 (EQ) ; 06-30-09 (F-I)
LargeM
edSm
all
Value Blend Growth
High
Med
Low
Short Interm Long
Top 10 Holdings as of 08-31-09 % Assets
Mellon Cap Mgt Corp. EB DL LgCap Stk Idx 43.62Dodge & Cox International Stock 8.78SSgA EAFE INDEX FUND 8.40Capital Guardian ACWI (ExUS) Equity 8.24Fidelity Pyramis Core Plus Co 8.03...........................................................................................................Mellon Cap Mgt Corp. Agg Bond Idx 7.85PIMCO Small Cap StocksPLUS TR Inst 6.83Russell Small Cap II Fund 6.47PRUDENTIAL RETIREMENT REAL ESTATE FD 1.77
...........................................................................................................
Total Number of Holdings 9
Morningstar Sectors as of 08-31-09 Fund%
h Information 21.43............................................................................................................
r Software 3.57
t Hardware 7.44
y Media 2.87
u Telecommunication 7.55
j Service 39.71............................................................................................................
i Healthcare Service 11.34
o Consumer Service 6.95
p Business Service 4.36
a Financial Service 17.06
k Manufacturing 38.89............................................................................................................
s Consumer Goods 12.88
d Industrial Materials 11.88
f Energy 10.43
g Utilities 3.70
Release Date: 09-30-2009
AFN41579
09-09
©2009 Morningstar, Inc., Morningstar Investment Profiles™ 312-696-6000. All rights reserved. The information contained herein: (1) is proprietary to Morningstar and/orits content providers; (2) may not be copied or distributed and (3) is not warranted to be accurate, complete or timely. Neither Morningstar nor its content providers areresponsible for any damages or losses arising from any use of information. Past performance is no guarantee of future performance. Visit our investment website atwww.morningstar.com .
Page 1 of 2
36
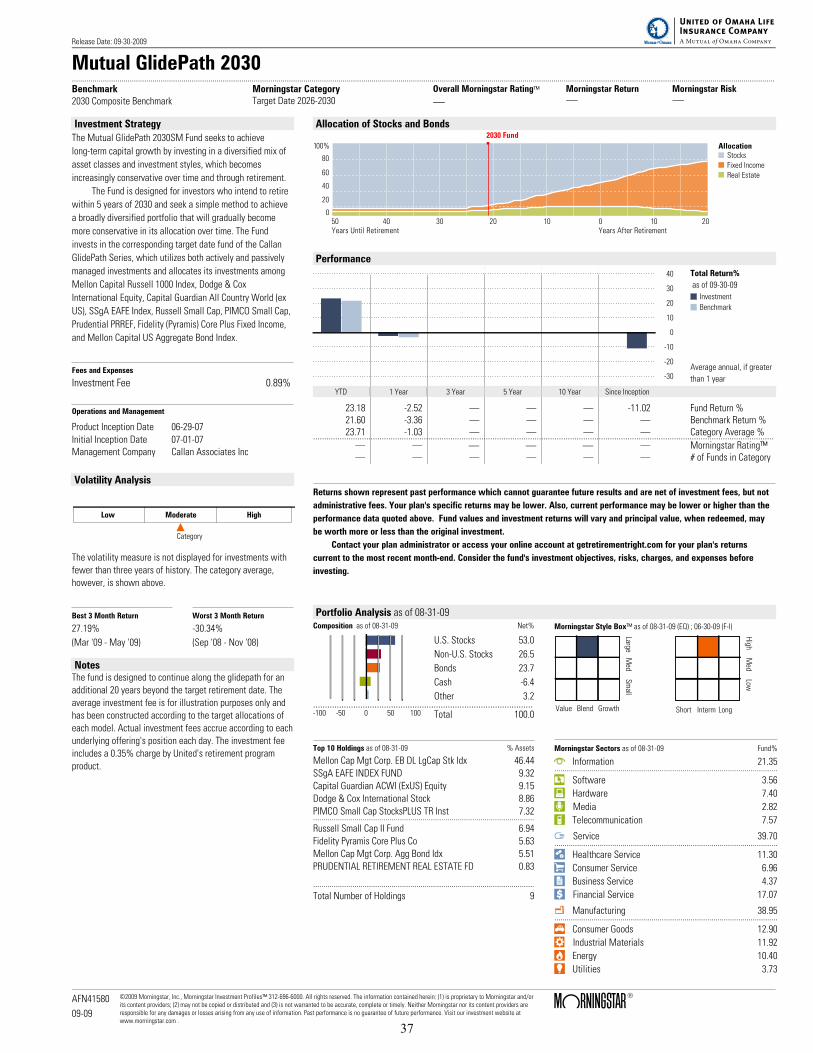
Mutual GlidePath 2030....................................................................................................................................................................................................................................................................................................................................................Benchmark2030 Composite Benchmark
Morningstar CategoryTarget Date 2026-2030
Overall Morningstar Rating™ Morningstar Return Morningstar Risk
. . .
Investment Strategy
The Mutual GlidePath 2030SM Fund seeks to achieve
long-term capital growth by investing in a diversified mix of
asset classes and investment styles, which becomes
increasingly conservative over time and through retirement.
The Fund is designed for investors who intend to retire
within 5 years of 2030 and seek a simple method to achieve
a broadly diversified portfolio that will gradually become
more conservative in its allocation over time. The Fund
invests in the corresponding target date fund of the Callan
GlidePath Series, which utilizes both actively and passively
managed investments and allocates its investments among
Mellon Capital Russell 1000 Index, Dodge & Cox
International Equity, Capital Guardian All Country World (ex
US), SSgA EAFE Index, Russell Small Cap, PIMCO Small Cap,
Prudential PRREF, Fidelity (Pyramis) Core Plus Fixed Income,
and Mellon Capital US Aggregate Bond Index.
Fees and Expenses
Investment Fee 0.89%
Operations and Management
Product Inception Date 06-29-07Initial Inception Date 07-01-07Management Company Callan Associates Inc
Volatility Analysis
Low Moderate High
Category
The volatility measure is not displayed for investments withfewer than three years of history. The category average,however, is shown above.
Best 3 Month Return Worst 3 Month Return
27.19% -30.34%
(Mar '09 - May '09) (Sep '08 - Nov '08)
NotesThe fund is designed to continue along the glidepath for anadditional 20 years beyond the target retirement date. Theaverage investment fee is for illustration purposes only andhas been constructed according to the target allocations ofeach model. Actual investment fees accrue according to eachunderlying offering's position each day. The investment feeincludes a 0.35% charge by United's retirement programproduct.
Allocation of Stocks and Bonds
Performance
10
20
30
40
0
-10
-20
-30
Total Return%
as of 09-30-09
Investment
Benchmark
Average annual, if greater
than 1 year
YTD 1 Year 3 Year 5 Year 10 Year Since Inception
23.18 -2.52 . . . -11.02 Fund Return %21.60 -3.36 . . . . Benchmark Return %23.71 -1.03 . . . . Category Average %................................................................................................................................................................................................................. . . . . . Morningstar Rating™. . . . . . # of Funds in Category
Returns shown represent past performance which cannot guarantee future results and are net of investment fees, but not
administrative fees. Your plan's specific returns may be lower. Also, current performance may be lower or higher than the
performance data quoted above. Fund values and investment returns will vary and principal value, when redeemed, may
be worth more or less than the original investment.
Contact your plan administrator or access your online account at getretirementright.com for your plan's returns
current to the most recent month-end. Consider the fund's investment objectives, risks, charges, and expenses before
investing.
Portfolio Analysis as of 08-31-09Composition as of 08-31-09 Net%
U.S. Stocks 53.0
Non-U.S. Stocks 26.5
Bonds 23.7
Cash -6.4
Other 3.2.............................................................................................-100 -50 0 50 100 Total 100.0
Morningstar Style Box™ as of 08-31-09 (EQ) ; 06-30-09 (F-I)
LargeM
edSm
all
Value Blend Growth
High
Med
Low
Short Interm Long
Top 10 Holdings as of 08-31-09 % Assets
Mellon Cap Mgt Corp. EB DL LgCap Stk Idx 46.44SSgA EAFE INDEX FUND 9.32Capital Guardian ACWI (ExUS) Equity 9.15Dodge & Cox International Stock 8.86PIMCO Small Cap StocksPLUS TR Inst 7.32...........................................................................................................Russell Small Cap II Fund 6.94Fidelity Pyramis Core Plus Co 5.63Mellon Cap Mgt Corp. Agg Bond Idx 5.51PRUDENTIAL RETIREMENT REAL ESTATE FD 0.83
...........................................................................................................
Total Number of Holdings 9
Morningstar Sectors as of 08-31-09 Fund%
h Information 21.35............................................................................................................
r Software 3.56
t Hardware 7.40
y Media 2.82
u Telecommunication 7.57
j Service 39.70............................................................................................................
i Healthcare Service 11.30
o Consumer Service 6.96
p Business Service 4.37
a Financial Service 17.07
k Manufacturing 38.95............................................................................................................
s Consumer Goods 12.90
d Industrial Materials 11.92
f Energy 10.40
g Utilities 3.73
Release Date: 09-30-2009
AFN41580
09-09
©2009 Morningstar, Inc., Morningstar Investment Profiles™ 312-696-6000. All rights reserved. The information contained herein: (1) is proprietary to Morningstar and/orits content providers; (2) may not be copied or distributed and (3) is not warranted to be accurate, complete or timely. Neither Morningstar nor its content providers areresponsible for any damages or losses arising from any use of information. Past performance is no guarantee of future performance. Visit our investment website atwww.morningstar.com .
Page 1 of 2
37

Mutual GlidePath 2035....................................................................................................................................................................................................................................................................................................................................................Benchmark2035 Composite Benchmark
Morningstar CategoryTarget Date 2031-2035
Overall Morningstar Rating™ Morningstar Return Morningstar Risk
. . .
Investment Strategy
The Mutual GlidePath 2035SM Fund seeks to achieve
long-term capital growth by investing in a diversified mix of
asset classes and investment styles, which becomes
increasingly conservative over time and through retirement.
The Fund is designed for investors who intend to retire
within 5 years of 2035 and seek a simple method to achieve
a broadly diversified portfolio that will gradually become
more conservative in its allocation over time. The Fund
invests in the corresponding target date fund of the Callan
GlidePath Series, which utilizes both actively and passively
managed investments and allocates its investments among
Mellon Capital Russell 1000 Index, Dodge & Cox
International Equity, Capital Guardian All Country World (ex
US), SSgA EAFE Index, Russell Small Cap, PIMCO Small Cap,
Prudential PRREF, Fidelity (Pyramis) Core Plus Fixed Income,
and Mellon Capital US Aggregate Bond Index.
Fees and Expenses
Investment Fee 0.88%
Operations and Management
Product Inception Date 06-29-07Initial Inception Date 07-01-07Management Company Callan Associates Inc
Volatility Analysis
Low Moderate High
Category
The volatility measure is not displayed for investments withfewer than three years of history. The category average,however, is shown above.
Best 3 Month Return Worst 3 Month Return
28.07% -31.00%
(Mar '09 - May '09) (Sep '08 - Nov '08)
NotesThe fund is designed to continue along the glidepath for anadditional 20 years beyond the target retirement date. Theaverage investment fee is for illustration purposes only andhas been constructed according to the target allocations ofeach model. Actual investment fees accrue according to eachunderlying offering's position each day. The investment feeincludes a 0.35% charge by United's retirement programproduct.
Allocation of Stocks and Bonds
Performance
10
20
30
40
0
-10
-20
-30
Total Return%
as of 09-30-09
Investment
Benchmark
Average annual, if greater
than 1 year
YTD 1 Year 3 Year 5 Year 10 Year Since Inception
23.75 -2.52 . . . -11.17 Fund Return %22.65 -3.05 . . . . Benchmark Return %24.38 -1.60 . . . . Category Average %................................................................................................................................................................................................................. . . . . . Morningstar Rating™. . . . . . # of Funds in Category
Returns shown represent past performance which cannot guarantee future results and are net of investment fees, but not
administrative fees. Your plan's specific returns may be lower. Also, current performance may be lower or higher than the
performance data quoted above. Fund values and investment returns will vary and principal value, when redeemed, may
be worth more or less than the original investment.
Contact your plan administrator or access your online account at getretirementright.com for your plan's returns
current to the most recent month-end. Consider the fund's investment objectives, risks, charges, and expenses before
investing.
Portfolio Analysis as of 08-31-09Composition as of 08-31-09 Net%
U.S. Stocks 53.8
Non-U.S. Stocks 27.9
Bonds 22.0
Cash -6.9
Other 3.3.............................................................................................-100 -50 0 50 100 Total 100.0
Morningstar Style Box™ as of 08-31-09 (EQ) ; 06-30-09 (F-I)
LargeM
edSm
all
Value Blend Growth
High
Med
Low
Short Interm Long
Top 10 Holdings as of 08-31-09 % Assets
Mellon Cap Mgt Corp. EB DL LgCap Stk Idx 46.76Dodge & Cox International Stock 9.74SSgA EAFE INDEX FUND 9.62Capital Guardian ACWI (ExUS) Equity 9.46PIMCO Small Cap StocksPLUS TR Inst 7.82...........................................................................................................Russell Small Cap II Fund 7.41Fidelity Pyramis Core Plus Co 4.22Mellon Cap Mgt Corp. Agg Bond Idx 4.12PRUDENTIAL RETIREMENT REAL ESTATE FD 0.86
...........................................................................................................
Total Number of Holdings 9
Morningstar Sectors as of 08-31-09 Fund%
h Information 21.33............................................................................................................
r Software 3.54
t Hardware 7.35
y Media 2.86
u Telecommunication 7.58
j Service 39.71............................................................................................................
i Healthcare Service 11.29
o Consumer Service 6.89
p Business Service 4.37
a Financial Service 17.16
k Manufacturing 38.95............................................................................................................
s Consumer Goods 12.95
d Industrial Materials 11.93
f Energy 10.38
g Utilities 3.69
Release Date: 09-30-2009
AFN41581
09-09
©2009 Morningstar, Inc., Morningstar Investment Profiles™ 312-696-6000. All rights reserved. The information contained herein: (1) is proprietary to Morningstar and/orits content providers; (2) may not be copied or distributed and (3) is not warranted to be accurate, complete or timely. Neither Morningstar nor its content providers areresponsible for any damages or losses arising from any use of information. Past performance is no guarantee of future performance. Visit our investment website atwww.morningstar.com .
Page 1 of 2
38
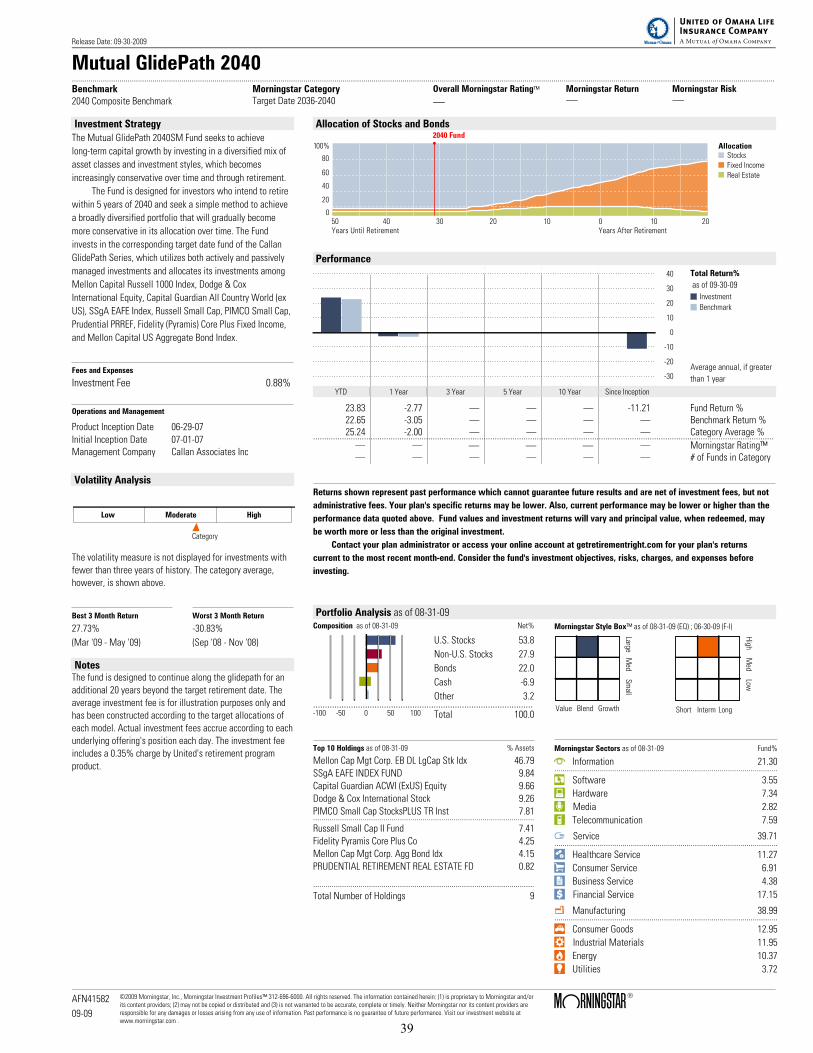
Mutual GlidePath 2040....................................................................................................................................................................................................................................................................................................................................................Benchmark2040 Composite Benchmark
Morningstar CategoryTarget Date 2036-2040
Overall Morningstar Rating™ Morningstar Return Morningstar Risk
. . .
Investment Strategy
The Mutual GlidePath 2040SM Fund seeks to achieve
long-term capital growth by investing in a diversified mix of
asset classes and investment styles, which becomes
increasingly conservative over time and through retirement.
The Fund is designed for investors who intend to retire
within 5 years of 2040 and seek a simple method to achieve
a broadly diversified portfolio that will gradually become
more conservative in its allocation over time. The Fund
invests in the corresponding target date fund of the Callan
GlidePath Series, which utilizes both actively and passively
managed investments and allocates its investments among
Mellon Capital Russell 1000 Index, Dodge & Cox
International Equity, Capital Guardian All Country World (ex
US), SSgA EAFE Index, Russell Small Cap, PIMCO Small Cap,
Prudential PRREF, Fidelity (Pyramis) Core Plus Fixed Income,
and Mellon Capital US Aggregate Bond Index.
Fees and Expenses
Investment Fee 0.88%
Operations and Management
Product Inception Date 06-29-07Initial Inception Date 07-01-07Management Company Callan Associates Inc
Volatility Analysis
Low Moderate High
Category
The volatility measure is not displayed for investments withfewer than three years of history. The category average,however, is shown above.
Best 3 Month Return Worst 3 Month Return
27.73% -30.83%
(Mar '09 - May '09) (Sep '08 - Nov '08)
NotesThe fund is designed to continue along the glidepath for anadditional 20 years beyond the target retirement date. Theaverage investment fee is for illustration purposes only andhas been constructed according to the target allocations ofeach model. Actual investment fees accrue according to eachunderlying offering's position each day. The investment feeincludes a 0.35% charge by United's retirement programproduct.
Allocation of Stocks and Bonds
Performance
10
20
30
40
0
-10
-20
-30
Total Return%
as of 09-30-09
Investment
Benchmark
Average annual, if greater
than 1 year
YTD 1 Year 3 Year 5 Year 10 Year Since Inception
23.83 -2.77 . . . -11.21 Fund Return %22.65 -3.05 . . . . Benchmark Return %25.24 -2.00 . . . . Category Average %................................................................................................................................................................................................................. . . . . . Morningstar Rating™. . . . . . # of Funds in Category
Returns shown represent past performance which cannot guarantee future results and are net of investment fees, but not
administrative fees. Your plan's specific returns may be lower. Also, current performance may be lower or higher than the
performance data quoted above. Fund values and investment returns will vary and principal value, when redeemed, may
be worth more or less than the original investment.
Contact your plan administrator or access your online account at getretirementright.com for your plan's returns
current to the most recent month-end. Consider the fund's investment objectives, risks, charges, and expenses before
investing.
Portfolio Analysis as of 08-31-09Composition as of 08-31-09 Net%
U.S. Stocks 53.8
Non-U.S. Stocks 27.9
Bonds 22.0
Cash -6.9
Other 3.2.............................................................................................-100 -50 0 50 100 Total 100.0
Morningstar Style Box™ as of 08-31-09 (EQ) ; 06-30-09 (F-I)
LargeM
edSm
all
Value Blend Growth
High
Med
Low
Short Interm Long
Top 10 Holdings as of 08-31-09 % Assets
Mellon Cap Mgt Corp. EB DL LgCap Stk Idx 46.79SSgA EAFE INDEX FUND 9.84Capital Guardian ACWI (ExUS) Equity 9.66Dodge & Cox International Stock 9.26PIMCO Small Cap StocksPLUS TR Inst 7.81...........................................................................................................Russell Small Cap II Fund 7.41Fidelity Pyramis Core Plus Co 4.25Mellon Cap Mgt Corp. Agg Bond Idx 4.15PRUDENTIAL RETIREMENT REAL ESTATE FD 0.82
...........................................................................................................
Total Number of Holdings 9
Morningstar Sectors as of 08-31-09 Fund%
h Information 21.30............................................................................................................
r Software 3.55
t Hardware 7.34
y Media 2.82
u Telecommunication 7.59
j Service 39.71............................................................................................................
i Healthcare Service 11.27
o Consumer Service 6.91
p Business Service 4.38
a Financial Service 17.15
k Manufacturing 38.99............................................................................................................
s Consumer Goods 12.95
d Industrial Materials 11.95
f Energy 10.37
g Utilities 3.72
Release Date: 09-30-2009
AFN41582
09-09
©2009 Morningstar, Inc., Morningstar Investment Profiles™ 312-696-6000. All rights reserved. The information contained herein: (1) is proprietary to Morningstar and/orits content providers; (2) may not be copied or distributed and (3) is not warranted to be accurate, complete or timely. Neither Morningstar nor its content providers areresponsible for any damages or losses arising from any use of information. Past performance is no guarantee of future performance. Visit our investment website atwww.morningstar.com .
Page 1 of 2
39
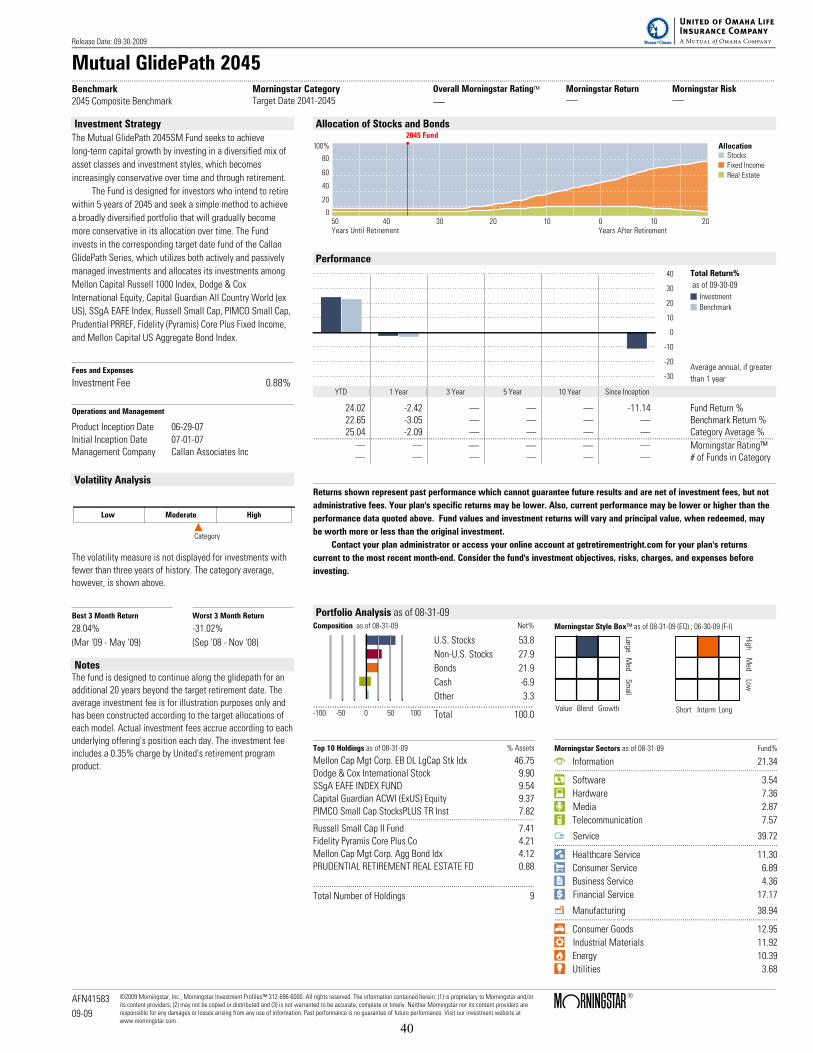
Mutual GlidePath 2045....................................................................................................................................................................................................................................................................................................................................................Benchmark
2045 Composite Benchmark
Morningstar CategoryTarget Date 2041-2045
Overall Morningstar Rating™ Morningstar Return Morningstar Risk
. . .
Investment Strategy
The Mutual GlidePath 2045SM Fund seeks to achieve
long-term capital growth by investing in a diversified mix of
asset classes and investment styles, which becomes
increasingly conservative over time and through retirement.
The Fund is designed for investors who intend to retire
within 5 years of 2045 and seek a simple method to achieve
a broadly diversified portfolio that will gradually become
more conservative in its allocation over time. The Fund
invests in the corresponding target date fund of the Callan
GlidePath Series, which utilizes both actively and passively
managed investments and allocates its investments among
Mellon Capital Russell 1000 Index, Dodge & Cox
International Equity, Capital Guardian All Country World (ex
US), SSgA EAFE Index, Russell Small Cap, PIMCO Small Cap,
Prudential PRREF, Fidelity (Pyramis) Core Plus Fixed Income,
and Mellon Capital US Aggregate Bond Index.
Fees and Expenses
Investment Fee 0.88%
Operations and Management
Product Inception Date 06-29-07
Initial Inception Date 07-01-07
Management Company Callan Associates Inc
Volatility Analysis
Low Moderate High
Category
The volatility measure is not displayed for investments with
fewer than three years of history. The category average,
however, is shown above.
Best 3 Month Return Worst 3 Month Return
28.04% -31.02%
(Mar '09 - May '09) (Sep '08 - Nov '08)
NotesThe fund is designed to continue along the glidepath for an
additional 20 years beyond the target retirement date. The
average investment fee is for illustration purposes only and
has been constructed according to the target allocations of
each model. Actual investment fees accrue according to each
underlying offering's position each day. The investment fee
includes a 0.35% charge by United's retirement program
product.
Allocation of Stocks and Bonds
Performance
10
20
30
40
0
-10
-20
-30
Total Return%
as of 09-30-09
Investment
Benchmark
Average annual, if greater
than 1 year
YTD 1 Year 3 Year 5 Year 10 Year Since Inception
24.02 -2.42 . . . -11.14 Fund Return %22.65 -3.05 . . . . Benchmark Return %25.04 -2.09 . . . . Category Average %................................................................................................................................................................................................................. . . . . . Morningstar Rating™. . . . . . # of Funds in Category
Returns shown represent past performance which cannot guarantee future results and are net of investment fees, but not
administrative fees. Your plan's specific returns may be lower. Also, current performance may be lower or higher than the
performance data quoted above. Fund values and investment returns will vary and principal value, when redeemed, may
be worth more or less than the original investment.
Contact your plan administrator or access your online account at getretirementright.com for your plan's returns
current to the most recent month-end. Consider the fund's investment objectives, risks, charges, and expenses before
investing.
Portfolio Analysis as of 08-31-09Composition as of 08-31-09 Net%
U.S. Stocks 53.8
Non-U.S. Stocks 27.9
Bonds 21.9
Cash -6.9
Other 3.3.............................................................................................-100 -50 0 50 100 Total 100.0
Morningstar Style Box™ as of 08-31-09 (EQ) ; 06-30-09 (F-I)
LargeMed
Small
Value Blend Growth
High
Med
Low
Short Interm Long
Top 10 Holdings as of 08-31-09 % Assets
Mellon Cap Mgt Corp. EB DL LgCap Stk Idx 46.75
Dodge & Cox International Stock 9.90
SSgA EAFE INDEX FUND 9.54
Capital Guardian ACWI (ExUS) Equity 9.37
PIMCO Small Cap StocksPLUS TR Inst 7.82...........................................................................................................
Russell Small Cap II Fund 7.41
Fidelity Pyramis Core Plus Co 4.21
Mellon Cap Mgt Corp. Agg Bond Idx 4.12
PRUDENTIAL RETIREMENT REAL ESTATE FD 0.88
...........................................................................................................
Total Number of Holdings 9
Morningstar Sectors as of 08-31-09 Fund%
h Information 21.34............................................................................................................
r Software 3.54
t Hardware 7.36
y Media 2.87
u Telecommunication 7.57
j Service 39.72............................................................................................................
i Healthcare Service 11.30
o Consumer Service 6.89
p Business Service 4.36
a Financial Service 17.17
k Manufacturing 38.94............................................................................................................
s Consumer Goods 12.95
d Industrial Materials 11.92
f Energy 10.39
g Utilities 3.68
Release Date: 09-30-2009
AFN41583
09-09
©2009 Morningstar, Inc., Morningstar Investment Profiles™ 312-696-6000. All rights reserved. The information contained herein: (1) is proprietary to Morningstar and/orits content providers; (2) may not be copied or distributed and (3) is not warranted to be accurate, complete or timely. Neither Morningstar nor its content providers areresponsible for any damages or losses arising from any use of information. Past performance is no guarantee of future performance. Visit our investment website atwww.morningstar.com .
Page 1 of 2
40
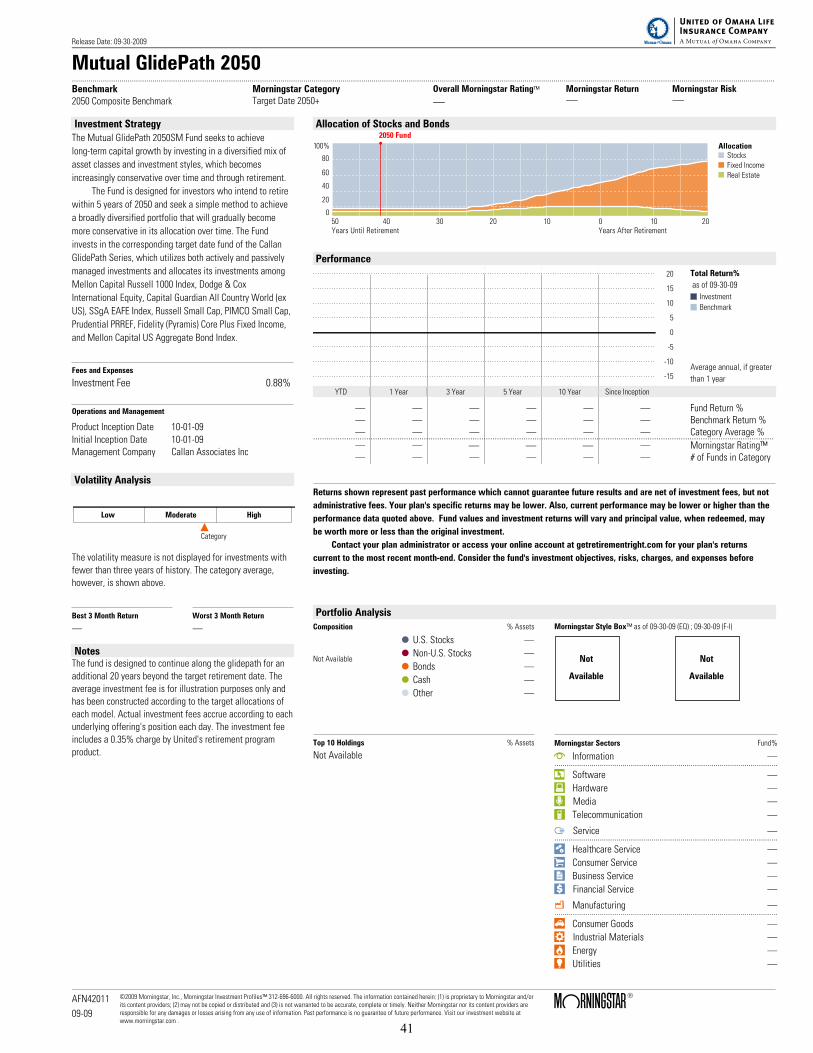
Mutual GlidePath 2050....................................................................................................................................................................................................................................................................................................................................................Benchmark
2050 Composite Benchmark
Morningstar CategoryTarget Date 2050+
Overall Morningstar Rating™ Morningstar Return Morningstar Risk
. . .
Investment Strategy
The Mutual GlidePath 2050SM Fund seeks to achieve
long-term capital growth by investing in a diversified mix of
asset classes and investment styles, which becomes
increasingly conservative over time and through retirement.
The Fund is designed for investors who intend to retire
within 5 years of 2050 and seek a simple method to achieve
a broadly diversified portfolio that will gradually become
more conservative in its allocation over time. The Fund
invests in the corresponding target date fund of the Callan
GlidePath Series, which utilizes both actively and passively
managed investments and allocates its investments among
Mellon Capital Russell 1000 Index, Dodge & Cox
International Equity, Capital Guardian All Country World (ex
US), SSgA EAFE Index, Russell Small Cap, PIMCO Small Cap,
Prudential PRREF, Fidelity (Pyramis) Core Plus Fixed Income,
and Mellon Capital US Aggregate Bond Index.
Fees and Expenses
Investment Fee 0.88%
Operations and Management
Product Inception Date 10-01-09
Initial Inception Date 10-01-09
Management Company Callan Associates Inc
Volatility Analysis
Low Moderate High
Category
The volatility measure is not displayed for investments with
fewer than three years of history. The category average,
however, is shown above.
Best 3 Month Return Worst 3 Month Return
. .
NotesThe fund is designed to continue along the glidepath for an
additional 20 years beyond the target retirement date. The
average investment fee is for illustration purposes only and
has been constructed according to the target allocations of
each model. Actual investment fees accrue according to each
underlying offering's position each day. The investment fee
includes a 0.35% charge by United's retirement program
product.
Allocation of Stocks and Bonds
Performance
5
10
15
20
0
-5
-10
-15
Total Return%
as of 09-30-09
Investment
Benchmark
Average annual, if greater
than 1 year
YTD 1 Year 3 Year 5 Year 10 Year Since Inception
. . . . . . Fund Return %
. . . . . . Benchmark Return %
. . . . . . Category Average %................................................................................................................................................................................................................
. . . . . . Morningstar Rating™
. . . . . . # of Funds in Category
Returns shown represent past performance which cannot guarantee future results and are net of investment fees, but not
administrative fees. Your plan's specific returns may be lower. Also, current performance may be lower or higher than the
performance data quoted above. Fund values and investment returns will vary and principal value, when redeemed, may
be worth more or less than the original investment.
Contact your plan administrator or access your online account at getretirementright.com for your plan's returns
current to the most recent month-end. Consider the fund's investment objectives, risks, charges, and expenses before
investing.
Portfolio Analysis
Composition % Assets
Not Available
U.S. Stocks .Non-U.S. Stocks .Bonds .Cash .Other .
Morningstar Style Box™ as of 09-30-09 (EQ) ; 09-30-09 (F-I)
Not
Available
Not
Available
Top 10 Holdings % Assets
Not Available
Morningstar Sectors Fund%
h Information .............................................................................................................
r Software .
t Hardware .
y Media .
u Telecommunication .
j Service .............................................................................................................
i Healthcare Service .
o Consumer Service .
p Business Service .
a Financial Service .
k Manufacturing .............................................................................................................
s Consumer Goods .
d Industrial Materials .
f Energy .
g Utilities .
Release Date: 09-30-2009
AFN42011
09-09
©2009 Morningstar, Inc., Morningstar Investment Profiles™ 312-696-6000. All rights reserved. The information contained herein: (1) is proprietary to Morningstar and/orits content providers; (2) may not be copied or distributed and (3) is not warranted to be accurate, complete or timely. Neither Morningstar nor its content providers areresponsible for any damages or losses arising from any use of information. Past performance is no guarantee of future performance. Visit our investment website atwww.morningstar.com .
Page 1 of 2
41
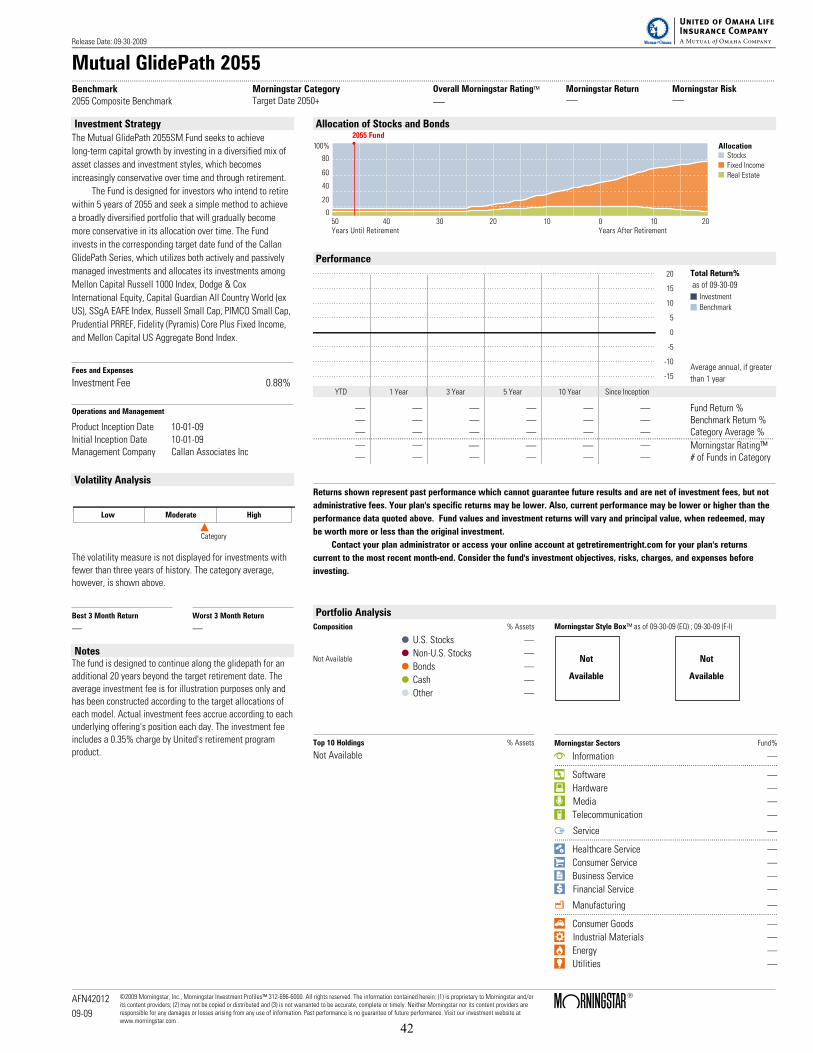
Mutual GlidePath 2055....................................................................................................................................................................................................................................................................................................................................................Benchmark
2055 Composite Benchmark
Morningstar CategoryTarget Date 2050+
Overall Morningstar Rating™ Morningstar Return Morningstar Risk
. . .
Investment Strategy
The Mutual GlidePath 2055SM Fund seeks to achieve
long-term capital growth by investing in a diversified mix of
asset classes and investment styles, which becomes
increasingly conservative over time and through retirement.
The Fund is designed for investors who intend to retire
within 5 years of 2055 and seek a simple method to achieve
a broadly diversified portfolio that will gradually become
more conservative in its allocation over time. The Fund
invests in the corresponding target date fund of the Callan
GlidePath Series, which utilizes both actively and passively
managed investments and allocates its investments among
Mellon Capital Russell 1000 Index, Dodge & Cox
International Equity, Capital Guardian All Country World (ex
US), SSgA EAFE Index, Russell Small Cap, PIMCO Small Cap,
Prudential PRREF, Fidelity (Pyramis) Core Plus Fixed Income,
and Mellon Capital US Aggregate Bond Index.
Fees and Expenses
Investment Fee 0.88%
Operations and Management
Product Inception Date 10-01-09
Initial Inception Date 10-01-09
Management Company Callan Associates Inc
Volatility Analysis
Low Moderate High
Category
The volatility measure is not displayed for investments with
fewer than three years of history. The category average,
however, is shown above.
Best 3 Month Return Worst 3 Month Return
. .
NotesThe fund is designed to continue along the glidepath for an
additional 20 years beyond the target retirement date. The
average investment fee is for illustration purposes only and
has been constructed according to the target allocations of
each model. Actual investment fees accrue according to each
underlying offering's position each day. The investment fee
includes a 0.35% charge by United's retirement program
product.
Allocation of Stocks and Bonds
Performance
5
10
15
20
0
-5
-10
-15
Total Return%
as of 09-30-09
Investment
Benchmark
Average annual, if greater
than 1 year
YTD 1 Year 3 Year 5 Year 10 Year Since Inception
. . . . . . Fund Return %
. . . . . . Benchmark Return %
. . . . . . Category Average %................................................................................................................................................................................................................
. . . . . . Morningstar Rating™
. . . . . . # of Funds in Category
Returns shown represent past performance which cannot guarantee future results and are net of investment fees, but not
administrative fees. Your plan's specific returns may be lower. Also, current performance may be lower or higher than the
performance data quoted above. Fund values and investment returns will vary and principal value, when redeemed, may
be worth more or less than the original investment.
Contact your plan administrator or access your online account at getretirementright.com for your plan's returns
current to the most recent month-end. Consider the fund's investment objectives, risks, charges, and expenses before
investing.
Portfolio Analysis
Composition % Assets
Not Available
U.S. Stocks .Non-U.S. Stocks .Bonds .Cash .Other .
Morningstar Style Box™ as of 09-30-09 (EQ) ; 09-30-09 (F-I)
Not
Available
Not
Available
Top 10 Holdings % Assets
Not Available
Morningstar Sectors Fund%
h Information .............................................................................................................
r Software .
t Hardware .
y Media .
u Telecommunication .
j Service .............................................................................................................
i Healthcare Service .
o Consumer Service .
p Business Service .
a Financial Service .
k Manufacturing .............................................................................................................
s Consumer Goods .
d Industrial Materials .
f Energy .
g Utilities .
Release Date: 09-30-2009
AFN42012
09-09
©2009 Morningstar, Inc., Morningstar Investment Profiles™ 312-696-6000. All rights reserved. The information contained herein: (1) is proprietary to Morningstar and/orits content providers; (2) may not be copied or distributed and (3) is not warranted to be accurate, complete or timely. Neither Morningstar nor its content providers areresponsible for any damages or losses arising from any use of information. Past performance is no guarantee of future performance. Visit our investment website atwww.morningstar.com .
Page 1 of 2
42
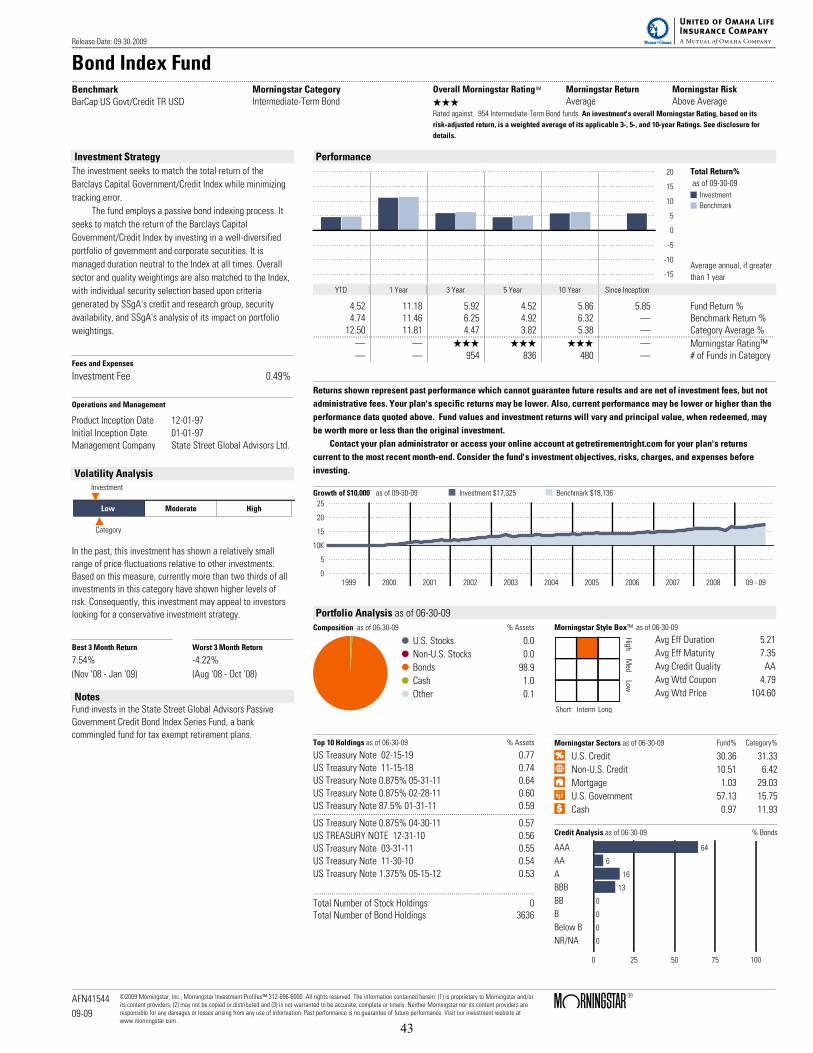
Bond Index Fund....................................................................................................................................................................................................................................................................................................................................................Benchmark
BarCap US Govt/Credit TR USD
Morningstar CategoryIntermediate-Term Bond
Overall Morningstar Rating™ Morningstar Return Morningstar Risk
QQQ Average Above AverageRated against 954 Intermediate-Term Bond funds. An investment's overall Morningstar Rating, based on its
risk-adjusted return, is a weighted average of its applicable 3-, 5-, and 10-year Ratings. See disclosure for
details.
Investment Strategy
The investment seeks to match the total return of the
Barclays Capital Government/Credit Index while minimizing
tracking error.
The fund employs a passive bond indexing process. It
seeks to match the return of the Barclays Capital
Government/Credit Index by investing in a well-diversified
portfolio of government and corporate securities. It is
managed duration neutral to the Index at all times. Overall
sector and quality weightings are also matched to the Index,
with individual security selection based upon criteria
generated by SSgA's credit and research group, security
availability, and SSgA's analysis of its impact on portfolio
weightings.
Fees and Expenses
Investment Fee 0.49%
Operations and Management
Product Inception Date 12-01-97
Initial Inception Date 01-01-97
Management Company State Street Global Advisors Ltd.
Volatility Analysis
Low Moderate High
Investment
Category
In the past, this investment has shown a relatively small
range of price fluctuations relative to other investments.
Based on this measure, currently more than two thirds of all
investments in this category have shown higher levels of
risk. Consequently, this investment may appeal to investors
looking for a conservative investment strategy.
Best 3 Month Return Worst 3 Month Return
7.54% -4.22%
(Nov '08 - Jan '09) (Aug '08 - Oct '08)
NotesFund invests in the State Street Global Advisors Passive
Government Credit Bond Index Series Fund, a bank
commingled fund for tax exempt retirement plans.
Performance
5
10
15
20
0
-5
-10
-15
Total Return%
as of 09-30-09
Investment
Benchmark
Average annual, if greater
than 1 year
YTD 1 Year 3 Year 5 Year 10 Year Since Inception
4.52 11.18 5.92 4.52 5.86 5.85 Fund Return %4.74 11.46 6.25 4.92 6.32 . Benchmark Return %
12.50 11.81 4.47 3.82 5.38 . Category Average %................................................................................................................................................................................................................. . QQQ QQQ QQQ . Morningstar Rating™. . 954 836 480 . # of Funds in Category
Returns shown represent past performance which cannot guarantee future results and are net of investment fees, but not
administrative fees. Your plan's specific returns may be lower. Also, current performance may be lower or higher than the
performance data quoted above. Fund values and investment returns will vary and principal value, when redeemed, may
be worth more or less than the original investment.
Contact your plan administrator or access your online account at getretirementright.com for your plan's returns
current to the most recent month-end. Consider the fund's investment objectives, risks, charges, and expenses before
investing.
Growth of $10,000 as of 09-30-09 Investment $17,325 Benchmark $18,136
1999 2000 2001 2002 2003 2004 2005 2006 2007 2008 09 - 09
25
20
15
5
0
10K
Portfolio Analysis as of 06-30-09
Composition as of 06-30-09 % Assets
U.S. Stocks 0.0
Non-U.S. Stocks 0.0
Bonds 98.9
Cash 1.0
Other 0.1
Morningstar Style Box™ as of 06-30-09
High
Med
Low
Short Interm Long
Avg Eff Duration 5.21
Avg Eff Maturity 7.35
Avg Credit Quality AA
Avg Wtd Coupon 4.79
Avg Wtd Price 104.60
Top 10 Holdings as of 06-30-09 % Assets
US Treasury Note 02-15-19 0.77
US Treasury Note 11-15-18 0.74
US Treasury Note 0.875% 05-31-11 0.64
US Treasury Note 0.875% 02-28-11 0.60
US Treasury Note 87.5% 01-31-11 0.59...........................................................................................................
US Treasury Note 0.875% 04-30-11 0.57
US TREASURY NOTE 12-31-10 0.56
US Treasury Note 03-31-11 0.55
US Treasury Note 11-30-10 0.54
US Treasury Note 1.375% 05-15-12 0.53
...........................................................................................................
Total Number of Stock Holdings 0Total Number of Bond Holdings 3636
Morningstar Sectors as of 06-30-09 Fund% Category%
U.S. Credit 30.36 31.33
Non-U.S. Credit 10.51 6.42
Mortgage 1.03 29.03
U.S. Government 57.13 15.75
Cash 0.97 11.93
Credit Analysis as of 06-30-09 % Bonds
AAA 64
AA 6
A 16
BBB 13
BB 0
B 0
Below B 0
NR/NA 0
0 25 50 75 100
Release Date: 09-30-2009
AFN41544
09-09
©2009 Morningstar, Inc., Morningstar Investment Profiles™ 312-696-6000. All rights reserved. The information contained herein: (1) is proprietary to Morningstar and/orits content providers; (2) may not be copied or distributed and (3) is not warranted to be accurate, complete or timely. Neither Morningstar nor its content providers areresponsible for any damages or losses arising from any use of information. Past performance is no guarantee of future performance. Visit our investment website atwww.morningstar.com .
Page 1 of 2
43
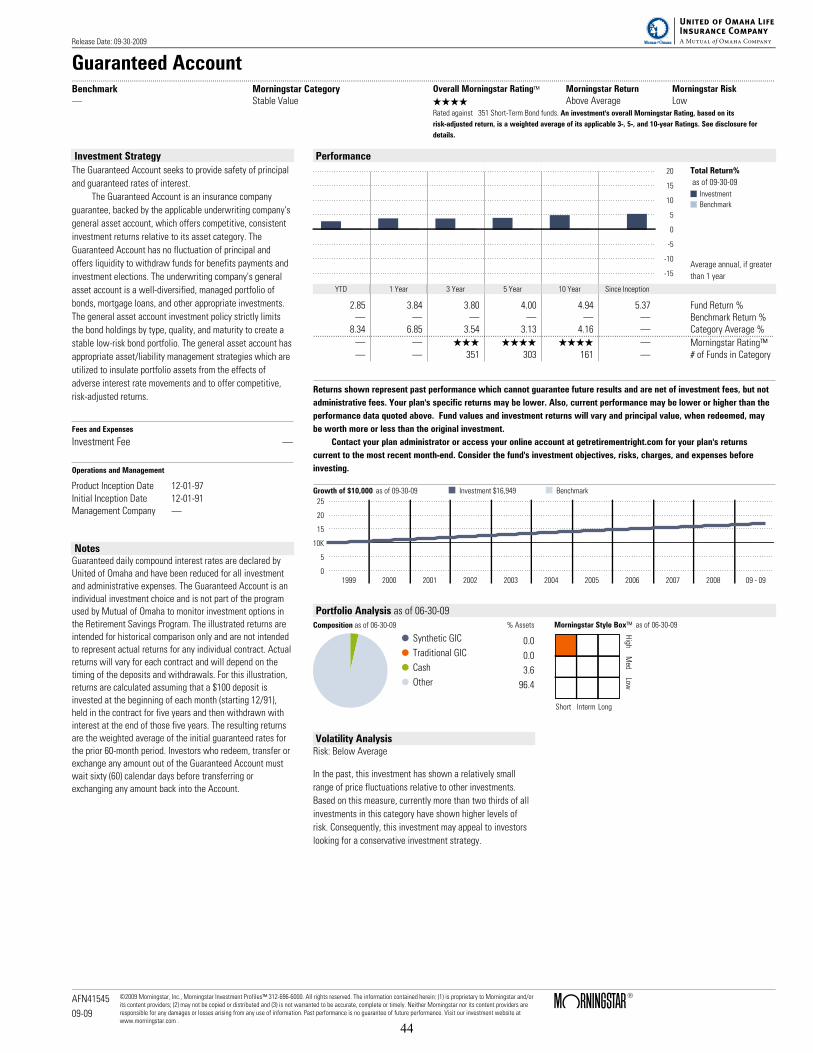
Guaranteed Account....................................................................................................................................................................................................................................................................................................................................................Benchmark.
Morningstar CategoryStable Value
Overall Morningstar Rating™ Morningstar Return Morningstar Risk
QQQQ Above Average LowRated against 351 Short-Term Bond funds. An investment's overall Morningstar Rating, based on its
risk-adjusted return, is a weighted average of its applicable 3-, 5-, and 10-year Ratings. See disclosure for
details.
Investment Strategy
The Guaranteed Account seeks to provide safety of principal
and guaranteed rates of interest.
The Guaranteed Account is an insurance company
guarantee, backed by the applicable underwriting company's
general asset account, which offers competitive, consistent
investment returns relative to its asset category. The
Guaranteed Account has no fluctuation of principal and
offers liquidity to withdraw funds for benefits payments and
investment elections. The underwriting company's general
asset account is a well-diversified, managed portfolio of
bonds, mortgage loans, and other appropriate investments.
The general asset account investment policy strictly limits
the bond holdings by type, quality, and maturity to create a
stable low-risk bond portfolio. The general asset account has
appropriate asset/liability management strategies which are
utilized to insulate portfolio assets from the effects of
adverse interest rate movements and to offer competitive,
risk-adjusted returns.
Fees and Expenses
Investment Fee .
Operations and Management
Product Inception Date 12-01-97Initial Inception Date 12-01-91Management Company .
NotesGuaranteed daily compound interest rates are declared byUnited of Omaha and have been reduced for all investmentand administrative expenses. The Guaranteed Account is anindividual investment choice and is not part of the programused by Mutual of Omaha to monitor investment options inthe Retirement Savings Program. The illustrated returns areintended for historical comparison only and are not intendedto represent actual returns for any individual contract. Actualreturns will vary for each contract and will depend on thetiming of the deposits and withdrawals. For this illustration,returns are calculated assuming that a $100 deposit isinvested at the beginning of each month (starting 12/91),held in the contract for five years and then withdrawn withinterest at the end of those five years. The resulting returnsare the weighted average of the initial guaranteed rates forthe prior 60-month period. Investors who redeem, transfer orexchange any amount out of the Guaranteed Account mustwait sixty (60) calendar days before transferring orexchanging any amount back into the Account.
Performance
5
10
15
20
0
-5
-10
-15
Total Return%
as of 09-30-09
Investment
Benchmark
Average annual, if greater
than 1 year
YTD 1 Year 3 Year 5 Year 10 Year Since Inception
2.85 3.84 3.80 4.00 4.94 5.37 Fund Return %. . . . . . Benchmark Return %
8.34 6.85 3.54 3.13 4.16 . Category Average %................................................................................................................................................................................................................. . QQQ QQQQ QQQQ . Morningstar Rating™. . 351 303 161 . # of Funds in Category
Returns shown represent past performance which cannot guarantee future results and are net of investment fees, but not
administrative fees. Your plan's specific returns may be lower. Also, current performance may be lower or higher than the
performance data quoted above. Fund values and investment returns will vary and principal value, when redeemed, may
be worth more or less than the original investment.
Contact your plan administrator or access your online account at getretirementright.com for your plan's returns
current to the most recent month-end. Consider the fund's investment objectives, risks, charges, and expenses before
investing.
Growth of $10,000 as of 09-30-09 Investment $16,949 Benchmark
1999 2000 2001 2002 2003 2004 2005 2006 2007 2008 09 - 09
25
20
15
5
0
10K
Portfolio Analysis as of 06-30-09Composition as of 06-30-09 % Assets
Synthetic GIC 0.0Traditional GIC 0.0Cash 3.6Other 96.4
Morningstar Style Box™ as of 06-30-09
High
Med
Low
Short Interm Long
Volatility AnalysisRisk: Below Average
In the past, this investment has shown a relatively small
range of price fluctuations relative to other investments.
Based on this measure, currently more than two thirds of all
investments in this category have shown higher levels of
risk. Consequently, this investment may appeal to investors
looking for a conservative investment strategy.
Release Date: 09-30-2009
AFN41545
09-09
©2009 Morningstar, Inc., Morningstar Investment Profiles™ 312-696-6000. All rights reserved. The information contained herein: (1) is proprietary to Morningstar and/orits content providers; (2) may not be copied or distributed and (3) is not warranted to be accurate, complete or timely. Neither Morningstar nor its content providers areresponsible for any damages or losses arising from any use of information. Past performance is no guarantee of future performance. Visit our investment website atwww.morningstar.com .
Page 1 of 2
44
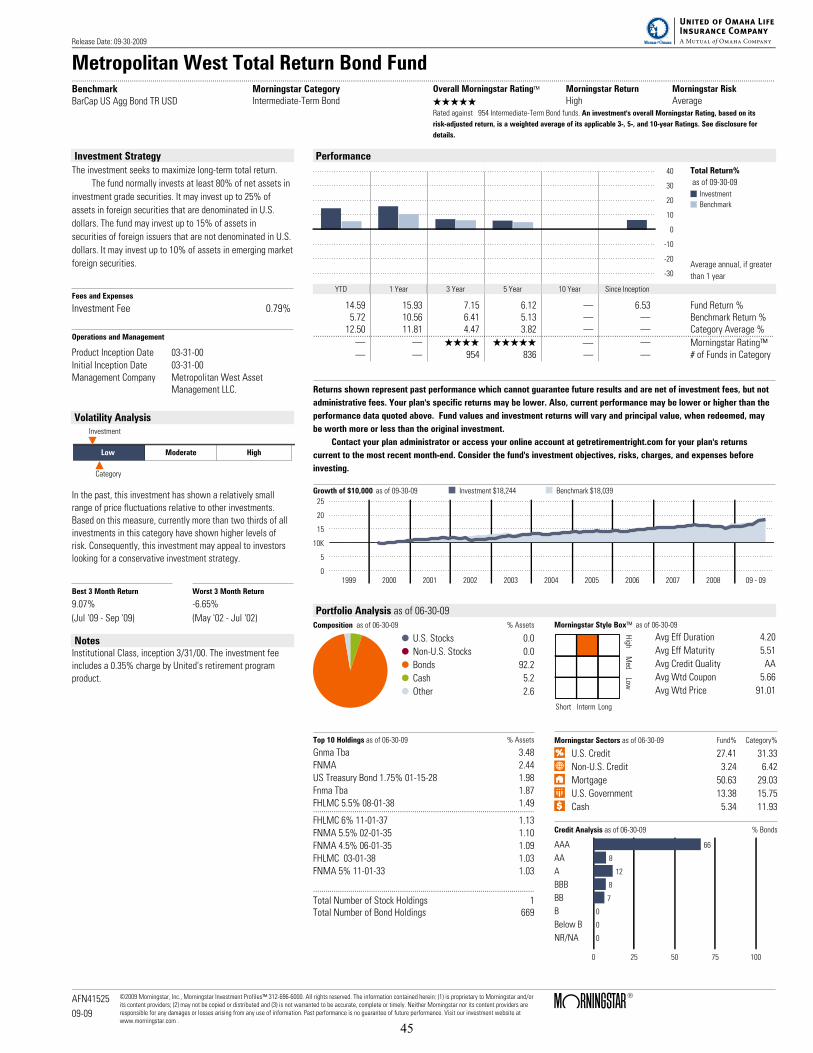
Metropolitan West Total Return Bond Fund....................................................................................................................................................................................................................................................................................................................................................Benchmark
BarCap US Agg Bond TR USD
Morningstar CategoryIntermediate-Term Bond
Overall Morningstar Rating™ Morningstar Return Morningstar Risk
QQQQQ High AverageRated against 954 Intermediate-Term Bond funds. An investment's overall Morningstar Rating, based on its
risk-adjusted return, is a weighted average of its applicable 3-, 5-, and 10-year Ratings. See disclosure for
details.
Investment Strategy
The investment seeks to maximize long-term total return.
The fund normally invests at least 80% of net assets in
investment grade securities. It may invest up to 25% of
assets in foreign securities that are denominated in U.S.
dollars. The fund may invest up to 15% of assets in
securities of foreign issuers that are not denominated in U.S.
dollars. It may invest up to 10% of assets in emerging market
foreign securities.
Fees and Expenses
Investment Fee 0.79%
Operations and Management
Product Inception Date 03-31-00
Initial Inception Date 03-31-00
Management Company Metropolitan West AssetManagement LLC.
Volatility Analysis
Low Moderate High
Investment
Category
In the past, this investment has shown a relatively small
range of price fluctuations relative to other investments.
Based on this measure, currently more than two thirds of all
investments in this category have shown higher levels of
risk. Consequently, this investment may appeal to investors
looking for a conservative investment strategy.
Best 3 Month Return Worst 3 Month Return
9.07% -6.65%
(Jul '09 - Sep '09) (May '02 - Jul '02)
NotesInstitutional Class, inception 3/31/00. The investment fee
includes a 0.35% charge by United's retirement program
product.
Performance
10
20
30
40
0
-10
-20
-30
Total Return%
as of 09-30-09
Investment
Benchmark
Average annual, if greater
than 1 year
YTD 1 Year 3 Year 5 Year 10 Year Since Inception
14.59 15.93 7.15 6.12 . 6.53 Fund Return %5.72 10.56 6.41 5.13 . . Benchmark Return %
12.50 11.81 4.47 3.82 . . Category Average %................................................................................................................................................................................................................. . QQQQ QQQQQ . . Morningstar Rating™. . 954 836 . . # of Funds in Category
Returns shown represent past performance which cannot guarantee future results and are net of investment fees, but not
administrative fees. Your plan's specific returns may be lower. Also, current performance may be lower or higher than the
performance data quoted above. Fund values and investment returns will vary and principal value, when redeemed, may
be worth more or less than the original investment.
Contact your plan administrator or access your online account at getretirementright.com for your plan's returns
current to the most recent month-end. Consider the fund's investment objectives, risks, charges, and expenses before
investing.
Growth of $10,000 as of 09-30-09 Investment $18,244 Benchmark $18,039
1999 2000 2001 2002 2003 2004 2005 2006 2007 2008 09 - 09
25
20
15
5
0
10K
Portfolio Analysis as of 06-30-09
Composition as of 06-30-09 % Assets
U.S. Stocks 0.0
Non-U.S. Stocks 0.0
Bonds 92.2
Cash 5.2
Other 2.6
Morningstar Style Box™ as of 06-30-09
High
Med
Low
Short Interm Long
Avg Eff Duration 4.20
Avg Eff Maturity 5.51
Avg Credit Quality AA
Avg Wtd Coupon 5.66
Avg Wtd Price 91.01
Top 10 Holdings as of 06-30-09 % Assets
Gnma Tba 3.48
FNMA 2.44
US Treasury Bond 1.75% 01-15-28 1.98
Fnma Tba 1.87
FHLMC 5.5% 08-01-38 1.49...........................................................................................................
FHLMC 6% 11-01-37 1.13
FNMA 5.5% 02-01-35 1.10
FNMA 4.5% 06-01-35 1.09
FHLMC 03-01-38 1.03
FNMA 5% 11-01-33 1.03
...........................................................................................................
Total Number of Stock Holdings 1Total Number of Bond Holdings 669
Morningstar Sectors as of 06-30-09 Fund% Category%
U.S. Credit 27.41 31.33
Non-U.S. Credit 3.24 6.42
Mortgage 50.63 29.03
U.S. Government 13.38 15.75
Cash 5.34 11.93
Credit Analysis as of 06-30-09 % Bonds
AAA 66
AA 8
A 12
BBB 8
BB 7
B 0
Below B 0
NR/NA 0
0 25 50 75 100
Release Date: 09-30-2009
AFN41525
09-09
©2009 Morningstar, Inc., Morningstar Investment Profiles™ 312-696-6000. All rights reserved. The information contained herein: (1) is proprietary to Morningstar and/orits content providers; (2) may not be copied or distributed and (3) is not warranted to be accurate, complete or timely. Neither Morningstar nor its content providers areresponsible for any damages or losses arising from any use of information. Past performance is no guarantee of future performance. Visit our investment website atwww.morningstar.com .
Page 1 of 2
45
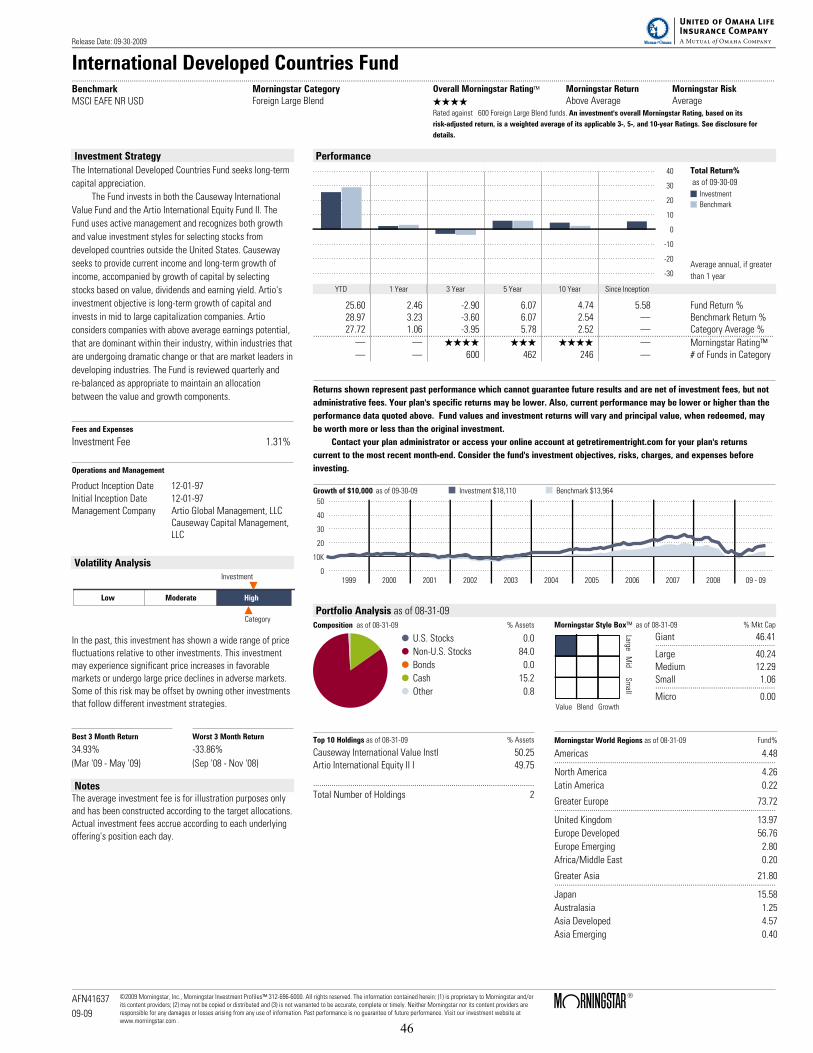
International Developed Countries Fund....................................................................................................................................................................................................................................................................................................................................................BenchmarkMSCI EAFE NR USD
Morningstar CategoryForeign Large Blend
Overall Morningstar Rating™ Morningstar Return Morningstar Risk
QQQQ Above Average AverageRated against 600 Foreign Large Blend funds. An investment's overall Morningstar Rating, based on its
risk-adjusted return, is a weighted average of its applicable 3-, 5-, and 10-year Ratings. See disclosure for
details.
Investment Strategy
The International Developed Countries Fund seeks long-term
capital appreciation.
The Fund invests in both the Causeway International
Value Fund and the Artio International Equity Fund II. The
Fund uses active management and recognizes both growth
and value investment styles for selecting stocks from
developed countries outside the United States. Causeway
seeks to provide current income and long-term growth of
income, accompanied by growth of capital by selecting
stocks based on value, dividends and earning yield. Artio's
investment objective is long-term growth of capital and
invests in mid to large capitalization companies. Artio
considers companies with above average earnings potential,
that are dominant within their industry, within industries that
are undergoing dramatic change or that are market leaders in
developing industries. The Fund is reviewed quarterly and
re-balanced as appropriate to maintain an allocation
between the value and growth components.
Fees and Expenses
Investment Fee 1.31%
Operations and Management
Product Inception Date 12-01-97Initial Inception Date 12-01-97Management Company Artio Global Management, LLC
Causeway Capital Management,LLC
Volatility Analysis
Low Moderate High
Investment
Category
In the past, this investment has shown a wide range of pricefluctuations relative to other investments. This investmentmay experience significant price increases in favorablemarkets or undergo large price declines in adverse markets.Some of this risk may be offset by owning other investmentsthat follow different investment strategies.
Best 3 Month Return Worst 3 Month Return
34.93% -33.86%
(Mar '09 - May '09) (Sep '08 - Nov '08)
NotesThe average investment fee is for illustration purposes onlyand has been constructed according to the target allocations.Actual investment fees accrue according to each underlyingoffering's position each day.
Performance
10
20
30
40
0
-10
-20
-30
Total Return%
as of 09-30-09
Investment
Benchmark
Average annual, if greater
than 1 year
YTD 1 Year 3 Year 5 Year 10 Year Since Inception
25.60 2.46 -2.90 6.07 4.74 5.58 Fund Return %28.97 3.23 -3.60 6.07 2.54 . Benchmark Return %27.72 1.06 -3.95 5.78 2.52 . Category Average %................................................................................................................................................................................................................. . QQQQ QQQ QQQQ . Morningstar Rating™. . 600 462 246 . # of Funds in Category
Returns shown represent past performance which cannot guarantee future results and are net of investment fees, but not
administrative fees. Your plan's specific returns may be lower. Also, current performance may be lower or higher than the
performance data quoted above. Fund values and investment returns will vary and principal value, when redeemed, may
be worth more or less than the original investment.
Contact your plan administrator or access your online account at getretirementright.com for your plan's returns
current to the most recent month-end. Consider the fund's investment objectives, risks, charges, and expenses before
investing.
Growth of $10,000 as of 09-30-09 Investment $18,110 Benchmark $13,964
1999 2000 2001 2002 2003 2004 2005 2006 2007 2008 09 - 09
50
40
30
20
0
10K
Portfolio Analysis as of 08-31-09Composition as of 08-31-09 % Assets
U.S. Stocks 0.0
Non-U.S. Stocks 84.0
Bonds 0.0
Cash 15.2
Other 0.8
Morningstar Style Box™ as of 08-31-09 % Mkt Cap
LargeM
idSm
all
Value Blend Growth
Giant 46.41..........................................................Large 40.24Medium 12.29Small 1.06..........................................................Micro 0.00
Top 10 Holdings as of 08-31-09 % Assets
Causeway International Value Instl 50.25Artio International Equity II I 49.75
...........................................................................................................
Total Number of Holdings 2
Morningstar World Regions as of 08-31-09 Fund%
Americas 4.48...........................................................................................................
North America 4.26
Latin America 0.22
Greater Europe 73.72...........................................................................................................
United Kingdom 13.97
Europe Developed 56.76
Europe Emerging 2.80
Africa/Middle East 0.20
Greater Asia 21.80...........................................................................................................
Japan 15.58
Australasia 1.25
Asia Developed 4.57
Asia Emerging 0.40
Release Date: 09-30-2009
AFN41637
09-09
©2009 Morningstar, Inc., Morningstar Investment Profiles™ 312-696-6000. All rights reserved. The information contained herein: (1) is proprietary to Morningstar and/orits content providers; (2) may not be copied or distributed and (3) is not warranted to be accurate, complete or timely. Neither Morningstar nor its content providers areresponsible for any damages or losses arising from any use of information. Past performance is no guarantee of future performance. Visit our investment website atwww.morningstar.com .
Page 1 of 2
46
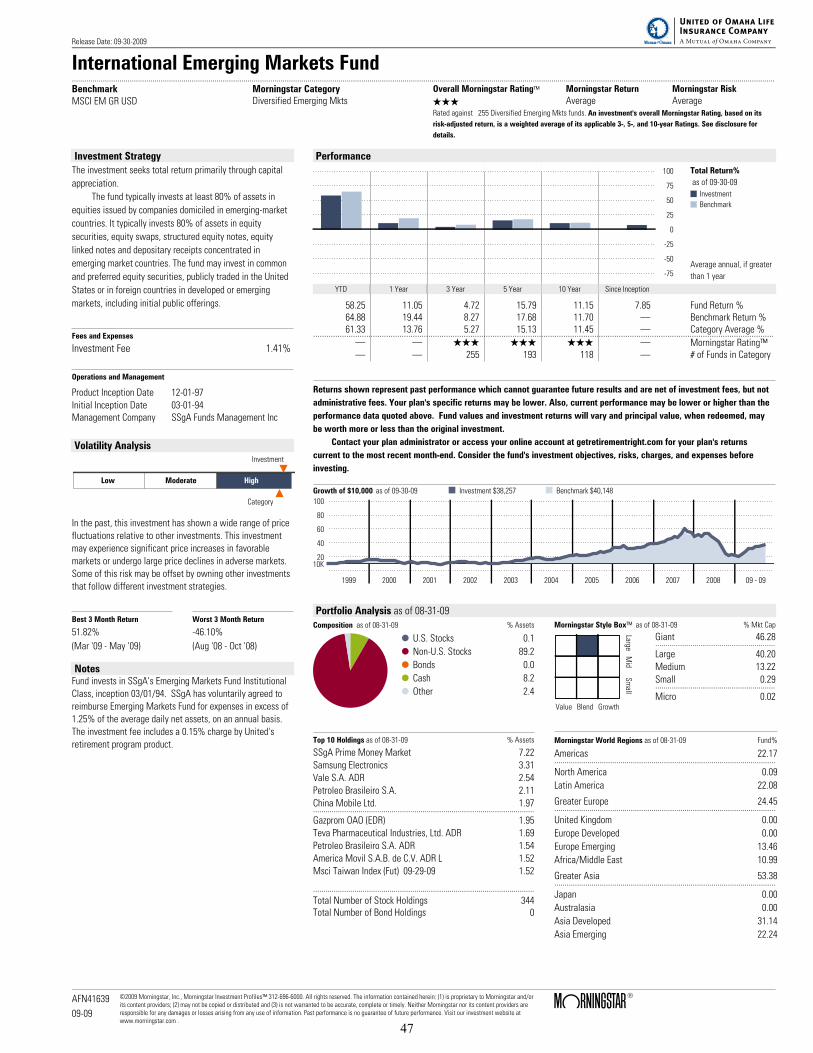
International Emerging Markets Fund....................................................................................................................................................................................................................................................................................................................................................Benchmark
MSCI EM GR USD
Morningstar CategoryDiversified Emerging Mkts
Overall Morningstar Rating™ Morningstar Return Morningstar Risk
QQQ Average AverageRated against 255 Diversified Emerging Mkts funds. An investment's overall Morningstar Rating, based on its
risk-adjusted return, is a weighted average of its applicable 3-, 5-, and 10-year Ratings. See disclosure for
details.
Investment Strategy
The investment seeks total return primarily through capital
appreciation.
The fund typically invests at least 80% of assets in
equities issued by companies domiciled in emerging-market
countries. It typically invests 80% of assets in equity
securities, equity swaps, structured equity notes, equity
linked notes and depositary receipts concentrated in
emerging market countries. The fund may invest in common
and preferred equity securities, publicly traded in the United
States or in foreign countries in developed or emerging
markets, including initial public offerings.
Fees and Expenses
Investment Fee 1.41%
Operations and Management
Product Inception Date 12-01-97
Initial Inception Date 03-01-94
Management Company SSgA Funds Management Inc
Volatility Analysis
Low Moderate High
Investment
Category
In the past, this investment has shown a wide range of price
fluctuations relative to other investments. This investment
may experience significant price increases in favorable
markets or undergo large price declines in adverse markets.
Some of this risk may be offset by owning other investments
that follow different investment strategies.
Best 3 Month Return Worst 3 Month Return
51.82% -46.10%
(Mar '09 - May '09) (Aug '08 - Oct '08)
NotesFund invests in SSgA's Emerging Markets Fund Institutional
Class, inception 03/01/94. SSgA has voluntarily agreed to
reimburse Emerging Markets Fund for expenses in excess of
1.25% of the average daily net assets, on an annual basis.
The investment fee includes a 0.15% charge by United's
retirement program product.
Performance
25
50
75
100
0
-25
-50
-75
Total Return%
as of 09-30-09
Investment
Benchmark
Average annual, if greater
than 1 year
YTD 1 Year 3 Year 5 Year 10 Year Since Inception
58.25 11.05 4.72 15.79 11.15 7.85 Fund Return %64.88 19.44 8.27 17.68 11.70 . Benchmark Return %61.33 13.76 5.27 15.13 11.45 . Category Average %................................................................................................................................................................................................................. . QQQ QQQ QQQ . Morningstar Rating™. . 255 193 118 . # of Funds in Category
Returns shown represent past performance which cannot guarantee future results and are net of investment fees, but not
administrative fees. Your plan's specific returns may be lower. Also, current performance may be lower or higher than the
performance data quoted above. Fund values and investment returns will vary and principal value, when redeemed, may
be worth more or less than the original investment.
Contact your plan administrator or access your online account at getretirementright.com for your plan's returns
current to the most recent month-end. Consider the fund's investment objectives, risks, charges, and expenses before
investing.
Growth of $10,000 as of 09-30-09 Investment $38,257 Benchmark $40,148
1999 2000 2001 2002 2003 2004 2005 2006 2007 2008 09 - 09
100
80
60
40
2010K
Portfolio Analysis as of 08-31-09
Composition as of 08-31-09 % Assets
U.S. Stocks 0.1
Non-U.S. Stocks 89.2
Bonds 0.0
Cash 8.2
Other 2.4
Morningstar Style Box™ as of 08-31-09 % Mkt Cap
LargeM
idS
mall
Value Blend Growth
Giant 46.28..........................................................
Large 40.20
Medium 13.22
Small 0.29..........................................................
Micro 0.02
Top 10 Holdings as of 08-31-09 % Assets
SSgA Prime Money Market 7.22
Samsung Electronics 3.31
Vale S.A. ADR 2.54
Petroleo Brasileiro S.A. 2.11
China Mobile Ltd. 1.97...........................................................................................................
Gazprom OAO (EDR) 1.95
Teva Pharmaceutical Industries, Ltd. ADR 1.69
Petroleo Brasileiro S.A. ADR 1.54
America Movil S.A.B. de C.V. ADR L 1.52
Msci Taiwan Index (Fut) 09-29-09 1.52
...........................................................................................................
Total Number of Stock Holdings 344Total Number of Bond Holdings 0
Morningstar World Regions as of 08-31-09 Fund%
Americas 22.17...........................................................................................................
North America 0.09
Latin America 22.08
Greater Europe 24.45...........................................................................................................
United Kingdom 0.00
Europe Developed 0.00
Europe Emerging 13.46
Africa/Middle East 10.99
Greater Asia 53.38...........................................................................................................
Japan 0.00
Australasia 0.00
Asia Developed 31.14
Asia Emerging 22.24
Release Date: 09-30-2009
AFN41639
09-09
©2009 Morningstar, Inc., Morningstar Investment Profiles™ 312-696-6000. All rights reserved. The information contained herein: (1) is proprietary to Morningstar and/orits content providers; (2) may not be copied or distributed and (3) is not warranted to be accurate, complete or timely. Neither Morningstar nor its content providers areresponsible for any damages or losses arising from any use of information. Past performance is no guarantee of future performance. Visit our investment website atwww.morningstar.com .
Page 1 of 2
47
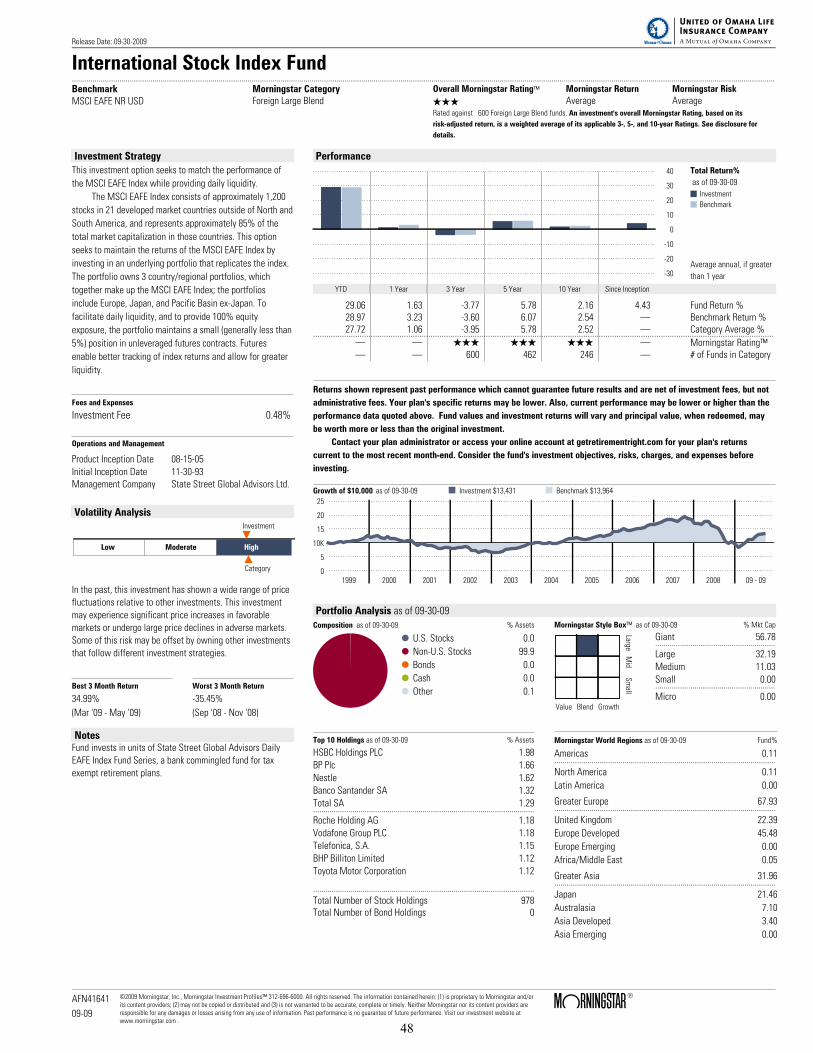
International Stock Index Fund....................................................................................................................................................................................................................................................................................................................................................BenchmarkMSCI EAFE NR USD
Morningstar CategoryForeign Large Blend
Overall Morningstar Rating™ Morningstar Return Morningstar Risk
QQQ Average AverageRated against 600 Foreign Large Blend funds. An investment's overall Morningstar Rating, based on its
risk-adjusted return, is a weighted average of its applicable 3-, 5-, and 10-year Ratings. See disclosure for
details.
Investment Strategy
This investment option seeks to match the performance of
the MSCI EAFE Index while providing daily liquidity.
The MSCI EAFE Index consists of approximately 1,200
stocks in 21 developed market countries outside of North and
South America, and represents approximately 85% of the
total market capitalization in those countries. This option
seeks to maintain the returns of the MSCI EAFE Index by
investing in an underlying portfolio that replicates the index.
The portfolio owns 3 country/regional portfolios, which
together make up the MSCI EAFE Index; the portfolios
include Europe, Japan, and Pacific Basin ex-Japan. To
facilitate daily liquidity, and to provide 100% equity
exposure, the portfolio maintains a small (generally less than
5%) position in unleveraged futures contracts. Futures
enable better tracking of index returns and allow for greater
liquidity.
Fees and Expenses
Investment Fee 0.48%
Operations and Management
Product Inception Date 08-15-05Initial Inception Date 11-30-93Management Company State Street Global Advisors Ltd.
Volatility Analysis
Low Moderate High
Investment
Category
In the past, this investment has shown a wide range of pricefluctuations relative to other investments. This investmentmay experience significant price increases in favorablemarkets or undergo large price declines in adverse markets.Some of this risk may be offset by owning other investmentsthat follow different investment strategies.
Best 3 Month Return Worst 3 Month Return
34.99% -35.45%
(Mar '09 - May '09) (Sep '08 - Nov '08)
NotesFund invests in units of State Street Global Advisors DailyEAFE Index Fund Series, a bank commingled fund for taxexempt retirement plans.
Performance
10
20
30
40
0
-10
-20
-30
Total Return%
as of 09-30-09
Investment
Benchmark
Average annual, if greater
than 1 year
YTD 1 Year 3 Year 5 Year 10 Year Since Inception
29.06 1.63 -3.77 5.78 2.16 4.43 Fund Return %28.97 3.23 -3.60 6.07 2.54 . Benchmark Return %27.72 1.06 -3.95 5.78 2.52 . Category Average %................................................................................................................................................................................................................. . QQQ QQQ QQQ . Morningstar Rating™. . 600 462 246 . # of Funds in Category
Returns shown represent past performance which cannot guarantee future results and are net of investment fees, but not
administrative fees. Your plan's specific returns may be lower. Also, current performance may be lower or higher than the
performance data quoted above. Fund values and investment returns will vary and principal value, when redeemed, may
be worth more or less than the original investment.
Contact your plan administrator or access your online account at getretirementright.com for your plan's returns
current to the most recent month-end. Consider the fund's investment objectives, risks, charges, and expenses before
investing.
Growth of $10,000 as of 09-30-09 Investment $13,431 Benchmark $13,964
1999 2000 2001 2002 2003 2004 2005 2006 2007 2008 09 - 09
25
20
15
5
0
10K
Portfolio Analysis as of 09-30-09Composition as of 09-30-09 % Assets
U.S. Stocks 0.0
Non-U.S. Stocks 99.9
Bonds 0.0
Cash 0.0
Other 0.1
Morningstar Style Box™ as of 09-30-09 % Mkt Cap
LargeM
idSm
all
Value Blend Growth
Giant 56.78..........................................................Large 32.19Medium 11.03Small 0.00..........................................................Micro 0.00
Top 10 Holdings as of 09-30-09 % Assets
HSBC Holdings PLC 1.98BP Plc 1.66Nestle 1.62Banco Santander SA 1.32Total SA 1.29...........................................................................................................Roche Holding AG 1.18Vodafone Group PLC 1.18Telefonica, S.A. 1.15BHP Billiton Limited 1.12Toyota Motor Corporation 1.12
...........................................................................................................
Total Number of Stock Holdings 978Total Number of Bond Holdings 0
Morningstar World Regions as of 09-30-09 Fund%
Americas 0.11...........................................................................................................
North America 0.11
Latin America 0.00
Greater Europe 67.93...........................................................................................................
United Kingdom 22.39
Europe Developed 45.48
Europe Emerging 0.00
Africa/Middle East 0.05
Greater Asia 31.96...........................................................................................................
Japan 21.46
Australasia 7.10
Asia Developed 3.40
Asia Emerging 0.00
Release Date: 09-30-2009
AFN41641
09-09
©2009 Morningstar, Inc., Morningstar Investment Profiles™ 312-696-6000. All rights reserved. The information contained herein: (1) is proprietary to Morningstar and/orits content providers; (2) may not be copied or distributed and (3) is not warranted to be accurate, complete or timely. Neither Morningstar nor its content providers areresponsible for any damages or losses arising from any use of information. Past performance is no guarantee of future performance. Visit our investment website atwww.morningstar.com .
Page 1 of 2
48
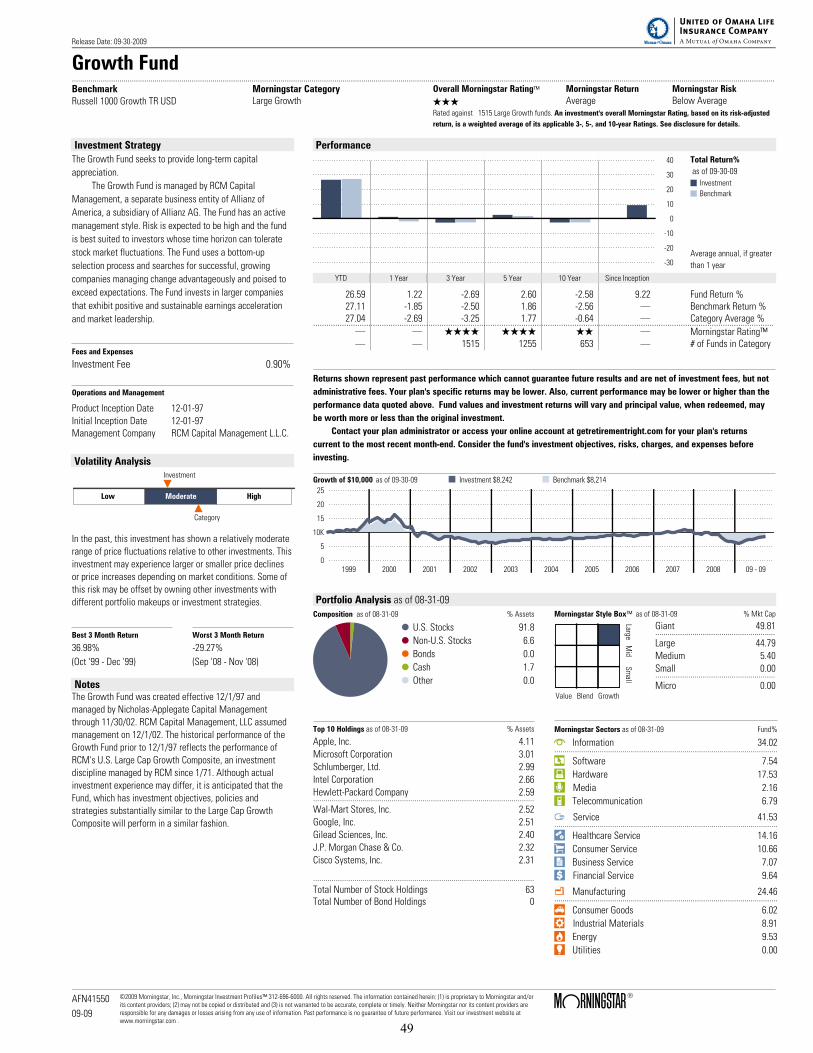
Growth Fund....................................................................................................................................................................................................................................................................................................................................................BenchmarkRussell 1000 Growth TR USD
Morningstar CategoryLarge Growth
Overall Morningstar Rating™ Morningstar Return Morningstar Risk
QQQ Average Below AverageRated against 1515 Large Growth funds. An investment's overall Morningstar Rating, based on its risk-adjusted
return, is a weighted average of its applicable 3-, 5-, and 10-year Ratings. See disclosure for details.
Investment Strategy
The Growth Fund seeks to provide long-term capital
appreciation.
The Growth Fund is managed by RCM Capital
Management, a separate business entity of Allianz of
America, a subsidiary of Allianz AG. The Fund has an active
management style. Risk is expected to be high and the fund
is best suited to investors whose time horizon can tolerate
stock market fluctuations. The Fund uses a bottom-up
selection process and searches for successful, growing
companies managing change advantageously and poised to
exceed expectations. The Fund invests in larger companies
that exhibit positive and sustainable earnings acceleration
and market leadership.
Fees and Expenses
Investment Fee 0.90%
Operations and Management
Product Inception Date 12-01-97Initial Inception Date 12-01-97Management Company RCM Capital Management L.L.C.
Volatility Analysis
Low Moderate High
Investment
Category
In the past, this investment has shown a relatively moderaterange of price fluctuations relative to other investments. Thisinvestment may experience larger or smaller price declinesor price increases depending on market conditions. Some ofthis risk may be offset by owning other investments withdifferent portfolio makeups or investment strategies.
Best 3 Month Return Worst 3 Month Return
36.98% -29.27%
(Oct '99 - Dec '99) (Sep '08 - Nov '08)
NotesThe Growth Fund was created effective 12/1/97 andmanaged by Nicholas-Applegate Capital Managementthrough 11/30/02. RCM Capital Management, LLC assumedmanagement on 12/1/02. The historical performance of theGrowth Fund prior to 12/1/97 reflects the performance ofRCM's U.S. Large Cap Growth Composite, an investmentdiscipline managed by RCM since 1/71. Although actualinvestment experience may differ, it is anticipated that theFund, which has investment objectives, policies andstrategies substantially similar to the Large Cap GrowthComposite will perform in a similar fashion.
Performance
10
20
30
40
0
-10
-20
-30
Total Return%
as of 09-30-09
Investment
Benchmark
Average annual, if greater
than 1 year
YTD 1 Year 3 Year 5 Year 10 Year Since Inception
26.59 1.22 -2.69 2.60 -2.58 9.22 Fund Return %27.11 -1.85 -2.50 1.86 -2.56 . Benchmark Return %27.04 -2.69 -3.25 1.77 -0.64 . Category Average %................................................................................................................................................................................................................. . QQQQ QQQQ QQ . Morningstar Rating™. . 1515 1255 653 . # of Funds in Category
Returns shown represent past performance which cannot guarantee future results and are net of investment fees, but not
administrative fees. Your plan's specific returns may be lower. Also, current performance may be lower or higher than the
performance data quoted above. Fund values and investment returns will vary and principal value, when redeemed, may
be worth more or less than the original investment.
Contact your plan administrator or access your online account at getretirementright.com for your plan's returns
current to the most recent month-end. Consider the fund's investment objectives, risks, charges, and expenses before
investing.
Growth of $10,000 as of 09-30-09 Investment $8,242 Benchmark $8,214
1999 2000 2001 2002 2003 2004 2005 2006 2007 2008 09 - 09
25
20
15
5
0
10K
Portfolio Analysis as of 08-31-09Composition as of 08-31-09 % Assets
U.S. Stocks 91.8
Non-U.S. Stocks 6.6
Bonds 0.0
Cash 1.7
Other 0.0
Morningstar Style Box™ as of 08-31-09 % Mkt Cap
LargeM
idSm
all
Value Blend Growth
Giant 49.81..........................................................Large 44.79Medium 5.40Small 0.00..........................................................Micro 0.00
Top 10 Holdings as of 08-31-09 % Assets
Apple, Inc. 4.11Microsoft Corporation 3.01Schlumberger, Ltd. 2.99Intel Corporation 2.66Hewlett-Packard Company 2.59...........................................................................................................Wal-Mart Stores, Inc. 2.52Google, Inc. 2.51Gilead Sciences, Inc. 2.40J.P. Morgan Chase & Co. 2.32Cisco Systems, Inc. 2.31
...........................................................................................................
Total Number of Stock Holdings 63Total Number of Bond Holdings 0
Morningstar Sectors as of 08-31-09 Fund%
h Information 34.02............................................................................................................
r Software 7.54
t Hardware 17.53
y Media 2.16
u Telecommunication 6.79
j Service 41.53............................................................................................................
i Healthcare Service 14.16
o Consumer Service 10.66
p Business Service 7.07
a Financial Service 9.64
k Manufacturing 24.46............................................................................................................
s Consumer Goods 6.02
d Industrial Materials 8.91
f Energy 9.53
g Utilities 0.00
Release Date: 09-30-2009
AFN41550
09-09
©2009 Morningstar, Inc., Morningstar Investment Profiles™ 312-696-6000. All rights reserved. The information contained herein: (1) is proprietary to Morningstar and/orits content providers; (2) may not be copied or distributed and (3) is not warranted to be accurate, complete or timely. Neither Morningstar nor its content providers areresponsible for any damages or losses arising from any use of information. Past performance is no guarantee of future performance. Visit our investment website atwww.morningstar.com .
Page 1 of 2
49
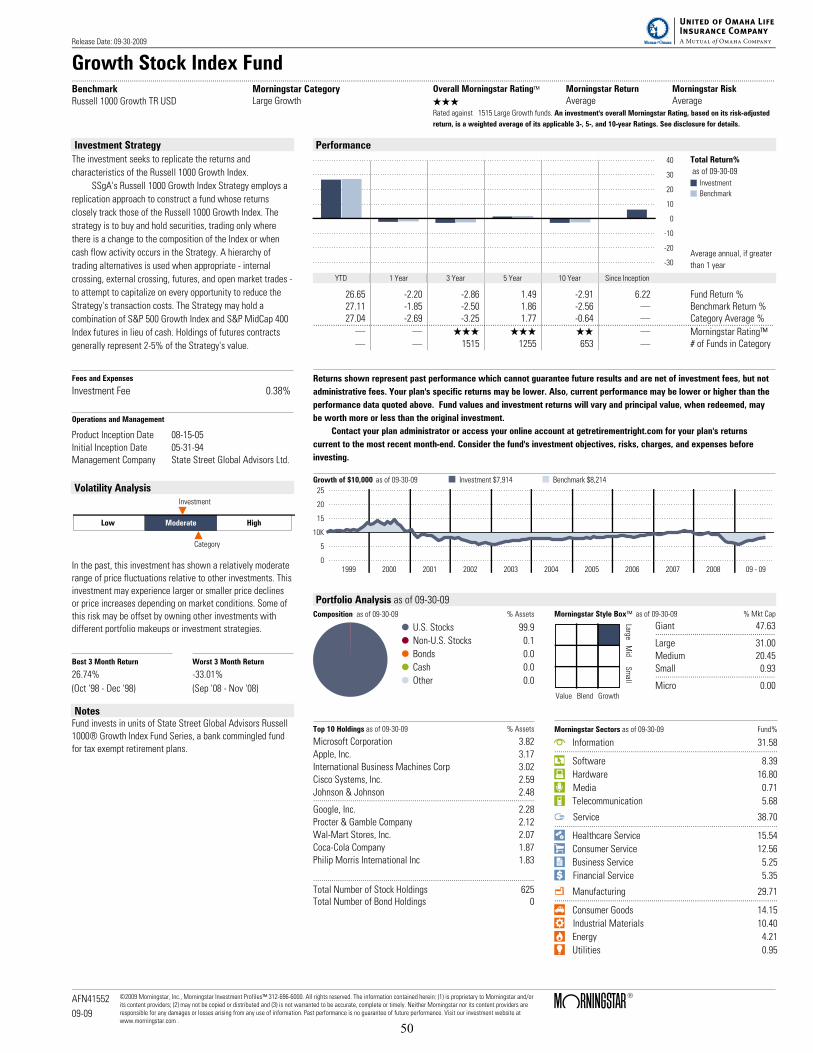
Growth Stock Index Fund....................................................................................................................................................................................................................................................................................................................................................BenchmarkRussell 1000 Growth TR USD
Morningstar CategoryLarge Growth
Overall Morningstar Rating™ Morningstar Return Morningstar Risk
QQQ Average AverageRated against 1515 Large Growth funds. An investment's overall Morningstar Rating, based on its risk-adjusted
return, is a weighted average of its applicable 3-, 5-, and 10-year Ratings. See disclosure for details.
Investment Strategy
The investment seeks to replicate the returns and
characteristics of the Russell 1000 Growth Index.
SSgA's Russell 1000 Growth Index Strategy employs a
replication approach to construct a fund whose returns
closely track those of the Russell 1000 Growth Index. The
strategy is to buy and hold securities, trading only where
there is a change to the composition of the Index or when
cash flow activity occurs in the Strategy. A hierarchy of
trading alternatives is used when appropriate - internal
crossing, external crossing, futures, and open market trades -
to attempt to capitalize on every opportunity to reduce the
Strategy's transaction costs. The Strategy may hold a
combination of S&P 500 Growth Index and S&P MidCap 400
Index futures in lieu of cash. Holdings of futures contracts
generally represent 2-5% of the Strategy's value.
Fees and Expenses
Investment Fee 0.38%
Operations and Management
Product Inception Date 08-15-05Initial Inception Date 05-31-94Management Company State Street Global Advisors Ltd.
Volatility Analysis
Low Moderate High
Investment
Category
In the past, this investment has shown a relatively moderaterange of price fluctuations relative to other investments. Thisinvestment may experience larger or smaller price declinesor price increases depending on market conditions. Some ofthis risk may be offset by owning other investments withdifferent portfolio makeups or investment strategies.
Best 3 Month Return Worst 3 Month Return
26.74% -33.01%
(Oct '98 - Dec '98) (Sep '08 - Nov '08)
NotesFund invests in units of State Street Global Advisors Russell1000® Growth Index Fund Series, a bank commingled fundfor tax exempt retirement plans.
Performance
10
20
30
40
0
-10
-20
-30
Total Return%
as of 09-30-09
Investment
Benchmark
Average annual, if greater
than 1 year
YTD 1 Year 3 Year 5 Year 10 Year Since Inception
26.65 -2.20 -2.86 1.49 -2.91 6.22 Fund Return %27.11 -1.85 -2.50 1.86 -2.56 . Benchmark Return %27.04 -2.69 -3.25 1.77 -0.64 . Category Average %................................................................................................................................................................................................................. . QQQ QQQ QQ . Morningstar Rating™. . 1515 1255 653 . # of Funds in Category
Returns shown represent past performance which cannot guarantee future results and are net of investment fees, but not
administrative fees. Your plan's specific returns may be lower. Also, current performance may be lower or higher than the
performance data quoted above. Fund values and investment returns will vary and principal value, when redeemed, may
be worth more or less than the original investment.
Contact your plan administrator or access your online account at getretirementright.com for your plan's returns
current to the most recent month-end. Consider the fund's investment objectives, risks, charges, and expenses before
investing.
Growth of $10,000 as of 09-30-09 Investment $7,914 Benchmark $8,214
1999 2000 2001 2002 2003 2004 2005 2006 2007 2008 09 - 09
25
20
15
5
0
10K
Portfolio Analysis as of 09-30-09Composition as of 09-30-09 % Assets
U.S. Stocks 99.9
Non-U.S. Stocks 0.1
Bonds 0.0
Cash 0.0
Other 0.0
Morningstar Style Box™ as of 09-30-09 % Mkt Cap
LargeM
idSm
all
Value Blend Growth
Giant 47.63..........................................................Large 31.00Medium 20.45Small 0.93..........................................................Micro 0.00
Top 10 Holdings as of 09-30-09 % Assets
Microsoft Corporation 3.82Apple, Inc. 3.17International Business Machines Corp 3.02Cisco Systems, Inc. 2.59Johnson & Johnson 2.48...........................................................................................................Google, Inc. 2.28Procter & Gamble Company 2.12Wal-Mart Stores, Inc. 2.07Coca-Cola Company 1.87Philip Morris International Inc 1.83
...........................................................................................................
Total Number of Stock Holdings 625Total Number of Bond Holdings 0
Morningstar Sectors as of 09-30-09 Fund%
h Information 31.58............................................................................................................
r Software 8.39
t Hardware 16.80
y Media 0.71
u Telecommunication 5.68
j Service 38.70............................................................................................................
i Healthcare Service 15.54
o Consumer Service 12.56
p Business Service 5.25
a Financial Service 5.35
k Manufacturing 29.71............................................................................................................
s Consumer Goods 14.15
d Industrial Materials 10.40
f Energy 4.21
g Utilities 0.95
Release Date: 09-30-2009
AFN41552
09-09
©2009 Morningstar, Inc., Morningstar Investment Profiles™ 312-696-6000. All rights reserved. The information contained herein: (1) is proprietary to Morningstar and/orits content providers; (2) may not be copied or distributed and (3) is not warranted to be accurate, complete or timely. Neither Morningstar nor its content providers areresponsible for any damages or losses arising from any use of information. Past performance is no guarantee of future performance. Visit our investment website atwww.morningstar.com .
Page 1 of 2
50
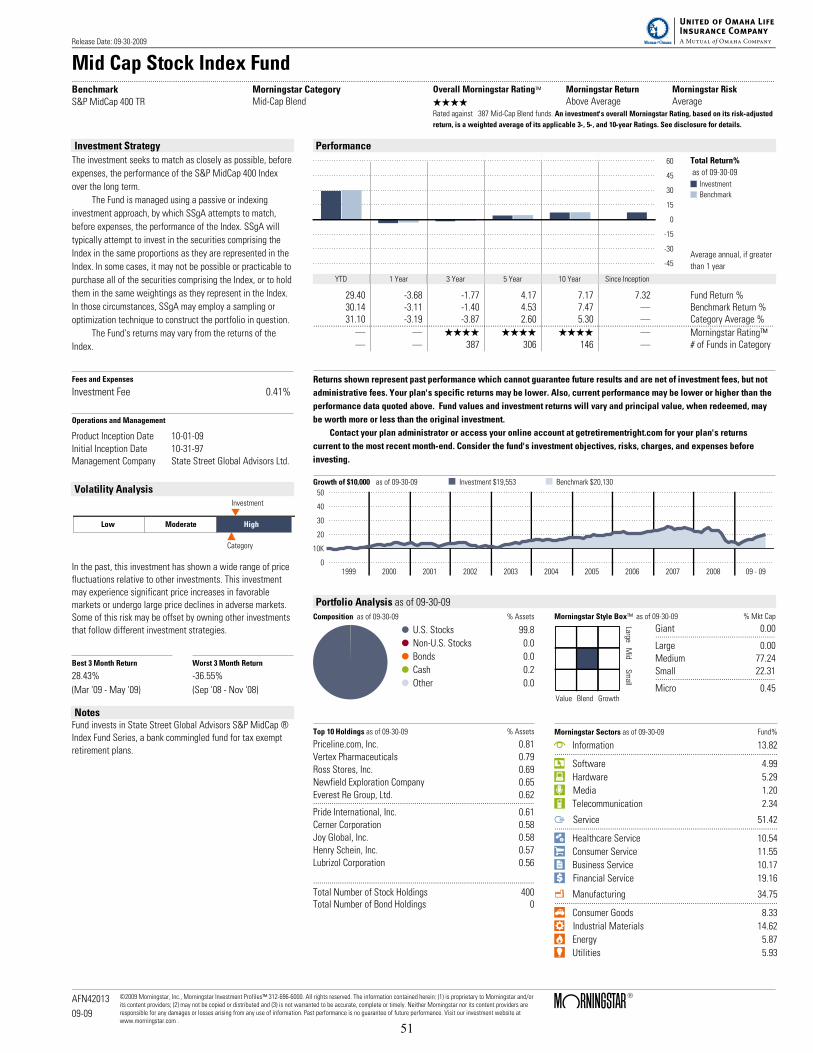
Mid Cap Stock Index Fund....................................................................................................................................................................................................................................................................................................................................................BenchmarkS&P MidCap 400 TR
Morningstar CategoryMid-Cap Blend
Overall Morningstar Rating™ Morningstar Return Morningstar Risk
QQQQ Above Average AverageRated against 387 Mid-Cap Blend funds. An investment's overall Morningstar Rating, based on its risk-adjusted
return, is a weighted average of its applicable 3-, 5-, and 10-year Ratings. See disclosure for details.
Investment Strategy
The investment seeks to match as closely as possible, before
expenses, the performance of the S&P MidCap 400 Index
over the long term.
The Fund is managed using a passive or indexing
investment approach, by which SSgA attempts to match,
before expenses, the performance of the Index. SSgA will
typically attempt to invest in the securities comprising the
Index in the same proportions as they are represented in the
Index. In some cases, it may not be possible or practicable to
purchase all of the securities comprising the Index, or to hold
them in the same weightings as they represent in the Index.
In those circumstances, SSgA may employ a sampling or
optimization technique to construct the portfolio in question.
The Fund's returns may vary from the returns of the
Index.
Fees and Expenses
Investment Fee 0.41%
Operations and Management
Product Inception Date 10-01-09Initial Inception Date 10-31-97Management Company State Street Global Advisors Ltd.
Volatility Analysis
Low Moderate High
Investment
Category
In the past, this investment has shown a wide range of pricefluctuations relative to other investments. This investmentmay experience significant price increases in favorablemarkets or undergo large price declines in adverse markets.Some of this risk may be offset by owning other investmentsthat follow different investment strategies.
Best 3 Month Return Worst 3 Month Return
28.43% -36.55%
(Mar '09 - May '09) (Sep '08 - Nov '08)
NotesFund invests in State Street Global Advisors S&P MidCap ®Index Fund Series, a bank commingled fund for tax exemptretirement plans.
Performance
15
30
45
60
0
-15
-30
-45
Total Return%
as of 09-30-09
Investment
Benchmark
Average annual, if greater
than 1 year
YTD 1 Year 3 Year 5 Year 10 Year Since Inception
29.40 -3.68 -1.77 4.17 7.17 7.32 Fund Return %30.14 -3.11 -1.40 4.53 7.47 . Benchmark Return %31.10 -3.19 -3.87 2.60 5.30 . Category Average %................................................................................................................................................................................................................. . QQQQ QQQQ QQQQ . Morningstar Rating™. . 387 306 146 . # of Funds in Category
Returns shown represent past performance which cannot guarantee future results and are net of investment fees, but not
administrative fees. Your plan's specific returns may be lower. Also, current performance may be lower or higher than the
performance data quoted above. Fund values and investment returns will vary and principal value, when redeemed, may
be worth more or less than the original investment.
Contact your plan administrator or access your online account at getretirementright.com for your plan's returns
current to the most recent month-end. Consider the fund's investment objectives, risks, charges, and expenses before
investing.
Growth of $10,000 as of 09-30-09 Investment $19,553 Benchmark $20,130
1999 2000 2001 2002 2003 2004 2005 2006 2007 2008 09 - 09
50
40
30
20
0
10K
Portfolio Analysis as of 09-30-09
Composition as of 09-30-09 % Assets
U.S. Stocks 99.8
Non-U.S. Stocks 0.0
Bonds 0.0
Cash 0.2
Other 0.0
Morningstar Style Box™ as of 09-30-09 % Mkt Cap
LargeM
idSm
all
Value Blend Growth
Giant 0.00..........................................................Large 0.00Medium 77.24Small 22.31..........................................................Micro 0.45
Top 10 Holdings as of 09-30-09 % Assets
Priceline.com, Inc. 0.81Vertex Pharmaceuticals 0.79Ross Stores, Inc. 0.69Newfield Exploration Company 0.65Everest Re Group, Ltd. 0.62...........................................................................................................Pride International, Inc. 0.61Cerner Corporation 0.58Joy Global, Inc. 0.58Henry Schein, Inc. 0.57Lubrizol Corporation 0.56
...........................................................................................................
Total Number of Stock Holdings 400Total Number of Bond Holdings 0
Morningstar Sectors as of 09-30-09 Fund%
h Information 13.82............................................................................................................
r Software 4.99
t Hardware 5.29
y Media 1.20
u Telecommunication 2.34
j Service 51.42............................................................................................................
i Healthcare Service 10.54
o Consumer Service 11.55
p Business Service 10.17
a Financial Service 19.16
k Manufacturing 34.75............................................................................................................
s Consumer Goods 8.33
d Industrial Materials 14.62
f Energy 5.87
g Utilities 5.93
Release Date: 09-30-2009
AFN42013
09-09
©2009 Morningstar, Inc., Morningstar Investment Profiles™ 312-696-6000. All rights reserved. The information contained herein: (1) is proprietary to Morningstar and/orits content providers; (2) may not be copied or distributed and (3) is not warranted to be accurate, complete or timely. Neither Morningstar nor its content providers areresponsible for any damages or losses arising from any use of information. Past performance is no guarantee of future performance. Visit our investment website atwww.morningstar.com .
Page 1 of 2
51
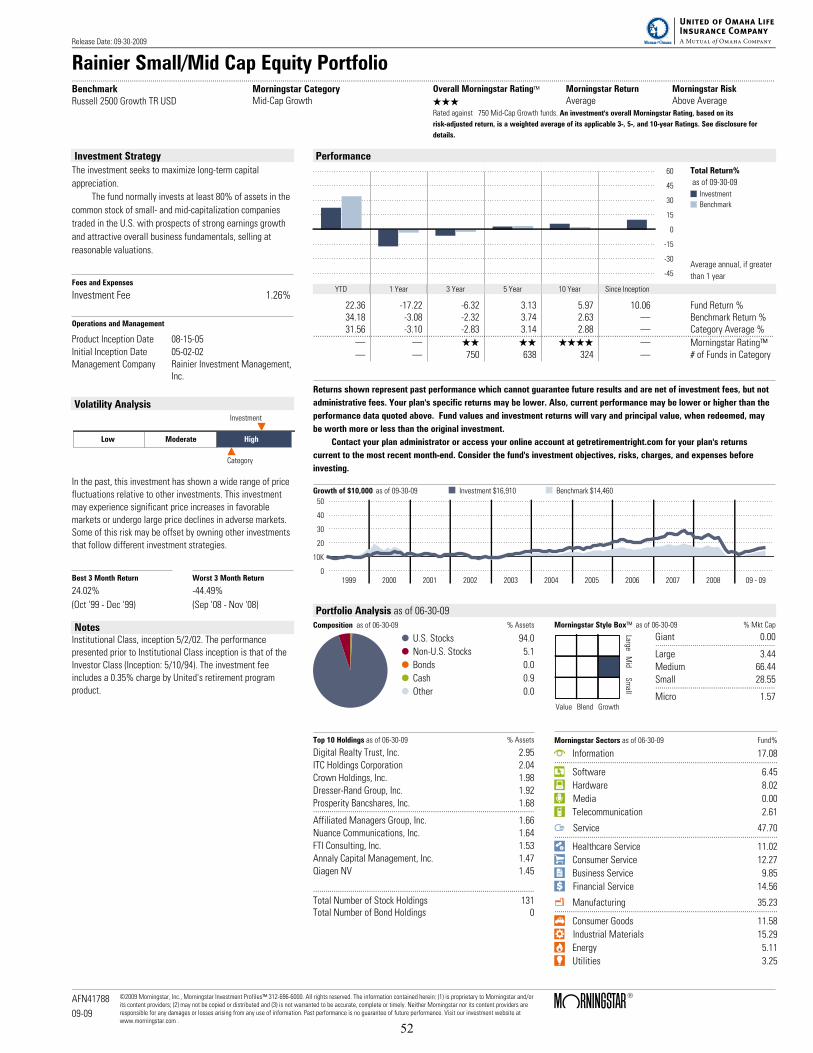
Rainier Small/Mid Cap Equity Portfolio....................................................................................................................................................................................................................................................................................................................................................Benchmark
Russell 2500 Growth TR USD
Morningstar CategoryMid-Cap Growth
Overall Morningstar Rating™ Morningstar Return Morningstar Risk
QQQ Average Above AverageRated against 750 Mid-Cap Growth funds. An investment's overall Morningstar Rating, based on its
risk-adjusted return, is a weighted average of its applicable 3-, 5-, and 10-year Ratings. See disclosure for
details.
Investment Strategy
The investment seeks to maximize long-term capital
appreciation.
The fund normally invests at least 80% of assets in the
common stock of small- and mid-capitalization companies
traded in the U.S. with prospects of strong earnings growth
and attractive overall business fundamentals, selling at
reasonable valuations.
Fees and Expenses
Investment Fee 1.26%
Operations and Management
Product Inception Date 08-15-05
Initial Inception Date 05-02-02
Management Company Rainier Investment Management,Inc.
Volatility Analysis
Low Moderate High
Investment
Category
In the past, this investment has shown a wide range of price
fluctuations relative to other investments. This investment
may experience significant price increases in favorable
markets or undergo large price declines in adverse markets.
Some of this risk may be offset by owning other investments
that follow different investment strategies.
Best 3 Month Return Worst 3 Month Return
24.02% -44.49%
(Oct '99 - Dec '99) (Sep '08 - Nov '08)
NotesInstitutional Class, inception 5/2/02. The performance
presented prior to Institutional Class inception is that of the
Investor Class (Inception: 5/10/94). The investment fee
includes a 0.35% charge by United's retirement program
product.
Performance
15
30
45
60
0
-15
-30
-45
Total Return%
as of 09-30-09
Investment
Benchmark
Average annual, if greater
than 1 year
YTD 1 Year 3 Year 5 Year 10 Year Since Inception
22.36 -17.22 -6.32 3.13 5.97 10.06 Fund Return %34.18 -3.08 -2.32 3.74 2.63 . Benchmark Return %31.56 -3.10 -2.83 3.14 2.88 . Category Average %................................................................................................................................................................................................................. . QQ QQ QQQQ . Morningstar Rating™. . 750 638 324 . # of Funds in Category
Returns shown represent past performance which cannot guarantee future results and are net of investment fees, but not
administrative fees. Your plan's specific returns may be lower. Also, current performance may be lower or higher than the
performance data quoted above. Fund values and investment returns will vary and principal value, when redeemed, may
be worth more or less than the original investment.
Contact your plan administrator or access your online account at getretirementright.com for your plan's returns
current to the most recent month-end. Consider the fund's investment objectives, risks, charges, and expenses before
investing.
Growth of $10,000 as of 09-30-09 Investment $16,910 Benchmark $14,460
1999 2000 2001 2002 2003 2004 2005 2006 2007 2008 09 - 09
50
40
30
20
0
10K
Portfolio Analysis as of 06-30-09
Composition as of 06-30-09 % Assets
U.S. Stocks 94.0
Non-U.S. Stocks 5.1
Bonds 0.0
Cash 0.9
Other 0.0
Morningstar Style Box™ as of 06-30-09 % Mkt Cap
LargeM
idS
mall
Value Blend Growth
Giant 0.00..........................................................
Large 3.44
Medium 66.44
Small 28.55..........................................................
Micro 1.57
Top 10 Holdings as of 06-30-09 % Assets
Digital Realty Trust, Inc. 2.95
ITC Holdings Corporation 2.04
Crown Holdings, Inc. 1.98
Dresser-Rand Group, Inc. 1.92
Prosperity Bancshares, Inc. 1.68...........................................................................................................
Affiliated Managers Group, Inc. 1.66
Nuance Communications, Inc. 1.64
FTI Consulting, Inc. 1.53
Annaly Capital Management, Inc. 1.47
Qiagen NV 1.45
...........................................................................................................
Total Number of Stock Holdings 131Total Number of Bond Holdings 0
Morningstar Sectors as of 06-30-09 Fund%
h Information 17.08............................................................................................................
r Software 6.45
t Hardware 8.02
y Media 0.00
u Telecommunication 2.61
j Service 47.70............................................................................................................
i Healthcare Service 11.02
o Consumer Service 12.27
p Business Service 9.85
a Financial Service 14.56
k Manufacturing 35.23............................................................................................................
s Consumer Goods 11.58
d Industrial Materials 15.29
f Energy 5.11
g Utilities 3.25
Release Date: 09-30-2009
AFN41788
09-09
©2009 Morningstar, Inc., Morningstar Investment Profiles™ 312-696-6000. All rights reserved. The information contained herein: (1) is proprietary to Morningstar and/orits content providers; (2) may not be copied or distributed and (3) is not warranted to be accurate, complete or timely. Neither Morningstar nor its content providers areresponsible for any damages or losses arising from any use of information. Past performance is no guarantee of future performance. Visit our investment website atwww.morningstar.com .
Page 1 of 2
52
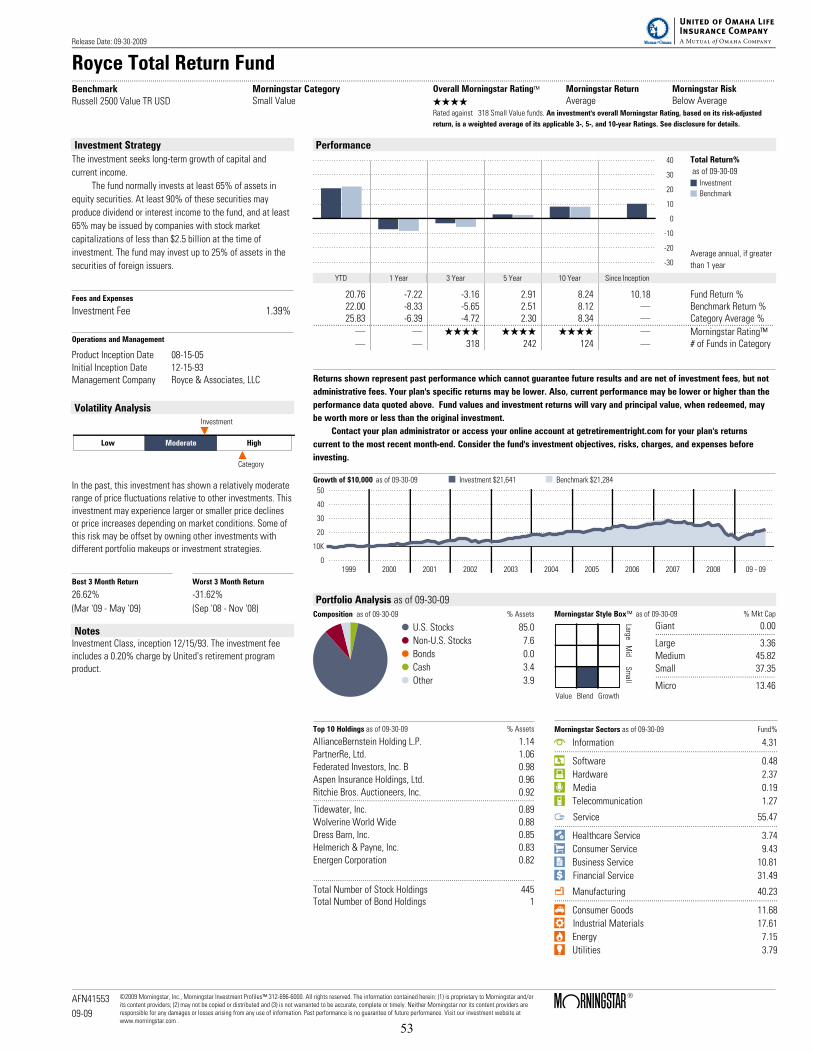
Royce Total Return Fund....................................................................................................................................................................................................................................................................................................................................................Benchmark
Russell 2500 Value TR USD
Morningstar CategorySmall Value
Overall Morningstar Rating™ Morningstar Return Morningstar Risk
QQQQ Average Below AverageRated against 318 Small Value funds. An investment's overall Morningstar Rating, based on its risk-adjusted
return, is a weighted average of its applicable 3-, 5-, and 10-year Ratings. See disclosure for details.
Investment Strategy
The investment seeks long-term growth of capital and
current income.
The fund normally invests at least 65% of assets in
equity securities. At least 90% of these securities may
produce dividend or interest income to the fund, and at least
65% may be issued by companies with stock market
capitalizations of less than $2.5 billion at the time of
investment. The fund may invest up to 25% of assets in the
securities of foreign issuers.
Fees and Expenses
Investment Fee 1.39%
Operations and Management
Product Inception Date 08-15-05
Initial Inception Date 12-15-93
Management Company Royce & Associates, LLC
Volatility Analysis
Low Moderate High
Investment
Category
In the past, this investment has shown a relatively moderate
range of price fluctuations relative to other investments. This
investment may experience larger or smaller price declines
or price increases depending on market conditions. Some of
this risk may be offset by owning other investments with
different portfolio makeups or investment strategies.
Best 3 Month Return Worst 3 Month Return
26.62% -31.62%
(Mar '09 - May '09) (Sep '08 - Nov '08)
NotesInvestment Class, inception 12/15/93. The investment fee
includes a 0.20% charge by United's retirement program
product.
Performance
10
20
30
40
0
-10
-20
-30
Total Return%
as of 09-30-09
Investment
Benchmark
Average annual, if greater
than 1 year
YTD 1 Year 3 Year 5 Year 10 Year Since Inception
20.76 -7.22 -3.16 2.91 8.24 10.18 Fund Return %22.00 -8.33 -5.65 2.51 8.12 . Benchmark Return %25.83 -6.39 -4.72 2.30 8.34 . Category Average %................................................................................................................................................................................................................. . QQQQ QQQQ QQQQ . Morningstar Rating™. . 318 242 124 . # of Funds in Category
Returns shown represent past performance which cannot guarantee future results and are net of investment fees, but not
administrative fees. Your plan's specific returns may be lower. Also, current performance may be lower or higher than the
performance data quoted above. Fund values and investment returns will vary and principal value, when redeemed, may
be worth more or less than the original investment.
Contact your plan administrator or access your online account at getretirementright.com for your plan's returns
current to the most recent month-end. Consider the fund's investment objectives, risks, charges, and expenses before
investing.
Growth of $10,000 as of 09-30-09 Investment $21,641 Benchmark $21,284
1999 2000 2001 2002 2003 2004 2005 2006 2007 2008 09 - 09
50
40
30
20
0
10K
Portfolio Analysis as of 09-30-09
Composition as of 09-30-09 % Assets
U.S. Stocks 85.0
Non-U.S. Stocks 7.6
Bonds 0.0
Cash 3.4
Other 3.9
Morningstar Style Box™ as of 09-30-09 % Mkt Cap
LargeM
idS
mall
Value Blend Growth
Giant 0.00..........................................................
Large 3.36
Medium 45.82
Small 37.35..........................................................
Micro 13.46
Top 10 Holdings as of 09-30-09 % Assets
AllianceBernstein Holding L.P. 1.14
PartnerRe, Ltd. 1.06
Federated Investors, Inc. B 0.98
Aspen Insurance Holdings, Ltd. 0.96
Ritchie Bros. Auctioneers, Inc. 0.92...........................................................................................................
Tidewater, Inc. 0.89
Wolverine World Wide 0.88
Dress Barn, Inc. 0.85
Helmerich & Payne, Inc. 0.83
Energen Corporation 0.82
...........................................................................................................
Total Number of Stock Holdings 445Total Number of Bond Holdings 1
Morningstar Sectors as of 09-30-09 Fund%
h Information 4.31............................................................................................................
r Software 0.48
t Hardware 2.37
y Media 0.19
u Telecommunication 1.27
j Service 55.47............................................................................................................
i Healthcare Service 3.74
o Consumer Service 9.43
p Business Service 10.81
a Financial Service 31.49
k Manufacturing 40.23............................................................................................................
s Consumer Goods 11.68
d Industrial Materials 17.61
f Energy 7.15
g Utilities 3.79
Release Date: 09-30-2009
AFN41553
09-09
©2009 Morningstar, Inc., Morningstar Investment Profiles™ 312-696-6000. All rights reserved. The information contained herein: (1) is proprietary to Morningstar and/orits content providers; (2) may not be copied or distributed and (3) is not warranted to be accurate, complete or timely. Neither Morningstar nor its content providers areresponsible for any damages or losses arising from any use of information. Past performance is no guarantee of future performance. Visit our investment website atwww.morningstar.com .
Page 1 of 2
53
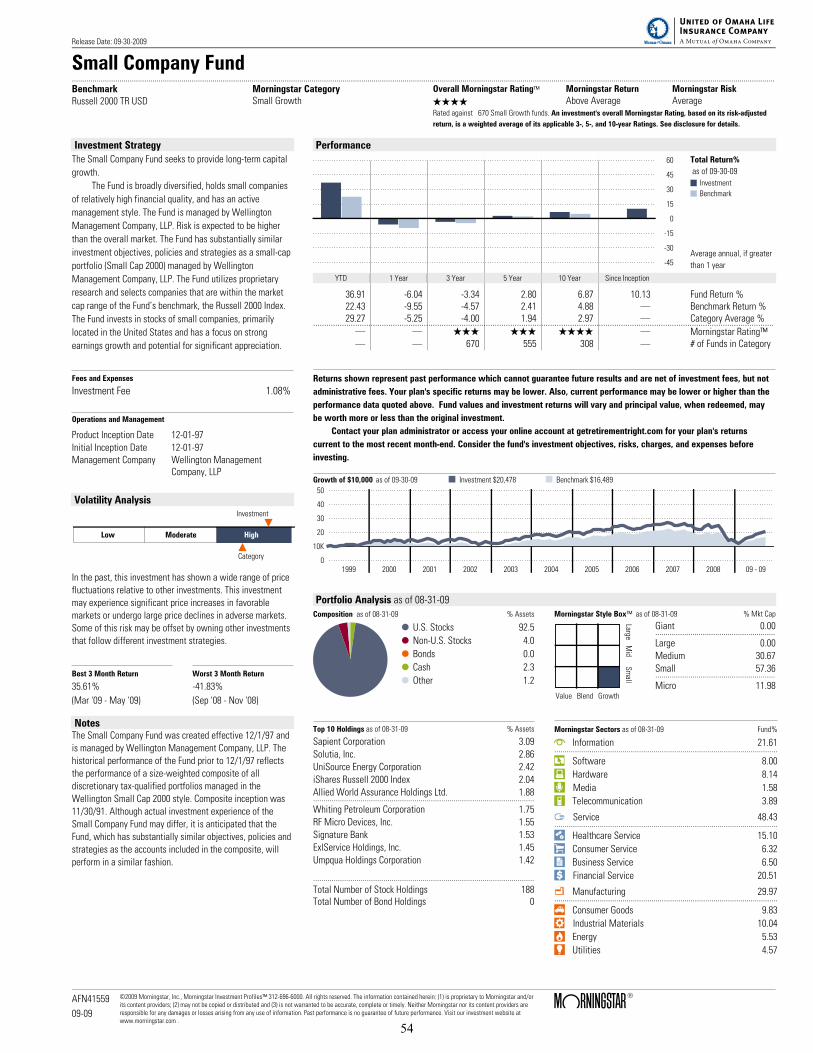
Small Company Fund....................................................................................................................................................................................................................................................................................................................................................BenchmarkRussell 2000 TR USD
Morningstar CategorySmall Growth
Overall Morningstar Rating™ Morningstar Return Morningstar Risk
QQQQ Above Average AverageRated against 670 Small Growth funds. An investment's overall Morningstar Rating, based on its risk-adjusted
return, is a weighted average of its applicable 3-, 5-, and 10-year Ratings. See disclosure for details.
Investment Strategy
The Small Company Fund seeks to provide long-term capital
growth.
The Fund is broadly diversified, holds small companies
of relatively high financial quality, and has an active
management style. The Fund is managed by Wellington
Management Company, LLP. Risk is expected to be higher
than the overall market. The Fund has substantially similar
investment objectives, policies and strategies as a small-cap
portfolio (Small Cap 2000) managed by Wellington
Management Company, LLP. The Fund utilizes proprietary
research and selects companies that are within the market
cap range of the Fund’s benchmark, the Russell 2000 Index.
The Fund invests in stocks of small companies, primarily
located in the United States and has a focus on strong
earnings growth and potential for significant appreciation.
Fees and Expenses
Investment Fee 1.08%
Operations and Management
Product Inception Date 12-01-97Initial Inception Date 12-01-97Management Company Wellington Management
Company, LLP
Volatility Analysis
Low Moderate High
Investment
Category
In the past, this investment has shown a wide range of pricefluctuations relative to other investments. This investmentmay experience significant price increases in favorablemarkets or undergo large price declines in adverse markets.Some of this risk may be offset by owning other investmentsthat follow different investment strategies.
Best 3 Month Return Worst 3 Month Return
35.61% -41.83%
(Mar '09 - May '09) (Sep '08 - Nov '08)
NotesThe Small Company Fund was created effective 12/1/97 andis managed by Wellington Management Company, LLP. Thehistorical performance of the Fund prior to 12/1/97 reflectsthe performance of a size-weighted composite of alldiscretionary tax-qualified portfolios managed in theWellington Small Cap 2000 style. Composite inception was11/30/91. Although actual investment experience of theSmall Company Fund may differ, it is anticipated that theFund, which has substantially similar objectives, policies andstrategies as the accounts included in the composite, willperform in a similar fashion.
Performance
15
30
45
60
0
-15
-30
-45
Total Return%
as of 09-30-09
Investment
Benchmark
Average annual, if greater
than 1 year
YTD 1 Year 3 Year 5 Year 10 Year Since Inception
36.91 -6.04 -3.34 2.80 6.87 10.13 Fund Return %22.43 -9.55 -4.57 2.41 4.88 . Benchmark Return %29.27 -5.25 -4.00 1.94 2.97 . Category Average %................................................................................................................................................................................................................. . QQQ QQQ QQQQ . Morningstar Rating™. . 670 555 308 . # of Funds in Category
Returns shown represent past performance which cannot guarantee future results and are net of investment fees, but not
administrative fees. Your plan's specific returns may be lower. Also, current performance may be lower or higher than the
performance data quoted above. Fund values and investment returns will vary and principal value, when redeemed, may
be worth more or less than the original investment.
Contact your plan administrator or access your online account at getretirementright.com for your plan's returns
current to the most recent month-end. Consider the fund's investment objectives, risks, charges, and expenses before
investing.
Growth of $10,000 as of 09-30-09 Investment $20,478 Benchmark $16,489
1999 2000 2001 2002 2003 2004 2005 2006 2007 2008 09 - 09
50
40
30
20
0
10K
Portfolio Analysis as of 08-31-09Composition as of 08-31-09 % Assets
U.S. Stocks 92.5
Non-U.S. Stocks 4.0
Bonds 0.0
Cash 2.3
Other 1.2
Morningstar Style Box™ as of 08-31-09 % Mkt Cap
LargeM
idSm
all
Value Blend Growth
Giant 0.00..........................................................Large 0.00Medium 30.67Small 57.36..........................................................Micro 11.98
Top 10 Holdings as of 08-31-09 % Assets
Sapient Corporation 3.09Solutia, Inc. 2.86UniSource Energy Corporation 2.42iShares Russell 2000 Index 2.04Allied World Assurance Holdings Ltd. 1.88...........................................................................................................Whiting Petroleum Corporation 1.75RF Micro Devices, Inc. 1.55Signature Bank 1.53ExlService Holdings, Inc. 1.45Umpqua Holdings Corporation 1.42
...........................................................................................................
Total Number of Stock Holdings 188Total Number of Bond Holdings 0
Morningstar Sectors as of 08-31-09 Fund%
h Information 21.61............................................................................................................
r Software 8.00
t Hardware 8.14
y Media 1.58
u Telecommunication 3.89
j Service 48.43............................................................................................................
i Healthcare Service 15.10
o Consumer Service 6.32
p Business Service 6.50
a Financial Service 20.51
k Manufacturing 29.97............................................................................................................
s Consumer Goods 9.83
d Industrial Materials 10.04
f Energy 5.53
g Utilities 4.57
Release Date: 09-30-2009
AFN41559
09-09
©2009 Morningstar, Inc., Morningstar Investment Profiles™ 312-696-6000. All rights reserved. The information contained herein: (1) is proprietary to Morningstar and/orits content providers; (2) may not be copied or distributed and (3) is not warranted to be accurate, complete or timely. Neither Morningstar nor its content providers areresponsible for any damages or losses arising from any use of information. Past performance is no guarantee of future performance. Visit our investment website atwww.morningstar.com .
Page 1 of 2
54
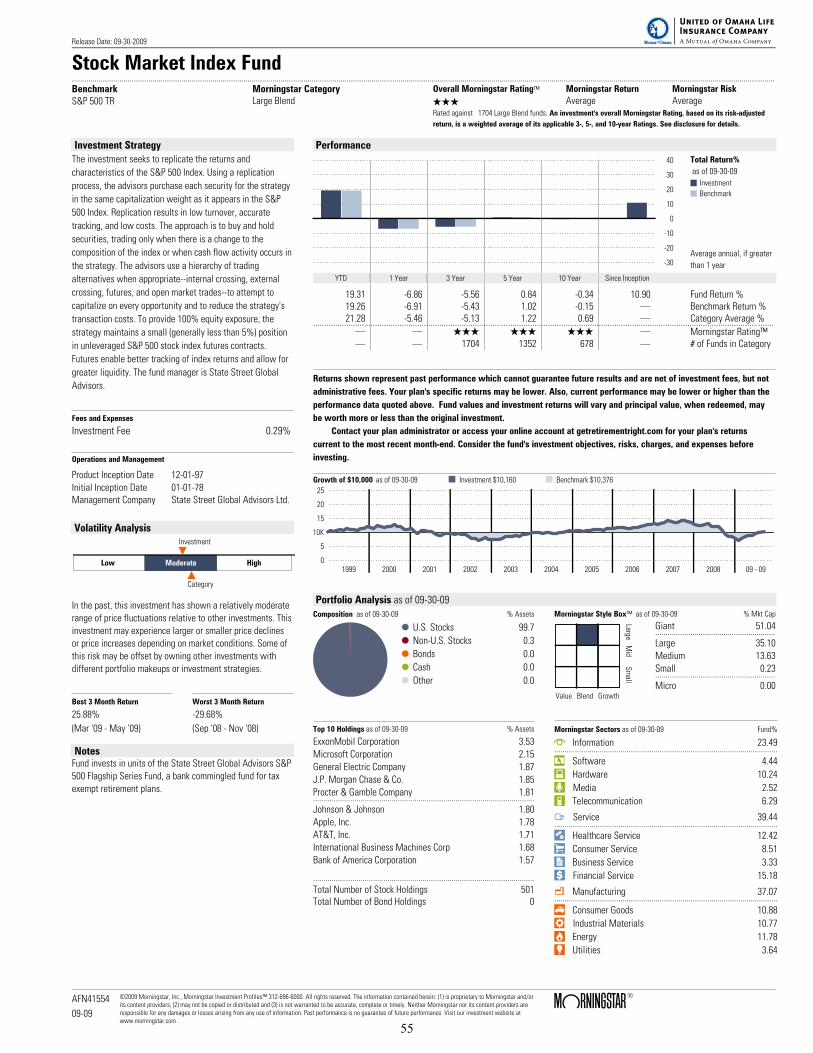
Stock Market Index Fund....................................................................................................................................................................................................................................................................................................................................................BenchmarkS&P 500 TR
Morningstar CategoryLarge Blend
Overall Morningstar Rating™ Morningstar Return Morningstar Risk
QQQ Average AverageRated against 1704 Large Blend funds. An investment's overall Morningstar Rating, based on its risk-adjusted
return, is a weighted average of its applicable 3-, 5-, and 10-year Ratings. See disclosure for details.
Investment Strategy
The investment seeks to replicate the returns and
characteristics of the S&P 500 Index. Using a replication
process, the advisors purchase each security for the strategy
in the same capitalization weight as it appears in the S&P
500 Index. Replication results in low turnover, accurate
tracking, and low costs. The approach is to buy and hold
securities, trading only when there is a change to the
composition of the index or when cash flow activity occurs in
the strategy. The advisors use a hierarchy of trading
alternatives when appropriate--internal crossing, external
crossing, futures, and open market trades--to attempt to
capitalize on every opportunity and to reduce the strategy's
transaction costs. To provide 100% equity exposure, the
strategy maintains a small (generally less than 5%) position
in unleveraged S&P 500 stock index futures contracts.
Futures enable better tracking of index returns and allow for
greater liquidity. The fund manager is State Street Global
Advisors.
Fees and Expenses
Investment Fee 0.29%
Operations and Management
Product Inception Date 12-01-97Initial Inception Date 01-01-78Management Company State Street Global Advisors Ltd.
Volatility Analysis
Low Moderate High
Investment
Category
In the past, this investment has shown a relatively moderaterange of price fluctuations relative to other investments. Thisinvestment may experience larger or smaller price declinesor price increases depending on market conditions. Some ofthis risk may be offset by owning other investments withdifferent portfolio makeups or investment strategies.
Best 3 Month Return Worst 3 Month Return
25.88% -29.68%
(Mar '09 - May '09) (Sep '08 - Nov '08)
NotesFund invests in units of the State Street Global Advisors S&P500 Flagship Series Fund, a bank commingled fund for taxexempt retirement plans.
Performance
10
20
30
40
0
-10
-20
-30
Total Return%
as of 09-30-09
Investment
Benchmark
Average annual, if greater
than 1 year
YTD 1 Year 3 Year 5 Year 10 Year Since Inception
19.31 -6.86 -5.56 0.84 -0.34 10.90 Fund Return %19.26 -6.91 -5.43 1.02 -0.15 . Benchmark Return %21.28 -5.46 -5.13 1.22 0.69 . Category Average %................................................................................................................................................................................................................. . QQQ QQQ QQQ . Morningstar Rating™. . 1704 1352 678 . # of Funds in Category
Returns shown represent past performance which cannot guarantee future results and are net of investment fees, but not
administrative fees. Your plan's specific returns may be lower. Also, current performance may be lower or higher than the
performance data quoted above. Fund values and investment returns will vary and principal value, when redeemed, may
be worth more or less than the original investment.
Contact your plan administrator or access your online account at getretirementright.com for your plan's returns
current to the most recent month-end. Consider the fund's investment objectives, risks, charges, and expenses before
investing.
Growth of $10,000 as of 09-30-09 Investment $10,160 Benchmark $10,376
1999 2000 2001 2002 2003 2004 2005 2006 2007 2008 09 - 09
25
20
15
5
0
10K
Portfolio Analysis as of 09-30-09Composition as of 09-30-09 % Assets
U.S. Stocks 99.7
Non-U.S. Stocks 0.3
Bonds 0.0
Cash 0.0
Other 0.0
Morningstar Style Box™ as of 09-30-09 % Mkt Cap
LargeM
idSm
all
Value Blend Growth
Giant 51.04..........................................................Large 35.10Medium 13.63Small 0.23..........................................................Micro 0.00
Top 10 Holdings as of 09-30-09 % Assets
ExxonMobil Corporation 3.53Microsoft Corporation 2.15General Electric Company 1.87J.P. Morgan Chase & Co. 1.85Procter & Gamble Company 1.81...........................................................................................................Johnson & Johnson 1.80Apple, Inc. 1.78AT&T, Inc. 1.71International Business Machines Corp 1.68Bank of America Corporation 1.57
...........................................................................................................
Total Number of Stock Holdings 501Total Number of Bond Holdings 0
Morningstar Sectors as of 09-30-09 Fund%
h Information 23.49............................................................................................................
r Software 4.44
t Hardware 10.24
y Media 2.52
u Telecommunication 6.29
j Service 39.44............................................................................................................
i Healthcare Service 12.42
o Consumer Service 8.51
p Business Service 3.33
a Financial Service 15.18
k Manufacturing 37.07............................................................................................................
s Consumer Goods 10.88
d Industrial Materials 10.77
f Energy 11.78
g Utilities 3.64
Release Date: 09-30-2009
AFN41554
09-09
©2009 Morningstar, Inc., Morningstar Investment Profiles™ 312-696-6000. All rights reserved. The information contained herein: (1) is proprietary to Morningstar and/orits content providers; (2) may not be copied or distributed and (3) is not warranted to be accurate, complete or timely. Neither Morningstar nor its content providers areresponsible for any damages or losses arising from any use of information. Past performance is no guarantee of future performance. Visit our investment website atwww.morningstar.com .
Page 1 of 2
55

Strategic Value Fund....................................................................................................................................................................................................................................................................................................................................................BenchmarkRussell 1000 Value TR USD
Morningstar CategoryLarge Value
Overall Morningstar Rating™ Morningstar Return Morningstar Risk
QQQ Average Below AverageRated against 1133 Large Value funds. An investment's overall Morningstar Rating, based on its risk-adjusted
return, is a weighted average of its applicable 3-, 5-, and 10-year Ratings. See disclosure for details.
Investment Strategy
The Strategic Value Fund seeks long-term growth of capital.
The Fund is managed by Goldman Sachs Asset
Management and uses a forward-looking investment
approach that focuses on quality, well-positioned businesses
selling at compelling valuations. The Fund emphasizes
rigorous, first-hand fundamental research in identifying
quality businesses. Goldman Sachs believes that a
company's ability to generate high cash flow returns on
capital will strongly influence investment success. Portfolio
managers utilize a strong valuation discipline to purchase
well-positioned, cash-generating businesses run by
shareholder-oriented management teams.
Fees and Expenses
Investment Fee 0.88%
Operations and Management
Product Inception Date 08-15-05Initial Inception Date 08-15-05Management Company Goldman Sachs Asset
Management, L.P.
Volatility Analysis
Low Moderate High
Investment
Category
In the past, this investment has shown a relatively moderaterange of price fluctuations relative to other investments. Thisinvestment may experience larger or smaller price declinesor price increases depending on market conditions. Some ofthis risk may be offset by owning other investments withdifferent portfolio makeups or investment strategies.
Best 3 Month Return Worst 3 Month Return
23.26% -30.29%
(Mar '09 - May '09) (Sep '08 - Nov '08)
NotesThe Strategic Value Fund was created effective 08/15/05and is managed by Goldman Sachs Asset Management. Thehistorical performance prior to 08/15/05 reflects theperformance of Goldman Sach's Strategic Value Discipline,an investment discipline managed by Goldman Sach's since1/00. Although actual investment experience may differ, it isanticipated that the Fund, which has substantially similarobjectives, policies and strategies as the accounts includedin the composite discipline, will perform in a similar fashion.
Performance
10
20
30
40
0
-10
-20
-30
Total Return%
as of 09-30-09
Investment
Benchmark
Average annual, if greater
than 1 year
YTD 1 Year 3 Year 5 Year 10 Year Since Inception
19.44 -6.97 -6.47 1.36 . 3.70 Fund Return %14.85 -10.62 -7.87 0.90 . . Benchmark Return %18.46 -7.18 -6.72 0.85 . . Category Average %................................................................................................................................................................................................................. . QQQ QQQ . . Morningstar Rating™. . 1133 933 . . # of Funds in Category
Returns shown represent past performance which cannot guarantee future results and are net of investment fees, but not
administrative fees. Your plan's specific returns may be lower. Also, current performance may be lower or higher than the
performance data quoted above. Fund values and investment returns will vary and principal value, when redeemed, may
be worth more or less than the original investment.
Contact your plan administrator or access your online account at getretirementright.com for your plan's returns
current to the most recent month-end. Consider the fund's investment objectives, risks, charges, and expenses before
investing.
Growth of $10,000 as of 09-30-09 Investment $14,246 Benchmark $12,250
1999 2000 2001 2002 2003 2004 2005 2006 2007 2008 09 - 09
25
20
15
5
0
10K
Portfolio Analysis as of 08-31-09Composition as of 08-31-09 % Assets
U.S. Stocks 91.9
Non-U.S. Stocks 5.0
Bonds 0.0
Cash 3.2
Other 0.0
Morningstar Style Box™ as of 08-31-09 % Mkt Cap
LargeM
idSm
all
Value Blend Growth
Giant 37.61..........................................................Large 53.91Medium 8.49Small 0.00..........................................................Micro 0.00
Top 10 Holdings as of 08-31-09 % Assets
J.P. Morgan Chase & Co. 4.40Bank of America Corporation 4.29Occidental Petroleum Corporation 3.60Johnson & Johnson 2.88Entergy Corporation 2.71...........................................................................................................The Travelers Companies, Inc. 2.64Baxter International Inc. 2.53Comcast Corporation A 2.46Philip Morris International Inc 2.45Hewlett-Packard Company 2.36
...........................................................................................................
Total Number of Stock Holdings 66Total Number of Bond Holdings 0
Morningstar Sectors as of 08-31-09 Fund%
h Information 14.42............................................................................................................
r Software 1.74
t Hardware 4.00
y Media 6.19
u Telecommunication 2.49
j Service 46.43............................................................................................................
i Healthcare Service 13.67
o Consumer Service 6.67
p Business Service 0.00
a Financial Service 26.09
k Manufacturing 39.16............................................................................................................
s Consumer Goods 7.16
d Industrial Materials 9.57
f Energy 16.45
g Utilities 5.98
Release Date: 09-30-2009
AFN41557
09-09
©2009 Morningstar, Inc., Morningstar Investment Profiles™ 312-696-6000. All rights reserved. The information contained herein: (1) is proprietary to Morningstar and/orits content providers; (2) may not be copied or distributed and (3) is not warranted to be accurate, complete or timely. Neither Morningstar nor its content providers areresponsible for any damages or losses arising from any use of information. Past performance is no guarantee of future performance. Visit our investment website atwww.morningstar.com .
Page 1 of 2
56
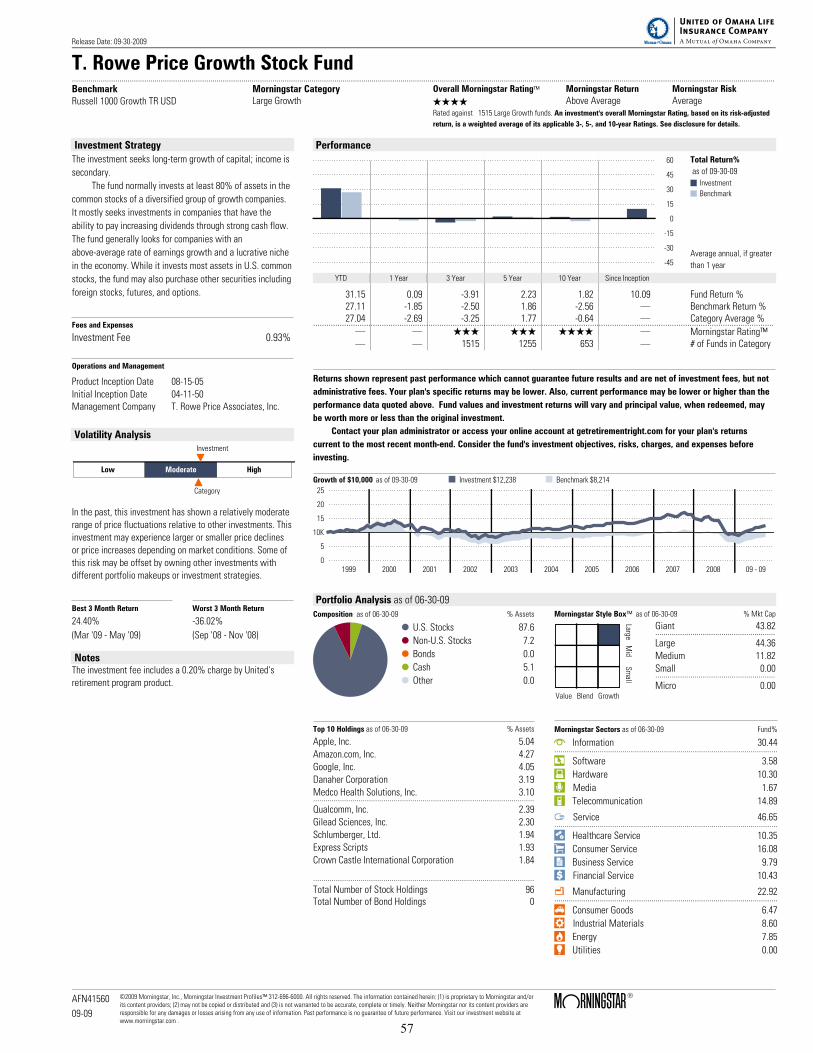
T. Rowe Price Growth Stock Fund....................................................................................................................................................................................................................................................................................................................................................Benchmark
Russell 1000 Growth TR USD
Morningstar CategoryLarge Growth
Overall Morningstar Rating™ Morningstar Return Morningstar Risk
QQQQ Above Average AverageRated against 1515 Large Growth funds. An investment's overall Morningstar Rating, based on its risk-adjusted
return, is a weighted average of its applicable 3-, 5-, and 10-year Ratings. See disclosure for details.
Investment Strategy
The investment seeks long-term growth of capital; income is
secondary.
The fund normally invests at least 80% of assets in the
common stocks of a diversified group of growth companies.
It mostly seeks investments in companies that have the
ability to pay increasing dividends through strong cash flow.
The fund generally looks for companies with an
above-average rate of earnings growth and a lucrative niche
in the economy. While it invests most assets in U.S. common
stocks, the fund may also purchase other securities including
foreign stocks, futures, and options.
Fees and Expenses
Investment Fee 0.93%
Operations and Management
Product Inception Date 08-15-05
Initial Inception Date 04-11-50
Management Company T. Rowe Price Associates, Inc.
Volatility Analysis
Low Moderate High
Investment
Category
In the past, this investment has shown a relatively moderate
range of price fluctuations relative to other investments. This
investment may experience larger or smaller price declines
or price increases depending on market conditions. Some of
this risk may be offset by owning other investments with
different portfolio makeups or investment strategies.
Best 3 Month Return Worst 3 Month Return
24.40% -36.02%
(Mar '09 - May '09) (Sep '08 - Nov '08)
NotesThe investment fee includes a 0.20% charge by United's
retirement program product.
Performance
15
30
45
60
0
-15
-30
-45
Total Return%
as of 09-30-09
Investment
Benchmark
Average annual, if greater
than 1 year
YTD 1 Year 3 Year 5 Year 10 Year Since Inception
31.15 0.09 -3.91 2.23 1.82 10.09 Fund Return %27.11 -1.85 -2.50 1.86 -2.56 . Benchmark Return %27.04 -2.69 -3.25 1.77 -0.64 . Category Average %................................................................................................................................................................................................................. . QQQ QQQ QQQQ . Morningstar Rating™. . 1515 1255 653 . # of Funds in Category
Returns shown represent past performance which cannot guarantee future results and are net of investment fees, but not
administrative fees. Your plan's specific returns may be lower. Also, current performance may be lower or higher than the
performance data quoted above. Fund values and investment returns will vary and principal value, when redeemed, may
be worth more or less than the original investment.
Contact your plan administrator or access your online account at getretirementright.com for your plan's returns
current to the most recent month-end. Consider the fund's investment objectives, risks, charges, and expenses before
investing.
Growth of $10,000 as of 09-30-09 Investment $12,238 Benchmark $8,214
1999 2000 2001 2002 2003 2004 2005 2006 2007 2008 09 - 09
25
20
15
5
0
10K
Portfolio Analysis as of 06-30-09
Composition as of 06-30-09 % Assets
U.S. Stocks 87.6
Non-U.S. Stocks 7.2
Bonds 0.0
Cash 5.1
Other 0.0
Morningstar Style Box™ as of 06-30-09 % Mkt Cap
LargeM
idS
mall
Value Blend Growth
Giant 43.82..........................................................
Large 44.36
Medium 11.82
Small 0.00..........................................................
Micro 0.00
Top 10 Holdings as of 06-30-09 % Assets
Apple, Inc. 5.04
Amazon.com, Inc. 4.27
Google, Inc. 4.05
Danaher Corporation 3.19
Medco Health Solutions, Inc. 3.10...........................................................................................................
Qualcomm, Inc. 2.39
Gilead Sciences, Inc. 2.30
Schlumberger, Ltd. 1.94
Express Scripts 1.93
Crown Castle International Corporation 1.84
...........................................................................................................
Total Number of Stock Holdings 96Total Number of Bond Holdings 0
Morningstar Sectors as of 06-30-09 Fund%
h Information 30.44............................................................................................................
r Software 3.58
t Hardware 10.30
y Media 1.67
u Telecommunication 14.89
j Service 46.65............................................................................................................
i Healthcare Service 10.35
o Consumer Service 16.08
p Business Service 9.79
a Financial Service 10.43
k Manufacturing 22.92............................................................................................................
s Consumer Goods 6.47
d Industrial Materials 8.60
f Energy 7.85
g Utilities 0.00
Release Date: 09-30-2009
AFN41560
09-09
©2009 Morningstar, Inc., Morningstar Investment Profiles™ 312-696-6000. All rights reserved. The information contained herein: (1) is proprietary to Morningstar and/orits content providers; (2) may not be copied or distributed and (3) is not warranted to be accurate, complete or timely. Neither Morningstar nor its content providers areresponsible for any damages or losses arising from any use of information. Past performance is no guarantee of future performance. Visit our investment website atwww.morningstar.com .
Page 1 of 2
57
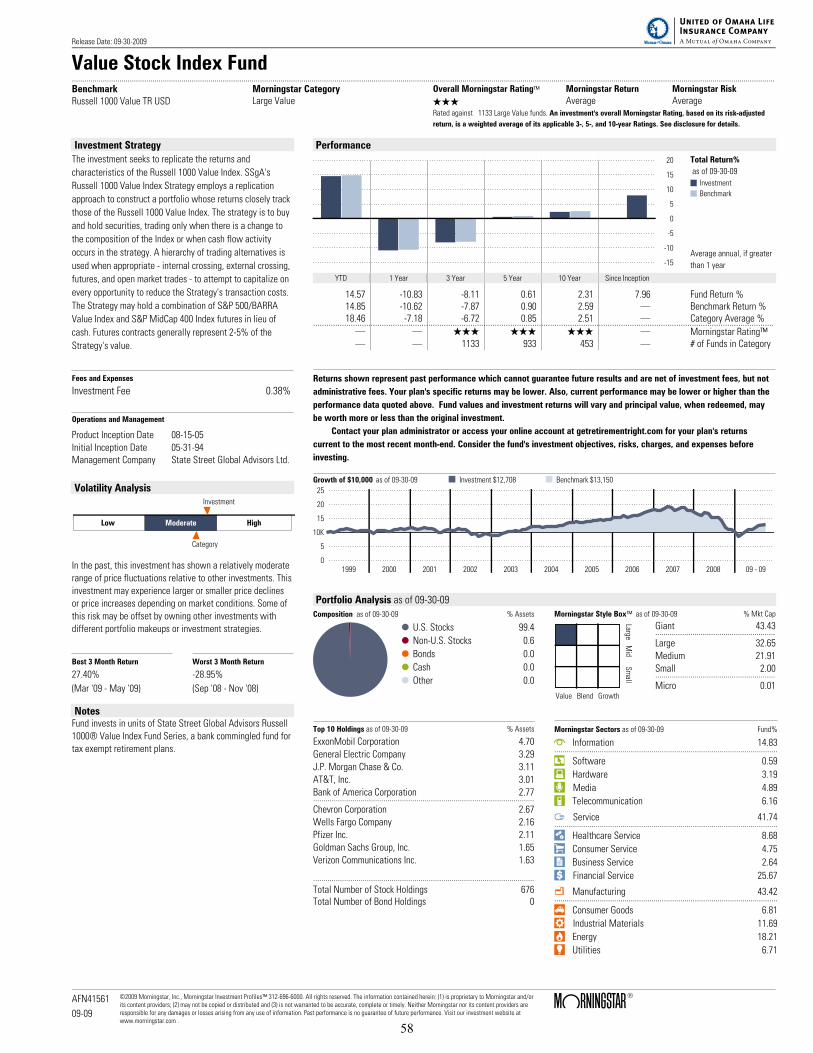
Value Stock Index Fund....................................................................................................................................................................................................................................................................................................................................................BenchmarkRussell 1000 Value TR USD
Morningstar CategoryLarge Value
Overall Morningstar Rating™ Morningstar Return Morningstar Risk
QQQ Average AverageRated against 1133 Large Value funds. An investment's overall Morningstar Rating, based on its risk-adjusted
return, is a weighted average of its applicable 3-, 5-, and 10-year Ratings. See disclosure for details.
Investment Strategy
The investment seeks to replicate the returns and
characteristics of the Russell 1000 Value Index. SSgA's
Russell 1000 Value Index Strategy employs a replication
approach to construct a portfolio whose returns closely track
those of the Russell 1000 Value Index. The strategy is to buy
and hold securities, trading only when there is a change to
the composition of the Index or when cash flow activity
occurs in the strategy. A hierarchy of trading alternatives is
used when appropriate - internal crossing, external crossing,
futures, and open market trades - to attempt to capitalize on
every opportunity to reduce the Strategy's transaction costs.
The Strategy may hold a combination of S&P 500/BARRA
Value Index and S&P MidCap 400 Index futures in lieu of
cash. Futures contracts generally represent 2-5% of the
Strategy's value.
Fees and Expenses
Investment Fee 0.38%
Operations and Management
Product Inception Date 08-15-05Initial Inception Date 05-31-94Management Company State Street Global Advisors Ltd.
Volatility Analysis
Low Moderate High
Investment
Category
In the past, this investment has shown a relatively moderaterange of price fluctuations relative to other investments. Thisinvestment may experience larger or smaller price declinesor price increases depending on market conditions. Some ofthis risk may be offset by owning other investments withdifferent portfolio makeups or investment strategies.
Best 3 Month Return Worst 3 Month Return
27.40% -28.95%
(Mar '09 - May '09) (Sep '08 - Nov '08)
NotesFund invests in units of State Street Global Advisors Russell1000® Value Index Fund Series, a bank commingled fund fortax exempt retirement plans.
Performance
5
10
15
20
0
-5
-10
-15
Total Return%
as of 09-30-09
Investment
Benchmark
Average annual, if greater
than 1 year
YTD 1 Year 3 Year 5 Year 10 Year Since Inception
14.57 -10.83 -8.11 0.61 2.31 7.96 Fund Return %14.85 -10.62 -7.87 0.90 2.59 . Benchmark Return %18.46 -7.18 -6.72 0.85 2.51 . Category Average %................................................................................................................................................................................................................. . QQQ QQQ QQQ . Morningstar Rating™. . 1133 933 453 . # of Funds in Category
Returns shown represent past performance which cannot guarantee future results and are net of investment fees, but not
administrative fees. Your plan's specific returns may be lower. Also, current performance may be lower or higher than the
performance data quoted above. Fund values and investment returns will vary and principal value, when redeemed, may
be worth more or less than the original investment.
Contact your plan administrator or access your online account at getretirementright.com for your plan's returns
current to the most recent month-end. Consider the fund's investment objectives, risks, charges, and expenses before
investing.
Growth of $10,000 as of 09-30-09 Investment $12,708 Benchmark $13,150
1999 2000 2001 2002 2003 2004 2005 2006 2007 2008 09 - 09
25
20
15
5
0
10K
Portfolio Analysis as of 09-30-09Composition as of 09-30-09 % Assets
U.S. Stocks 99.4
Non-U.S. Stocks 0.6
Bonds 0.0
Cash 0.0
Other 0.0
Morningstar Style Box™ as of 09-30-09 % Mkt Cap
LargeM
idSm
all
Value Blend Growth
Giant 43.43..........................................................Large 32.65Medium 21.91Small 2.00..........................................................Micro 0.01
Top 10 Holdings as of 09-30-09 % Assets
ExxonMobil Corporation 4.70General Electric Company 3.29J.P. Morgan Chase & Co. 3.11AT&T, Inc. 3.01Bank of America Corporation 2.77...........................................................................................................Chevron Corporation 2.67Wells Fargo Company 2.16Pfizer Inc. 2.11Goldman Sachs Group, Inc. 1.65Verizon Communications Inc. 1.63
...........................................................................................................
Total Number of Stock Holdings 676Total Number of Bond Holdings 0
Morningstar Sectors as of 09-30-09 Fund%
h Information 14.83............................................................................................................
r Software 0.59
t Hardware 3.19
y Media 4.89
u Telecommunication 6.16
j Service 41.74............................................................................................................
i Healthcare Service 8.68
o Consumer Service 4.75
p Business Service 2.64
a Financial Service 25.67
k Manufacturing 43.42............................................................................................................
s Consumer Goods 6.81
d Industrial Materials 11.69
f Energy 18.21
g Utilities 6.71
Release Date: 09-30-2009
AFN41561
09-09
©2009 Morningstar, Inc., Morningstar Investment Profiles™ 312-696-6000. All rights reserved. The information contained herein: (1) is proprietary to Morningstar and/orits content providers; (2) may not be copied or distributed and (3) is not warranted to be accurate, complete or timely. Neither Morningstar nor its content providers areresponsible for any damages or losses arising from any use of information. Past performance is no guarantee of future performance. Visit our investment website atwww.morningstar.com .
Page 1 of 2
58
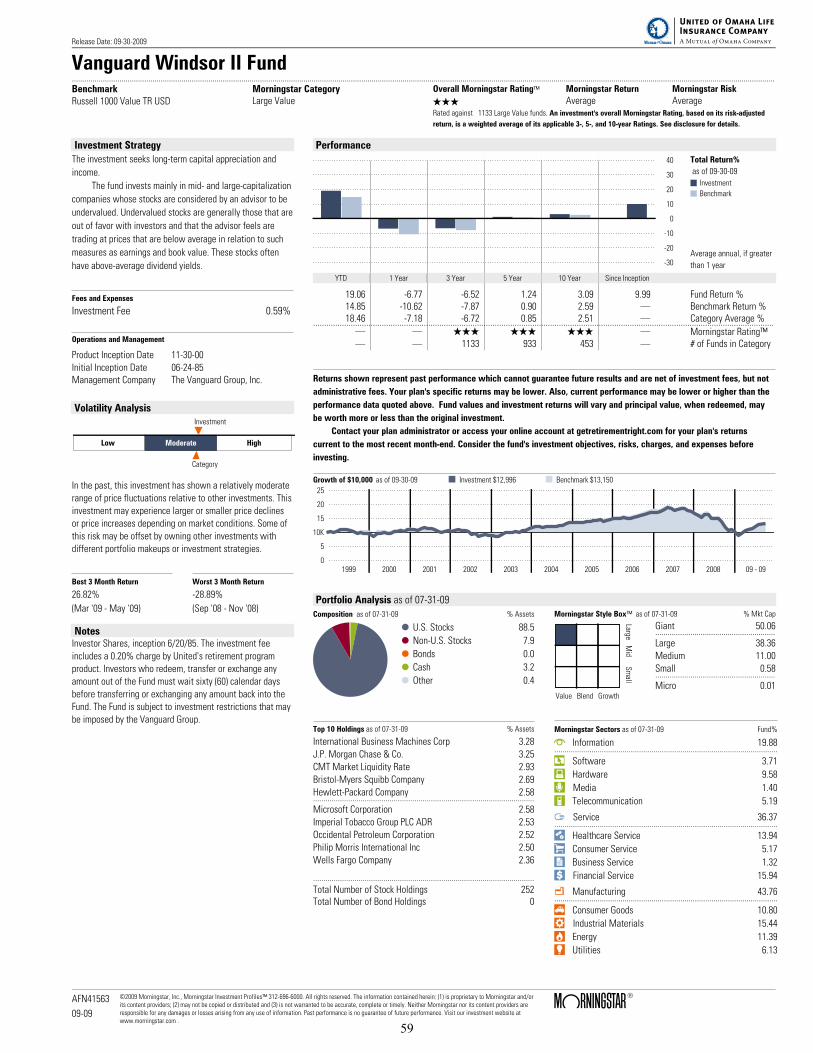
Vanguard Windsor II Fund....................................................................................................................................................................................................................................................................................................................................................Benchmark
Russell 1000 Value TR USD
Morningstar CategoryLarge Value
Overall Morningstar Rating™ Morningstar Return Morningstar Risk
QQQ Average AverageRated against 1133 Large Value funds. An investment's overall Morningstar Rating, based on its risk-adjusted
return, is a weighted average of its applicable 3-, 5-, and 10-year Ratings. See disclosure for details.
Investment Strategy
The investment seeks long-term capital appreciation and
income.
The fund invests mainly in mid- and large-capitalization
companies whose stocks are considered by an advisor to be
undervalued. Undervalued stocks are generally those that are
out of favor with investors and that the advisor feels are
trading at prices that are below average in relation to such
measures as earnings and book value. These stocks often
have above-average dividend yields.
Fees and Expenses
Investment Fee 0.59%
Operations and Management
Product Inception Date 11-30-00
Initial Inception Date 06-24-85
Management Company The Vanguard Group, Inc.
Volatility Analysis
Low Moderate High
Investment
Category
In the past, this investment has shown a relatively moderate
range of price fluctuations relative to other investments. This
investment may experience larger or smaller price declines
or price increases depending on market conditions. Some of
this risk may be offset by owning other investments with
different portfolio makeups or investment strategies.
Best 3 Month Return Worst 3 Month Return
26.82% -28.89%
(Mar '09 - May '09) (Sep '08 - Nov '08)
NotesInvestor Shares, inception 6/20/85. The investment fee
includes a 0.20% charge by United's retirement program
product. Investors who redeem, transfer or exchange any
amount out of the Fund must wait sixty (60) calendar days
before transferring or exchanging any amount back into the
Fund. The Fund is subject to investment restrictions that may
be imposed by the Vanguard Group.
Performance
10
20
30
40
0
-10
-20
-30
Total Return%
as of 09-30-09
Investment
Benchmark
Average annual, if greater
than 1 year
YTD 1 Year 3 Year 5 Year 10 Year Since Inception
19.06 -6.77 -6.52 1.24 3.09 9.99 Fund Return %14.85 -10.62 -7.87 0.90 2.59 . Benchmark Return %18.46 -7.18 -6.72 0.85 2.51 . Category Average %................................................................................................................................................................................................................. . QQQ QQQ QQQ . Morningstar Rating™. . 1133 933 453 . # of Funds in Category
Returns shown represent past performance which cannot guarantee future results and are net of investment fees, but not
administrative fees. Your plan's specific returns may be lower. Also, current performance may be lower or higher than the
performance data quoted above. Fund values and investment returns will vary and principal value, when redeemed, may
be worth more or less than the original investment.
Contact your plan administrator or access your online account at getretirementright.com for your plan's returns
current to the most recent month-end. Consider the fund's investment objectives, risks, charges, and expenses before
investing.
Growth of $10,000 as of 09-30-09 Investment $12,996 Benchmark $13,150
1999 2000 2001 2002 2003 2004 2005 2006 2007 2008 09 - 09
25
20
15
5
0
10K
Portfolio Analysis as of 07-31-09
Composition as of 07-31-09 % Assets
U.S. Stocks 88.5
Non-U.S. Stocks 7.9
Bonds 0.0
Cash 3.2
Other 0.4
Morningstar Style Box™ as of 07-31-09 % Mkt Cap
LargeM
idS
mall
Value Blend Growth
Giant 50.06..........................................................
Large 38.36
Medium 11.00
Small 0.58..........................................................
Micro 0.01
Top 10 Holdings as of 07-31-09 % Assets
International Business Machines Corp 3.28
J.P. Morgan Chase & Co. 3.25
CMT Market Liquidity Rate 2.93
Bristol-Myers Squibb Company 2.69
Hewlett-Packard Company 2.58...........................................................................................................
Microsoft Corporation 2.58
Imperial Tobacco Group PLC ADR 2.53
Occidental Petroleum Corporation 2.52
Philip Morris International Inc 2.50
Wells Fargo Company 2.36
...........................................................................................................
Total Number of Stock Holdings 252Total Number of Bond Holdings 0
Morningstar Sectors as of 07-31-09 Fund%
h Information 19.88............................................................................................................
r Software 3.71
t Hardware 9.58
y Media 1.40
u Telecommunication 5.19
j Service 36.37............................................................................................................
i Healthcare Service 13.94
o Consumer Service 5.17
p Business Service 1.32
a Financial Service 15.94
k Manufacturing 43.76............................................................................................................
s Consumer Goods 10.80
d Industrial Materials 15.44
f Energy 11.39
g Utilities 6.13
Release Date: 09-30-2009
AFN41563
09-09
©2009 Morningstar, Inc., Morningstar Investment Profiles™ 312-696-6000. All rights reserved. The information contained herein: (1) is proprietary to Morningstar and/orits content providers; (2) may not be copied or distributed and (3) is not warranted to be accurate, complete or timely. Neither Morningstar nor its content providers areresponsible for any damages or losses arising from any use of information. Past performance is no guarantee of future performance. Visit our investment website atwww.morningstar.com .
Page 1 of 2
59
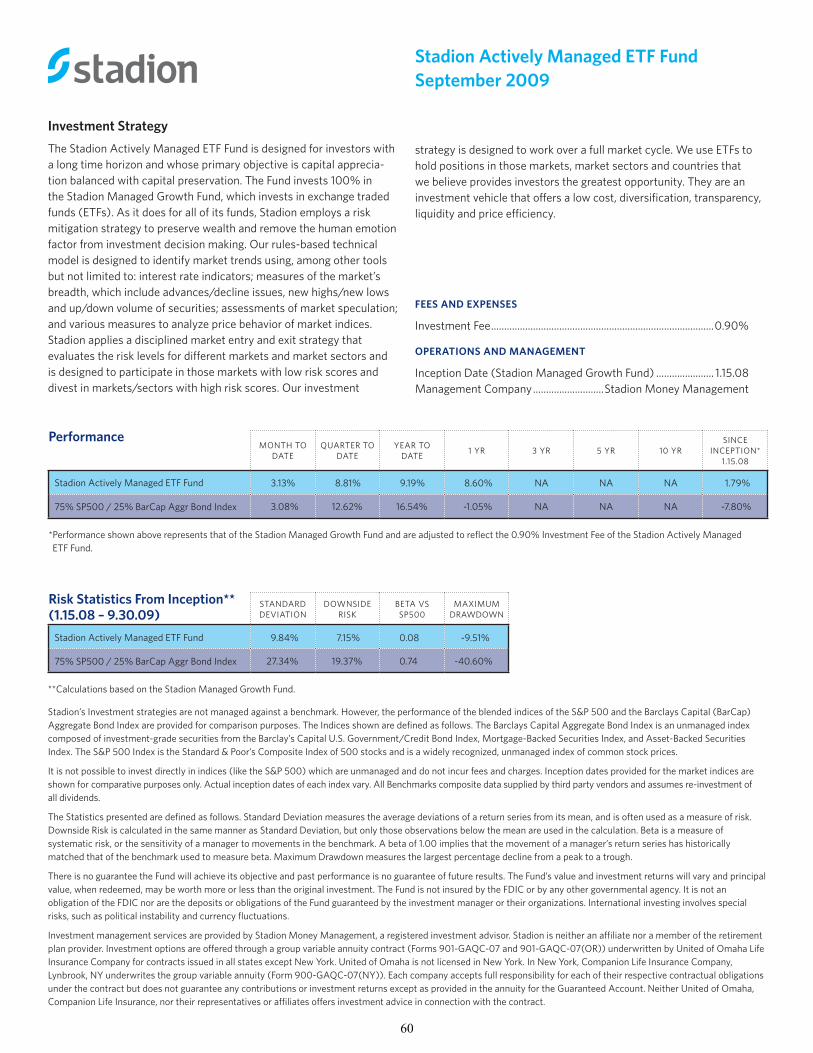
Stadion Actively Managed ETF Fund September 2009
Investment StrategyThe Stadion Actively Managed ETF Fund is designed for investors with a long time horizon and whose primary objective is capital apprecia-tion balanced with capital preservation. The Fund invests 100% in the Stadion Managed Growth Fund, which invests in exchange traded funds (ETFs). As it does for all of its funds, Stadion employs a risk mitigation strategy to preserve wealth and remove the human emotion factor from investment decision making. Our rules-based technical model is designed to identify market trends using, among other tools but not limited to: interest rate indicators; measures of the market’s breadth, which include advances/decline issues, new highs/new lows and up/down volume of securities; assessments of market speculation; and various measures to analyze price behavior of market indices. Stadion applies a disciplined market entry and exit strategy that evaluates the risk levels for different markets and market sectors and is designed to participate in those markets with low risk scores and divest in markets/sectors with high risk scores. Our investment
strategy is designed to work over a full market cycle. We use ETFs to hold positions in those markets, market sectors and countries that we believe provides investors the greatest opportunity. They are an investment vehicle that offers a low cost, diversification, transparency, liquidity and price efficiency.
FEES And ExpEnSES
Investment Fee .....................................................................................0.90%
OpErATIOnS And MAnAgEMEnT
Inception Date (Stadion Managed Growth Fund) ...................... 1.15.08Management Company ...........................Stadion Money Management
performanceMOnTh TO
DATEQuArTEr TO
DATEYEAr TO
DATE 1 Yr 3 Yr 5 Yr 10 YrSInCE
InCEpTIOn*1.15.08
Stadion Actively Managed ETF Fund 3.13% 8.81% 9.19% 8.60% nA nA nA 1.79%
75% Sp500 / 25% BarCap Aggr Bond Index 3.08% 12.62% 16.54% -1.05% nA nA nA -7.80%
*performance shown above represents that of the Stadion Managed Growth Fund and are adjusted to reflect the 0.90% Investment Fee of the Stadion Actively Managed ETF Fund.
risk Statistics From Inception** (1.15.08 – 9.30.09)
STAnDArD DEvIATIOn
DOWnSIDE rISk
BETA vS Sp500
MAxIMuM DrAWDOWn
Stadion Actively Managed ETF Fund 9.84% 7.15% 0.08 -9.51%
75% Sp500 / 25% BarCap Aggr Bond Index 27.34% 19.37% 0.74 -40.60%
Stadion’s Investment strategies are not managed against a benchmark. however, the performance of the blended indices of the S&p 500 and the Barclays Capital (BarCap) Aggregate Bond Index are provided for comparison purposes. The Indices shown are defined as follows. The Barclays Capital Aggregate Bond Index is an unmanaged index composed of investment-grade securities from the Barclay’s Capital u.S. Government/Credit Bond Index, Mortgage-Backed Securities Index, and Asset-Backed Securities Index. The S&p 500 Index is the Standard & poor’s Composite Index of 500 stocks and is a widely recognized, unmanaged index of common stock prices.
It is not possible to invest directly in indices (like the S&p 500) which are unmanaged and do not incur fees and charges. Inception dates provided for the market indices are shown for comparative purposes only. Actual inception dates of each index vary. All Benchmarks composite data supplied by third party vendors and assumes re-investment of all dividends.
The Statistics presented are defined as follows. Standard Deviation measures the average deviations of a return series from its mean, and is often used as a measure of risk. Downside risk is calculated in the same manner as Standard Deviation, but only those observations below the mean are used in the calculation. Beta is a measure of systematic risk, or the sensitivity of a manager to movements in the benchmark. A beta of 1.00 implies that the movement of a manager’s return series has historically matched that of the benchmark used to measure beta. Maximum Drawdown measures the largest percentage decline from a peak to a trough.
There is no guarantee the Fund will achieve its objective and past performance is no guarantee of future results. The Fund’s value and investment returns will vary and principal value, when redeemed, may be worth more or less than the original investment. The Fund is not insured by the FDIC or by any other governmental agency. It is not an obligation of the FDIC nor are the deposits or obligations of the Fund guaranteed by the investment manager or their organizations. International investing involves special risks, such as political instability and currency fluctuations.
Investment management services are provided by Stadion Money Management, a registered investment advisor. Stadion is neither an affiliate nor a member of the retirement plan provider. Investment options are offered through a group variable annuity contract (Forms 901-GAQC-07 and 901-GAQC-07(Or)) underwritten by united of Omaha Life Insurance Company for contracts issued in all states except new York. united of Omaha is not licensed in new York. In new York, Companion Life Insurance Company, Lynbrook, nY underwrites the group variable annuity (Form 900-GAQC-07(nY)). Each company accepts full responsibility for each of their respective contractual obligations under the contract but does not guarantee any contributions or investment returns except as provided in the annuity for the Guaranteed Account. neither united of Omaha, Companion Life Insurance, nor their representatives or affiliates offers investment advice in connection with the contract.
**Calculations based on the Stadion Managed Growth Fund.
60
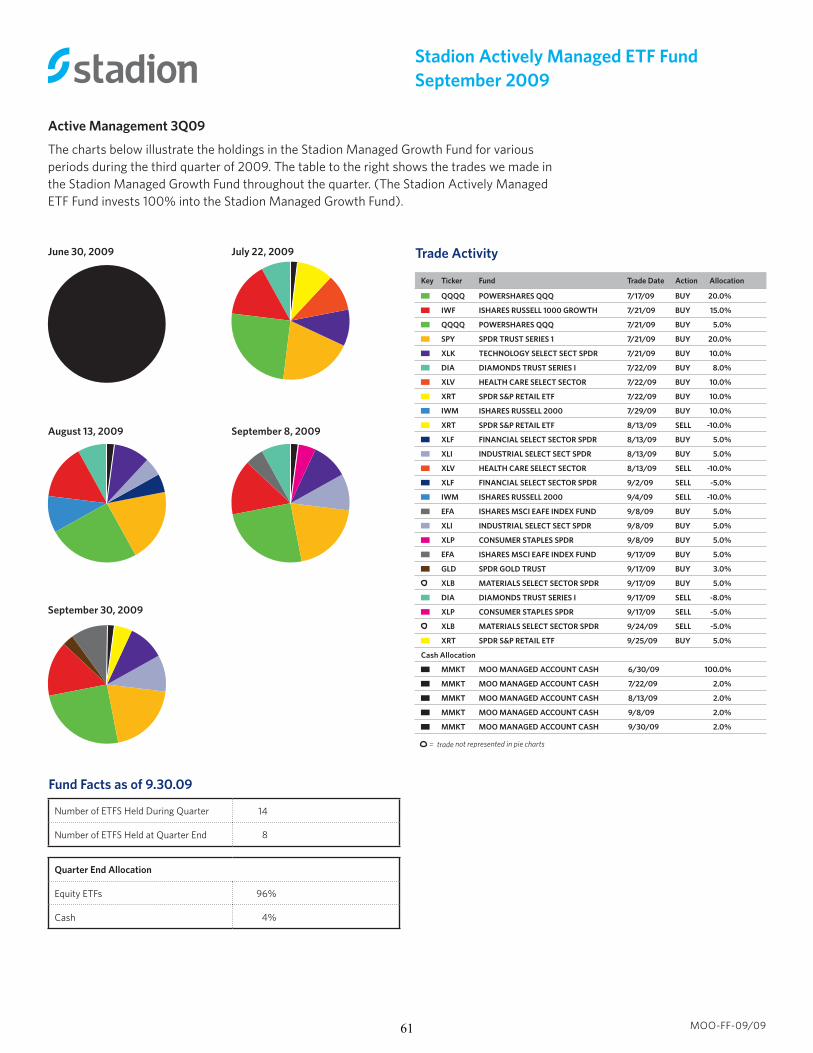
Trade Activity
Key Ticker Fund Trade date Action Allocation
QQQQ pOWErSHArES QQQ 7/17/09 BUY 20.0%
IWF ISHArES rUSSELL 1000 grOWTH 7/21/09 BUY 15.0%
QQQQ pOWErSHArES QQQ 7/21/09 BUY 5.0%
SpY Spdr TrUST SErIES 1 7/21/09 BUY 20.0%
xLK TECHnOLOgY SELECT SECT Spdr 7/21/09 BUY 10.0%
dIA dIAMOndS TrUST SErIES I 7/22/09 BUY 8.0%
xLV HEALTH CArE SELECT SECTOr 7/22/09 BUY 10.0%
xrT Spdr S&p rETAIL ETF 7/22/09 BUY 10.0%
IWM ISHArES rUSSELL 2000 7/29/09 BUY 10.0%
xrT Spdr S&p rETAIL ETF 8/13/09 SELL -10.0%
xLF FInAnCIAL SELECT SECTOr Spdr 8/13/09 BUY 5.0%
xLI IndUSTrIAL SELECT SECT Spdr 8/13/09 BUY 5.0%
xLV HEALTH CArE SELECT SECTOr 8/13/09 SELL -10.0%
xLF FInAnCIAL SELECT SECTOr Spdr 9/2/09 SELL -5.0%
IWM ISHArES rUSSELL 2000 9/4/09 SELL -10.0%
EFA ISHArES MSCI EAFE IndEx FUnd 9/8/09 BUY 5.0%
xLI IndUSTrIAL SELECT SECT Spdr 9/8/09 BUY 5.0%
xLp COnSUMEr STApLES Spdr 9/8/09 BUY 5.0%
EFA ISHArES MSCI EAFE IndEx FUnd 9/17/09 BUY 5.0%
gLd Spdr gOLd TrUST 9/17/09 BUY 3.0%
xLB MATErIALS SELECT SECTOr Spdr 9/17/09 BUY 5.0%
dIA dIAMOndS TrUST SErIES I 9/17/09 SELL -8.0%
xLp COnSUMEr STApLES Spdr 9/17/09 SELL -5.0%
xLB MATErIALS SELECT SECTOr Spdr 9/24/09 SELL -5.0%
xrT Spdr S&p rETAIL ETF 9/25/09 BUY 5.0%
Cash Allocation
MMKT MOO MAnAgEd ACCOUnT CASH 6/30/09 100.0%
MMKT MOO MAnAgEd ACCOUnT CASH 7/22/09 2.0%
MMKT MOO MAnAgEd ACCOUnT CASH 8/13/09 2.0%
MMKT MOO MAnAgEd ACCOUnT CASH 9/8/09 2.0%
MMKT MOO MAnAgEd ACCOUnT CASH 9/30/09 2.0%
= trade not represented in pie charts
MOO-FF-09/09
June 30, 2009
September 8, 2009
September 30, 2009
July 22, 2009
August 13, 2009
Active Management 3Q09
The charts below illustrate the holdings in the Stadion Managed Growth Fund for various periods during the third quarter of 2009. The table to the right shows the trades we made in the Stadion Managed Growth Fund throughout the quarter. (The Stadion Actively Managed ETF Fund invests 100% into the Stadion Managed Growth Fund).
Fund Facts as of 9.30.09
number of ETFS held During Quarter 14
number of ETFS held at Quarter End 8
Quarter End Allocation
Equity ETFs 96%
Cash 4%
Stadion Actively Managed ETF Fund September 2009
61
Investment options are subaccounts in an insurance companyseparate account maintained by United of Omaha LifeInsurance Company that invests in the underlying mutualfund/collective trust investments or is managed by thespecified investment manager. All funds may not beavailable as an investment option in a plan.
The performance data given represents past performanceand should not be considered indicative of future results.Principal value and investment return will fluctuate, so thatan investor’s units when redeemed may be worth more orless than the original investment. Fund portfolio statisticschange over time. The fund is not FDIC-insured, may losevalue and is not guaranteed by a bank or other financialinstitution.
PerformanceTotal return reflects performance without adjusting foradministrative fees, but is adjusted to reflect the investmentfee. If adjusted, administrative fees would reduce theperformance quoted.
The fund’s performance is compared with that of an index.The index is an unmanaged portfolio of specified securitiesand the index does not reflect any initial or ongoingexpenses. An investor cannot invest directly in an index. Afund’s portfolio may differ significantly from the securities inthe index.
Mutual GlidePathEach Mutual GlidePath fund (e.g. 2010, 2015, etc.) invests inthe corresponding target date fund of the Callan GlidePathSeries, a collective investment trust of Wilmington TrustRISC. The Callan GlidePath Funds are not mutual funds.Rather, Wilmington Trust RISC has established a "grouptrust" within the meaning of IRS Revenue Ruling 81-100, asamended, which is managed by Callan Associates, Inc., aregistered investment advisor. The group trusts are collectiveinvestment trusts exempt from registration under theInvestment Company Act of 1940, as amended. The MutualGlidePath benchmark is a glidepath-weighted calculation ofthe Russell 1000 Index, Russell 2000 Index, MSCI ACWIex-US, Barclays Capital Aggregate Bond Index, NCREIFProperty Index, 90 Day Treasury Bill, and Barclays Capital USTIPS Index. Due to a one quarter lag in performancereporting, the monthly return of the NCREIF Property Index isestimated based on historical performance.
Best and Worst 3 Month PerformanceMorningstar calculates best and worst 3-month period (inpercentage) in-house on a monthly basis.
Best 3-month Period: The highest total return the fund hasposted in a consecutive three-month period over the trailing15 years, or if a fund does not have 15 years of history, it willgo back as far as the inception date.
Worst 3-month Period: The lowest total return the fund hasposted in a consecutive three-month period over the trailing15 years, or if a fund does not have 15 years of history, it willgo back as far as the inception date.
Growth of $10,000 GraphThe Growth of $10,000 graph shows a fund's performancebased on how $10,000 invested in the fund would havegrown over time. The returns used in the graph are notload-adjusted. The growth of $10,000 begins at the date of
the fund's inception, or the first year listed on the graph,whichever is appropriate. Located alongside the fund's graphline is a line that represents the growth of $10,000 in anindex. The inclusion of the index allows investors to comparethe performance of the fund with the performance of abenchmark index.
Composition GraphThe Long/Short/Net bar chart replaces the Composition piechart when a fund invests in shorts and derivatives. Theoverall net percentage value of each investment class isdisplayed. A short is any security in which a negativeposition is taken where the portfolio manager looks to profitfrom falling prices. A derivative is any future, forward, optionor swap contract that provides exposure to assets likestocks, bonds, or commodities. Derivatives are also used tomanage risk or to act on a view about the economy.
Investment FeeThe investment fee represents the total operating expenseratio assessed by the Fund including any investment feeassessed by United and is subject to change. The investmentfee does not include administrative fees. The investment feeand administrative fee charged to a plan will reduce theinvestment return of the Fund as set forth in the groupannuity contract.
Morningstar Rating™Often simply called the Star Rating, the Morningstar Ratingbrings load-adjustments, performance (returns) and risktogether into one evaluation. To determine a fund’s starrating for a given time period (three, five, or 10 years), thefund's risk-adjusted return is plotted on a bell curve: If thefund scores in the top 10% of its category, it receives 5 stars(Highest); if it falls in the next 22.5% it receives 4 stars(Above Average); a place in the middle 35% earns 3 stars(Average); those lower still, in the next 22.5%, receive 2stars (Below Average); and the bottom 10% get only 1 star(Lowest). The Overall Morningstar Rating is a weightedaverage of the available three-, five-, and 10-year ratings.
Morningstar ReturnThis statistic is a measurement of a fund’s excess return overa risk-free rate (the return of the 90-day Treasury bill), afteradjusting for all applicable loads and sales charges. In eachMorningstar Category, the top 10% of funds earn a HighMorningstar Return, the next 22.5% Above Average, themiddle 35% Average, the next 22.5% Below Average, andthe bottom 10% Low. Morningstar Return is measured for upto three time periods (three-, five-, and 10-years). Theseseparate measures are then weighted and averaged toproduce an overall measure for the fund. Funds with lessthan three years of performance history are not rated.
Morningstar RiskThis statistic evaluates the variations in a fund’s monthlyreturns, with an emphasis on downside variations. In eachMorningstar Category, the 10% of funds with the lowestmeasured risk are described as Low Risk, the next 22.5%Below Average, the middle 35% Average, the next 22.5%Above Average, and the top 10% High. Morningstar Risk ismeasured for up to three time periods (three-, five-, and10-years). These separate measures are then weighted andaveraged to produce an overall measure for the fund. Fundswith less than three years of performance history are notrated.
Morningstar Style Box™The Morningstar Style Box reveals a fund’s investmentstrategy. For equity funds and fixed-income fundsrespectively, the vertical axis shows the marketcapitalization of the stocks owned or the average creditquality of the bonds owned. The horizontal axis showsinvestment style (value, blend, or growth) or interest ratesensitivity as measured by a bond’s duration (short,intermediate or long). Duration is a measure of interest-ratesensitivity-the longer a fund’s duration, the more sensitivethe fund is to shifts in interest rates.
Investment RiskForeign Securities Funds/Emerging Markets Funds: Theinvestor should note that funds that invest in foreignsecurities involve special additional risks. These risksinclude, but are not limited to, currency risk, political risk,and risk associated with varying accounting standards.Investing in emerging markets may accentuate these risks.
Small Cap Funds: The investor should note that funds thatinvest in stocks of small companies involve additional risks.Smaller companies typically have a higher risk of failure, andare not as well established as larger blue-chip companies.Historically, smaller-company stocks have experienced agreater degree of market volatility than the overall marketaverage.
Mid Cap Funds: The investor should note that funds thatinvest in companies with market capitalizations below $10billion involve additional risks. The securities of thesecompanies may be more volatile and less liquid than thesecurities of larger companies.
High-Yield Bond Funds: The investor should note that fundsthat invest in lower-rated debt securities (commonly referredto as junk bonds) involve additional risks because of thelower credit quality of the securities in the portfolio. Theinvestor should be aware of the possible higher level ofvolatility, and increased risk of default.
Fund of Funds: It is important to note that an investmentoption with mutual funds in its portfolio may be subject tothe expenses of those mutual funds in addition to those ofthe investment option itself.
Investment options are offered through a group variableannuity contract (Forms 901-GAQC-07 and 901-GAQC-07(OR))issued by United of Omaha Life Insurance Company, whichaccepts full responsibility for all of United's contractualobligations under the contract but does not guarantee anycontributions or investment returns except as provided in theannuity for the Guaranteed Account. Neither United ofOmaha nor its representatives or affiliates offers investmentadvice in connection with the contract.
Disclosure
AFN42011
09-09
©2009 Morningstar, Inc., Morningstar Investment Profiles™ 312-696-6000. All rights reserved. The information contained herein: (1) is proprietary to Morningstar and/orits content providers; (2) may not be copied or distributed and (3) is not warranted to be accurate, complete or timely. Neither Morningstar nor its content providers areresponsible for any damages or losses arising from any use of information. Past performance is no guarantee of future performance. Visit our investment website atwww.morningstar.com .
Page 2 of 2
62

63

ASSESSMENT In order to choose the portfolio that best suits you, you need to evaluate the factors that will affect how much risk is appropriate for you. First, become acquainted with your investment personality and understand how you feel about risk (your Risk Tolerance). Your Investment Time Horizon (how long you have to invest your savings) is another important factor, as is your potential cash flow needs.
This worksheet will help you determine what type of investor you are. Answer the following questions and total your score for each section (time horizon, risk tolerance and personal finances). Then, add up the scores for each section for a total score. Use the scale to convert your score into one of five investment strategies.
If you’re planning to retire in five years or less, your personal situation may require more detailed planning and analysis. Please consult your personal financial advisor.
MUGC9010
TIME HORIZON The number of years until you retire or need to use the money you’ve saved.
TIME HORIZON 1. How many more years do you plan to work before
you start using your retirement savings? 30 to 40 years (10 points) 20 to 30 years (8 points) 10 to 20 years (6 points) 5 to 10 years (4 points) Less than 5 years (2 points)
2. How long do you expect to draw upon your retirement savings? 25 to 30 years (10 points) 20 to 25 years (8 points) 15 to 20 years (6 points) 10 to 15 years (4 points) Less than 10 years (2 points)
Total your Time Horizon points: _________________
RISK TOLERANCE The risk you are willing to take in exchange for the possibility of a greater return.
RISK TOLERANCE 3. Which statement best describes your investment
objective for your retirement plan? I am looking for stability of my account balance and
want to avoid any losses. (1 point)
I am looking for stability of my account, but I can accept a low to moderate amount of fluctuation in my account if I can have more growth potential. (2 points)
I am focused on growth. I am not concerned about moderate fluctuations each year. (3 points)
I am focused on growth, and I am willing to accept a higher level of risk for higher returns. (4 points)
I am seeking the most growth possible, and I am not concerned about fluctuations in the value of my account. (5 points)
I am not sure what my investment objective should be for my retirement plan account. (2 points)
4. Which statement best describes your approach as an investor? I am very cautious about taking risks, and I want to
avoid losses in my account. (1 point)
I am somewhat cautious about taking risks, and I can handle relatively small losses in my account occasionally. (2 points)
I am mixed between taking risks that are generally associated with greater account growth potential and the desire to minimize short-term losses in my account. (3 points)
I am open to taking some risks for growth potential. I am less concerned about short-term (less than one year) losses or gains; I am looking more for long-term growth in my investments. (4 points)
I am a risk taker and want to maximize the growth of my account over the next decade or longer. I am not concerned about short-term losses. (5 points)
I am not sure what type of investor I am. (2 points)
64
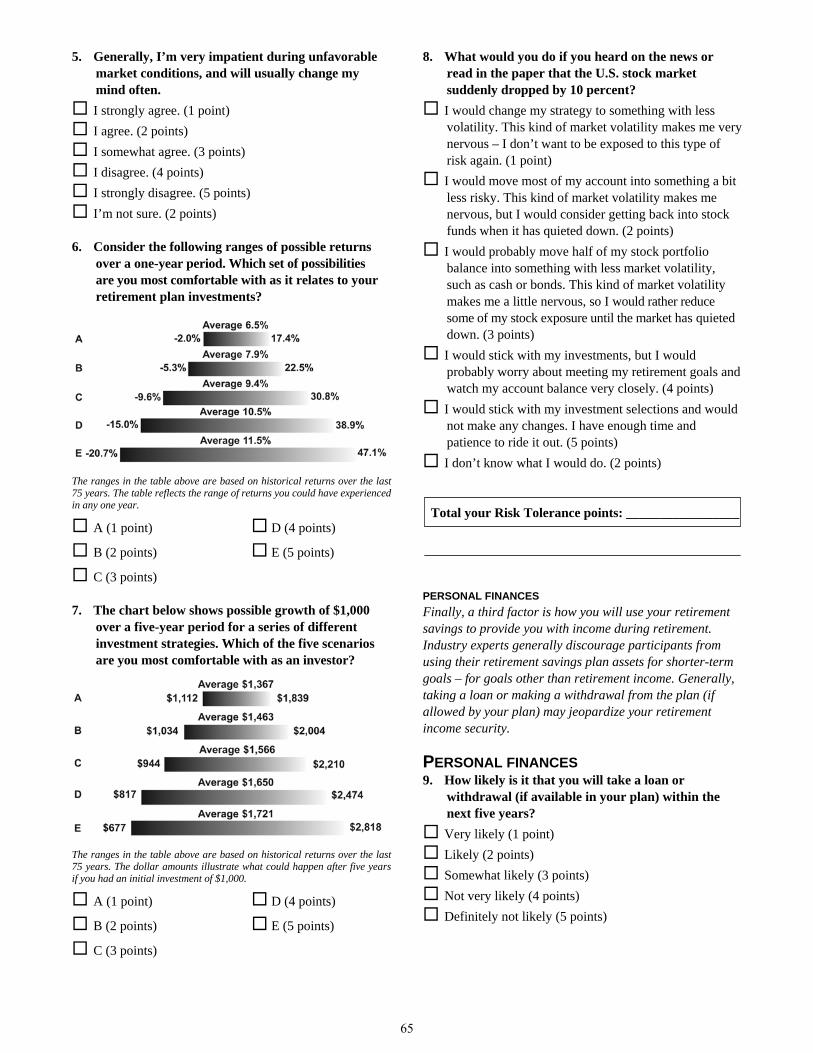
5. Generally, I’m very impatient during unfavorable market conditions, and will usually change my mind often. I strongly agree. (1 point) I agree. (2 points) I somewhat agree. (3 points) I disagree. (4 points) I strongly disagree. (5 points) I’m not sure. (2 points)
6. Consider the following ranges of possible returns over a one-year period. Which set of possibilities are you most comfortable with as it relates to your retirement plan investments?
The ranges in the table above are based on historical returns over the last 75 years. The table reflects the range of returns you could have experienced in any one year.
A (1 point) D (4 points)
B (2 points) E (5 points)
C (3 points)
7. The chart below shows possible growth of $1,000 over a five-year period for a series of different investment strategies. Which of the five scenarios are you most comfortable with as an investor?
The ranges in the table above are based on historical returns over the last 75 years. The dollar amounts illustrate what could happen after five years if you had an initial investment of $1,000.
A (1 point) D (4 points)
B (2 points) E (5 points)
C (3 points)
8. What would you do if you heard on the news or read in the paper that the U.S. stock market suddenly dropped by 10 percent? I would change my strategy to something with less
volatility. This kind of market volatility makes me very nervous – I don’t want to be exposed to this type of risk again. (1 point) I would move most of my account into something a bit
less risky. This kind of market volatility makes me nervous, but I would consider getting back into stock funds when it has quieted down. (2 points) I would probably move half of my stock portfolio
balance into something with less market volatility, such as cash or bonds. This kind of market volatility makes me a little nervous, so I would rather reduce some of my stock exposure until the market has quieted down. (3 points) I would stick with my investments, but I would
probably worry about meeting my retirement goals and watch my account balance very closely. (4 points) I would stick with my investment selections and would
not make any changes. I have enough time and patience to ride it out. (5 points) I don’t know what I would do. (2 points)
Total your Risk Tolerance points: _________________
PERSONAL FINANCES
Finally, a third factor is how you will use your retirement savings to provide you with income during retirement. Industry experts generally discourage participants from using their retirement savings plan assets for shorter-term goals – for goals other than retirement income. Generally, taking a loan or making a withdrawal from the plan (if allowed by your plan) may jeopardize your retirement income security.
PERSONAL FINANCES 9. How likely is it that you will take a loan or
withdrawal (if available in your plan) within the next five years? Very likely (1 point) Likely (2 points) Somewhat likely (3 points) Not very likely (4 points) Definitely not likely (5 points)
65

10. Do you have an emergency fund set aside to meet unexpected cash flow demands? No, I do not have money set aside for emergencies.
(1 point) I have about one month’s worth. (2 points) I have two to three months’ worth. (3 points) I have four to six months’ worth. (4 points) I have more than six months’ worth. (5 points)
Total your Personal Finance points: _______________
SCORING Add your Time Horizon, Risk Tolerance and Personal Finance scores to derive your Total Score. Match your Total Score with the scale to the right for an Asset Allocation portfolio that corresponds to your score.
Time Horizon Points: _____________________________
Risk Tolerance Points: ____________________________
Personal Finance Points: __________________________
TOTAL SCORE: _____________________________
66
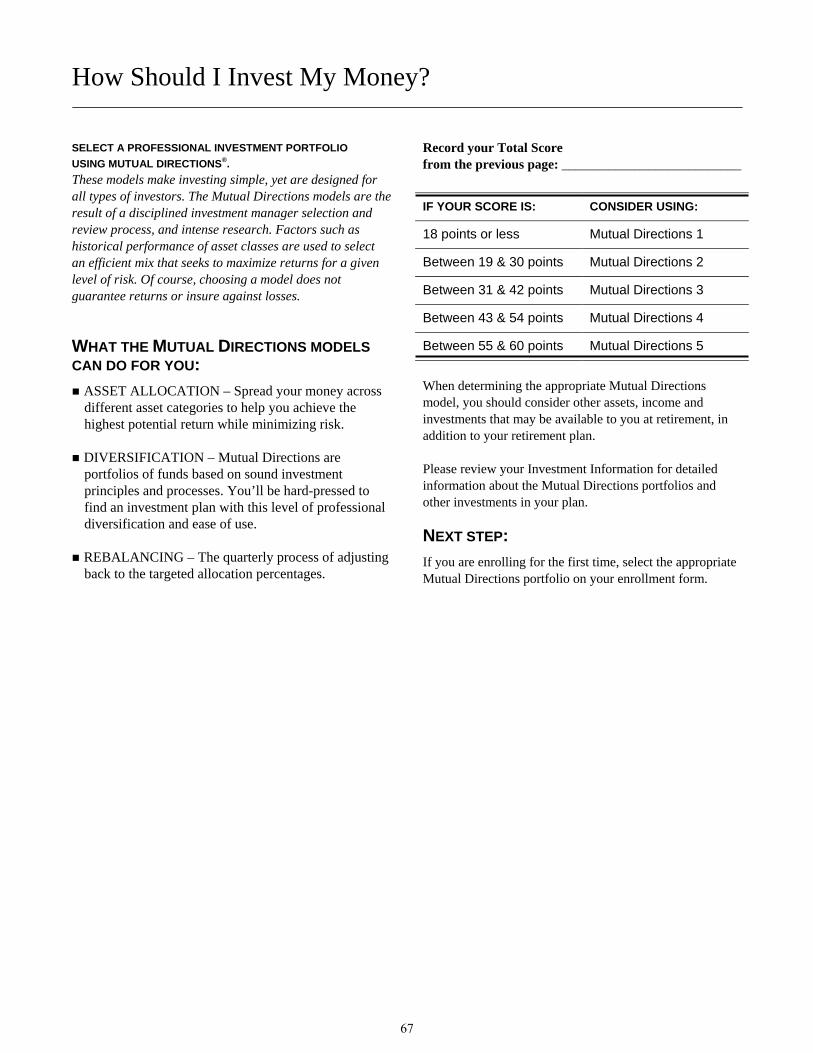
How Should I Invest My Money?
SELECT A PROFESSIONAL INVESTMENT PORTFOLIO USING MUTUAL DIRECTIONS®.
These models make investing simple, yet are designed for all types of investors. The Mutual Directions models are the result of a disciplined investment manager selection and review process, and intense research. Factors such as historical performance of asset classes are used to select an efficient mix that seeks to maximize returns for a given level of risk. Of course, choosing a model does not guarantee returns or insure against losses.
WHAT THE MUTUAL DIRECTIONS MODELS CAN DO FOR YOU: ASSET ALLOCATION – Spread your money across different asset categories to help you achieve the highest potential return while minimizing risk.
DIVERSIFICATION – Mutual Directions are portfolios of funds based on sound investment principles and processes. You’ll be hard-pressed to find an investment plan with this level of professional diversification and ease of use.
REBALANCING – The quarterly process of adjusting back to the targeted allocation percentages.
Record your Total Score from the previous page: ___________________________
IF YOUR SCORE IS: CONSIDER USING:
18 points or less Mutual Directions 1
Between 19 & 30 points Mutual Directions 2
Between 31 & 42 points Mutual Directions 3
Between 43 & 54 points Mutual Directions 4
Between 55 & 60 points Mutual Directions 5
When determining the appropriate Mutual Directions model, you should consider other assets, income and investments that may be available to you at retirement, in addition to your retirement plan.
Please review your Investment Information for detailed information about the Mutual Directions portfolios and other investments in your plan.
NEXT STEP: If you are enrolling for the first time, select the appropriate Mutual Directions portfolio on your enrollment form.
67
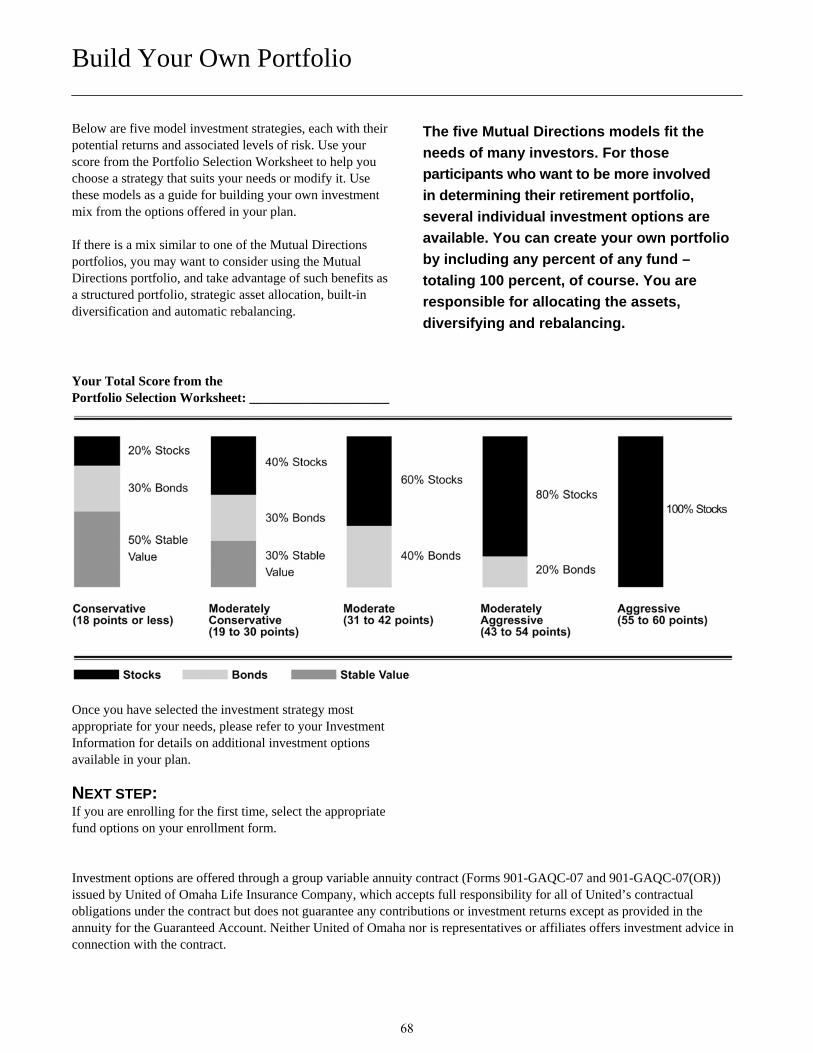
Build Your Own Portfolio
Below are five model investment strategies, each with their potential returns and associated levels of risk. Use your score from the Portfolio Selection Worksheet to help you choose a strategy that suits your needs or modify it. Use these models as a guide for building your own investment mix from the options offered in your plan.
If there is a mix similar to one of the Mutual Directions portfolios, you may want to consider using the Mutual Directions portfolio, and take advantage of such benefits as a structured portfolio, strategic asset allocation, built-in diversification and automatic rebalancing.
Your Total Score from the Portfolio Selection Worksheet: _____________________
Once you have selected the investment strategy most appropriate for your needs, please refer to your Investment Information for details on additional investment options available in your plan.
NEXT STEP: If you are enrolling for the first time, select the appropriate fund options on your enrollment form.
The five Mutual Directions models fit the needs of many investors. For those participants who want to be more involved in determining their retirement portfolio, several individual investment options are available. You can create your own portfolio by including any percent of any fund – totaling 100 percent, of course. You are responsible for allocating the assets, diversifying and rebalancing.
Investment options are offered through a group variable annuity contract (Forms 901-GAQC-07 and 901-GAQC-07(OR)) issued by United of Omaha Life Insurance Company, which accepts full responsibility for all of United’s contractual obligations under the contract but does not guarantee any contributions or investment returns except as provided in the annuity for the Guaranteed Account. Neither United of Omaha nor is representatives or affiliates offers investment advice in connection with the contract.
68

69
RPD309
Once you've begun making contributions and your plan is active, you can access your account anytime of the day or night with these valuable tools: 1. PARTICIPANT WEB SITE
See Quick Access for your Web Site address The information on this site will help you make informed decisions about your retirement savings. Here you can access: Account balance information Investment election changes* Transfers among current funds* Deferral percentage changes* Loan requests* Statements on demand Fund performance information Distribution requests* Retirement planning tools Wireless application protocol via Palm Pilot
* Available if plan allows
2. INTERACTIVE VOICE RESPONSE (IVR) SYSTEM 1-888-917-7191 This toll-free telephone system provides around-the-clock access to your account information. You can opt out of the system to speak to a customer service representative from 7 a.m. to 7 p.m. (CST) on regular business days. When you call the IVR, you'll have several options: Press 1 – Personalize PIN or Obtain Instructions on Use of the IVR Press 2 – Account Balance Options Account balance by fund ........................Press 1 Account balance by contribution ............Press 2 Fund prices..............................................Press 3 Hardship withdrawal available*..............Press 4 Request statement ...................................Press 5 Investment Fund Performance ................Press 6 Recent Account History..........................Press 7
Press 3 – Contribution Options Current contribution elections.................Press 1 Change contribution elections.................Press 2 Change deferral percentage*...................Press 3 Redemption Fee/Blocking Criteria .........Press 5 Press 4 – Balance Exchange Options Reallocate account balance .....................Press 1 Transfer (%) between specific funds.......Press 2 Transfer ($) between specific funds ........Press 4 Redemption Fee/Blocking Criteria .........Press 5 Press 5 – Loan Options* Press 8 –Return to Main Menu Press 9 – End Call Press * – Replay This Menu Press 0 – Speak to a Representative * Available if plan allows
SELECT A PIN The first time you access the Web site, you'll be asked to select a Web User ID and a Personal Identification Number (PIN). First, enter your Social Security number, date of birth and your zip code. Then, create a Web User ID between 8-25 characters with at least one alpha character. You will be asked to create a security question if you forget your Web User ID or password. You will also need to enter your email address. Next, to complete your login process you will need to select an image and create a phrase. These will automatically appear when you log in and will confirm you are on the secure participant site. Finally, choose an 8-25 character password. Our goal is to provide full access to the information you need to successfully manage your retirement plan. For more information, contact your plan administrator today.
70

71
INSTRUCTIONS TO SELECT YOUR INVESTMENT ELECTIONS VIA THE AUTOMATED TOLL-FREE NUMBER:
STEP 1 – Dial 1-888-917-7191.
STEP 2 – Enter your 9-digit Social Security number, Press #.
STEP 3 – The system will ask if you want English, Press 1, or Spanish, Press 2.
STEP 4 – Enter your 8-digit Date of Birth (MMDDYYYY), Press #.
STEP 5 – The system will request you select a 4-digit PIN. (It is recommended that you do this now.) Press 1 to personalize your PIN.
STEP 6 – Enter your new 4-digit PIN, Press #.
STEP 7 – Your PIN will be repeated; if correct, Press 1. If incorrect, Press 2 and repeat Step 6. You will receive a verbal confirmation that your PIN has been changed.
STEP 8 – Press 3 for Contributions Options.
STEP 9 – Press 2 to change your Contribution Elections. The system will voice each investment fund available to you. You will enter the percentage you want invested in each fund, followed by the #. If you do not wish to invest in a particular fund, Press 0 followed by #. Your percentages must add up to 100%. When percentages equal 100%, the system will complete the session. Please Note: A default investment election has been loaded. You are required to change or confirm this election by completing the following steps.
STEP 10 – Press 1 to change your Contribution Elections.
STEP 11 – Enter the percentage for each named fund, followed by #.
STEP 12 – You will receive a confirmation that your request has been accepted and will be applied to your account. If correct, Press 1. If incorrect, Press 2 and repeat Step 11. Your Contribution Elections have been accepted.
STEP 13 – Press 9 to end the call.
PRESS * TO REPLAY ANY CURRENT MENU OPTION
PRESS “0” TO SPEAK TO A CALL CENTER REPRESENTATIVE
BETWEEN 7:00 A.M.-7:00 P.M. CENTRAL STANDARD TIME
72
INSTRUCTIONS TO SELECT YOUR INVESTMENT ELECTIONS VIA THE PARTICIPANT WEBSITE:
TO REGISTER ON THE SITE:
STEP 1 – Log on at www.getretirementright.com.
STEP 2 – Click Participant Login – This will take you to the secure site.
STEP 3 – Click Not Registered? Sign up
STEP 4 – Click Register Me Now.
STEP 5 – Registration Inquiry – Enter your Social Security number, date of birth and home 5-digit ZIP code. Click Continue. Note: Use the format listed on the screen for entering the Social Security number and Date of Birth.
STEP 6 – Create Web User ID – Enter a Web User ID (8-25 characters, alpha and numeric). Confirm your Web User ID. Establish a security question and answer the question. Enter your e-mail address.
STEP 7 – Select an image and create a phrase. These will automatically appear on future logons and will confirm you are on the secure participant site.
STEP 8 – Establish a password (8-25 alpha, numeric and special characters) for future use. Enter your new password and re-enter your new password again for verification. Click Submit.
STEP 9 – You will receive a confirmation message when your registration is successful. Click OK.
TO MAKE/ CHANGE YOUR INVESTMENT ELECTIONS:
STEP 1 – Click Your Account from the blue navigation bar at the top.
STEP 2 – Click Account Modifications from the blue navigation bar at the top.
STEP 3 – Click Change Contribution Elections.
STEP 4 – Select the fund(s) you want to invest in by clicking on the Select box next to the fund. This action will move the selected fund(s) to the upper section of the box. Enter the percentage(s) in the New Election % box for the appropriate fund(s). Your investment election will be applied to all contribution sources available in your plan. (Your contribution elections must equal 100%.) Please disregard the Current Election % box. You must enter an election in the New Election % box even if you elect not to participate. Click Save.
STEP 5 – Contribution Elections Confirmation will display your new contribution elections. Click Exit.
STEP 6 – You have now completed the investment election process. Click Logout from the top navigation bar.
73
RPD530
Mutual of Omaha 401(k) Long-Term Savings Plan PARTICIPANT NOTICE REGARDING DEFAULT INVESTMENTS This notice provides information on what happens to your retirement funds in your company’s defined contribution plan if you fail to make elections for the investment of your funds. As a participant in your employer’s Plan, you have the right to decide how your salary deferrals and any company contributions allocated to you are invested. In the situations where you fail to provide investment directions, your funds will be invested in your Plan’s “default investment.” If you do not provide investment directions to Mutual of Omaha for these contributions within at least 30 days after this notice, your funds will be invested in a “default investment” selected by your employer. Your Plan’s default investment is the target maturity fund series known as the Mutual GlidePathSM funds. The default investment is intended to qualify as a “qualified default investment alternative” or “QDIA” under Department of Labor regulations. The QDIA is described in more detail below in the paragraph titled “Description of the QDIA.”
You can transfer your funds out of the default investment and into another investment alternative available under your Plan at any time without financial penalty, by contacting Mutual of Omaha Participant Call Center at 888-917-7191 or via www.GetRetirementRight.com. You can find information about the Plan’s other investment alternatives by visiting your Plan provider’s Web site at www.GetRetirementRight.com. Description of the QDIA – The QDIA selected by your employer as the Plan’s default investment is the target maturity fund series known as the Mutual GlidePathSM funds. The Mutual GlidePath funds are a series of diversified investment funds based on a participant’s projected retirement age. The funds are issued in five year intervals, beginning with 2005 and ending with 2055, with each fund targeting a specific retirement date. For example, the Mutual GlidePath 2035 is designed for those participants who plan to retire within five years of the year 2035. Mutual GlidePath portfolios are designed to help investors achieve a broadly diversified portfolio that will gradually become more conservative in its allocation as the target retirement date nears. The default investment for a participant will be the fund with the target maturity date nearest the date the participant attains age 65. The Mutual GlidePath funds invest in the corresponding Callan GlidePath funds, which are a target maturity fund series, held under a bank collective trust managed by AST Capital Trust Company. Each Callan GlidePath fund invests in other funds that provide a diversified mix of asset classes and investment styles, including fixed income investments and domestic and foreign equity investments. The investment fee charged by each fund will vary based on the fees charged by the underlying funds. The average investment fee for the funds is approximately 0.90%.
74

75
ROLLOVER INFORMATION
RPD000
Attached are the Rollover Contribution forms for the Mutual of Omaha 401(k) Long-Term Savings Plan. Both rollover enrollment forms need to be completed. The first form provides us with information regarding the distribution. We will also need a copy of the IRS determination letter from your previous employer’s Plan. This can generally be requested from the employer’s Human Resource/Benefit department, or the Plan’s administrator. You will also need to make a decision regarding what investment vehicle(s) should be used for the rollover contributions. The Rollover Contribution Form allows you to make your investment elections for this contribution. Please note that the Plan cannot accept Rollover Contributions of previously taxed amounts. A participant may request a partial or total distribution of the Rollover Account to be made directly to the Participant or as a Direct Rollover subject to the provision of the Plan. IRA (except conduit IRAs) and SEP accounts are not eligible for rollover to the 401(k) Plan. The money being rolled over also must not include any voluntary after-tax contributions. The plan is the Mutual of Omaha 401(k) Long-Term Savings Plan. Make the check payable to: MG Trust Company, LLC FBO (For Benefit of) Participant’s Name The rollover check should be mailed to: Mutual of Omaha Mutual of Omaha Plaza PL – Human Resource Services Omaha, NE 68175 Please feel free to contact the Benefits Hotline on extension 2300 with any questions. Sincerely, Human Resource Services
76

77

Mutual of Omaha 401(k) Long-Term Savings Plan Rollover Contribution Name __________________________________________________________________ Employee Number ___________________ Social Security Number ________________ Date of Birth _______________________ Date of Employment ___________________ I hereby certify to Mutual of Omaha Insurance Company that: 1. $_____________ was received as a distribution from a qualified retirement plan. 2. The name of the employer was ____________________________. 3. The name of the plan was ________________________________. 4. The distribution was received from the plan by me on ______________________, 20__. 5. The distribution was made to me due to: [ ] Termination of employment on __________________, 20__. [ ] Other ____________________________________________________ (Specify) 6. The money has not been commingled with any other IRA contributions prior to rollover. 7. The money being rolled over does not include any voluntary after-tax contributions.
8. I have also attached a favorable IRS Letter of Determination from the administrator of my previous plan.
NOTE: IRA (except conduit IRAs) and SEP accounts are not eligible for rollover to the 401(k) Plan. I acknowledge that, by signing this form, I am irrevocably electing that the amount described above be treated as a rollover contribution to the Mutual of Omaha 401(k) Long-Term Savings Plan. I have also completed the Rollover Contribution Form, indicating my investment elections for this contribution. Please note that the Plan cannot accept Rollover Contributions of previously taxed amounts. Signature ______________________________ Date ________________ NOTE: PLEASE HAVE YOUR ROLLOVER CHECK PAYABLE TO: MG Trust Company LLC FBO (For Benefit of) Participant’s Name Mailing address: Mutual of Omaha Mutual of Omaha Plaza PL - Human Resource Services Omaha, NE 68175 ********************************************************************************************* Date Received HR Date Forwarded to Ascensus
78

79
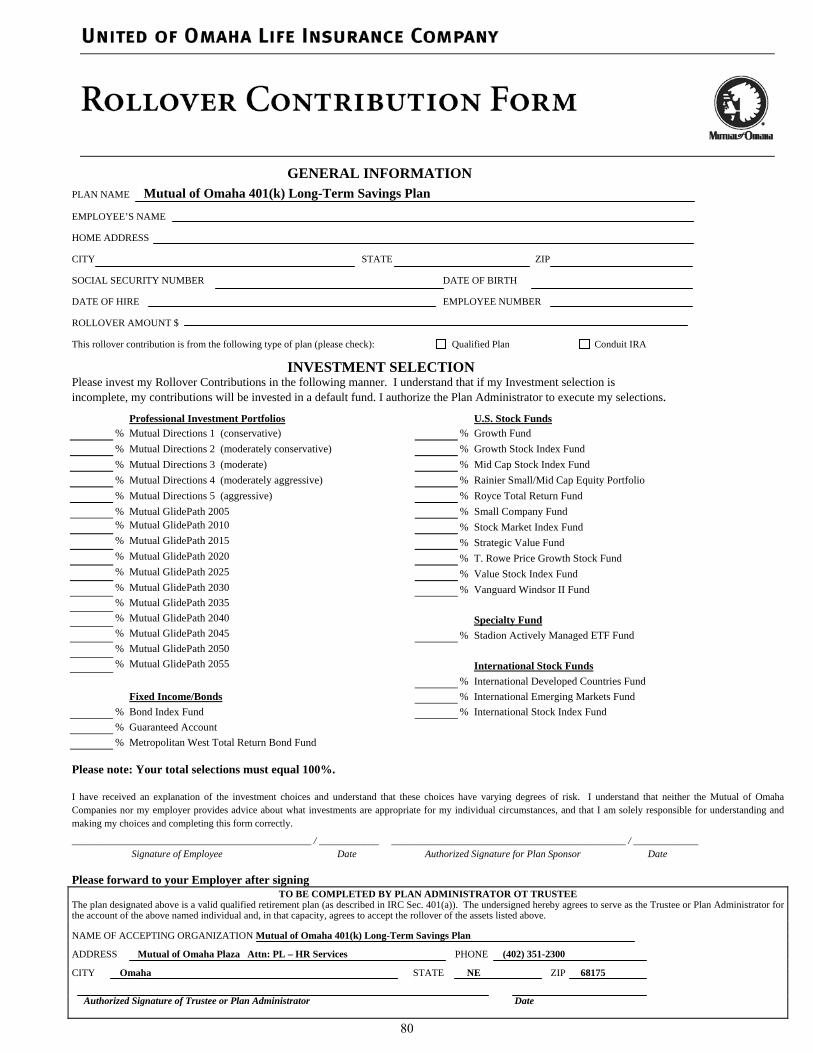
GENERAL INFORMATION PLAN NAME Mutual of Omaha 401(k) Long-Term Savings Plan EMPLOYEE’S NAME HOME ADDRESS CITY STATE ZIP SOCIAL SECURITY NUMBER DATE OF BIRTH DATE OF HIRE EMPLOYEE NUMBER ROLLOVER AMOUNT $
This rollover contribution is from the following type of plan (please check): Qualified Plan Conduit IRA
INVESTMENT SELECTION Please invest my Rollover Contributions in the following manner. I understand that if my Investment selection is incomplete, my contributions will be invested in a default fund. I authorize the Plan Administrator to execute my selections.
Professional Investment Portfolios U.S. Stock Funds % Mutual Directions 1 (conservative) % Growth Fund % Mutual Directions 2 (moderately conservative) % Growth Stock Index Fund % Mutual Directions 3 (moderate) % Mid Cap Stock Index Fund % Mutual Directions 4 (moderately aggressive) % Rainier Small/Mid Cap Equity Portfolio % Mutual Directions 5 (aggressive) % Royce Total Return Fund % Mutual GlidePath 2005 % Small Company Fund % Mutual GlidePath 2010 % Stock Market Index Fund % Mutual GlidePath 2015 % Strategic Value Fund % Mutual GlidePath 2020 % T. Rowe Price Growth Stock Fund % Mutual GlidePath 2025 % Value Stock Index Fund % Mutual GlidePath 2030 % Vanguard Windsor II Fund % Mutual GlidePath 2035 % Mutual GlidePath 2040 Specialty Fund % Mutual GlidePath 2045 % Stadion Actively Managed ETF Fund % Mutual GlidePath 2050 % Mutual GlidePath 2055 International Stock Funds % International Developed Countries Fund Fixed Income/Bonds % International Emerging Markets Fund % Bond Index Fund % International Stock Index Fund % Guaranteed Account % Metropolitan West Total Return Bond Fund Please note: Your total selections must equal 100%. I have received an explanation of the investment choices and understand that these choices have varying degrees of risk. I understand that neither the Mutual of Omaha Companies nor my employer provides advice about what investments are appropriate for my individual circumstances, and that I am solely responsible for understanding and making my choices and completing this form correctly.
________________________________________________ / ____________ _______________________________________________ / _____________ Signature of Employee Date Authorized Signature for Plan Sponsor Date
Please forward to your Employer after signing TO BE COMPLETED BY PLAN ADMINISTRATOR OT TRUSTEE
The plan designated above is a valid qualified retirement plan (as described in IRC Sec. 401(a)). The undersigned hereby agrees to serve as the Trustee or Plan Administrator for the account of the above named individual and, in that capacity, agrees to accept the rollover of the assets listed above. NAME OF ACCEPTING ORGANIZATION Mutual of Omaha 401(k) Long-Term Savings Plan ADDRESS Mutual of Omaha Plaza Attn: PL – HR Services PHONE (402) 351-2300 CITY Omaha STATE NE ZIP 68175 Authorized Signature of Trustee or Plan Administrator Date
80

81
October 2009
PLAN INFORMATION: Mutual of Omaha Insurance Company has adopted a qualified retirement plan to help you attain financial security during your retirement years. As a Participant in your Employer’s Plan, you have the responsibility to decide how you want your retirement plan account invested. This Employee Information Sheet will outline some basic information about the investments available to you under your Plan. Investment elections can be made via the web site at http://www.getretirementright.com/index.html or by calling the Customer Service number at 1.888.917.7191. You should review the following information carefully before making your investment choices. Keep this disclosure with your Summary Plan Description and other retirement plan documents. Plan Name: Mutual of Omaha 401(k) Long-Term Savings Plan ERISA SECTION 404(c) PLAN: Mutual of Omaha intends that the retirement plan you participate in satisfies the requirements of Section 404(c) of the Employee Retirement Income Security Act (ERISA) and Title 29, Code of Federal Regulations, Section 2550.404c-1. This means that your Employer is providing you with the opportunity to decide how your retirement plan dollars are invested, enabling you to choose investments that fit your personal needs. Your Employer, and other people in charge of the Plan, including fiduciaries of the Plan, will not be responsible for the investment performance of your retirement plan account which results from your investment instructions. INVESTMENT ALTERNATIVES: You may invest your retirement plan dollars in any one or more of the following alternatives: (Please refer to the investment materials relating to these investments before you actually make your investment selections.) Mutual GlidePath Series A series of target retirement date funds that seek to achieve long-term capital growth by investing in a diversified mix of asset classes and investment styles, which become increasingly conservative over time. The funds are identified by target retirement dates starting with 2005 and incrementing by 5 year intervals (e.g. Mutual GlidePath 2005, Mutual GlidePath 2010, etc.) Each of these funds invests in the Callan GlidePath funds with the same target retirement date. Mutual Directions Series A series of five asset allocation models which are composed of several different funds. Each Mutual Directions fund is made up of individual funds at certain percentages, called target percentages. The Mutual Directions funds and the target percentages of the underlying funds are as follows: Mutual Directions 1 A conservative asset allocation fund with the following asset allocation targets: 50% Stable Value Fund 30% Bond Index Fund 20% Stock Market Index Fund Mutual Directions 2 A moderately conservative asset allocation fund with the following asset allocation targets: 30% Stable Value Fund 30% Bond Index Fund 5% Strategic Value Fund 15% Stock Market Index Fund 5% Growth Fund 10% International Developed Countries Fund 5% Small Company Fund
82
October 2009
Mutual Directions 3 A moderate asset allocation fund with the following asset allocation targets: 40% Bond Index Fund 10% Strategic Value Fund 15% Stock Market Index Fund 10% Growth Fund 15% International Developed Countries Fund 10% Small Company Fund Mutual Directions 4 A moderately aggressive asset allocation fund with the following asset allocation targets: 20% Bond Index Fund 15% Strategic Value Fund 15% Stock Market Index Fund 15% Growth Fund 15% International Developed Countries Fund 15% Small Company Fund 5% Emerging Markets Index Fund Mutual Directions 5 An aggressive asset allocation fund with the following asset allocation targets: 20% Strategic Value Fund 15% Stock Market Index Fund 20% Growth Fund 20% International Developed Countries Fund 20% Small Company Fund 5% Emerging Markets Index Fund Descriptions of each of the underlying investments of the Mutual Directions funds are listed below. With the exception of the Stable Value Fund, the Emerging Markets Index Fund and other funds as indicated, each of these funds is also available as an investment option independent of the asset allocation funds. The more aggressive the fund, the greater potential for risk and return. A more aggressive fund historically provides greater investment returns over time, but also has periods during which the fund goes down in value. The diversification of an investment option is also relevant. Diversification refers to the extent to which a fund is invested in more than one asset. Generally, the more diversified an investment the less risk is involved. All of the investment options are diversified in that they invest in more than one stock or bond. Some options, like index funds, are more diversified because they invest in more stocks or bonds, while others diversify further by investing in more than one type of stock or bond or by investing in stocks and bonds (e.g., the Mutual Directions funds described above). Stable Value Fund This fund is not available as an individual option. However, it is used as an underlying investment component in the Mutual Directions series. A stable value fund that invests in units of the RiverSource Trust Income Fund IV, managed by Ameriprise Trust Company. This Fund strives to preserve principal and interest while maximizing current income. The Fund invests in insurance investment contracts, bank investment contracts and other book value contracts. This Fund may also invest in high-quality instruments -- government securities, time deposits, A1/P1 rated commercial paper and pooled short-term investment funds invested primarily in similar obligations. Risk and return over time are expected to be low compared with other investments in the asset allocation models.
83
October 2009
Guaranteed Account An account offered by United of Omaha Life Insurance Company to provide safety of principal and guaranteed daily compound rates of interest. Deposits are held as part of United’s general assets under the terms of a group annuity policy issued for your plan. Principal and interest are guaranteed if your plan holds the policy until applicable maturity. The general assets of United which support the Guaranteed Account and the other guaranteed policy obligations of United of Omaha are well-diversified and primarily invested in high-grade government and corporate bonds and commercial mortgages, selected for safety and stability. Returns have historically been less than those of the stock market over the long term. Risk is expected to be low. Note: Investors who redeem, transfer or exchange any amount out of the Guaranteed Account must wait sixty (60) calendar days before transferring or exchanging any amount back into the Guaranteed Account. Bond Index Fund An intermediate-term bond fund that invests in units of the State Street Global Advisors Passive Government Credit Bond Index Series Fund, a bank commingled fund, managed by State Street Global Advisors. A bank commingled fund is a trust account maintained by a bank which holds and invests the assets of multiple tax exempt retirement plans with the goal of decreased costs as compared to a mutual fund. In general, an index fund is a collection of similar securities, that are passively managed using statistical techniques to keep pace with the specified stock or bond market averages. This Fund is designed to track the Barclays Capital Government Credit Index, often used as an indicator of this segment of the U.S. bond market. The Fund invests in a broad range of high quality corporate, Treasury and agency securities. The objective of this Fund is to seek interest income. Risk is expected to be low to moderate. Metropolitan West Total Return Bond Fund An intermediate-term bond fund that invests in shares of the Metropolitan West Total Return Bond Fund managed by Metropolitan West Asset Management LLC. The Fund seeks to maximize long-term total return normally investing at least 80% of its net assets in investment grade securities. The Fund may invest up to 25% of its assets in foreign securities that are denominated in U.S. dollars. It may invest up to 15% of its assets in securities of foreign issuers that are not denominated in U.S. dollars. The Fund may invest up to 10% of its assets in emerging market foreign securities. Risk is expected to be low to moderate. International Developed Countries Fund An international stock fund that invests in shares of both the Causeway International Value Fund (managed by Causeway Capital Management, LLC) and the Artio International Equity Fund II (managed by Artio Global Management, LLC). The Causeway fund seeks to provide current income and long-term growth of income, accompanied by growth of capital. The Artio fund seeks long-term growth of capital. The overall objective of the IDCF is to seek long-term capital appreciation. Risk is expected to be high. Note: Short-term trading - the Causeway fund may impose a 2% redemption fee for purchases held less than 60 days. Redemption fees are withdrawn from the participant’s account and paid to the fund. International Emerging Markets Fund An international stock fund that invests in shares of the SSgA Emerging Markets Fund, managed by State Street Global Advisors. The Fund invests primarily in securities of companies located in countries considered to have developing or emerging economies or securities markets. The objective is to provide maximum total return, generally through capital appreciation, by investing primarily in securities of foreign issuers. Risk is expected to be high because emerging markets can be more vulnerable to economic conditions and to political and social upheaval than more developed markets. International Stock Index Fund An international stock fund that invests in units of State Street Global Advisors Daily EAFE Index Fund Series, a bank commingled fund managed by State Street Global Advisors. The Fund seeks to track the performance of an index that measures investment return of stocks from developed markets outside of North America. The Fund consists of approximately 1,000 stocks in twenty-one countries outside of North and South America representing 85% of the total market capitalization in those countries. Risk is expected to be high. Emerging Markets Index Fund This Fund is not available as an individual option. However, it is used as an underlying investment component in the Mutual Directions series. An international stock fund that invests in units of SsgA Daily MSCI Emerging Markets Index Series T Strategy, a bank commingled fund managed by State Street Global Advisors. The Fund seeks to match closely the returns of the capitalization weighted MSCI Emerging Markets Index while providing daily liquidity. Risk is expected to be high.
84
October 2009
Growth Fund A stock fund managed by RCM Capital Management LLC that invests primarily in a broadly diversified portfolio of stocks. These stocks are generally of larger U.S.-based companies that have above-average potential for growth, quality and valuation. The objective of this Fund is to provide long-term capital appreciation. Risk is expected to be moderate to high. Growth Stock Index Fund A stock fund that invests in units of State Street Global Advisors Russell 1000® Growth Index Fund Series, a bank commingled fund managed by State Street Global Advisors. The Fund seeks to track the performance of the Russell 1000 Growth Index, which measures investment returns of large capitalization growth stocks. The Fund is comprised of broadly diversified growth stocks of predominantly large U.S. Companies. Risk is expected to be moderate to high. Mid Cap Stock Index Fund A stock fund that invests in units of State Street Global Advisors S&P MidCap Index Strategy, a bank commingled fund managed by State Street Global Advisors. The Fund seeks to replicate the returns and risk characteristics of the S&P MidCap 400 Index over the long term. The Fund offers broad, low cost exposure to the stocks of medium sized U.S. companies. Risk is expected to be high. Rainier Small/Mid Cap Equity Portfolio A stock fund that invests in shares of the Rainier Small/Mid Cap Equity Portfolio managed by Rainier Investment Management. This Fund seeks to maximize long-term capital appreciation. The Fund invests primarily (at least 80% of its assets) in the equity securities of small- and mid-capitalization U.S. Companies with prospects of strong earnings growth and attractive overall business fundamentals, selling at reasonable valuations. Stock selection focuses on companies that are likely to demonstrate superior earnings growth relative to their peers, and whose equities are selling at attractive relative valuations. Risk is expected to be high. Royce Total Return Fund A stock fund that invests in shares of the Royce Total Return Fund managed by Royce & Associates. The Fund seeks both long-term growth of capital and current income by investing in a diversified portfolio of primarily dividend-paying securities issued by small- and micro-cap companies. The Fund will hold approximately 500 securities and invest at least 65% of its net assets in equity securities. At least 90% of these securities will produce dividend or interest income to the fund, and at least 65% will be issued by companies with stock market capitalizations of less than $2.5 billion at the time of investment. Risk is expected to be moderate to high. Small Company Fund A stock fund, managed by Wellington Management Company, LLP that invests primarily in stocks of small companies based in the United States with strong earnings growth and the potential for significant appreciation. The objective is to provide long-term capital appreciation. Because of the number of companies available, Wall Street analysts’ coverage of small company stock is significantly less than coverage of large corporations. As a result, investment managers with effective research capabilities can find companies with growth potential that may not be widely recognized or reflected in their stock price. Risk is expected to be high. Stock Market Index Fund A stock fund that invests in units of the State Street Global Advisors S&P 500 Flagship Series Fund, a bank commingled fund managed by State Street Global Advisors. The Fund invests in large U.S. companies, mirroring the S&P 500 Stock Index, which is often used as a general indicator of the performance of the U.S. stock market. The objective of the Fund is to provide long-term growth of principal and income. Risk is expected to be moderate to high. Strategic Value Fund A stock fund managed by Goldman Sachs Asset Management that invests in the stock market and seeks total returns through long-term growth of capital. The Fund invests primarily in large U.S. companies, focusing on quality, well-positioned business selling at compelling valuations. In general, the Strategic Value Fund can be considered a middle ground between bond funds and growth stock funds. Risk is expected to be moderate. T. Rowe Price Growth Stock Fund A stock fund that invests in shares of the T. Rowe Price Growth Stock Fund managed by T. Rowe Price Associates. The Fund seeks long-term growth of capital and, secondarily, income from dividends. The Fund invests primarily in common stocks of well-established growth companies that have the ability to pay increasing dividends through strong cash flow. Risk is expected to be moderate to high.
85

October 2009
Value Stock Index Fund A stock fund that invests in units of State Street Global Advisors Russell 1000® Value Index Strategy, a bank commingled fund managed by State Street Global Advisors. The Fund seeks to replicate the returns and characteristics of the Russell 1000 Value Index. The Fund is comprised of broadly diversified value stocks of predominantly large U.S. Companies. Risk is expected to be moderate to high. Vanguard Windsor II Fund A stock fund that invests in shares of the Vanguard Windsor II Fund that is managed by four investment advisers who are appointed by The Vanguard Group. This Fund seeks long-term growth of capital and income from dividends. The Fund invests primarily in large and medium sized companies whose stocks are considered by the fund’s advisers to be undervalued. Undervalued stocks are generally those that are out of favor with investors and currently trading at prices that, the adviser feels, are below what the stocks are worth in relation to their earnings. Risk is expected to be moderate to high. Note: Investors who redeem, transfer or exchange any amount out of this Fund must wait sixty (60) calendar days before transferring or exchanging any amount back into the Fund. Stadion Actively Managed ETF Fund A fund managed by Stadion Money Management that employs a defensive strategy using technical market indicators to guide Stadion’s decisions on where and when to best position fund assets among various market sectors to achieve the most appropriate balance of growth and safety, including investing some or all of the fund assets in cash. The Fund will invest in exchange traded funds, or ETF's. ETF's are pooled investments of stocks mirroring an index or a portion of an index, such as the S&P 500 Index. This investment is designed for investors with a long time horizon and whose primary objective is capital appreciation while balanced with capital preservation. Risk is expected to be moderate. INVESTMENT INSTRUCTIONS: You may give instructions to alter your investment selections on a daily basis using the Voice Response Unit, Call Center, or Internet site. Information on these methods and their scheduled access times is available from your employer. A method may not always be available during its scheduled access time due to, for example, routine maintenance. The following additional rules apply as to when and how you may provide investment instructions:
1. Money may be transferred between the investment options offered through the United of Omaha 401(k) product subject to any fund imposed limits on the frequency or timing of trades including redemption fees in certain funds. In addition, United reserves the right to restrict transfers by Participants who are making frequent transfers that violate United’s frequent trading policy for the 401(k) product.
2. If the Plan includes an investment option, defined in the contract as a Competing Fund, money may not be transferred
from the Guaranteed Account to the Competing Fund. It must be invested in another fund for at least 90 days before it can be transferred to the Competing Fund.
The following is a list of the fees and/or expenses which may affect your retirement plan dollars in connection with your instructions to buy or sell the investment alternatives listed above.
1. There are no sales charges for the purchases of the Mutual Directions funds, the Guaranteed Account, and the other investment alternatives offered as part of the United of Omaha group annuity. Participant-directed transfers are permitted among these investments subject to any fund imposed limits on the frequency or timing of trades, and subject to United's right to restrict transfers by Participants who are making frequent transfers that, in United's opinion, may be associated with market timing. Except as provided in #3 below, the investment alternatives do not charge fees for Plan Benefit withdrawals which include benefit payment at termination of employment, loans, hardship withdrawals, and in-service distributions after age 59 1/2.
2. The Guaranteed Account contains a market value charge in the event that the Employer directs a withdrawal prior to
the end of the applicable Maturity Account Term which does not qualify as a Plan Benefit Withdrawal as defined in the group annuity contract. Details of this charge can be found in the contract which is available from your employer for review.
3. Some funds may charge a redemption fee for purchases held only a short time (for example, less than 90 days.)
Redemption fees are withdrawn from the participant’s account and paid to the fund.
86

October 2009
ADDITIONAL INFORMATION: You may request the following additional information from the person(s) listed in the final section of this document.
1. A description of the annual operating expenses of each investment alternative which reduces your rate of return and the overall amount of such expenses shown as a percentage of average net assets of the investment alternative.
2. Copies of any prospectuses, financial statements and reports, and any other materials relating to the investment
alternatives available under the Plan if such information is provided to the Plan.
3. A list of the actual investments held in each investment alternative and the value of each of the individual investments (or the proportion of the investment alternative which it comprises).
4. With respect to each individual investment which has a fixed rate of interest and is issued by a bank, savings and loan
association or insurance company, the name of the issuer of the investment and its term and rate of return.
5. Information concerning the value of shares or units in investment alternatives available to you under the Plan, as well as the past and current investment performance of the investment alternatives.
6. Information concerning the value of shares or units in investment alternatives in which you have invested your
retirement account. DESIGNATED PLAN FIDUCIARY: Name or Title of Fiduciary Retirement Plans Committee Address Mutual of Omaha, Omaha, NE 68175 Phone (402) 351-3300 Instead of giving investment instructions and requests for additional information to the fiduciary identified above, you may give such requests to the following: Name HR Program Manager, Retirement Plans Address Mutual of Omaha Plaza, Omaha, NE 68175 Phone (402) 351-3300
87