
Munich Personal RePEc Archive - uni-muenchen.de · Munich Personal RePEc Archive ... Giuseppe...
34
Munich Personal RePEc Archive The yield curve and the prediction on the business cycle: a VAR analysis for the European Union Giuseppe Cinquegrana and Domenico Sarno Department of Law and Economics, Seconda Universit`a di Napoli, Italy January 2010 Online at http://mpra.ub.uni-muenchen.de/21795/ MPRA Paper No. 21795, posted 28. June 2010 00:43 UTC
Transcript of Munich Personal RePEc Archive - uni-muenchen.de · Munich Personal RePEc Archive ... Giuseppe...

MPRAMunich Personal RePEc Archive
The yield curve and the prediction onthe business cycle: a VAR analysis forthe European Union
Giuseppe Cinquegrana and Domenico Sarno
Department of Law and Economics, Seconda Universita di Napoli,Italy
January 2010
Online at http://mpra.ub.uni-muenchen.de/21795/MPRA Paper No. 21795, posted 28. June 2010 00:43 UTC

1
THE YIELD CURVE AND THE PREDICTION ON THE BUSINESS CYCLE: A VAR ANALYSIS FOR THE EUROPEAN UNION by Giuseppe Cinquegrana* and Domenico Sarno** ∗ Istat, Rome and Department of Law and Economics of the Second University of Naples. Italy ∗∗ Corresponding author. Department of Law and Economics of the Second University of Naples, Italy ([email protected]). ABSTRACT
The literature on the yield curve deals with the capacity to predict the future inflation and the future real growth from the term structure of the interest rates. The aim of the paper is to verify this predictive power of the yield curve for the European Union at 16 countries in the 1995-2008 years. With this regard we propose two VAR models. The former is derived from the standard approach, the later is an extended version considering explicitly the macroeconomic effects of the risk premium. We propose the estimates of the models and their out-of-sample forecasts through both the European Union GDP (Gross Domestic Product) quarterly series and the European Union IPI (Industrial Production Index) monthly series. We show that the our extended model performs better than the standard model and that the out-of-sample forecasts of the IPI monthly series are better than ones of the GDP quarterly series. Moreover the out-of-sample exercises seems us very useful because they show the crowding out arising from Lehman Brother’s unexpected crash and the becoming next fine tuning process.
JEL classification: E43, E44, E47, E52 Keywords: yield curve, monetary policy, business cycle, risk premium, real growth
Domenico Sarno, Facoltà di Economia Seconda Università di Napoli, C.so Gran Priorato di Malta, 81043 Capua (CE)

2
THE YIELD CURVE AND THE PREDICTION ON THE BUSINESS CYCLE: A VAR ANALYSIS FOR THE EUROPEAN UNION
1. Introduction
The literature on the yield curve is very extensive and we are not able to discuss it
exhaustively. The first papers investigating the relationship between the term structure
of the interest rates and the inflation and output growth go back in the 1980’s. These
analysis found that the yield curve contains more information than stock returns in order
to predict both the future inflation and the future growth of the real activities. On the
one side, Harvey (Harvey 1988,1989) introduced the methodology showing as the term
structure spread can accurately predict the GDP growth; on the other side, Mishkin
(Mishkin 1990,1991) found that through the yield curve it’s possible forecast the future
inflation deriving the model from the Fisher condition. This results have been confirmed
and extended by a lot of next papers. All of these studies dealing with the predictability
of the yield curve are devoted to US countries and they confirm that the relationship
between yield curve and inflation and output growth is highly significant. With regard
to the forecast of the output they are explicitly suggesting in a period between the 4 and
the 6 quarter ahead the “optimum” horizon and they find that an inverted yield curve
can announce an impeding recession (amongst other Chu,1993; Estrella, Hardouvelis,
1991; Estrella, Mishkin,1997, 1998). Subsequent researchs investigate on whether the
relationship between yield spread and future economic growth holds in countries other
than the United States and a lot of papers find that the term structure predicts the output
growth in several other countries, UK and Germany particularly (amongst other,
Plosser, Rouwenhorst, 1994; Davis, Henry, 1994; Davis, Fagan, 1997; Funke, 1997;
Ivanova et al., 2000). Finally, some studies are recently devoted in the EU Area and
they confirm this relationship too (Moneta, 2003; Duarte et al., 2005).

3
The main questions arising from latest contributions concern the stability over time and
across countries of the relationships (amongst other, Chauvet, Potter, 2002; Li et al.,
2003). Therefore, although the relationship is statically stronger, there are some
theoretical reasons indicating that she may be not stable. For instance, the theory
suggest that the results may be different if the economy is responding to real
(productivity) or monetary shocks, or if the central bank is targeting output or inflation.
Estrella (2004) develops an analytical model in order to explain the empirical results.
He suggests that the relationships are not structural, but are influenced by the monetary
policy regime. However, the yield curve should have predictive power for inflation and
output in most circumstances, for instance, when the monetary authority follows
inflation targeting or when he follows the Taylor rule. In all the cases, “…the
information of the yield curve can be combined with other data to form the optimal
predictors of output and inflation.” (Estrella, 2004; pag. 743). On the strictly empirical
field, Estrella et al. (2003) use new econometric techniques to test the empirical
relationships; they find that the models that predict real activity are more stable than
those that predict inflation. Chauvet and Posset (2003) use different models in order to
take into account some of the potential causes of the predictive instability of the yield
curve; they also develop a new approach to the construction of forecasting of the
recession probabilities. Ang et al. (2006) propose an dynamic model that characterizes
completely the expectations on the output growth correcting the unconstrained and
endogeneity problems arising from the previous studies.
In this paper we investigate on the yield curve and on its predictive power for the Euro
Area (fixed at 16 countries) in the 1995-2008 years. In order to forecast the future
growth of the real activities for the European Union we consider two VAR models. The
former is the standard model where the yield spread is only used to forecast the output
growth. Next, we present a more extensive model that is consistent with the

4
macroeconomic and the financial theory; it is represented by six risk adjusted equations
in order to include the impact of the market risk premium on the economic system. We
use the VAR estimations to propose the out-of-sample forecasts both for Gross
Domestic Product, GDP, (on quarterly frequency) and for Industrial Production Index,
IPI, (on monthly frequency) annual growth rate of the European Union. We use also the
monthly IPI series because they embed better the volatility of the changes of the interest
rates. This last exercise seems us very useful because it allows us to show and to
analyse the crowding out on the predictive power of the yield curve following the
explosion of the bubble at the unexpected Leman Brother’s crash and the expectations’
next fine tuning. The data source is the statistical data of the European Central Bank.
The paper is organised as follows. Besides this introduction, in section 2 we discuss
about the economics of the yield curve, while in the section 3 we investigate graphically
about the basics of the yield curve of the European Union in the involved years. In the
section 4 we present the methodology and the data of the empirical analysis. The section
5 is devoted to show the results of the VAR empirical analysis according to typical
approach, while in the section 6 we illustrate the results of the VAR estimation and
forecast according to our macroeconomic model. Finally there are some conclusive
remarks and two appendixes.
2. The economics of the yield curve
It is well known that the yield curve is defined by the term structure of the interest rates
on assets of different maturities. The slope of this curve is the differences between the
long-term and the short-term interest rates and it gives the shape of the yield curve; this
shape can differ over the time following the variations on the expectations on the
inflation rate and over business cycle.

5
Fisher equation takes into account this dynamic because it analysis the link between the
nominal yield on the different maturities r t, the real interest rate r t r and the expected
inflation rate πt e:
[1] rt = rt r + πt
e [+ rt r πt
e]
The real interest rate summarizes the real economic conditions while the expected
inflation rate is represented by the inflation premium demanded by the investors in
order to be ensured against the expected loss on the asset due to the future inflation.
Therefore, the role of the time structure of expected inflation in the shape of the yield
curve increases when the expected inflation rate is higher.
Fisher condition has to be adjusted if the uncertainty is introduced in the analysis. Given
the hypothesis of risk-aversion of the investor, there is a risk premium devoted to
compensate for the value losses. This market risk should be embedded in the nominal
yield as a risk premium component: generally longer is the maturity of a bond, greater is
the time of uncertainty and so higher is the market risk.
Therefore, considering that the term in brackets [r t r πt
e] is too small and not relevant for
the analysis, a risk adjusted Fisher equation is
[2] r t = r t r + πt
e + mrpt
where mrpt is the market risk premium at time t. Naturally, in the short term there isn’t
the risk premium because there isn’t uncertainty1.
1 Other kinds of risk premiums which should be embedded in this relationship are the liquidity risk premium and the default risk premium. Their inclusion would only complicate the analysis without changing the results; therefore in order to simplify our analysis they are excluded.

6
Since the slope of yield curve is the difference between the long-term (lr t) and short-
term interest rate (srt), we have
lr t - srt = lrt r + lπt
e + mrpt – (srt r + sπt
e)
and so
[4] lr t - srt = (lrt r - srt
r) + (lπt e - sπt
e])+ mrpt.
that is, the difference between the nominal long-term and short-term rates is the
expected change of real economic conditions (lr t r - sr t
r) plus the expected change of
inflation (lπt e - sπt
e) plus the market risk premium (mrpt).
The shape of the yield curve reflects the dynamic of these three components2. Given
that short-term yields are usually lower than long-term yields mainly because long-term
debt is less liquid and his price more volatile, a change in the shape of yield curve
during the business cycle is often due to large movements in short-term rates without
equal variations in long-term rates. Instead, a business expansion increases the short-
term rate faster than long-term rate while during a recession it falls more rapidly.
Therefore, a “normal” shaped curve is evident when the economic activity is in a steady
growth3. The inflation pressure is not high and there are not expectations on sudden
changes in the business cycle. In this context the monetary policy is implemented in a
neutral way in terms of targets as regard to the changes of the level prices or to the
extension of the output gap4.
2 Generally, four kinds of the shape of the yield curve are considered: “normal curve”, “steep curve”, “flat curve” and “inverse curve”. 3 Taylor (1998) arguments that for the U.S.A treasury bonds the yield curve takes this kind when the spread between the long-term and the short-term interest rate is the range of [1.50 , 2.50] basis points. 4 For the most Central Banks fight inflation pressures using different tools is the main task, but for some of them (for example the Federal Reserve) there is also other important missions related to stimulate economic growth and to maintain the economy close to the full employment.

7
A “steep” shaped curve signals a stag of accommodative monetary policy in order to
stimulate the economic activity. It is frequent at the trough of the business cycle and it
anticipates of some months (6-12 months) a period of economic expansion. The spread
is obviously greater than the upper limit of the one showed in the “normal shaped”5.
The change from a positive to a negative economic growth can be anticipated by a
flattening of yield curve that does not last for so too much time. A “flat” yield curve is
usually near the peak of a business cycle and it is due generally to a sharp increase in
short-term rates caused, for examples, by a strong demand for short term credit, by a
credit crunch due a monetary tightening implemented against a large inflation pressure
and by sudden movements in the expectations.
Finally, when the long-term are lower than short-term rates the yield curve is “inverse”.
This can be evident when the Central Bank implements a huge and fast restrictive
monetary policy to fight the inflationary shocks, as the ones due large and sudden
increases of the oil prices. The business cycle suddenly changes when the slope of yield
curve is negative and probably the recession is for-coming or just acting.
3. The yield curve for the European Monetary Union in 1994-2009 years.
We have determined on monthly basis the shape of the yield curve for the European
Union (at 16 countries) in the years 1994-2009 through the difference between 10-year
Euro area Government Benchmark Bond yield and Euribor 3-month interest rate6. This
5 See Taylor (1998). 6 For a detailed description of these data see next section .

8
curve with the line representing the European Central Bank (ECB) interest rate have
been plotted in Fig.17.
As it can be noted, the shape of the yield curve is asymmetric as regard to the choice of
monetary policy of the European Central Bank. When there is a monetary tightening the
ECB interest rate increases and the slope of the curve goes down. Instead, the ECB
interest rate decreases while the slope goes up when the monetary policy is
accommodating.
Then, we have proposed a classification of the shape for the EU yield curve following
the criteria by Taylor (Taylor, 1998)8. In Fig. 2 there is plotted a quarterly version of
this curve for the period 1994:Q1-2009:Q2 with the legend of the different kinds of
shape. This enables us to analyse the different stances of monetary policy and to
forecast the turning points of the business cycle.
Then, if this line is compared with the GDP of the Euro Area (chain linked) at market
prices, the relationship between the business cycle and the expectations embedded in the
slope of the term structure of the interest rates can be graphically investigate9. In the
Fig. 3 we have plotted for the quarters 1994:Q1-2009:Q2 the annual growth rate of
GDP, the yield curve slope for the EMU and the ECB interest rate. We are able to
confirm that the shape of the yield curve could be interpreted both as a predictor of the
business cycle and as a tool to explain the effects on the real economy of the
implementation of the monetary policy10.
7 The ECB rate is the reference interest rate of the European Central Bank while she is implementing the monetary policy. 8 We have considered that the yield curve is “normal” when the slope is limited in this range of basis points [1.50, 2.50]; it is a “steep curve” when the slope is higher than the upper limit of the “normal” one; it is an “inverse curve” when the slope is less than zero; it is a “flat curve” when the slope is greater than zero and lower than the inferior limit of the “normal curve”. 9 GDP is considered in annual growth rate on quarterly frequency. 10 See Howard, 1989.

9
Fig. 1 – YIELD CURVE SLOPE AND EUROPEAN CENTRAL BAN K INTEREST RATE (ECB) (Euro Area)
yield curve slope
-1.00
0.00
1.00
2.00
3.00
4.00
5.00
mar
-94
set-9
4
mar
-95
set-9
5
mar
-96
set-9
6
mar
-97
set-9
7
mar
-98
set-9
8
mar
-99
set-9
9
mar
-00
set-0
0
mar
-01
set-0
1
mar
-02
set-0
2
mar
-03
set-0
3
mar
-04
set-0
4
mar
-05
set-0
5
mar
-06
set-0
6
mar
-07
set-0
7
mar
-08
set-0
8
mar
-09
ECB rate
Fig. 2 - YIELD CURVE SLOPE RECLASSIFIED (Euro Area)
-1.00
-0.50
0.00
0.50
1.00
1.50
2.00
2.50
3.00
3.50
mar
-94
set-9
4
mar
-95
set-9
5
mar
-96
set-9
6
mar
-97
set-9
7
mar
-98
set-9
8
mar
-99
set-9
9
mar
-00
set-0
0
mar
-01
set-0
1
mar
-02
set-0
2
mar
-03
set-0
3
mar
-04
set-0
4
mar
-05
set-0
5
mar
-06
set-0
6
mar
-07
set-0
7
mar
-08
set-0
8
mar
-09
normal
steep
flat
steep
flat
normal
flat
normal
flat
inverse
steep
flat
normal
flat
yield curve slope
normal

10
Fig. 3 - YIELD CURVE SLOPE AND BUSINESS CYCLE (Euro Area)
-6.00
-4.00
-2.00
0.00
2.00
4.00
6.00
mar
-94
set-9
4
mar
-95
set-9
5
mar
-96
set-9
6
mar
-97
set-9
7
mar
-98
set-9
8
mar
-99
set-9
9
mar
-00
set-0
0
mar
-01
set-0
1
mar
-02
set-0
2
mar
-03
set-0
3
mar
-04
set-0
4
mar
-05
set-0
5
mar
-06
set-0
6
mar
-07
set-0
7
mar
-08
set-0
8
mar
-09
normal
steep
flat
steep
flat
normal
flat
normal
flat
inverse
steep
flat
normal
flat
real output
yield curve slope
ECB interest rate
normal
In the observed years a “steep curve” appears three times: on September 1994, on
September 1999 and from March to June 2009. The steeping of the yield curve in the
third quarter of 1999 points out an economic expansion achieving the peak nine months
later: on June 2000 the annual growth rate for the Euro Area of GDP (chain linked) is
equal to 4.6 %, the grater in the years from 1996 to 2009. The “steeped” section of the
curve in the second quarter of 2009 is indicating a prediction of a large boost of the
business cycle between the end of the previous year and the beginning of the actual one.
The negative stage of the economy was been foresighted too much ahead of time by an
inverted yield curve. In particular there was been a change in the direction of the yield
curve with a flattening trend started from June 2005 up to September 2007 when the
slope became negative: the “through” of the business cycle was on March 2009 after a
big fall from September 2008. Another flattening trend of the yield curve, finished at
the end of 2000, looks like to predict the fall on the business cycle culminated on March
2002 with an annual growth rate of the GDP chain linked equal to 0.5 %.

11
4. The methodology and the data for the empirical analysis
In order to analyse the relationship between the slope of the yield curve and the business
cycle in the European Monetary Union, we present two Vector Auto-Regressive
models. The former, VAR1, lies on the typical approach because it investigates only the
information embedded in the interest rate spread to forecast the output growth. Through
the latter, VAR2, we propose an alternative approach to estimate a more extensive
model that is coherent with the macroeconomic theory and to forecast from it the output
growth.
The large volatility of the short-term interest rates and the statistical assumptions
suggest that both a quarterly frequency and a monthly frequency must be consider in
order to be able to catch the underlying dynamic of the yield curve. Therefore, the
estimate and the forecast concern two different output growth indices: the Gross
Domestic Products (GDP) on quarterly basis and the Industrial Production Index (IPI)
on monthly basis.
We estimate the two models with references to the Euro Area 16. The information
source for the empirical analysis is the statistical data warehouse of the European
Central Bank (http://sdw.ecb.europa.eu/). The variables taken into account to investigate
the relationship between the slope of the yield curve and the business cycle are:
a. EONIA is the European Overnight Interest Rate for Euro Area on monthly basis from
1994:1 up to 2009:7;
b. ECB interest rate is the interest rate of European Central Bank for the main
refinancing operations. It is the fixed rate tenders (fixed rate - date of changes) on
monthly basis from 1999:1 up to 2000:5 and from 2008:10 up to 2009:7 and it is the
variable rate tenders (minimum bid rate - date of changes) from 2000:6 up to 2009:7;
c. EURIBOR3 is Euro Inter Bank Offered Rate 3-month on monthly basis from 1994:1
up to 2009:7;
d. GBBY10 is 10-year Euro area Government Benchmark Bond Yield provided by ECB
on monthly basis from 1970:1 up to 2009:7;
e. GDP is Euro area 16 (fixed composition) Gross Domestic Product at market price,
Chain linked, ECU/euro, seasonally and partly working day adjusted, mixed method of
adjustment, Annual growth rate on quarterly basis from 1996:Q1 up to 2009:Q2;
12
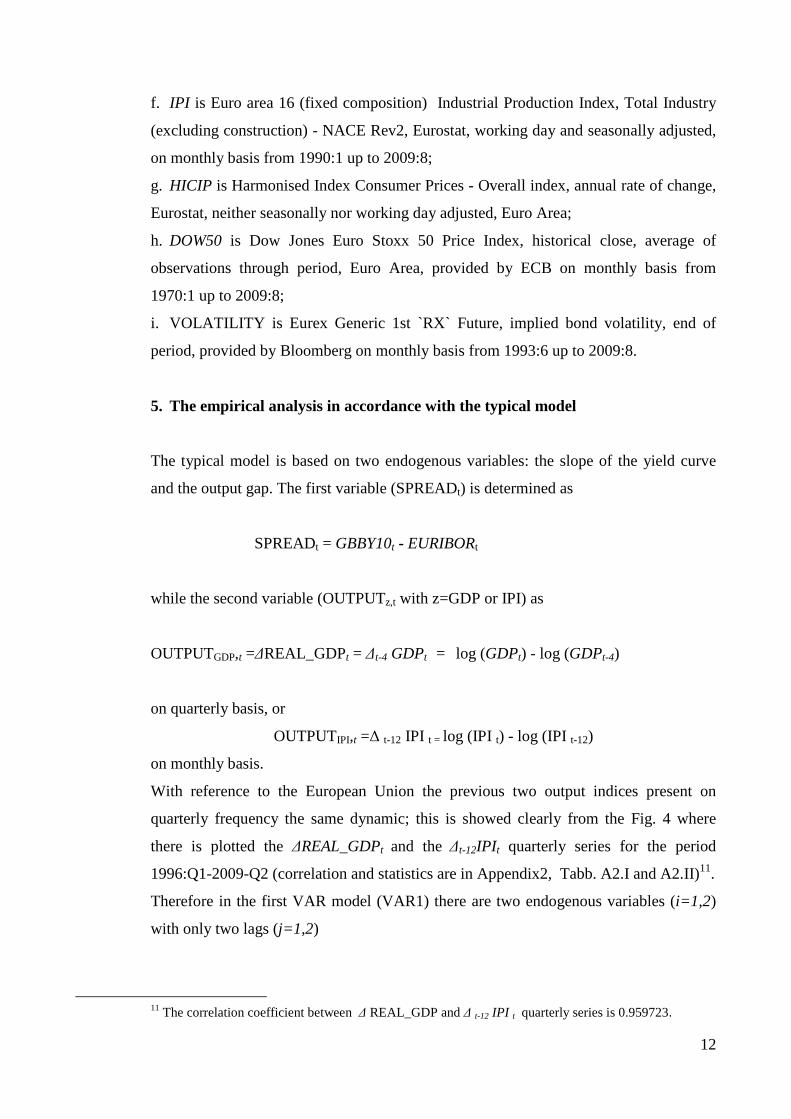
f. IPI is Euro area 16 (fixed composition) Industrial Production Index, Total Industry
(excluding construction) - NACE Rev2, Eurostat, working day and seasonally adjusted,
on monthly basis from 1990:1 up to 2009:8;
g. HICIP is Harmonised Index Consumer Prices - Overall index, annual rate of change,
Eurostat, neither seasonally nor working day adjusted, Euro Area;
h. DOW50 is Dow Jones Euro Stoxx 50 Price Index, historical close, average of
observations through period, Euro Area, provided by ECB on monthly basis from
1970:1 up to 2009:8;
i. VOLATILITY is Eurex Generic 1st `RX` Future, implied bond volatility, end of
period, provided by Bloomberg on monthly basis from 1993:6 up to 2009:8.
5. The empirical analysis in accordance with the typical model
The typical model is based on two endogenous variables: the slope of the yield curve
and the output gap. The first variable (SPREADt) is determined as
SPREADt = GBBY10t - EURIBORt
while the second variable (OUTPUTz,t with z=GDP or IPI) as
OUTPUTGDP,t =∆REAL_GDPt = ∆t-4 GDPt = log (GDPt) - log (GDPt-4)
on quarterly basis, or
OUTPUTIPI,t =∆ t-12 IPI t = log (IPI t) - log (IPI t-12)
on monthly basis.
With reference to the European Union the previous two output indices present on
quarterly frequency the same dynamic; this is showed clearly from the Fig. 4 where
there is plotted the ∆REAL_GDPt and the ∆t-12IPIt quarterly series for the period
1996:Q1-2009-Q2 (correlation and statistics are in Appendix2, Tabb. A2.I and A2.II)11.
Therefore in the first VAR model (VAR1) there are two endogenous variables (i=1,2)
with only two lags (j=1,2)
11 The correlation coefficient between ∆ REAL_GDP and ∆ t-12 IPI t quarterly series is 0.959723.

13
[5a] SPREAD t = β1,t SPREAD t-j + δ1,t OUTPUT t-j + α1 + ε1, t
[5b] OUTPUTi,t = β2,t SPREAD t-j + δ2,t OUTPUT t-j + α2 + ε2t
where SPREADt is the difference between the long-term and short-term interest rate for
t = 1,2, …,T; OUTPUTi,t is the output gap for t = 1,2, ……. T; α1 , α2 are the exogenous
variables (intercepts); βi,t and δi,t are the coefficients of the two lagged endogenous
variables; εi,t are the stochastique innovations12’13.
Fig. 4 - GDP VERSUS IPI ANNUAL GROWTH RATE (Euro A rea)
12 The assumptions about the innovations are that they may be contemporaneously correlated with each other but they are uncorrelated with their own lagged values and uncorrelated with all of the right-hand side variables respectively in the equations [5a]-[5b]. 13 If we impose that the long-run behaviour converge to their co-integrated relationships we take into account a Vector Error Correction (VEC) model, that is a restricted VAR model. In our analysis the VEC model have no trend and the cointegrating equations have an intercept. Considering just on lag we can write this simple model:
∆ t-1 SPREAD t = γ 1 (OUTPUT t-1 - µ + β 1 t SPREAD t-1 ) + ε 1 t ∆ t-1 OUTPUT t = γ 2 (SPREAD t-1 - µ + β 2 t OUTPUT t-1 ) + ε 2 t
where: - ∆ t-1 SPREAD t : the first difference in logs of the spread between the long-term and short-term interest rate for t = 1,2, ……. T , - ∆ t-1 OUTPUT t : the first difference in logs of the output gap for t = 1,2, ……. T , - γ 1 , γ 2 : the adjustment coefficients to the equilibrium. We have estimated the VEC model too; the results of this analysis are convergent to ones of the VAR model (see Tabb. A2.I e A2.II of the Appendix2).
-20
-15
-10
-5
0
5
10
96 97 98 99 00 01 02 03 04 05 06 07 08 09
∆REAL_GDP ∆t-12 IPI
Industrial production growth rate
Real output growth rate

14
The estimation of VAR equations [5a]-[5b] with GDP quarterly series with two lags for
the period 1996:Q1-2008:Q4 confirms that the information embedded in the slope of
yield curve are useful to forecast the down turning of the business cycle. The impulse
response function of ∆REAL_GDPt to innovations in SPREADt points out that the
changes in the slope of the yield curve are affecting on the business cycle with a
persistence from the 3th up to the 8th quarter later (Fig. 5). The sum of β 11 and β 12
coefficients in equation [5b] is positive and equal to 0.308 (the sum of δ11 and δ12
coefficients is 1.030) confirming the theoretical predictions; their t-students statistics are
rejecting the null hypothesis for each parameter (H 0 : β 11 = β 12 = δ 11 = δ 12 = 0 ) (see
Appendix1, Tab. A1.III).
Fig. 5 - IMPULSE RESPONSE FUNCTIONS FOR GDP IN VAR1 MODEL (Euro Area).
-0.4
-0.2
0.0
0.2
0.4
1 2 3 4 5 6 7 8 9 10 11 12
SPREAD ∆DREAL_GDP
Response of SPREAD to One S.D. Innovations
-0.4
-0.2
0.0
0.2
0.4
0.6
0.8
1 2 3 4 5 6 7 8 9 10 11 12
SPREAD ∆DREAL_GDP
Response of ∆REAL_GDP to One S.D. Innovations

15
The VAR estimations in the model with the ∆t-12IPIt monthly series with six lags
confirm the results obtained on the quarterly ones (see Appendix1 - Table A1.IV)14. The
impulse response functions of this model are plotted in Fig. 6.
Fig. 6 - IMPULSE RESPONSE FUNCTIONS FOR IPI IN VAR1 MODEL (Euro Area).
Then, we provide an exercise of the out-of-sample forecast for quarterly ∆REAL_GDPt
series and for monthly ∆t-12IPIt series according to the estimated coefficients of
equations [5a]-[5b] of the VAR1 model; the forecast method is dynamic. Both the
forecasts are plotted in the Fig. 7. In the upper side of figure (7.1) there is the forecast of
14 However the standard errors of each coefficient of the equations [5a]-[5] on monthly series are larger than the quarterly estimated ones.
-0.4
-0.3
-0.2
-0.1
0.0
0.1
0.2
0.3
1 2 3 4 5 6 7 8 9 10 11 12
SPREAD ∆t-12 IPI
Response of SPREAD to One S.D. Innovations
0.0
0.2
0.4
0.6
0.8
1.0
1.2
1.4
1 2 3 4 5 6 7 8 9 10 11 12
SPREAD ∆t-12 IPI
Response of ∆t-12 IPI to One S.D. Innovations
16
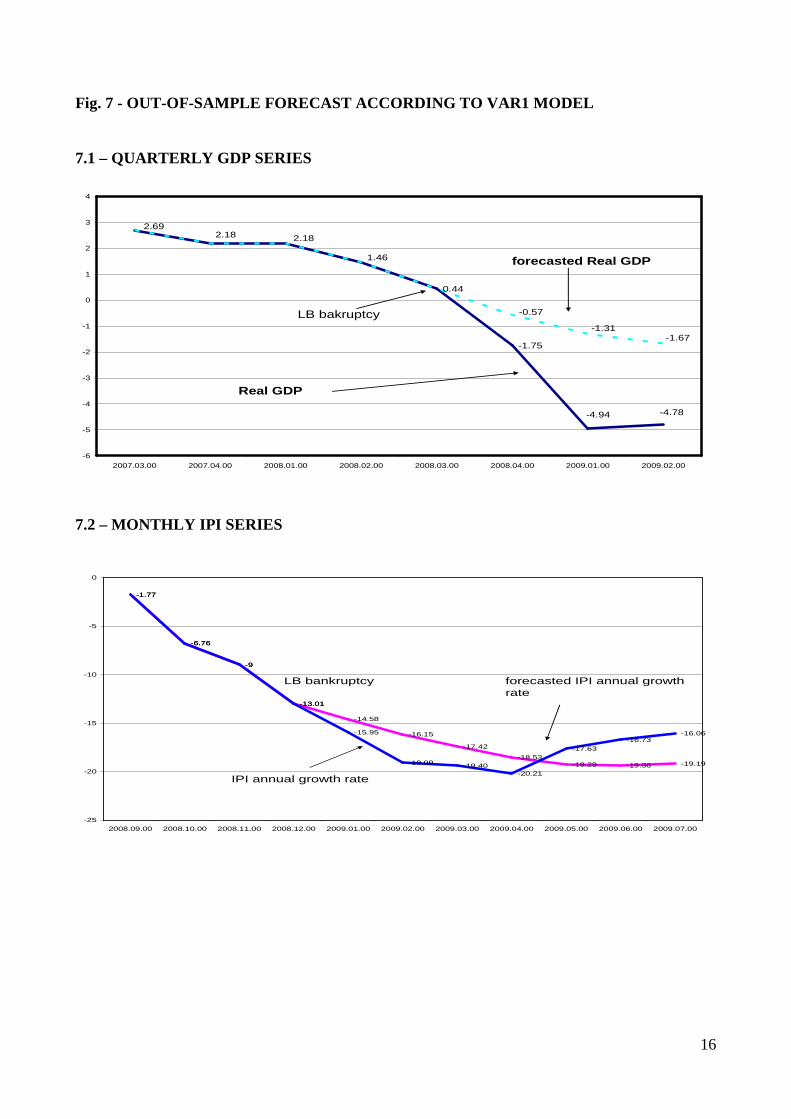
Fig. 7 - OUT-OF-SAMPLE FORECAST ACCORDING TO VAR1 M ODEL
7.1 – QUARTERLY GDP SERIES
0.44
-1.75
1.46
2.18
-4.78-4.94
-1.67-1.31
-0.57
2.692.18
-6
-5
-4
-3
-2
-1
0
1
2
3
4
2007.03.00 2007.04.00 2008.01.00 2008.02.00 2008.03.00 2008.04.00 2009.01.00 2009.02.00
Real GDP
forecasted Real GDP
LB bakruptcy
7.2 – MONTHLY IPI SERIES
-1.77
-6.76
-9
-13.01
-14.58
-16.15
-17.42
-18.53-19.29 -19.36 -19.19
-1.77
-6.76
-9
-13.01
-15.95
-19.09 -19.40-20.21
-17.63
-16.73-16.06
-25
-20
-15
-10
-5
0
2008.09.00 2008.10.00 2008.11.00 2008.12.00 2009.01.00 2009.02.00 2009.03.00 2009.04.00 2009.05.00 2009.06.00 2009.07.00
forecasted IPI annual growth rate
IPI annual growth rate
LB bankruptcy

17
∆REAL_GDPt series for the period 2008:Q4-2009:Q2; it shows that the estimated
coefficients in equations [5b] takes into accounts the expectations of a through of the
business cycle embedded in the slope of the yield curve from the end of the second
quarter of 2008. The bankruptcy of Lehman Brothers causes an acceleration in the fall
of the Gross Domestic Product (Euro Area), but the model is not able to have an precise
measure of this phenomenon even though it catches up the beginning of the recession.
In the down side of the same figure (7.2) there is the out-of-sample forecast for the
monthly ∆t-12IPIt series for the period 2009:1-2009:7; it seems to perform relatively
better than the previous forecast.
6. The analysis according to macro-finance model
According to the previous condition [4], we can note that the difference between the
nominal long-term and short-term rates is affected by the output growth, by the
innovations in the inflation rate and by the capital market risk (both equity and bond
risks). The short-term interest rate is determined by these same components on the basis
of the risk adjusted Taylor rule [Taylor, 1993]. Therefore we can say that between the
spread, the output, the innovation in the inflation rate, the short-term interest rate, the
equity risk, the bond risk there is a relationship. We present a VAR model where all of
these variables are endogenous without an identification framework in order to include
the impact of the market risk premium on the macroeconomic system. This model is
formed by six risk adjusted equations.
This different approach contains six risk adjusted equations; precisely it is formed by
the following economic models:
[6.a] - risk adjusted Fisher condition;
[6.b] - risk adjusted Taylor Rule;
[6.c] – risk adjusted Inflation Targeting Model ;
[6.d] - risk adjusted Output Gap Model ;
[6.e] - Arbitrage Pricing Theory Model15;
[6.f] – Bond Risk Premium Model.
In the model [6a]-[6f] the risk adjusted factor is the market risk premium (mrpt)
consisting of two components: the former is the equity risk premium embedded in the
equity return, RETURNt , the latter is represented by the bond risk premium, BRPt.
15 Ross, 1976.
18
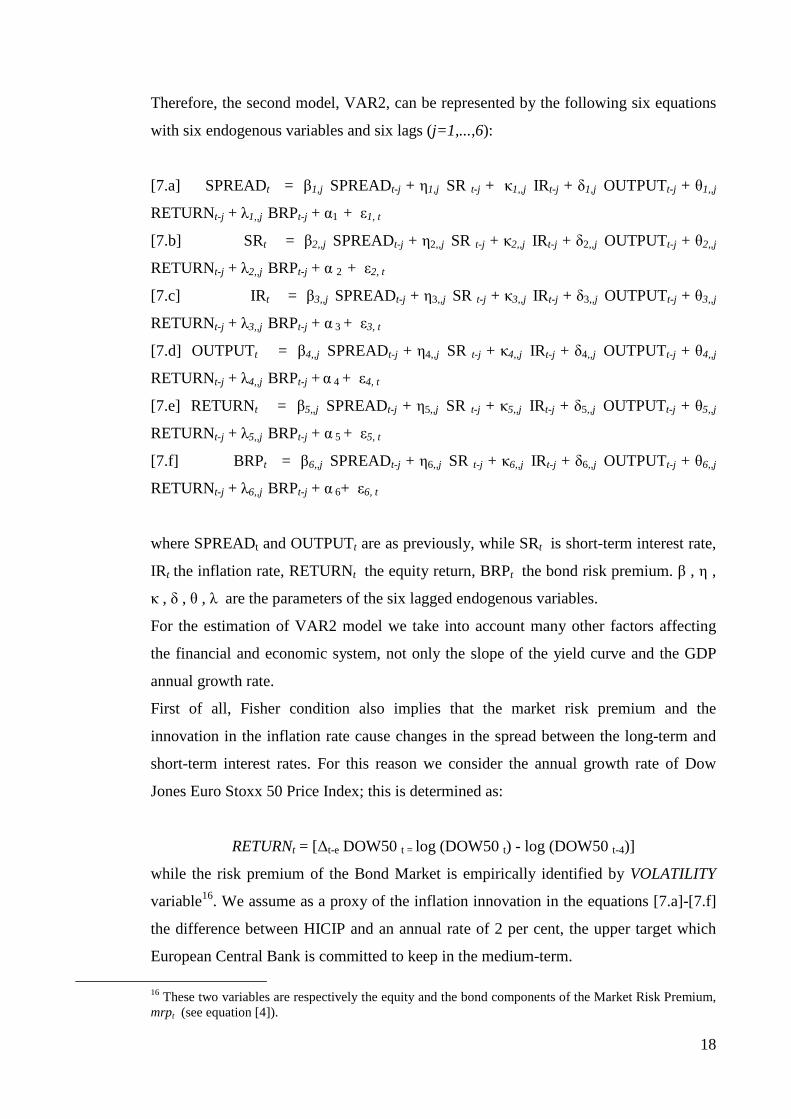
Therefore, the second model, VAR2, can be represented by the following six equations
with six endogenous variables and six lags (j=1,...,6):
[7.a] SPREADt = β1,j SPREADt-j + η1,j SR t-j + κ1,,j IRt-j + δ1,j OUTPUTt-j + θ1,,j
RETURNt-j + λ1,,j BRPt-j + α1 + ε1, t
[7.b] SRt = β2,,j SPREADt-j + η2,,j SR t-j + κ2,,j IRt-j + δ2,,j OUTPUTt-j + θ2,,j
RETURNt-j + λ2,,j BRPt-j + α 2 + ε2, t
[7.c] IRt = β3,,j SPREADt-j + η3,,j SR t-j + κ3,,j IRt-j + δ3,,j OUTPUTt-j + θ3,,j
RETURNt-j + λ3,,j BRPt-j + α 3 + ε3, t
[7.d] OUTPUTt = β4,,j SPREADt-j + η4,,j SR t-j + κ4,,j IRt-j + δ4,,j OUTPUTt-j + θ4,,j
RETURNt-j + λ4,,j BRPt-j + α 4 + ε4, t
[7.e] RETURNt = β5,,j SPREADt-j + η5,,j SR t-j + κ5,,j IRt-j + δ5,,j OUTPUTt-j + θ5,,j
RETURNt-j + λ5,,j BRPt-j + α 5 + ε5, t
[7.f] BRPt = β6,,j SPREADt-j + η6,,j SR t-j + κ6,,j IRt-j + δ6,,j OUTPUTt-j + θ6,,j
RETURNt-j + λ6,,j BRPt-j + α 6+ ε6, t
where SPREADt and OUTPUTt are as previously, while SRt is short-term interest rate,
IRt the inflation rate, RETURNt the equity return, BRPt the bond risk premium. β , η ,
κ , δ , θ , λ are the parameters of the six lagged endogenous variables.
For the estimation of VAR2 model we take into account many other factors affecting
the financial and economic system, not only the slope of the yield curve and the GDP
annual growth rate.
First of all, Fisher condition also implies that the market risk premium and the
innovation in the inflation rate cause changes in the spread between the long-term and
short-term interest rates. For this reason we consider the annual growth rate of Dow
Jones Euro Stoxx 50 Price Index; this is determined as:
RETURNt = [∆t-e DOW50 t = log (DOW50 t) - log (DOW50 t-4)]
while the risk premium of the Bond Market is empirically identified by VOLATILITY
variable16. We assume as a proxy of the inflation innovation in the equations [7.a]-[7.f]
the difference between HICIP and an annual rate of 2 per cent, the upper target which
European Central Bank is committed to keep in the medium-term.
16 These two variables are respectively the equity and the bond components of the Market Risk Premium, mrpt (see equation [4]).

19
Fig. 8 - IMPULSE RESPONSE FUNCTIONS FOR GDP IN VAR2 MODEL
-0.2
-0.1
0.0
0.1
0.2
0.3
0.4
1 2 3 4 5 6 7 8 9 10 11 12
SPREADEONIA
HICIP_2 ∆REAL_GDP∆t-4DOW50VOLATILITY
Response of SPREAD to One S.D. Innovations
-0.4
-0.2
0.0
0.2
0.4
1 2 3 4 5 6 7 8 9 10 11 12
SPREADEONIAHICIP_2
∆REAL_GDP∆t-4DOW50VOLATILITY
Response of EONIA to One S.D. Innovations
-0.2
-0.1
0.0
0.1
0.2
0.3
0.4
1 2 3 4 5 6 7 8 9 10 11 12
SPREADEONIAHICIP_2
∆REAL_GDP ∆t-4DOW50VOLATILITY
Response of HICIP_2 to One S.D. Innovations
-0.6
-0.4
-0.2
0.0
0.2
0.4
1 2 3 4 5 6 7 8 9 10 11 12
SPREADEONIAHICIP_2
∆REAL_GDP∆t-4DOW50VOLATILITY
Response of ∆REAL_GDP to One S.D. Innovations
-10
-5
0
5
10
15
1 2 3 4 5 6 7 8 9 10 11 12
SPREADEONIAHICIP_2
∆REAL_GDP ∆t-4DOW50VOLATILITY
Response of D4DOW50 to One S.D. Innovations
-0.4
-0.2
0.0
0.2
0.4
0.6
0.8
1.0
1 2 3 4 5 6 7 8 9 10 11 12
SPREADEONIAHICIP_2
∆REAL_GDP∆t-4DOW50VOLATILITY
Response of VOLATILITY to One S.D. Innovations

20
Figure 9 - IMPULSE RESPONSE FUNCTIONS FOR IPI IN VAR2 MODEL
-0.3
-0.2
-0.1
0.0
0.1
0.2
1 2 3 4 5 6 7 8 9 10 11 12
SPREADEONIA HICIP_2
∆t-12 IPI
∆t-12 DOW50VOLATILITY
Response of SPREAD to One S.D. Innovations
-0.1
0.0
0.1
0.2
0.3
1 2 3 4 5 6 7 8 9 10 11 12
SPREADEONIA HICIP_2
∆t-12 IPI
∆t-12 DOW50VOLATILITY
Response of EONIA to One S.D. Innovations
-0.10
-0.05
0.00
0.05
0.10
0.15
0.20
1 2 3 4 5 6 7 8 9 10 11 12
SPREAD EONIA HICIP_2
∆t-12 IPI ∆t-12 DOW50VOLATILITY
Response of HICIP_2 to One S.D. Innovations
-0.6
-0.4
-0.2
0.0
0.2
0.4
0.6
0.8
1.0
1 2 3 4 5 6 7 8 9 10 11 12
SPREADEONIA HICIP_2
∆t-12 IPI∆t-12 DOW50VOLATILITY
Response to ∆t-12 IPI to One S.D. Innovations
-4
-2
0
2
4 6
8
10
12
1 2 3 4 5 6 7 8 9 10 11 12
SPREAD EONIA HICIP_2
∆t-12 IPI ∆t-12 DOW50VOLATILITY
Response of D12_DOW50 to One S.D. Innovations
-0.2
0.0
0.2
0.4
0.6
0.8
1 2 3 4 5 6 7 8 9 10 11 12
SPREADEONIA HICIP_2
∆t-12 IPI
∆t-12 DOW50VOLATILITY
Response of VOLATILITY to One S.D. Innovations

21
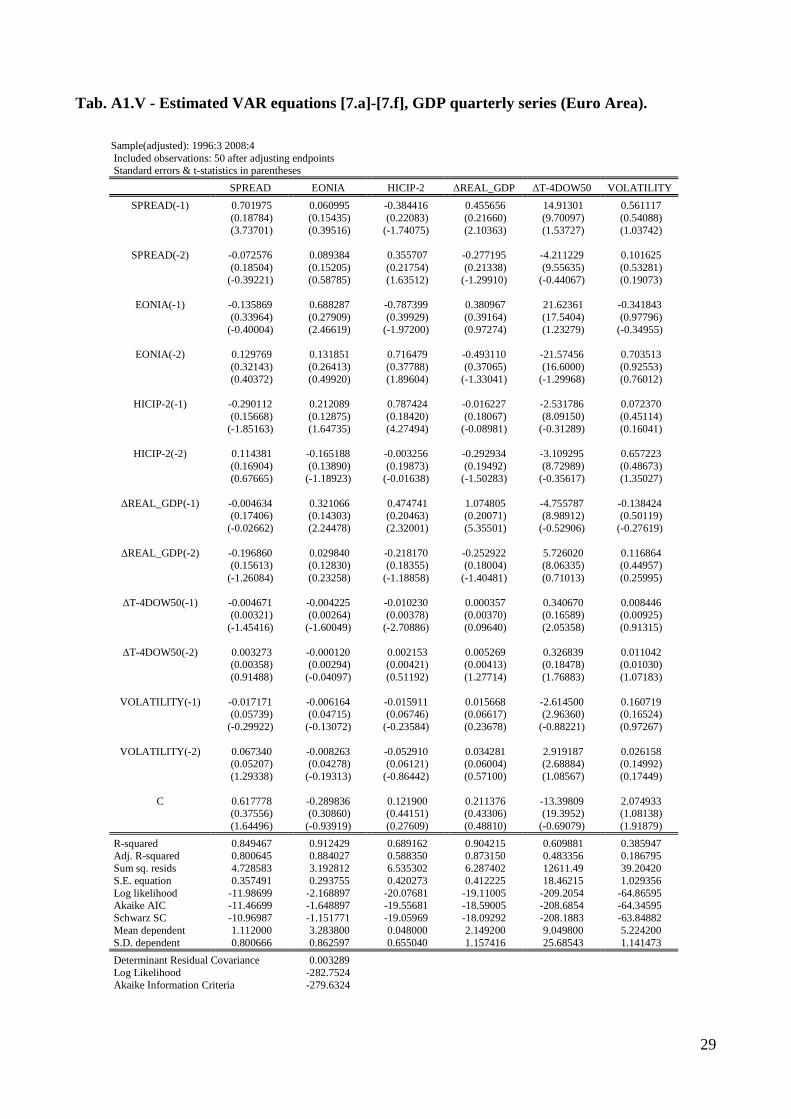
The statistics on the estimated coefficients of VAR2 model for ∆REAL_GDPt quarterly
series are reported in Appendix (see the Tab. A1.V of Appendix1)17. In particular, it can
see that the coefficients of the equation [7d] show statistical significance and have the
theoretically predicted sign. The estimation of the coefficients of equations [7.a]-[7.f] on
monthly ∆t-12IPIt series provides tatistical performance less performing than the one on
quarterly series. Both the VAR estimations with six lag of the quarterly GDP series and
of the monthly IPI series are convergent with the results obtained on the quarterly series
(see Appendix1, Tables A1.VI)18. The impulse response functions of both the models
are plotted in Figg. 8 and 9, respectively, and confirm the previous conclusions. This
enable us to present in Fig. 10 the same out-of-sample exercises in a dynamic context
for ∆REAL_GDP (for period 2008:4-2009:2) and for ∆t-12IPIt (period 2009:1-2009:7).
Both the forecasts provides results more performing than the previous exercise.
7. Concluding remarks
The paper aims to test the predictive power of the yield spreads for forecast the future
growth of the real activities in the European Union in the 1995-2008 period. With this
regard we present a version of yield curve model more explicitly founded than one
proposed by the typical approach. This model provides a contribution of efficiency in
the estimates, on monthly frequency expecially, and it allows an further in-depth
analysis about the impact on the output growth of the monetary and the financial
dynamics.
We produce the VAR estimations and the out-of-sample forecasts both for the Gross
Domestic Product (GDP) quarterly series and for Industrial Production Index (IPI)
monthly series of the EU (at 16 countries). The estimates confirm the statistical
significance of the positive relationship between the monthly changes in the slope of the
yields curve and the GDP (or IPI) growth rate on the same quarter (month) of the
previous year. In particular the impulse response function indicates that an innovation in
the change of the spread between the long-term interest rate and the short-term one is
persistent on the IPI growth rate from the 8th month and on the GDP growth rate from
the 3th quarter. The quarterly estimations show statistical significance while the monthly
17 In the equations [7.a]-[7.f] we use EONIAt variable as a proxy of the short-term rate. This solution is consistent with an econometric estimation of the parameters of a risk adjusted Talyor Rule. 18 However the standard errors of each coefficient of the equations [5a]-[5b] on monthly series are larger than the quarterly estimated ones.

22
Fig. 10 - OUT-OF-SAMPLE FORECAST ACCORDING TO VAR2 MODEL
10.1 – QUARTERLY GDP SERIES
2.69
2.18 2.18
1.46
0.44
-0.77
-1.82-2.05
2.69
2.18 2.18
1.46
0.44
-1.75
-4.78
-4.94
-6.00
-5.00
-4.00
-3.00
-2.00
-1.00
0.00
1.00
2.00
3.00
4.00
2007.03.00 2007.04.00 2008.01.00 2008.02.00 2008.03.00 2008.04.00 2009.01.00 2009.02.00
forecasted Real GDP
Real GDP
LB bankruptcy
10.2 – MONTHLY IPI SERIES
-1.77
-6.76
-9
-13.01
-14.04
-16.50 -16.75
-1.77
-6.76
-9
-13.01
-15.95
-14.82
-17.66
-17.68-17.59 -16.06-16.73
-17.63-20.21-19.4-19.09
-25.00
-20.00
-15.00
-10.00
-5.00
0.00
2008.09.00 2008.10.00 2008.11.00 2008.12.00 2009.01.00 2009.02.00 2009.03.00 2009.04.00 2009.05.00 2009.06.00 2009.07.00
IPI annual growth rate
forecasted IPI annual growth rate
LB bankruptcy

23
ones show standard errors larger. Moreover, from the analysis it is possible verify that
the IPI estimates and forecasts perform better than the GDP estimates and forecasts and
that our model version performs weakly better than one of the standard approach. The
monthly frequency of the IPI series seems to catch up the signals of the changes in the
business cycle better than quarterly frequency of the GDP series.

24
8. References
- ANG, A., PIAZZESI, M., WEI, M. (2006) - “What does the Yield Curve tell us about GDP growth?”
Journal of Econometrics, 131: 359–403.
- BURMEISTER E., WALL, K.D. (1986) - “The Arbitrage Pricing Theory and Macroeconomic Factor
Measures”, The Financial Review, 21:1-20.
- CANOVA F., DENICOLO’ (2000) – “Stock Returns, Term Structure, Inflation and Real Activity: an
International Perspective”, Macroeconomic Dynamics, 4:343-372;
- CHAUVET M., POTTER S. (2005) “Forecasting Recession Using the Yield Curve”, Journal of
Forecasting, 24:77-103;
- CHU Z. (1993) – “The Yield Curve and Real Activity”, IMF Staff Papers, 40:781-806;
- CLARIDA R., GERTLER M. AND GALÍ J. (1998) - "Monetary Policy Rules in Practice: Some
International Evidence.”, European Economic Review, 42 (6):1033-67.
- CLARIDA R., GERTLER M. AND GALÍ J. (2000), “Monetary Policy Rules and Macroeconomic
Stability: Theory and Some Evidence.”, Quarterly Journal of Economics, 115:147-180.
- DAVIS E.P., HENRY S.G.B. (1994) – “The Use of Financial Spreads as Indicator Variables:
Evidence for the United Kingdom and Germany”, IMF Staff Papers, 41: 517-525;
- DAVIS E.P., FAGAN F. (1997) – “Are Financial Spreads Useful Indicators of Future Inflation and
Output Growth in EU Countries?”, Journal of Applied Econometrics, 12: 701-714;
- DUARTE A., VENETIS I.A., PAYA I. (2005) – “Predicting Real Growth and the Probability of
Recession in the Euro Area Using the Yield Spread”, International Journal of Forecasting, 21: 261-277;
- ESTRELLA A, HARDOUVELIS G.A. (1991) – “The Term Structure as a Predictor of Real
Economic Activity”, Journal of Finance, 46: 555-576;
- ESTRELLA A. (2004) – “Why Does The Yield Curve Predict Output and Inflation?”, The Economic
Journal, 115:722-744;
- ESTRELLA A., MISHKIN F. S. (1997), “The Term Structure of Interest Rates and Its Role in
Monetary Policy for the European Central Bank”, European Economic Review, 41:1375-1401
- ESTRELLA A., MISHKIN F.S.(1998), “Predicting U.S. Recessions: Financial Variables as Leading
Indicators,” Review of Economics and Statistics, 80: 45-61;
- ESTRELLA A., RODRIGUES A.P., SCHICH S. (2003) – How Stable is the Predictive Power of the
Yield Curve? Evidence from Germany and the United States”, The Review of Economics and Statistics,
85(3).629-644;
- FAVERO C.A., KAMINSKA I., SODEBERG (2005) – “The Predictive Power of the Yield Spread:
Further Evidence and a Structural Interpretation”, CEPR Discussion Paper N. 4910;
- FUNKE N. (1997) – “Yield Spreads as Predictor of Recessions in a Core European Economic Area”,
Applied Economics Letters, 4: 695-697;
- GERTLER M., LOWN C.S. (2000) – “The Information in the High Yield Bond Spread for the
Business Cycle. Evidence and Some Implications”, NBER Working Paper N. 7549;
- HAMILTON J.D., DONG H.K. (2002), “A Re-examination of the Predictability of Economic Activity
Using the Yield Spread”, Journal of Money, Credit and Banking, 34: 340-360;

25
- HARVEY C.R. (1988) – “The Real Term Structure and Consumption Growth”, Journal of Financial
Economics, 22:305-333;
- HARVEY C.R. (1993) – “Term Structure Forecasts Economic Growth”, Financial Analyst Journal,
49(3): 6-8;
- HOWARD K. (1989) – “The yield curve as a predictor of the business cycle”, Business Economics,
October;
- HAUBRICH J.G., DOMBROSKY A. (1996) – “Predicting Real Growth Using the Yield Curve”,
Economic Review, 32:26-35;
- ILMANEN A., IWANOWSKI R., (1997) - “Dynamics of the Shape of the Yield Curve”, The Journal
of Fixed Income, 7(2):47-60;
- IVANOVA D., LAHIRI K., SEITZ F. (2000) – “Interest Rate Spreads as Predictor of German
Inflation and Business Cycles”, International Journal of Forecasting, 16: 39-58;
- LI N., AYLING D.E., HODGKINSON L., (2003) – “An Examination of the Information Role of the
Yield Spread and Stock Returns for Predicting Future GDP”, Applied Financial Economics, 13:593-597;
- MCMILLAN D.G. (2002) – “Interest Rate Spread and Real Activity: Evidence for the UK”, Applied
Economic Letters, 9:191-194;
- MISHKIN F.S. (1990) – “What Does the Term Structure tell us about Future Inflation?”, Journal of
Monetary Economics, 25:77-95;
- MISHKIN F.S. (1991) – “A Multi-Country Study of the Information in the Shorter Maturity Term
Structure about Future Inflation”, Journal of International Money and Finance, 10:2-22;
- MONETA F. (2003) – “Does the Yield Spread Predict Recessions in the Euro Area”, European
Central Bank Working Paper N. 294;
- PEEL D., TAYLOR M. (1998) – “The Slope of the Yield Curve and Real Economic Activity: Tracing
the Transmission Mechanism”, Economics Letters, 59: 353-360;
- PLOSSER C.I., ROUWENHORST K.G. (1994) – “International Term Structures and Real Economic
Growth”, Journal of Monetary Economics, 33:133-155;
- ROLL R., ROSS, S. (1980) - “An Empirical Investigation of the Arbitrage Pricing Theory”, Journal
of Finance 35(4): 1073-1103.
- ROMA A., TOROUS W. (1997) – “The Cyclical Behavior of Interest Rates”, Journal of Finance, 52:
1519-1542;
- ROSS S. (1976) – “The Arbitrage Theory of Capital Pricing”, Journal of Economic Theory, 13:341-
360;
- TASHMAN L.J. (2000) – “Out-of-sample Tests of the Term Structure of Forecast Accuracy: an
Analysis and Review”, International Journal of Forecasting, 16:437-450;
− TAYLOR J. B. (1993) - "Discretion versus Policy Rules in Practice," Carnegie-Rochester Conference
Series on Public Policy, 39:195-214.
- TAYLOR J.B. (1998) - “Investment timing and the business cycle”, John Wiley & Sons Inc., Canada.
- TAYLOR J.B. (1999) – “Monetary Policy Rules”, Chicago: Chicago University Press.
- WATKINS T. (2008) - “ Irving Fisher's Theory of Interest Rates With and Without Adjustment for
Tax Rates and Risk Premiums”, MIMEO, San José State University Economic Department-

26
Appendix1 Tab. A1.I - Correlation and statistics of IPI t and GDP t in logs (Euro Area).
LIPI LGDP
LIPI 1 0.8892
LGDP 0.8892 1
LIPI LGDP
Mean 4.567787 4.628017Median 4.570423 4.636572
Maximum 4.700208 4.750741Minimum 4.425445 4.475972Std. Dev. 0.072808 0.080089Skewness -0.070806 -0.288259Kurtosis 2.348496 2.034569
Jarque-Bera 1.000149 2.844967Probability 0.606485 0.241114
Observations 54 54
Correlation
Statistics
Tab. A1.II - Correlation and statistics of ∆ t-12 IPI t and ∆ REAL_GDP (Euro Area).
∆ t-12 IPI ∆REAL_GDP
∆REAL_GDP 0.959723 1
∆ t-12 IPI 1 0.959723
∆ t-12 IPI ∆REAL_GDP
Mean 1.006296 1.860185 Median 1.835 2.025
Maximum 5.92 4.59 Minimum -19.4 -4.94 Std. Dev. 4.850362 1.741143 Skewness -2.67573 -2.11124 Kurtosis 10.94694 9.278514
Jarque-Bera 206.532 128.8104 Probability 0 0
Observations 54 54
Correlation
Statistics

27
Tab. A1.III - Estimated VAR equations [5.a]-[5.b], GDP quarterly series (Euro Area).
Sample(adjusted): 1996:3 2008:4 Included observations: 50 after adjusting endpoints Standard errors & t-statistics in parentheses
SPREAD ∆REAL_GDP
SPREAD(-1) 0.849458 0.533289 (0.14985) (0.17471) (5.66889) (3.05247)
SPREAD(-2) -0.137119 -0.224990 (0.15548) (0.18127) (-0.88192) (-1.24115)
∆REAL_GDP(-1) -0.026141 1.418446 (0.13497) (0.15736) (-0.19368) (9.01407)
∆REAL_GDP(-2) -0.176414 -0.388200 (0.14790) (0.17244) (-1.19279) (-2.25124)
C 0.752772 -0.465340 (0.20803) (0.24254) (3.61859) (-1.91857)
R-squared 0.803460 0.872148 Adj. R-squared 0.785990 0.860783 Sum sq. resids 6.173742 8.392353 S.E. equation 0.370397 0.431853 Log likelihood -18.65398 -26.32937 Akaike AIC -18.45398 -26.12937 Schwarz SC -18.26278 -25.93817 Mean dependent 1.112000 2.149200 S.D. dependent 0.800666 1.157416
Determinant Residual Covariance 0.019376 Log Likelihood -43.30065 Akaike Information Criteria -42.90065 Schwarz Criteria -42.51825

28
TABLE A1.IV - Estimated VAR equations [5.a]-[5.b], IPI monthly series (Euro Area). Sample(adjusted): 1995:07 2008:12 Included observations: 162 after adjusting endpoints Standard errors & t-statistics in parentheses
SPREAD ∆ t-12 IPI
SPREAD(-1) 1.279885 0.031590 (0.08166) (0.48179) (15.6726) (0.06557)
SPREAD(-2) -0.512008 0.255649 (0.13231) (0.78058) (-3.86981) (0.32751)
SPREAD(-3) 0.204487 0.800375 (0.13843) (0.81670) (1.47718) (0.98001)
SPREAD(-4) -0.014183 -0.422760 (0.13231) (0.78057) (-0.10720) (-0.54161)
SPREAD(-5) 0.002319 -1.265008 (0.12503) (0.73764) (0.01855) (-1.71493)
SPREAD(-6) 0.007851 0.958435 (0.07989) (0.47132) (0.09828) (2.03349)
∆ t-12 IPI (-1) -0.032055 0.747547 (0.01411) (0.08327) (-2.27099) (8.97703)
∆ t-12 IPI (-2) 0.013275 0.439016 (0.01766) (0.10421) (0.75152) (4.21282)
∆ t-12 IPI (-3) -0.015684 0.166935 (0.01816) (0.10712) (-0.86376) (1.55834)
∆ t-12 IPI (-4) -0.002114 -0.241149 (0.01867) (0.11012) (-0.11327) (-2.18987)
∆ t-12 IPI (-5) -0.002392 -0.029239 (0.01782) (0.10515) (-0.13421) (-0.27807)
∆ t-12 IPI (-6) 0.013494 -0.089717 (0.01532) (0.09039) (0.88078) (-0.99260)
C 0.079732 -0.508507 (0.03851) (0.22720) (2.07036) (-2.23810)
R-squared 0.959797 0.886378 Adj. R-squared 0.956559 0.877228 Sum sq. resids 4.119063 143.3695 S.E. equation 0.166267 0.980924 Log likelihood 67.56159 -219.9722 Akaike AIC 67.72209 -219.8117 Schwarz SC 67.96986 -219.5639 Mean dependent 1.193827 1.866975 S.D. dependent 0.797729 2.799530
Determinant Residual Covariance 0.022502 Log Likelihood -152.4098
29
Tab. A1.V - Estimated VAR equations [7.a]-[7.f], GDP quarterly series (Euro Area).
Sample(adjusted): 1996:3 2008:4 Included observations: 50 after adjusting endpoints Standard errors & t-statistics in parentheses
SPREAD EONIA HICIP-2 ∆REAL_GDP ∆T-4DOW50 VOLATILITY
SPREAD(-1) 0.701975 0.060995 -0.384416 0.455656 14.91301 0.561117 (0.18784) (0.15435) (0.22083) (0.21660) (9.70097) (0.54088) (3.73701) (0.39516) (-1.74075) (2.10363) (1.53727) (1.03742)
SPREAD(-2) -0.072576 0.089384 0.355707 -0.277195 -4.211229 0.101625 (0.18504) (0.15205) (0.21754) (0.21338) (9.55635) (0.53281) (-0.39221) (0.58785) (1.63512) (-1.29910) (-0.44067) (0.19073)
EONIA(-1) -0.135869 0.688287 -0.787399 0.380967 21.62361 -0.341843 (0.33964) (0.27909) (0.39929) (0.39164) (17.5404) (0.97796) (-0.40004) (2.46619) (-1.97200) (0.97274) (1.23279) (-0.34955)
EONIA(-2) 0.129769 0.131851 0.716479 -0.493110 -21.57456 0.703513 (0.32143) (0.26413) (0.37788) (0.37065) (16.6000) (0.92553) (0.40372) (0.49920) (1.89604) (-1.33041) (-1.29968) (0.76012)
HICIP-2(-1) -0.290112 0.212089 0.787424 -0.016227 -2.531786 0.072370 (0.15668) (0.12875) (0.18420) (0.18067) (8.09150) (0.45114) (-1.85163) (1.64735) (4.27494) (-0.08981) (-0.31289) (0.16041)
HICIP-2(-2) 0.114381 -0.165188 -0.003256 -0.292934 -3.109295 0.657223 (0.16904) (0.13890) (0.19873) (0.19492) (8.72989) (0.48673) (0.67665) (-1.18923) (-0.01638) (-1.50283) (-0.35617) (1.35027)
∆REAL_GDP(-1) -0.004634 0.321066 0.474741 1.074805 -4.755787 -0.138424 (0.17406) (0.14303) (0.20463) (0.20071) (8.98912) (0.50119) (-0.02662) (2.24478) (2.32001) (5.35501) (-0.52906) (-0.27619)
∆REAL_GDP(-2) -0.196860 0.029840 -0.218170 -0.252922 5.726020 0.116864 (0.15613) (0.12830) (0.18355) (0.18004) (8.06335) (0.44957) (-1.26084) (0.23258) (-1.18858) (-1.40481) (0.71013) (0.25995)
∆T-4DOW50(-1) -0.004671 -0.004225 -0.010230 0.000357 0.340670 0.008446 (0.00321) (0.00264) (0.00378) (0.00370) (0.16589) (0.00925) (-1.45416) (-1.60049) (-2.70886) (0.09640) (2.05358) (0.91315)
∆T-4DOW50(-2) 0.003273 -0.000120 0.002153 0.005269 0.326839 0.011042 (0.00358) (0.00294) (0.00421) (0.00413) (0.18478) (0.01030) (0.91488) (-0.04097) (0.51192) (1.27714) (1.76883) (1.07183)
VOLATILITY(-1) -0.017171 -0.006164 -0.015911 0.015668 -2.614500 0.160719 (0.05739) (0.04715) (0.06746) (0.06617) (2.96360) (0.16524) (-0.29922) (-0.13072) (-0.23584) (0.23678) (-0.88221) (0.97267)
VOLATILITY(-2) 0.067340 -0.008263 -0.052910 0.034281 2.919187 0.026158 (0.05207) (0.04278) (0.06121) (0.06004) (2.68884) (0.14992) (1.29338) (-0.19313) (-0.86442) (0.57100) (1.08567) (0.17449)
C 0.617778 -0.289836 0.121900 0.211376 -13.39809 2.074933 (0.37556) (0.30860) (0.44151) (0.43306) (19.3952) (1.08138) (1.64496) (-0.93919) (0.27609) (0.48810) (-0.69079) (1.91879)
R-squared 0.849467 0.912429 0.689162 0.904215 0.609881 0.385947 Adj. R-squared 0.800645 0.884027 0.588350 0.873150 0.483356 0.186795 Sum sq. resids 4.728583 3.192812 6.535302 6.287402 12611.49 39.20420 S.E. equation 0.357491 0.293755 0.420273 0.412225 18.46215 1.029356 Log likelihood -11.98699 -2.168897 -20.07681 -19.11005 -209.2054 -64.86595 Akaike AIC -11.46699 -1.648897 -19.55681 -18.59005 -208.6854 -64.34595 Schwarz SC -10.96987 -1.151771 -19.05969 -18.09292 -208.1883 -63.84882 Mean dependent 1.112000 3.283800 0.048000 2.149200 9.049800 5.224200 S.D. dependent 0.800666 0.862597 0.655040 1.157416 25.68543 1.141473
Determinant Residual Covariance 0.003289 Log Likelihood -282.7524 Akaike Information Criteria -279.6324

30
Tab. A1.VI - Estimated VAR equations [7.a]-[7.f], IPI monthly series (Euro Area). Sample(adjusted): 1995:07 2008:12 Included observations: 162 after adjusting endpoints Standard errors & t-statistics in parentheses
SPREAD EONIA HICIP-2 ? T-12 IPI ? T-12 DOW50 VOLATILITY
SPREAD(-1) 1.179193 -0.104556 0.074214 0.424248 -3.875682 0.667265 (0.09138) (0.08752) (0.11623) (0.48991) (7.14184) (0.41299) (12.9041) (-1.19471) (0.63853) (0.86596) (-0.54267) (1.61570)
SPREAD(-2) -0.484393 0.280744 -0.238985 -0.137729 0.206907 -0.535581 (0.14034) (0.13440) (0.17849) (0.75237) (10.9678) (0.63423) (-3.45167) (2.08888) (-1.33893) (-0.18306) (0.01886) (-0.84445)
SPREAD(-3) 0.221756 -0.155683 0.072234 0.684432 20.50495 0.867317 (0.14964) (0.14331) (0.19032) (0.80223) (11.6947) (0.67627) (1.48197) (-1.08636) (0.37954) (0.85316) (1.75335) (1.28251)
SPREAD(-4) -0.073876 0.112746 0.141840 0.002937 -12.90291 -1.348473 (0.14698) (0.14077) (0.18695) (0.78801) (11.4874) (0.66428) (-0.50261) (0.80094) (0.75873) (0.00373) (-1.12322) (-2.02998)
SPREAD(-5) 0.103461 -0.071072 -0.073364 -1.399680 9.210657 1.477910 (0.13838) (0.13252) (0.17600) (0.74186) (10.8147) (0.62538) (0.74768) (-0.53630) (-0.41685) (-1.88671) (0.85168) (2.36323)
SPREAD(-6) -0.048221 -0.015801 -0.003472 1.068051 -7.598777 -0.282876 (0.09150) (0.08763) (0.11637) (0.49054) (7.15089) (0.41351) (-0.52702) (-0.18032) (-0.02983) (2.17732) (-1.06263) (-0.68408)
EONIA(-1) -0.229776 0.812019 0.033634 0.035739 -0.302426 0.586698 (0.10108) (0.09681) (0.12857) (0.54193) (7.90016) (0.45684) (-2.27312) (8.38790) (0.26161) (0.06595) (-0.03828) (1.28425)
EONIA(-2) 0.160538 0.266502 -0.003281 1.060061 -4.054411 0.056695 (0.12754) (0.12214) (0.16221) (0.68374) (9.96742) (0.57638) (1.25877) (2.18193) (-0.02023) (1.55038) (-0.40677) (0.09836)
EONIA(-3) -0.093475 -0.088399 -0.163539 -0.720338 16.36230 -0.115914 (0.12835) (0.12292) (0.16325) (0.68812) (10.0312) (0.58007) (-0.72828) (-0.71914) (-1.00178) (-1.04682) (1.63113) (-0.19983)
EONIA(-4) 0.100638 0.062646 0.121083 0.129889 -17.55057 -0.046091 (0.12879) (0.12335) (0.16381) (0.69049) (10.0658) (0.58207) (0.78139) (0.50789) (0.73917) (0.18811) (-1.74358) (-0.07919)
EONIA(-5) 0.147343 -0.066288 -0.082672 0.274951 10.66369 -0.614290 (0.12654) (0.12118) (0.16094) (0.67839) (9.88944) (0.57187) (1.16443) (-0.54700) (-0.51368) (0.40530) (1.07829) (-1.07417)
EONIA(-6) -0.096835 -0.015465 0.089401 -0.694428 -5.139587 0.364739 (0.09981) (0.09558) (0.12694) (0.53508) (7.80027) (0.45106) (-0.97023) (-0.16179) (0.70427) (-1.29780) (-0.65890) (0.80862)
HICIP-2(-1) 0.038183 0.105770 1.095902 1.118003 -0.006941 0.179253 (0.07039) (0.06741) (0.08953) (0.37739) (5.50145) (0.31813) (0.54244) (1.56894) (12.2406) (2.96248) (-0.00126) (0.56346)
HICIP-2(-2) -0.109313 0.016317 -0.173724 -1.391301 -1.380248 -0.204543 (0.10544) (0.10098) (0.13411) (0.56531) (8.24092) (0.47654) (-1.03669) (0.16158) (-1.29537) (-2.46113) (-0.16749) (-0.42922)
HICIP-2(-3) 0.040508 -0.047448 -0.006626 0.717379 3.229292 0.592113 (0.10665) (0.10214) (0.13565) (0.57179) (8.33536) (0.48201) (0.37981) (-0.46453) (-0.04885) (1.25462) (0.38742) (1.22844)
HICIP-2(-4) -0.044239 -0.018224 -0.055013 -0.158021 -6.100906 -0.661652 (0.10891) (0.10430) (0.13852) (0.58389) (8.51177) (0.49221) (-0.40620) (-0.17472) (-0.39715) (-0.27064) (-0.71676) (-1.34426)
HICIP-2(-5) 0.046182 -0.029857 -0.067920 -0.956219 -3.421459 0.702882 (0.10747) (0.10292) (0.13669) (0.57616) (8.39909) (0.48569) (0.42973) (-0.29010) (-0.49691) (-1.65964) (-0.40736) (1.44718)
HICIP-2(-6) -0.048469 0.011581 0.128847 0.248709 4.815903 -0.581574 (0.07688) (0.07363) (0.09779) (0.41219) (6.00878) (0.34747) (-0.63042) (0.15728) (1.31764) (0.60339) (0.80148) (-1.67375)
? T-12 IPI(-1) -0.023027 0.028591 0.091927 0.627656 -0.400003 -0.139009 (0.01770) (0.01695) (0.02251) (0.09490) (1.38337) (0.08000) (-1.30093) (1.68664) (4.08330) (6.61415) (-0.28915) (-1.73771)
? T-12 IPI(-2) 0.019388 -0.003289 -0.062226 0.347335 -0.813592 -0.024436 (0.02104) (0.02015) (0.02676) (0.11279) (1.64427) (0.09508) (0.92155) (-0.16322) (-2.32544) (3.07940) (-0.49481) (-0.25700)
? T-12 IPI(-3) -0.009786 0.003532 -0.021646 0.136046 0.748997 0.055823 (0.02064) (0.01976) (0.02625) (0.11064) (1.61288) (0.09327) (-0.47422) (0.17868) (-0.82469) (1.22963) (0.46439) (0.59853)

31
∆ T-12 IPI(-4) -0.013109 0.039861 0.033662 -0.189721 2.533220 0.189505
(0.02067) (0.01980) (0.02629) (0.11084) (1.61575) (0.09343) (-0.63411) (2.01324) (1.28020) (-1.71172) (1.56783) (2.02824)
∆ T-12 IPI(-5) -0.002376 -0.021012 0.022870 0.036981 -0.382505 -0.111548 (0.02055) (0.01968) (0.02614) (0.11019) (1.60638) (0.09289) (-0.11562) (-1.06742) (0.87482) (0.33560) (-0.23812) (-1.20085)
∆ T-12 IPI(-6) -0.000466 -0.011410 -0.035457 -0.042150 -1.022229 0.140851 (0.01721) (0.01648) (0.02189) (0.09226) (1.34496) (0.07777) (-0.02706) (-0.69233) (-1.61994) (-0.45686) (-0.76005) (1.81102)
∆ T-12 DOW50(-1) 0.000513 -0.000330 -0.002793 0.009019 0.562868 -0.003094 (0.00116) (0.00111) (0.00147) (0.00620) (0.09041) (0.00523) (0.44373) (-0.29753) (-1.89805) (1.45427) (6.22593) (-0.59174)
∆ T-12 DOW50(-2) 0.000279 0.000489 -0.002324 -0.006590 -0.119950 0.009223 (0.00135) (0.00129) (0.00172) (0.00725) (0.10567) (0.00611) (0.20598) (0.37775) (-1.35109) (-0.90908) (-1.13509) (1.50932)
∆ T-12 DOW50(-3) -0.001835 -0.000113 0.000152 -0.005099 0.267674 -0.019625 (0.00135) (0.00129) (0.00172) (0.00725) (0.10567) (0.00611) (-1.35714) (-0.08724) (0.08822) (-0.70339) (2.53316) (-3.21174)
∆ T-12 DOW50(-4) 0.000786 0.000832 0.001697 0.015786 0.067201 0.004120 (0.00137) (0.00131) (0.00174) (0.00733) (0.10690) (0.00618) (0.57454) (0.63479) (0.97545) (2.15271) (0.62865) (0.66650)
∆ T-12 DOW50(-5) 0.000592 -0.002146 -0.002008 -0.008623 -0.031764 0.001913 (0.00138) (0.00132) (0.00176) (0.00742) (0.10812) (0.00625) (0.42824) (-1.61983) (-1.14130) (-1.16262) (-0.29378) (0.30592)
∆ T-12 DOW50(-6) -0.001063 0.001345 0.001909 -0.001778 0.088974 0.004472 (0.00121) (0.00116) (0.00154) (0.00648) (0.09443) (0.00546) (-0.87998) (1.16250) (1.24248) (-0.27455) (0.94224) (0.81902)
VOLATILITY(-1) 0.012065 -0.023985 -0.031454 -0.222853 -0.298344 0.419850 (0.01927) (0.01845) (0.02451) (0.10330) (1.50584) (0.08708) (0.62619) (-1.29983) (-1.28354) (-2.15739) (-0.19812) (4.82155)
VOLATILITY(-2) 0.017762 -0.025767 -0.007715 0.082841 1.223028 -0.247311 (0.01859) (0.01780) (0.02364) (0.09966) (1.45278) (0.08401) (0.95551) (-1.44741) (-0.32634) (0.83126) (0.84185) (-2.94386)
VOLATILITY(-3) -0.017932 0.015706 0.014739 -0.136669 -2.826182 0.132338 (0.01903) (0.01822) (0.02420) (0.10200) (1.48697) (0.08599) (-0.94247) (0.86196) (0.60906) (-1.33985) (-1.90063) (1.53905)
VOLATILITY(-4) 0.017628 0.010321 0.025677 -0.003655 1.373316 0.057664 (0.01937) (0.01855) (0.02463) (0.10383) (1.51365) (0.08753) (0.91021) (0.55642) (1.04238) (-0.03520) (0.90729) (0.65879)
VOLATILITY(-5) 0.002462 -0.022383 0.019163 -0.029027 0.186125 0.015186 (0.01888) (0.01808) (0.02401) (0.10120) (1.47525) (0.08531) (0.13040) (-1.23817) (0.79819) (-0.28683) (0.12617) (0.17802)
VOLATILITY(-6) 0.010620 0.016710 0.005797 -0.020280 -0.274649 -0.165381 (0.01777) (0.01702) (0.02261) (0.09529) (1.38905) (0.08032) (0.59755) (0.98169) (0.25646) (-0.21283) (-0.19772) (-2.05892)
C 0.000234 0.101079 -0.103911 0.714884 -3.260020 2.002962 (0.10671) (0.10220) (0.13573) (0.57211) (8.34010) (0.48228) (0.00219) (0.98904) (-0.76559) (1.24955) (-0.39089) (4.15311)
R-squared 0.966913 0.981229 0.911034 0.922780 0.783600 0.632309 Adj. R-squared 0.957383 0.975822 0.885411 0.900541 0.721277 0.526414 Sum sq. resids 3.389994 3.109267 5.483891 97.43737 20706.38 69.24051 S.E. equation 0.164681 0.157715 0.209454 0.882892 12.87055 0.744261 Log likelihood 83.34018 90.34193 44.38027 -188.6887 -622.7667 -161.0172 Akaike AIC 83.79697 90.79872 44.83706 -188.2319 -622.3099 -160.5604 Schwarz SC 84.50216 91.50391 45.54225 -187.5267 -621.6047 -159.8552 Mean dependent 1.193827 3.469198 0.066667 1.866975 9.703765 5.200617 S.D. dependent 0.797729 1.014303 0.618755 2.799530 24.37872 1.081498
Determinant Residual Covariance 0.000338 Log Likelihood -731.7952 Akaike Information Criteria -729.0545 Schwarz Criteria -724.8233

32
Appendix2 Tab. A2.I - Estimated VEC equations, GDP quarterly series (Euro Area).
Sample(adjusted): 1996:4 2008:4 Included observations: 49 after adjusting endpoints Standard errors & t-statistics in parentheses
Cointegrating Eq: CointEq1
SPREAD(-1) 1.000000
DREAL_GDP(-1) 0.183773 (0.18214) (1.00894)
C -1.630281 (0.42084) (-3.87389)
Error Correction: ∆ (SPREAD) ∆ (∆REAL_GDP)
CointEq1 -0.200149 0.358580 (0.10136) (0.11680) (-1.97461) (3.07007)
∆ (SPREAD(-1)) 0.176204 0.263288 (0.15370) (0.17711) (1.14643) (1.48662)
∆ (SPREAD(-2)) 0.112854 -0.194565 (0.16098) (0.18550) (0.70102) (-1.04885)
∆ (DREAL_GDP(-1)) 0.133316 0.385774 (0.14855) (0.17117) (0.89746) (2.25372)
∆ (DREAL_GDP(-2)) -0.309717 -0.053995 (0.15379) (0.17721) (-2.01391) (-0.30470)
R-squared 0.295957 0.487513 Adj. R-squared 0.231953 0.440923 Sum sq. resids 6.161914 8.181780 S.E. equation 0.374224 0.431219 Log likelihood -18.72888 -25.67518 Akaike AIC -18.52480 -25.47110 Schwarz SC -18.33176 -25.27805 Mean dependent -0.034082 -0.068980 S.D. dependent 0.427010 0.576716
Determinant Residual Covariance 0.020156 Log Likelihood -43.40156 Akaike Information Criteria -42.87094 Schwarz Criteria -42.36903

33
Tab. A2.II - Estimated VEC equations, IPI monthly series (Euro Area). Sample(adjusted): 1995:08 2008:12 Included observations: 161 after adjusting endpoints Standard errors & t-statistics in parentheses
Cointegrating Eq: CointEq1
SPREA∆(-1) 1.000000
∆12_IPI(-1) 0.685327 (0.39312) (1.74331)
C -2.323994 (0.70786) (-3.28312)
Error Correction: ∆(SPREAD) ∆(∆12_IPI)
CointEq1 -0.036663 0.010177 (0.01139) (0.06924) (-3.21798) (0.14698)
∆(SPREA∆(-1)) 0.309850 0.054052 (0.07998) (0.48609) (3.87386) (0.11120)
∆(SPREA∆(-2)) -0.187766 0.300022 (0.08607) (0.52307) (-2.18155) (0.57358)
∆(SPREA∆(-3)) -0.009456 1.012755 (0.08706) (0.52911) (-0.10861) (1.91408)
∆(SPREA∆(-4)) 0.015150 0.641137 (0.08616) (0.52363) (0.17583) (1.22440)
∆(SPREA∆(-5)) -0.011294 -0.785671 (0.08149) (0.49525) (-0.13859) (-1.58642)
∆(SPREA∆(-6)) 0.006244 0.217488 (0.07886) (0.47924) (0.07918) (0.45382)
∆(∆12_IPI(-1)) -0.005511 -0.203281 (0.01577) (0.09584) (-0.34949) (-2.12112)
∆(∆12_IPI(-2)) 0.007618 0.249638 (0.01622) (0.09858) (0.46962) (2.53231)
∆(∆12_IPI(-3)) -0.004668 0.415316 (0.01699) (0.10325) (-0.27476) (4.02237)
∆(∆12_IPI(-4)) -0.008985 0.173572 (0.01685) (0.10238) (-0.53332) (1.69531)
∆(∆12_IPI(-5)) -0.013918 0.153081 (0.01732) (0.10523) (-0.80381) (1.45475)
∆(∆12_IPI(-6)) -0.008410 0.061265 (0.01550) (0.09418) (-0.54266) (0.65049)
R-squared 0.298576 0.245150 Adj. R-squared 0.241704 0.183945 Sum sq. resids 4.095407 151.2543 S.E. equation 0.166348 1.010935 Log likelihood 67.10973 -223.4226 Akaike AIC 67.27122 -223.2611 Schwarz SC 67.52003 -223.0123 Mean dependent -0.007391 -0.105528 S.D. dependent 0.191029 1.119086
Determinant Residual Covariance 0.023896 Log Likelihood -156.3092 Akaike Information Criteria -155.9490 Schwarz Criteria -155.3940