Mouse Models for Antibacterial PK/PD · Garenoxacin . From ICPD . ... Note: PK-PD target was net...
42
Mouse Models for Antibacterial PK/PD David Andes University of Wisconsin
Transcript of Mouse Models for Antibacterial PK/PD · Garenoxacin . From ICPD . ... Note: PK-PD target was net...

Mouse Models for Antibacterial PK/PD
David Andes University of Wisconsin
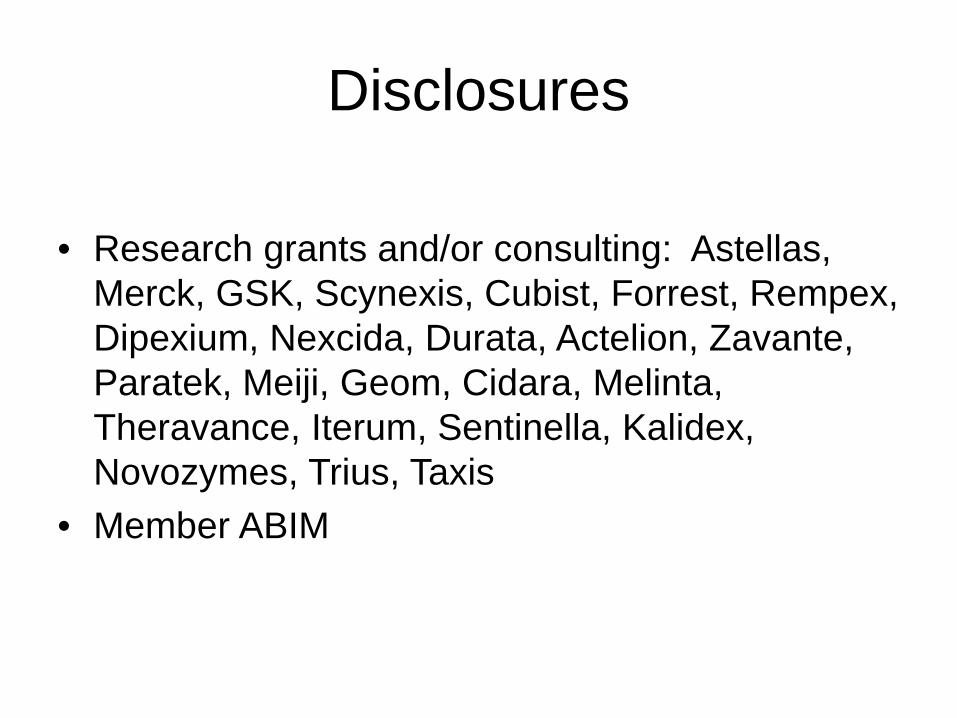
Disclosures
• Research grants and/or consulting: Astellas, Merck, GSK, Scynexis, Cubist, Forrest, Rempex, Dipexium, Nexcida, Durata, Actelion, Zavante, Paratek, Meiji, Geom, Cidara, Melinta, Theravance, Iterum, Sentinella, Kalidex, Novozymes, Trius, Taxis
• Member ABIM

Outline
• What PK/PD questions can the models address?
• What study variables impact PK/PD answers?
• Can the model PK/PD results predict clinical efficacy?

Why do we conduct PK-PD infection models?

Host
Drug
Bug
Improving the Probability of Positive Outcome

What do we do?

MIC = minimum inhibitory concentration; AUC = area under the curve; T = time
Tie Drug Potency to Antimicrobial Exposure = Pharmacodynamics
MIC Time Above MIC
Peak:MIC AUC:MIC Ratio
Time
Seru
m D
rug
Con
cent
ratio
n
MIC
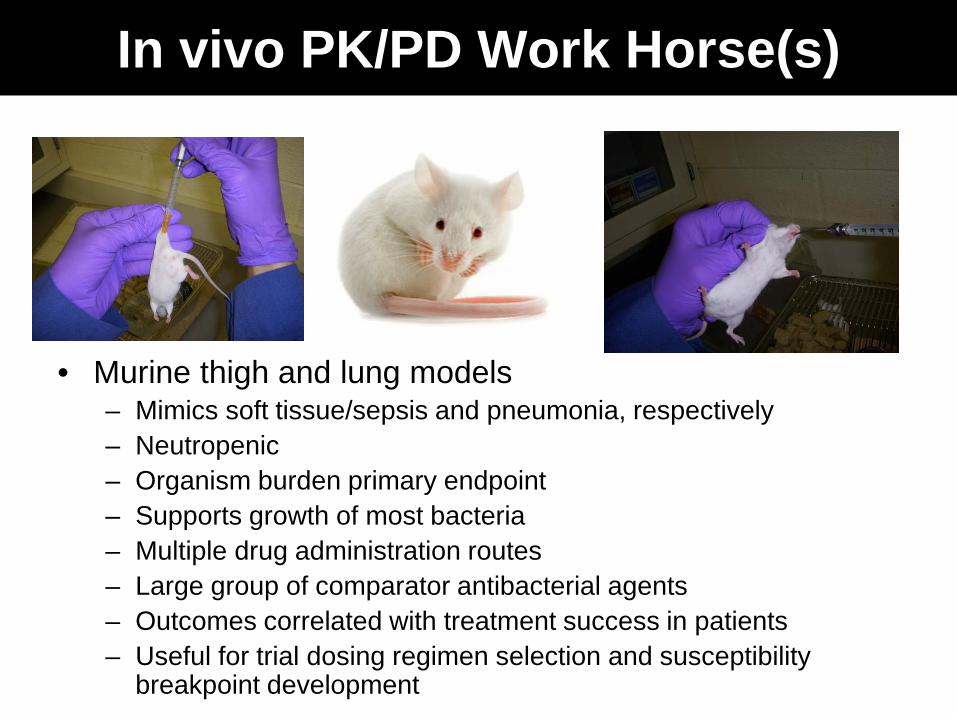
In vivo PK/PD Work Horse(s)
• Murine thigh and lung models – Mimics soft tissue/sepsis and pneumonia, respectively – Neutropenic – Organism burden primary endpoint – Supports growth of most bacteria – Multiple drug administration routes – Large group of comparator antibacterial agents – Outcomes correlated with treatment success in patients – Useful for trial dosing regimen selection and susceptibility
breakpoint development

Study Design
-2 hr
24 hr
Tnereaphy Antibiotic Therapy
Dose (mg/kg/24 h)0.1 1 10 100 1000 10000
Cha
nge
in L
og10
CFU
/Thi
ghov
er 2
4 H
ours
-4
-3
-2
-1
0
1
2
3
4
q 6h q 12h q 24 h
Infect
Bacterial Burden Assessment Pharmacodynamic Analysis

How do we determine how much and how often to administer an
antibiotic?

PK/PD Driver – Dose or Interval
Dose Level Dosing Frequency

Andes and Craig. Antimicrob. Agents Chemother. 2006;50:1376-1383
Dose Fractionation Design
Dose (mg/kg/24 h)1 10 100
Chan
ge in
Log
10 C
FU/T
high
-3
-2
-1
0
1
2
3
4
5
q3q6q12q24
Andes and Craig. Antimicrob. Agents Chemother. 2006;50:1376-1383
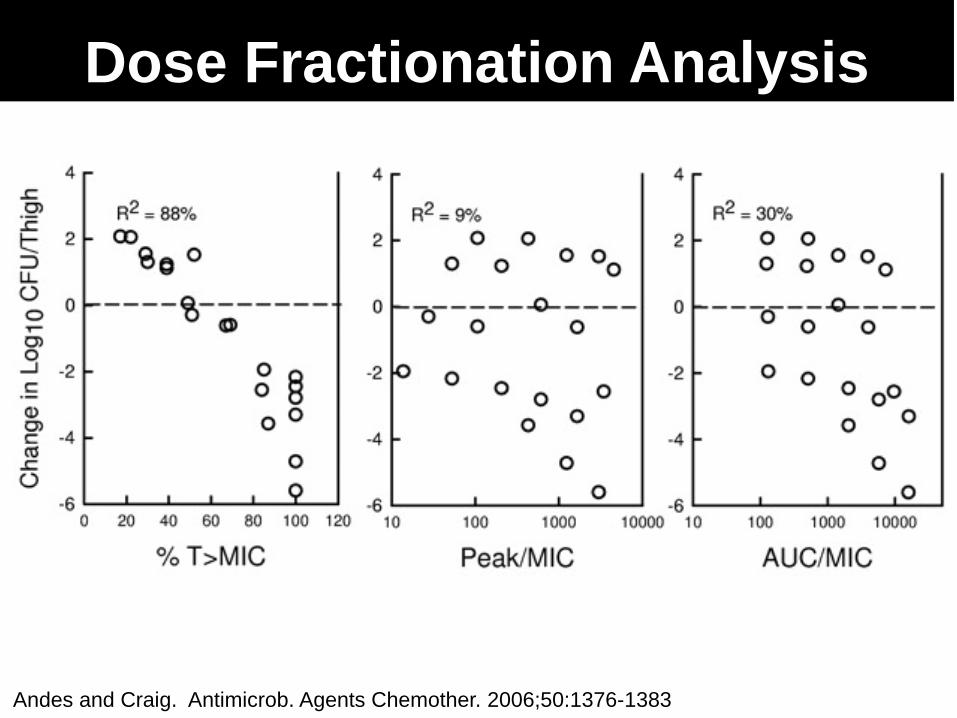
Dose Fractionation Analysis

PK/PD Patterns Activity
Pattern Antibacterial Dosing Goal Concentration-dependent killing and prolonged persistent effects
Quinolones, Aminoglycosides, Ketolides, and Daptomycin
Maximize concentrations; Cmax/MIC or AUC/MIC
Time-dependent killing and minimal or no persistent effects
Beta-lactams Optimize duration of exposure; %T>MIC
Time-dependent killing and moderate to prolonged persistent effects
Macrolides, Azithromycin, Clindamycin, Tetracyclines, Glycylcyclines, Streptogramins, Glycopeptides, Oxazolidinones
Optimize amount of drug; AUC/MIC

Dose fractionation in the mouse models reliably defines the PK/PD
driver
How do we define the PK/PD target?
Dose Level

Nonlinear regression and Hill equation to estimate Emax (difference from untreated control), P50 (dose giving 50% of Emax) and slope (N) of the dose-response relationship
PK-PD Target Analysis
(Emax) DoseN DoseN + P50
N ∆CFU=
AUC/MIC0.1 1 10 100 1000 10000
Cha
nge
in L
og10
CFU
/Thi
ghov
er 2
4 H
ours
-4
-3
-2
-1
0
1
2
3
4
Strain 1Strain 2Strain 3
Static Dose
1 Log Kill
Emax
PK/PD Target Design
Introduce additional isolates, preferably with MIC variation
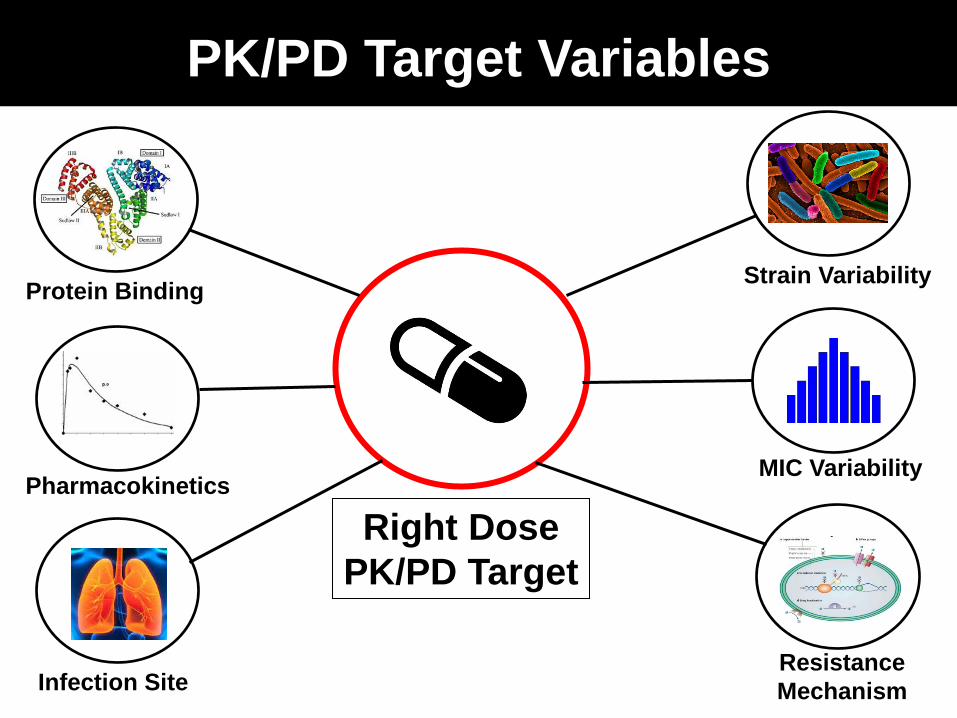
PK/PD Target Variables
Strain Variability
MIC Variability
Resistance Mechanism Infection Site
Pharmacokinetics
Protein Binding
Right Dose PK/PD Target
Time Above MIC (%)
0 10 20 30 40 50 60
Cha
nge
in L
og10
CFU
/Thi
gh
-6
-5
-4
-3
-2
-1
0
1
2
3
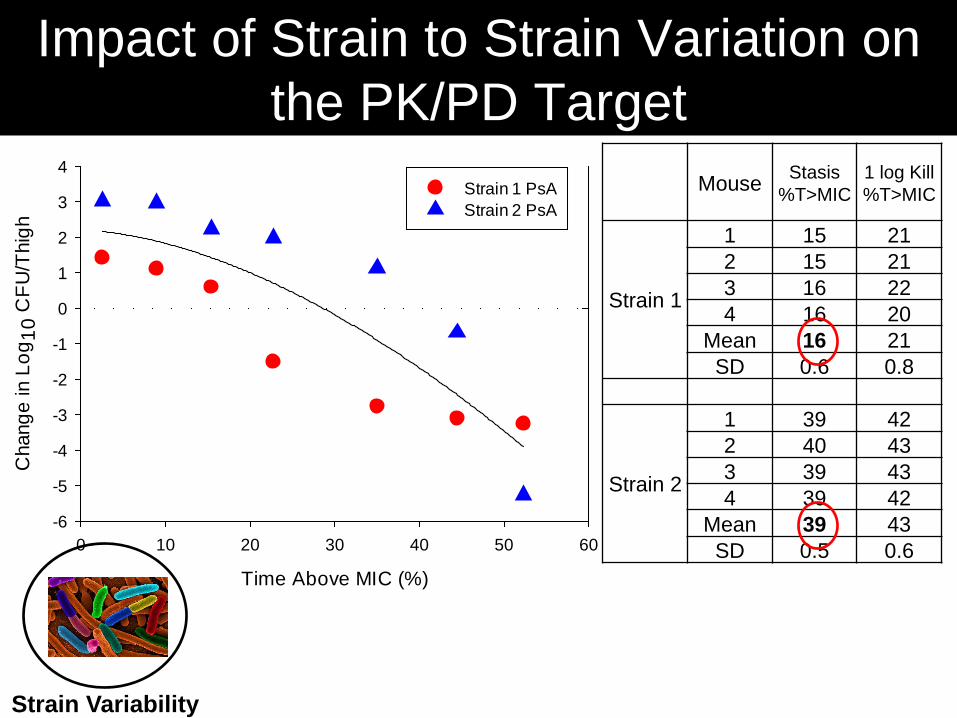
4Strain 1 PsAStrain 2 PsA
Mouse Stasis %T>MIC
1 log Kill %T>MIC
Strain 1
1 15 21 2 15 21 3 16 22 4 16 20
Mean 16 21 SD 0.6 0.8
Strain 2
1 39 42 2 40 43 3 39 43 4 39 42
Mean 39 43 SD 0.5 0.6
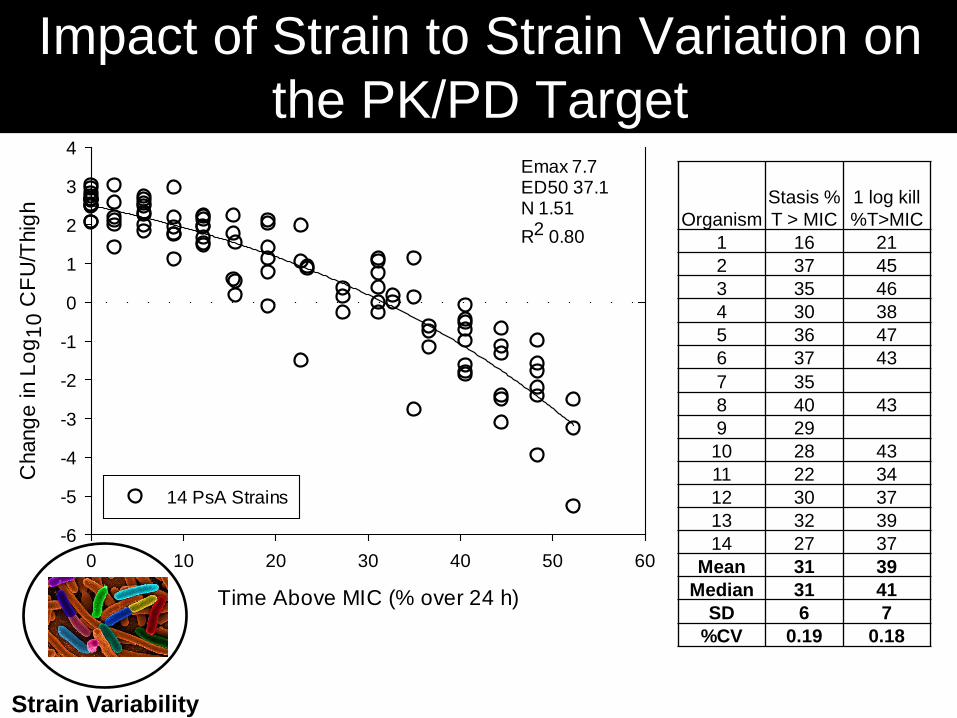
Impact of Strain to Strain Variation on the PK/PD Target
Strain Variability
Time Above MIC (% over 24 h)
0 10 20 30 40 50 60
Cha
nge
in L
og10
CFU
/Thi
gh
-6
-5
-4
-3
-2
-1
0
1
2
3
4
14 PsA Strains
Emax 7.7ED50 37.1N 1.51R2 0.80
Organism Stasis % T > MIC
1 log kill %T>MIC
1 16 21 2 37 45 3 35 46 4 30 38 5 36 47 6 37 43 7 35 8 40 43 9 29
10 28 43 11 22 34 12 30 37 13 32 39 14 27 37
Mean 31 39 Median 31 41
SD 6 7 %CV 0.19 0.18
Impact of Strain to Strain Variation on the PK/PD Target
Strain Variability
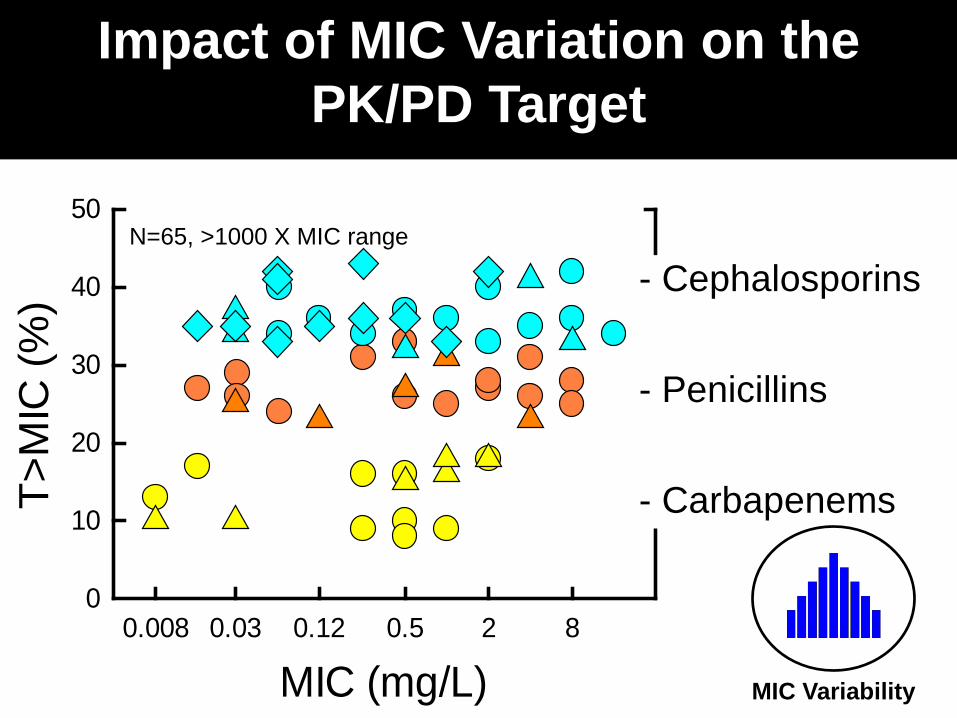
Impact of MIC Variation on the PK/PD Target
MIC (mg/L)0.008 0.03 0.12 0.5 2 8
T>M
IC (%
)
0
10
20
30
40
50
- Cephalosporins - Penicillins - Carbapenems
MIC Variability
N=65, >1000 X MIC range
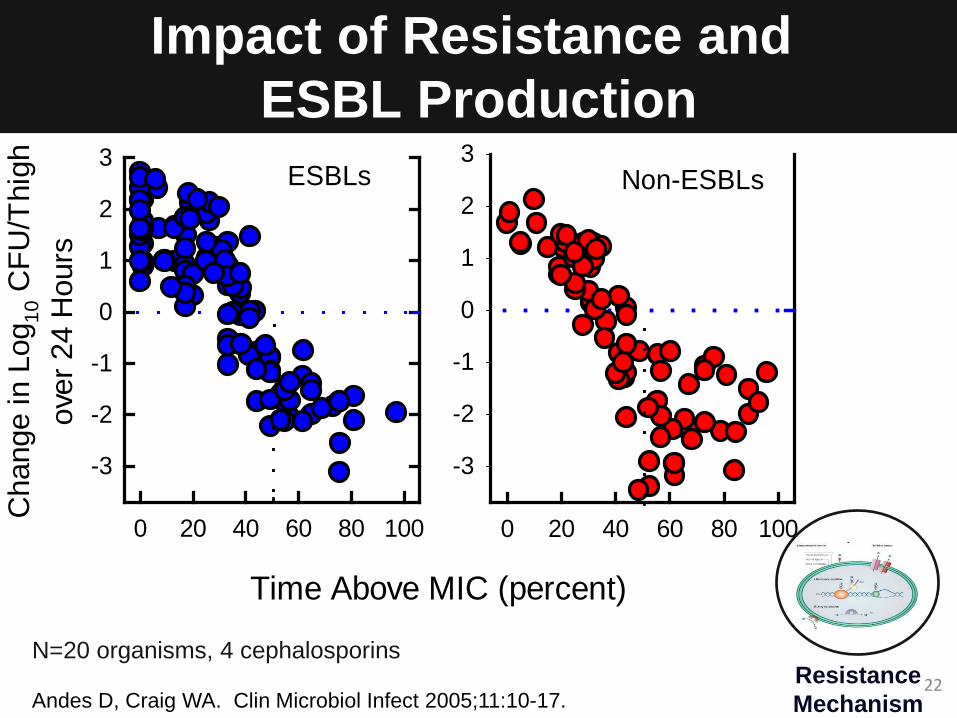
Impact of Resistance and ESBL Production
Time Above MIC (percent)
0 20 40 60 80 100
Cha
nge
in L
og10
CFU
/Thi
ghov
er 2
4 H
ours
-3
-2
-1
0
1
2
3
0 20 40 60 80 100
-3
-2
-1
0
1
2
3ESBLs Non-ESBLs
Andes D, Craig WA. Clin Microbiol Infect 2005;11:10-17. 22 Resistance
Mechanism
N=20 organisms, 4 cephalosporins
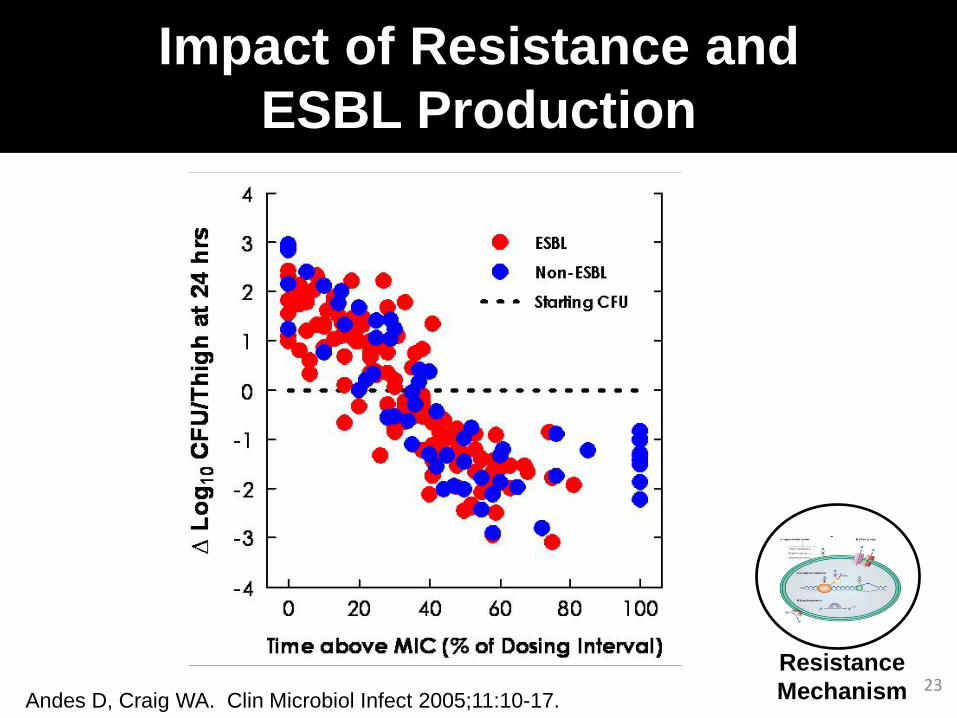
MIC indexed to drug exposure predicts response
23
Impact of Resistance and ESBL Production
Resistance Mechanism Andes D, Craig WA. Clin Microbiol Infect 2005;11:10-17.

Impact of Protein Binding
Andes & Craig 40th and 41st ICAAC, 2000 and 2001
23% 30% 50%
67% 78%
25% 25%
Protein Binding

Impact of Infection Site
Lepak AAC 2012;56:5916 Louie AAC 2011;55:3453
Stasis 1 Log Kill
Tede
zolid
fAU
C/M
IC
0
20
40
60
80LungThigh
Mouse ELF:Blood Penetration > 10
Oxazolidinone and MRSA
Infection Site
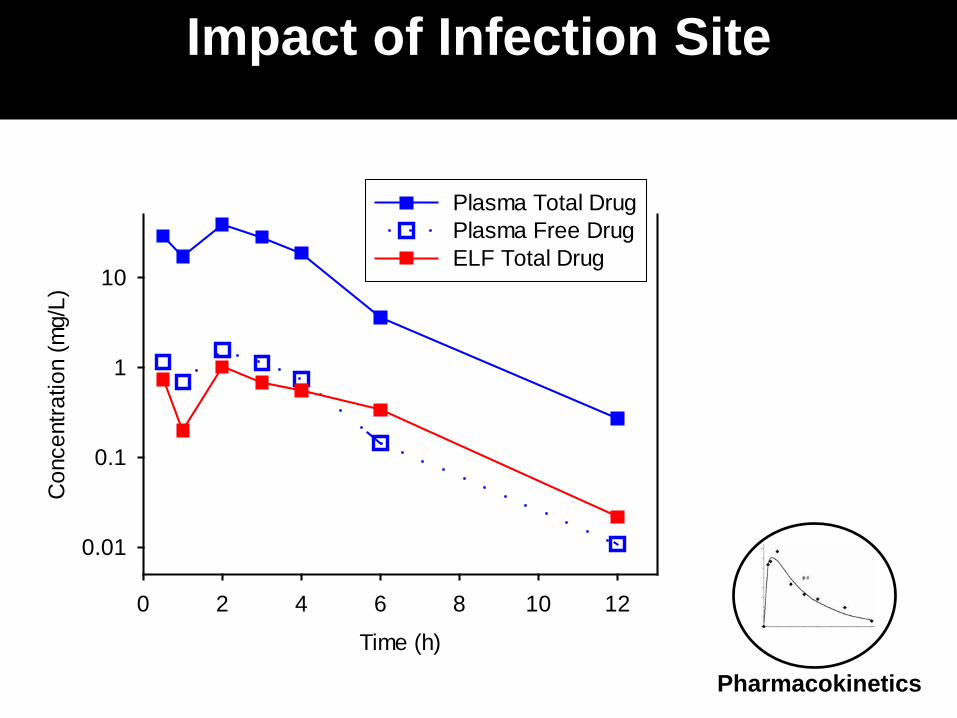
Time (h)
0 2 4 6 8 10 12
Con
cent
ratio
n (m
g/L)
0.01
0.1
1
10
Plasma Total DrugPlasma Free DrugELF Total Drug
Pharmacokinetics
Impact of Infection Site
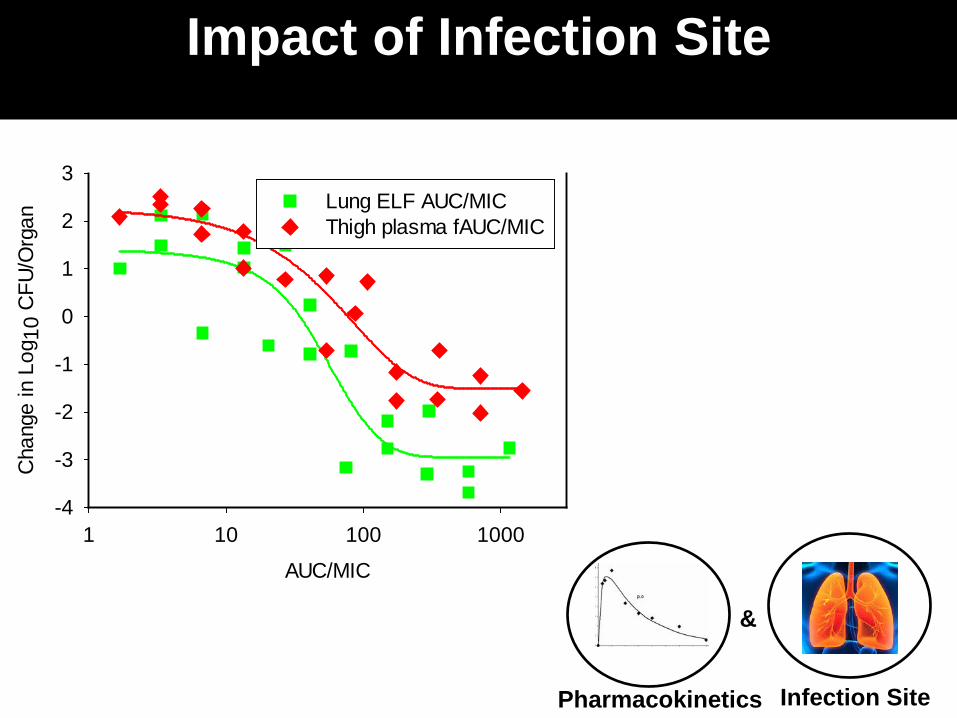
Impact of Infection Site
AUC/MIC
1 10 100 1000
Cha
nge
in L
og10
CFU
/Org
an
-4
-3
-2
-1
0
1
2
3Lung ELF AUC/MICThigh plasma fAUC/MIC
Infection Site Pharmacokinetics
&
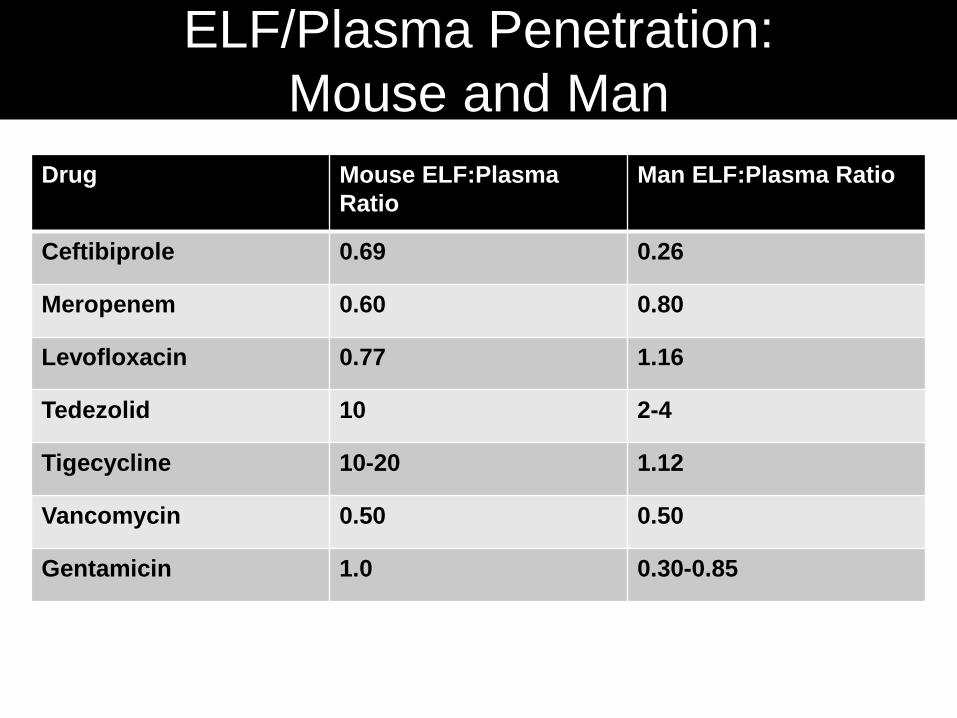
ELF/Plasma Penetration: Mouse and Man
Drug Mouse ELF:Plasma Ratio
Man ELF:Plasma Ratio
Ceftibiprole 0.69 0.26
Meropenem 0.60 0.80
Levofloxacin 0.77 1.16
Tedezolid 10 2-4
Tigecycline 10-20 1.12
Vancomycin 0.50 0.50
Gentamicin 1.0 0.30-0.85
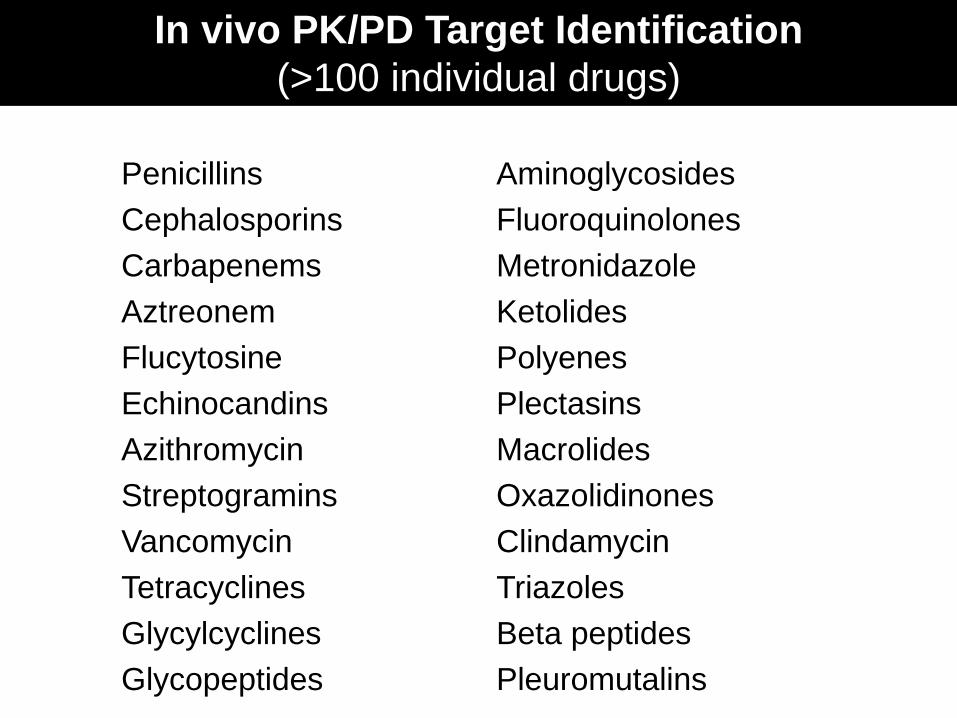
In vivo PK/PD Target Identification (>100 individual drugs)
Penicillins Aminoglycosides Cephalosporins Fluoroquinolones Carbapenems Metronidazole Aztreonem Ketolides Flucytosine Polyenes Echinocandins Plectasins Azithromycin Macrolides Streptogramins Oxazolidinones Vancomycin Clindamycin Tetracyclines Triazoles Glycylcyclines Beta peptides Glycopeptides Pleuromutalins

Mouse models can define the PK/PD target, but there are important variables
to consider
Let’s put this pre-clinical PK-PD in context with
clinical efficacy

Despite: • Different doses (mg/kg) • Faster half-life in small animals BUT: • Drug target is in the organism and NOT the host • Exposure relative to MIC is the determinant
Why Does This Work?
PK-PD INFECTION MODELS Do They Forecast Regulatory Approval?
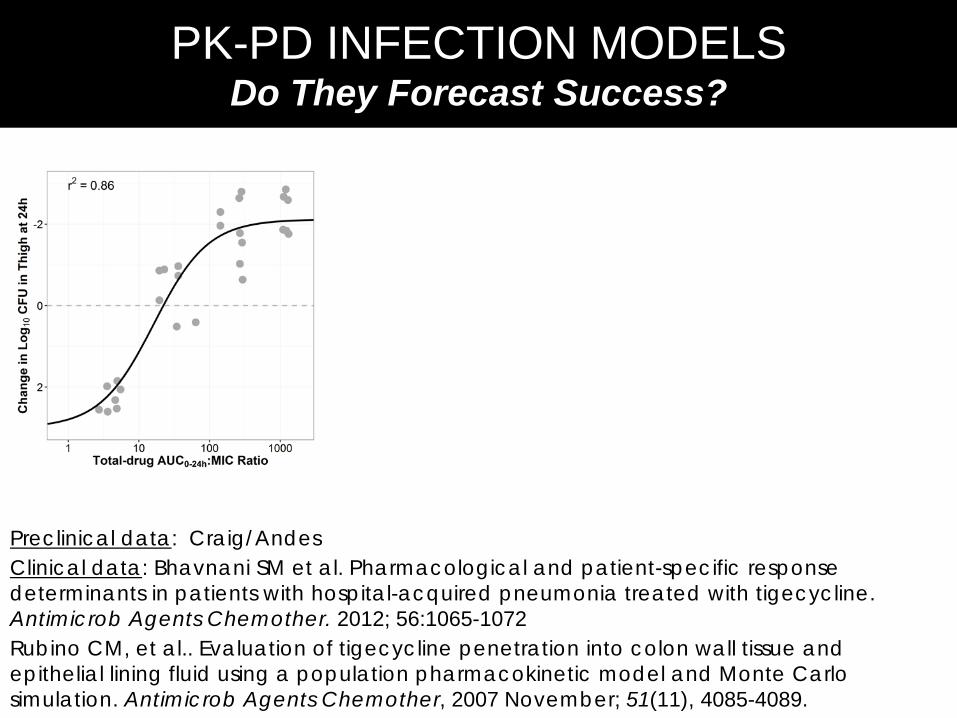
PK-PD INFECTION MODELS Do They Forecast Success?
Preclinical data: Craig/Andes Clinical data: Bhavnani SM et al. Pharmacological and patient-specific response determinants in patients with hospital-acquired pneumonia treated with tigecycline. Antimicrob Agents Chemother. 2012; 56:1065-1072 Rubino CM, et al.. Evaluation of tigecycline penetration into colon wall tissue and epithelial lining fluid using a population pharmacokinetic model and Monte Carlo simulation. Antimicrob Agents Chemother, 2007 November; 51(11), 4085-4089.

PK-PD INFECTION MODELS Do They Forecast Regulatory Approval?
PK-PD INFECTION MODELS Do They Forecast Success?
Preclinical data: Craig/Andes Clinical data: Bhavnani SM et al. Pharmacological and patient-specific response determinants in patients with hospital-acquired pneumonia treated with tigecycline. Antimicrob Agents Chemother. 2012; 56:1065-1072 Rubino CM, et al.. Evaluation of tigecycline penetration into colon wall tissue and epithelial lining fluid using a population pharmacokinetic model and Monte Carlo simulation. Antimicrob Agents Chemother, 2007 November; 51(11), 4085-4089.
From ICPD

PK-PD INFECTION MODELS Do They Forecast Regulatory Approval?
PK-PD INFECTION MODELS Do They Forecast Success?
Preclinical data: Louie A, et al. Impact of meropenem in combination with tobramycin in a murine model of Pseudomonas aeruginosa pneumonia. Antimicrob Agents Chemother. 2013 June; 57(6), 2788-2792. Surveillance data: EUCAST (2016).MIC distributions and ECOFFs. Clinical data: Mattioli F, et al. Population pharmacokinetics and probability of target attainment of meropenem in critically ill patients. European journal of clinical pharmacology, 2013;1-10. Lodise TP, et al. Penetration of meropenem into epithelial lining fluid of patients with ventilator-associated pneumonia. Antimicrob Agents Chemother. 2011 April; 55(4), 1606-1610.
From ICPD

PK-PD INFECTION MODELS Do They Forecast Success?
• Relationship between the regulatory approval and the probability of pre-clinical PK-PD target attainment o The study period was December 1996 through 2011
• Indications included community- and hospital-acquired pneumonia o For CAP, S. pneumoniae was the index pathogen o For HAP, the index pathogen was antibiotic spectrum dependent o 14 antibiotics that gained regulatory approval and 6 that failed to gain
approval
Moxifloxacin Televancin Teilithromycin Tigecycline Trovafloxacin
Cefditoren Ceftaroline Ceftobiprole Daptomycin
Gatifloxacin Gemifloxacin Levofloxacin Linezolid
Doripenem Ertapenem Faropenem Garenoxacin
From ICPD

PK-PD INFECTION MODELS Do They Forecast Regulatory Approval?
The Answer: Yes! The probability of regulatory approval increases with the probability of PK-PD target attainment
Note: PK-PD target was net-bacterial stasis in neutropenic mice for CAP agents and 1-2 log10 unit reduction in bacterial burden for HAP agents
PK-PD INFECTION MODELS Do They Forecast Success? From ICPD
Quartile Target Attainment
Median
% NDA Approval
(n/N)
1 0.62 40% (2/5)
2 0.85 60% (3/5)
3 0.94 80% (4/5)
4 0.985 100% (5/5)

But, A Mouse is Not a Human
• Host susceptibility – Difference in lung
anatomy – Different pattern
recognition receptors – Lower pulmonary WBC
and no defensins RESULT – Variable susceptibility to
human lung pathogens
• Pharmacokinetics – Penetration into AM
and ELF sometimes, but not often same as humans

Murine infection models can be used to forecast effective regimens
in patients

THANK YOU
MIC Time Above MIC
Peak:MIC AUC:MIC Ratio
Time
Serum Drug Concentration
“It all started with a mouse.” - Walt Disney